

U.S. Non-farm Employment Net Job Creation
Total non-seasonally adjusted, (NSA) nonfarm payroll employment increased by 313,000 in February and the December and January figures were revised higher, to 175,000 and 239,000 respectfully. A total of 148,177,000 people were employed in non-farm jobs as the unemployment rate held steady according to the U.S. Bureau of Labor Statistics, (BLS) report. Employment growth has averaged 276,000 per month for the first two month this year, much stronger than the average monthly gain of 161,000 for all of 2017.
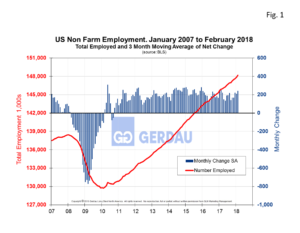 Figure 1 shows the history of the total number of U.S. workers employed in red on the left axis and the monthly change in blue on the right axis. Employment level reached a low point of 127.8 million (M), in February 2010. Since that time the economy has created 19.38M net jobs.
All major industry groups added to payrolls with the exception of information. Retail, which grew by 50,300 jobs was the big surprise after lackluster performance for much of the past year. Construction payrolls surged by 61,000, helped by good weather. Large gains were also seen in professional and business services, which added 50,000, and by government, which added 26,000 jobs.
The seasonally adjusted, (SA) U3 unemployment rate was 4.1% in February, down 0.8 percentage points year on year, (y/y). Strong labor force entry just about matched absorption, keeping the unemployment rate unchanged at 4.1%. The SA U6, (total unemployed, plus all persons marginally attached to the labor force, plus total employed part time for economic reasons, as a percent of the civilian labor force plus all persons marginally attached to the labor force) unemployment rate was 8.2%, down, 0.9 percentage points y/y.
The labor force participation rate increased by 0.3 percentage point to 63.0% in February but has shown little movement on net over the past 12 months. The employment-population ratio also increased by 0.3 percentage point over the month to 60.4%. This was the highest level since February 2009. Another market measure also showed significant improvement as the duration of unemployment declined to a cyclical low of just 9.3 weeks. An additional cyclical low was realized by those out of work for more than six months which fell to 20.7% of unemployed workers.
Figure 2 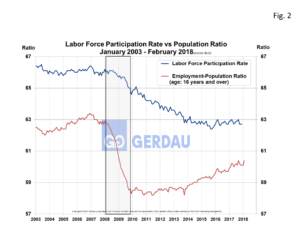 presents a chart on the employment to population ratio, (Labor Force Employed of working age/Total Population). This ratio plunged from the 62 to 63 range prior the recession to the 58 to 59 level in the 2010 to 2014 timeframe. It has been steadily climbing since then. The ratio is improving but remains well below the pre-recession level. Figure 2 also presents the labor force participation ratio (same scale). This ratio has been stubbornly flat in a tight range of 62.6 to 63.0 over the past two years.
The latest Job Openings and Labor Turnover Survey indicates a steady expansion within the labor market. Job openings remain abundant as there were 5.8M job openings. The job opening rate was 3.8%,
This month’s report is indicative a healthy labor market. Additional stimulus from the recent tax overhaul should keep the foot on the accelerator throughout the balance of the year and into 2019.
At Gerdau, we keep a keen eye on the employment numbers, especially manufacturing and construction since this is where most long product steel ends-up. In addition we know that growth in net job creation correlates to increased steel consumption.