Copyright
©The Author(s) 2023.
World J Clin Cases. Oct 26, 2023; 11(30): 7268-7276
Published online Oct 26, 2023. doi: 10.12998/wjcc.v11.i30.7268
Published online Oct 26, 2023. doi: 10.12998/wjcc.v11.i30.7268
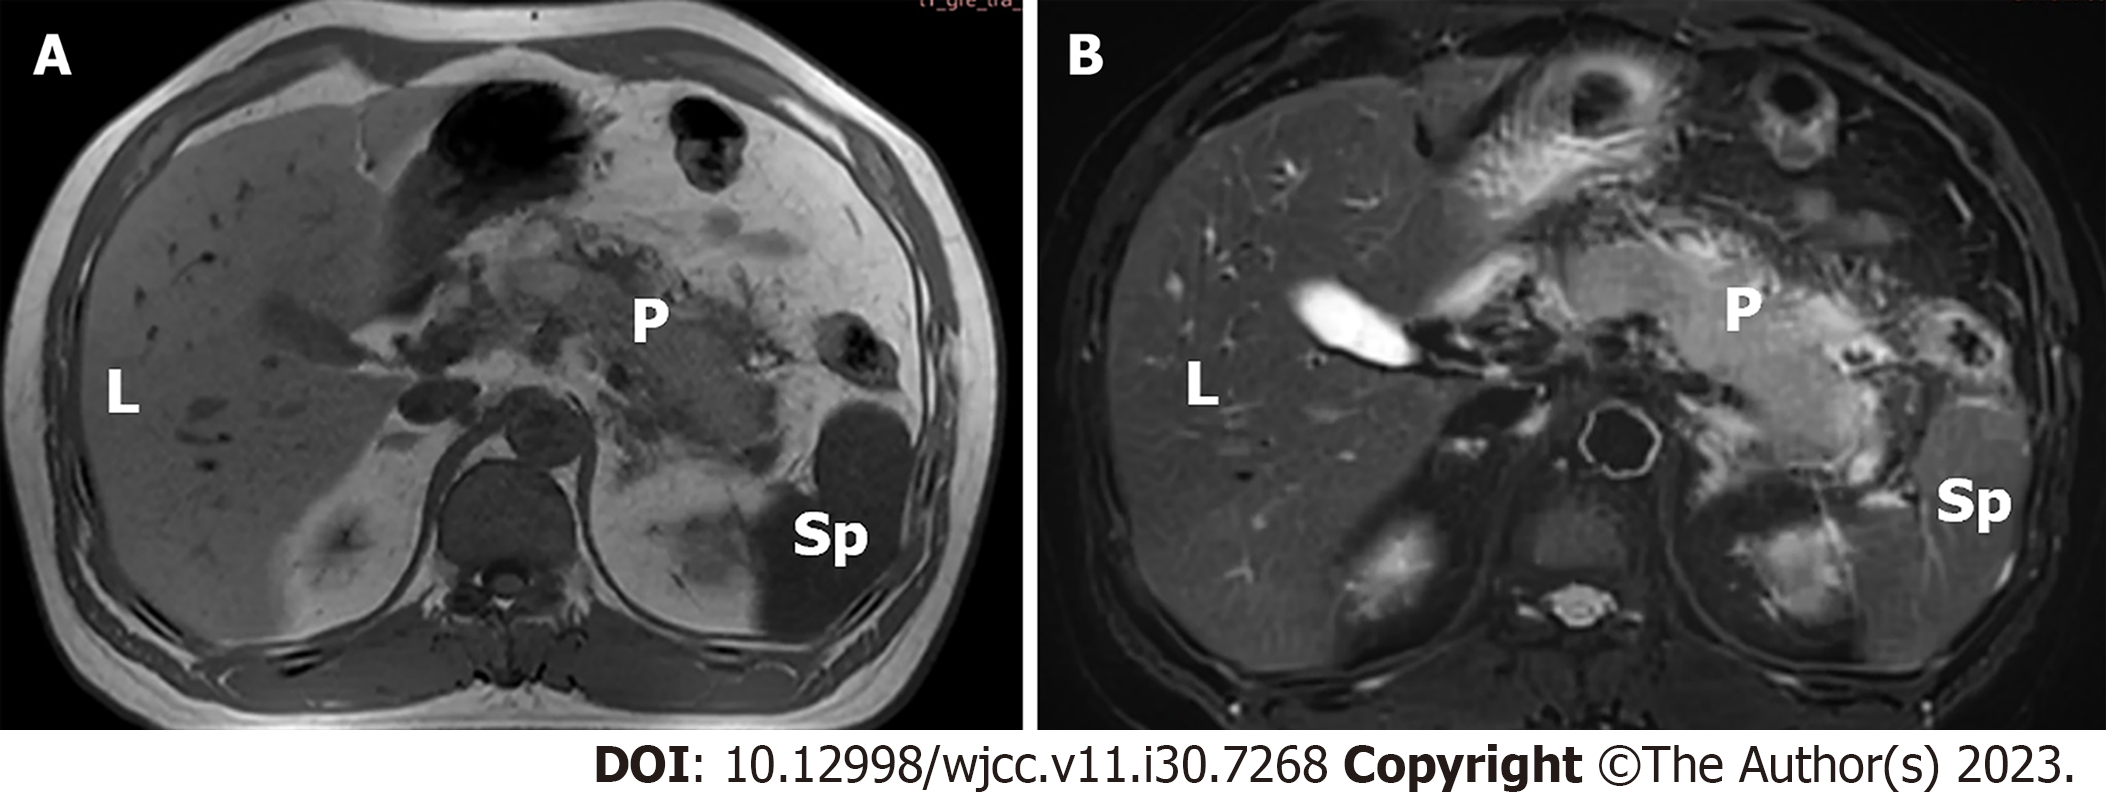
Figure 1 A 45-year-old man with type 2 diabetes mellitus with mild acute pancreatitis whose random blood glucose level was 10.
1 mmol/L. A: Axial T1-weighted image shows pancreatic swelling, and the signal is reduced; B: Axial T2-weighted image with fat suppression shows diffuse hyperintensity around the pancreas. L: Liver; P: Pancreas; Sp: Spleen.
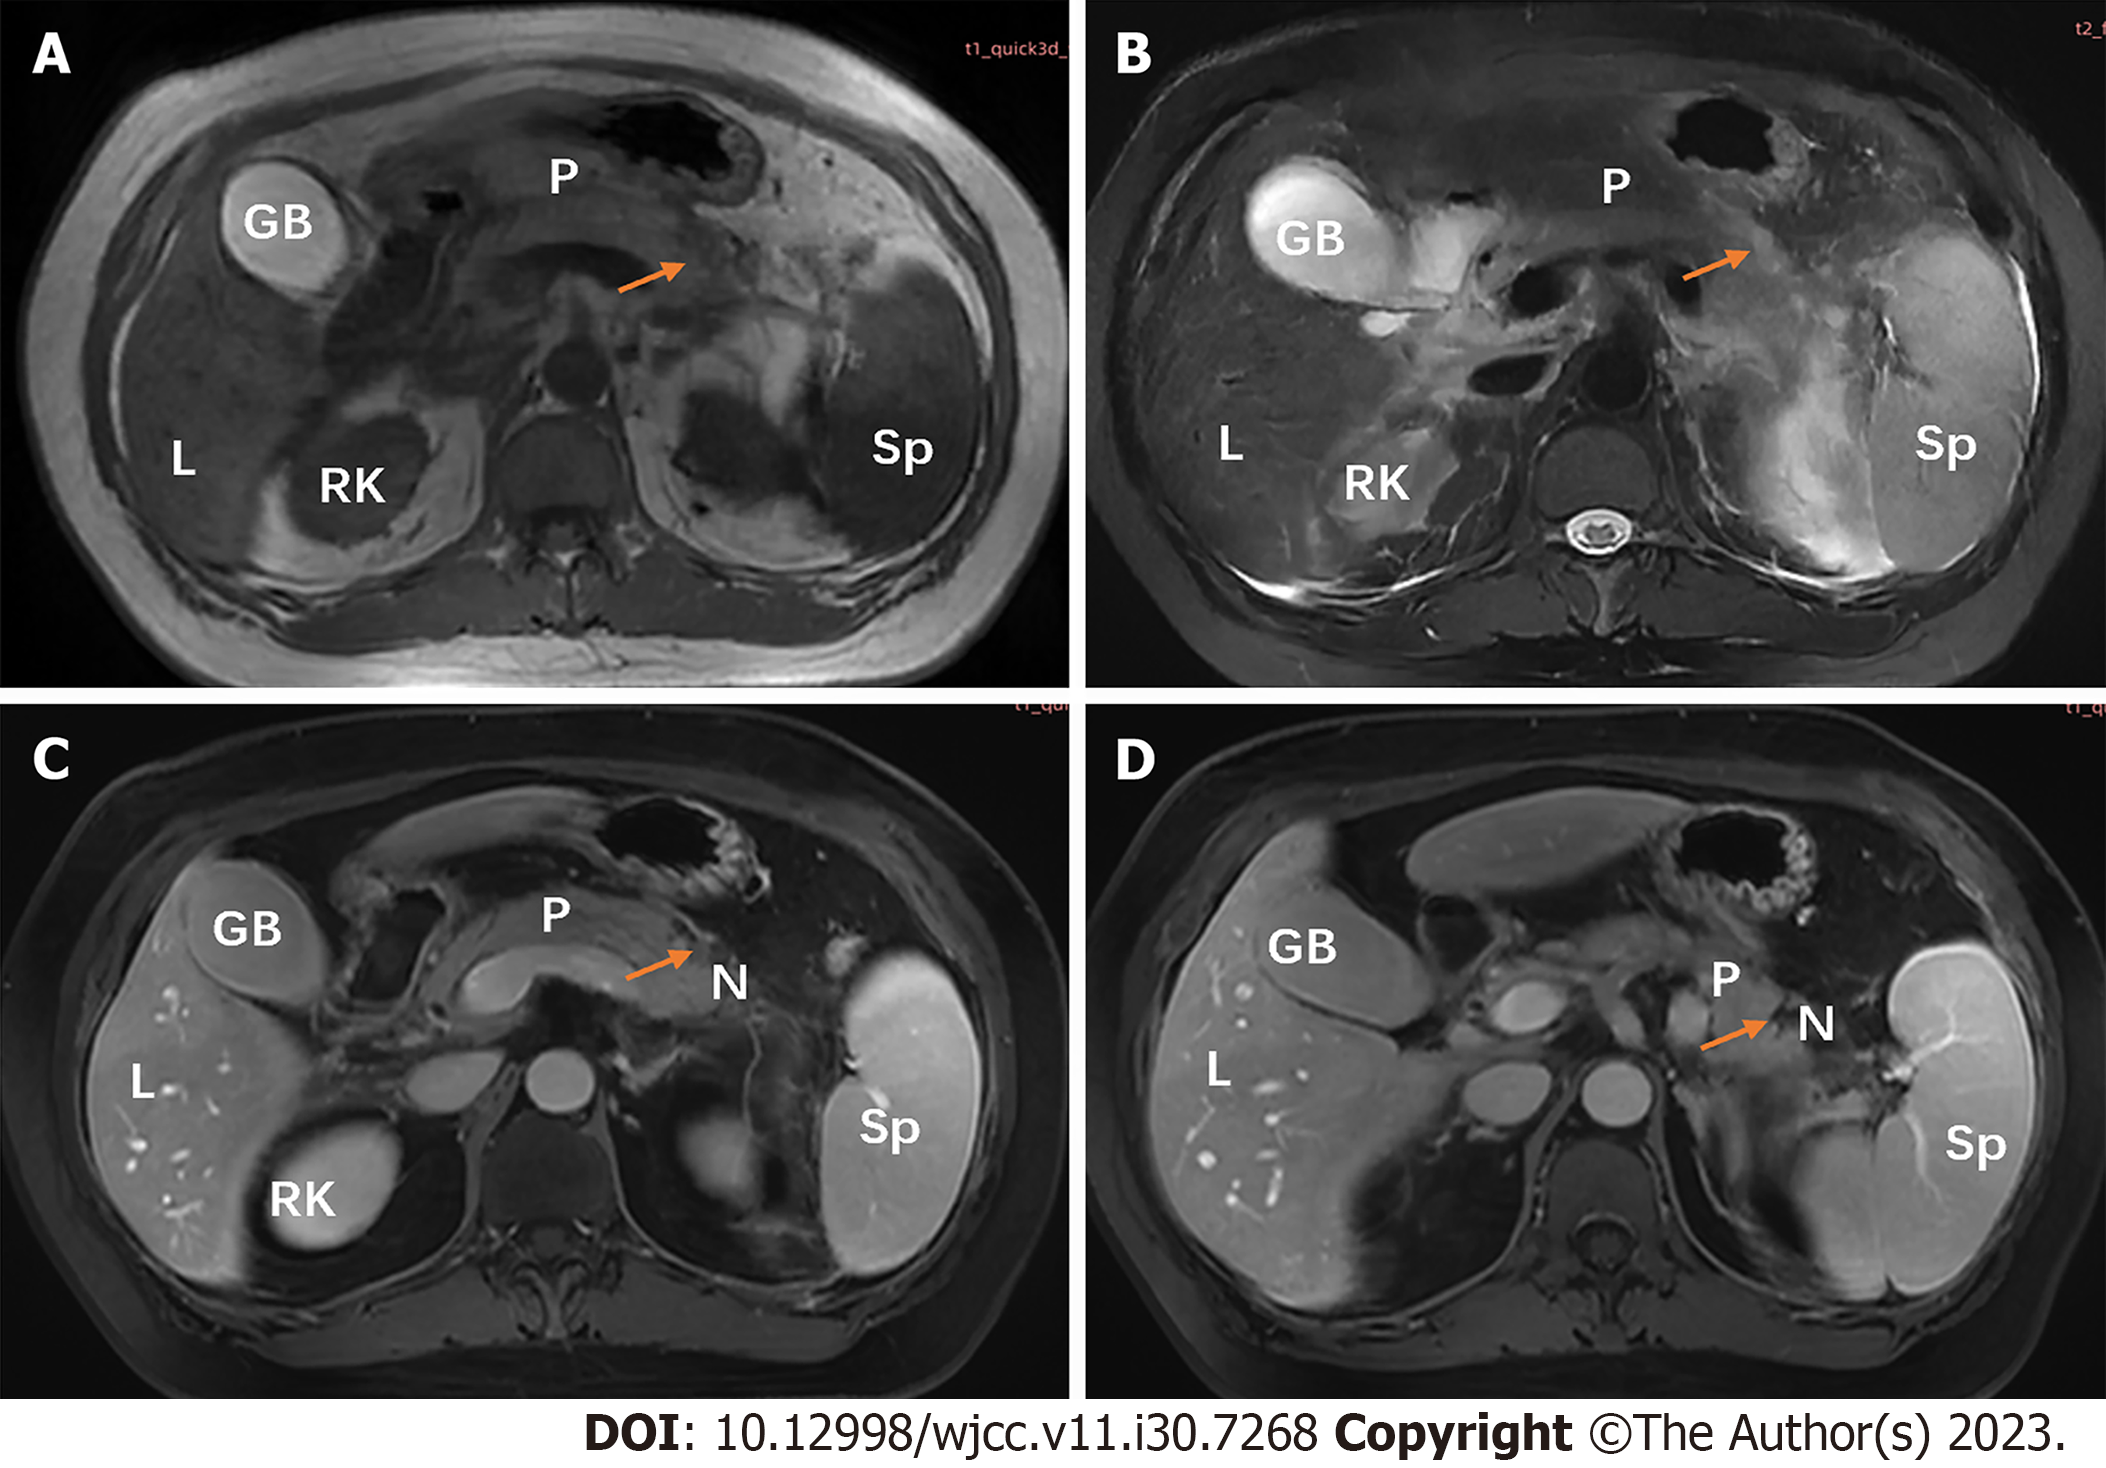
Figure 2 A 45-year-old woman diagnosed with type 2 diabetes mellitus for 6 years with severe acute pancreatitis, whose random blood glucose level was 19.
19 mmol/L. A: Axial T1-weighted image shows local hypointense area (arrow); B: Axial T2-weighted magnetic resonance (MR) image with fat suppression shows pancreatic swelling and patchy hyperintense area (arrow); C and D: Postcontrast venous phase images reveal nonenhancement necrotic areas (arrow) with < 30% parenchyma involvement in the body of the pancreas (MR severity index score of 6 points). GB: Gall bladder; L: Liver; N: Necrotic areas; P: Pancreas; RK: Right kidney; Sp: Spleen.
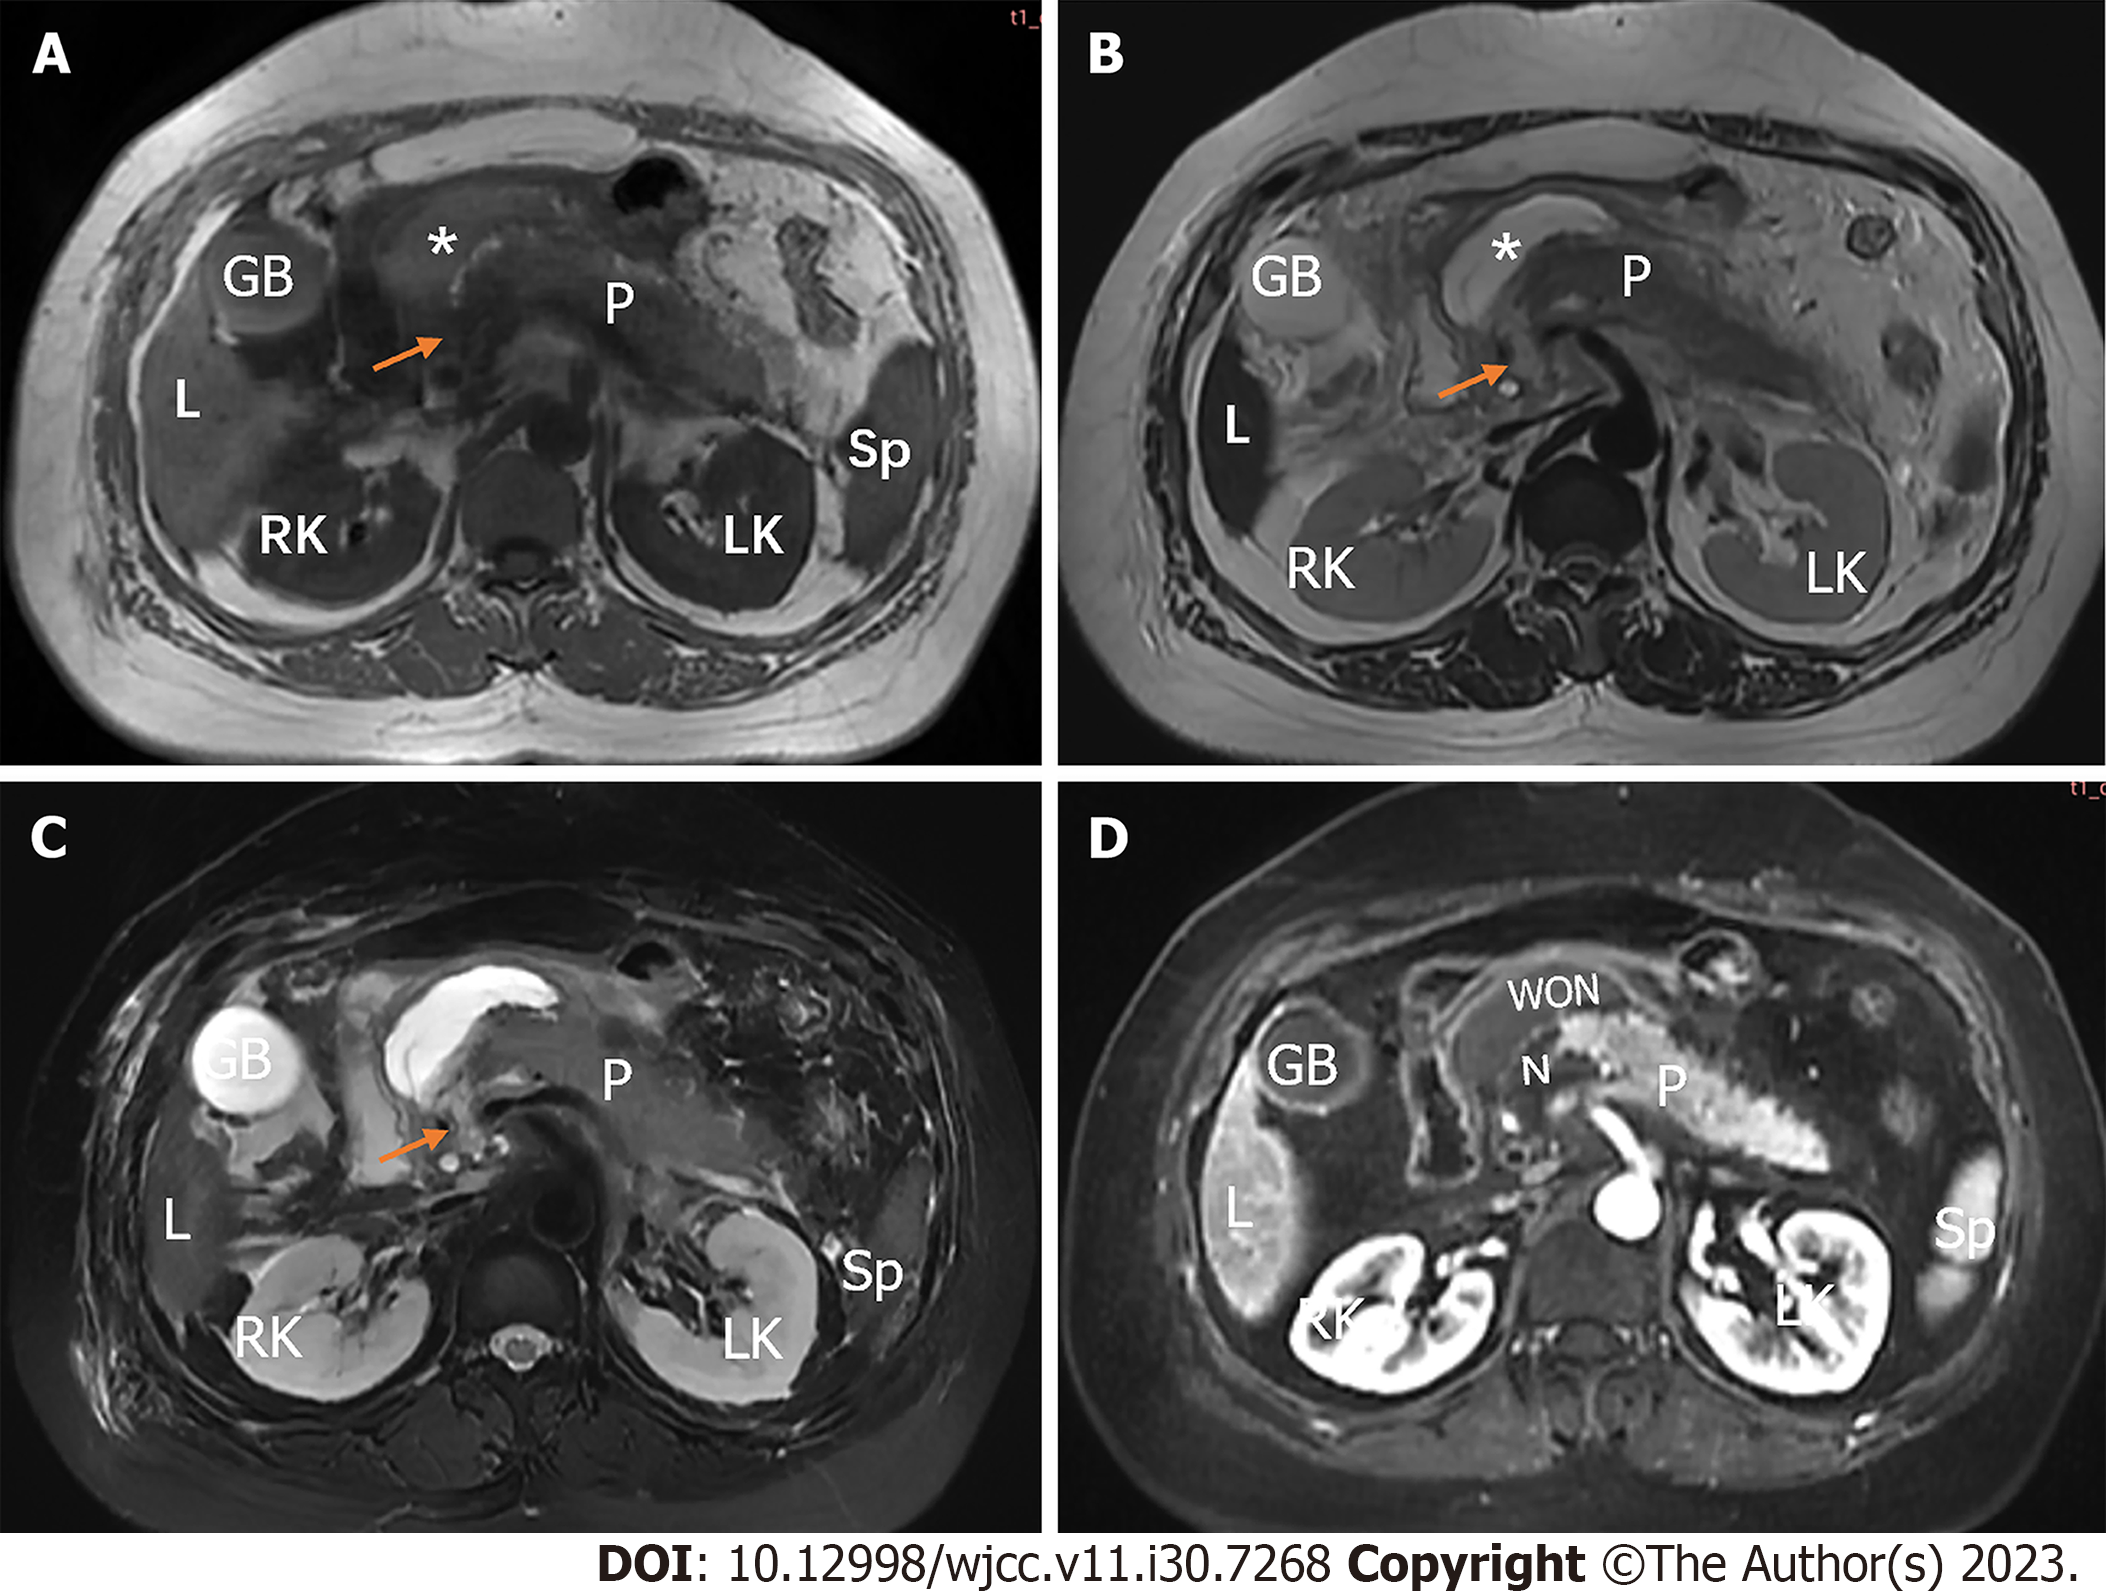
Figure 3 A 49-year-old woman with type 2 diabetes mellitus with severe acute pancreatitis whose average blood glucose level was 7.
67 mmol/L. A: Axial T1-weighted image shows local hypointensity (arrow) in the head and neck of the pancreas. Peripancreatic fluid collection (asterisk) exhibit slightly hyperintensity; B: Axial T2-weighted image with fat suppression shows local hyperintensity (arrow) in the head and neck of the pancreas. Peripancreatic fluid collection (asterisk) exhibits profound hyperintensity; C: Axial T2-weighted image with fat suppression shows pancreatic swelling and hyperintense areas (arrows), concomitant with acute necrotic collection restricted to omental bursa; D: Postcontrast arterial phase axial magnetic resonance (MR) image shows nonenhanced areas (N) compatible with parenchyma necrosis (30% to 50% parenchyma involvement) in the head and body of the pancreas (MR severity index score of 6 points). GB: Gall bladder; L: Liver; LK: Left kidney; N: Necrotic areas; P: Pancreas; RK: Right kidney; Sp: Spleen; WON: Walled-off necrosis.
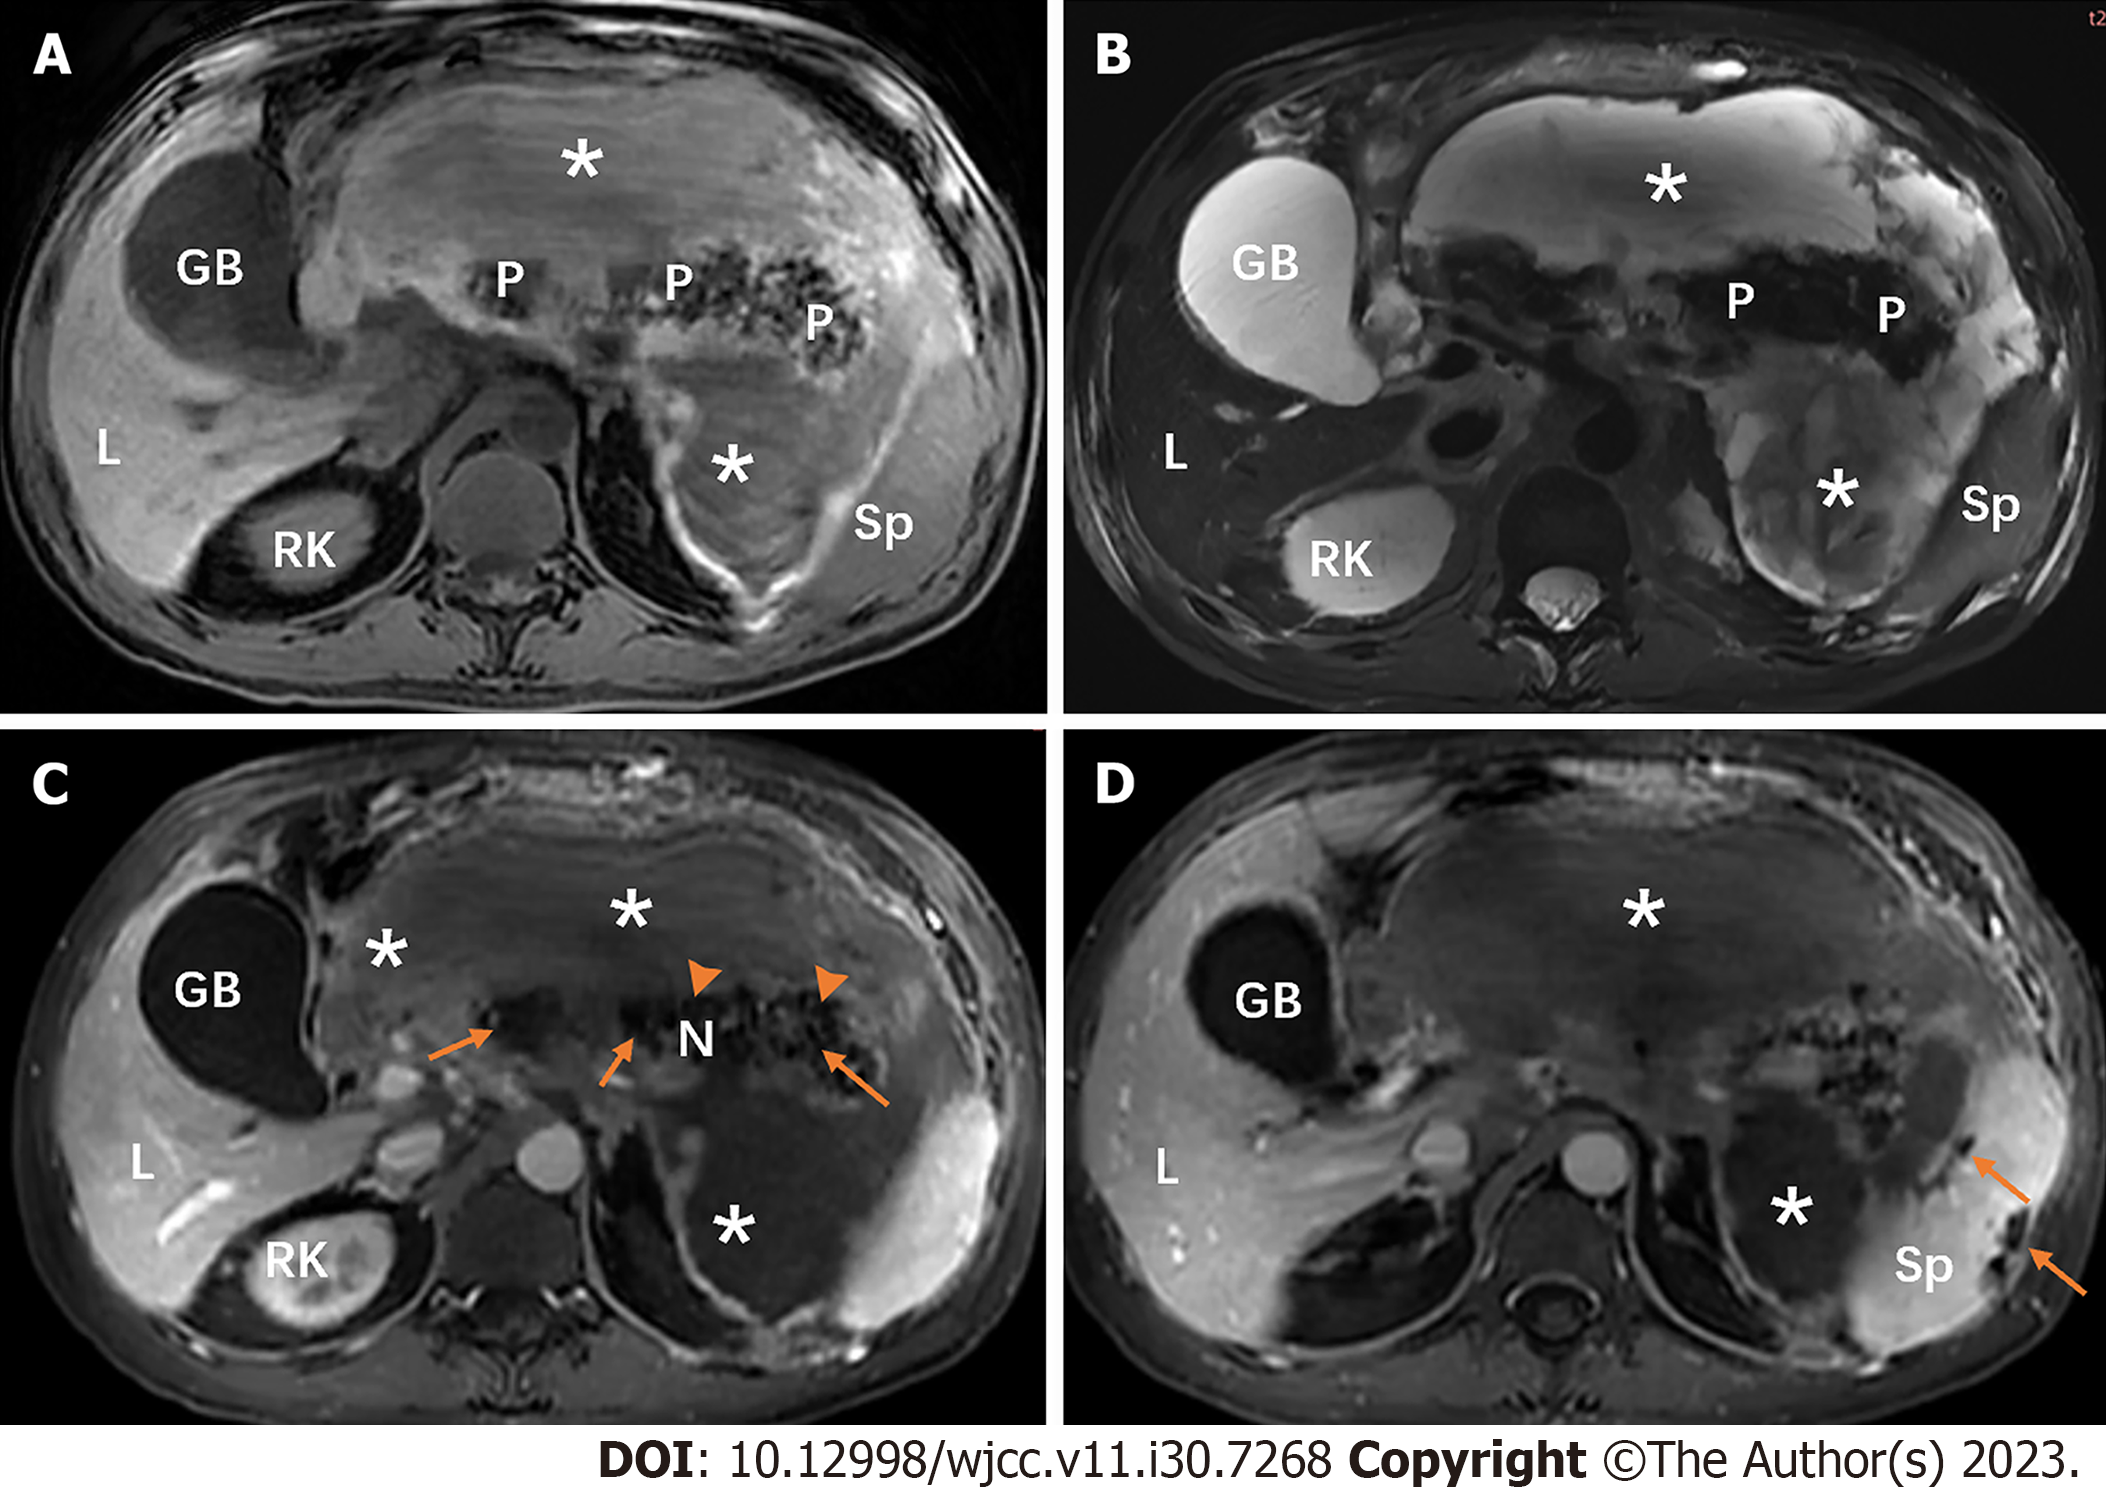
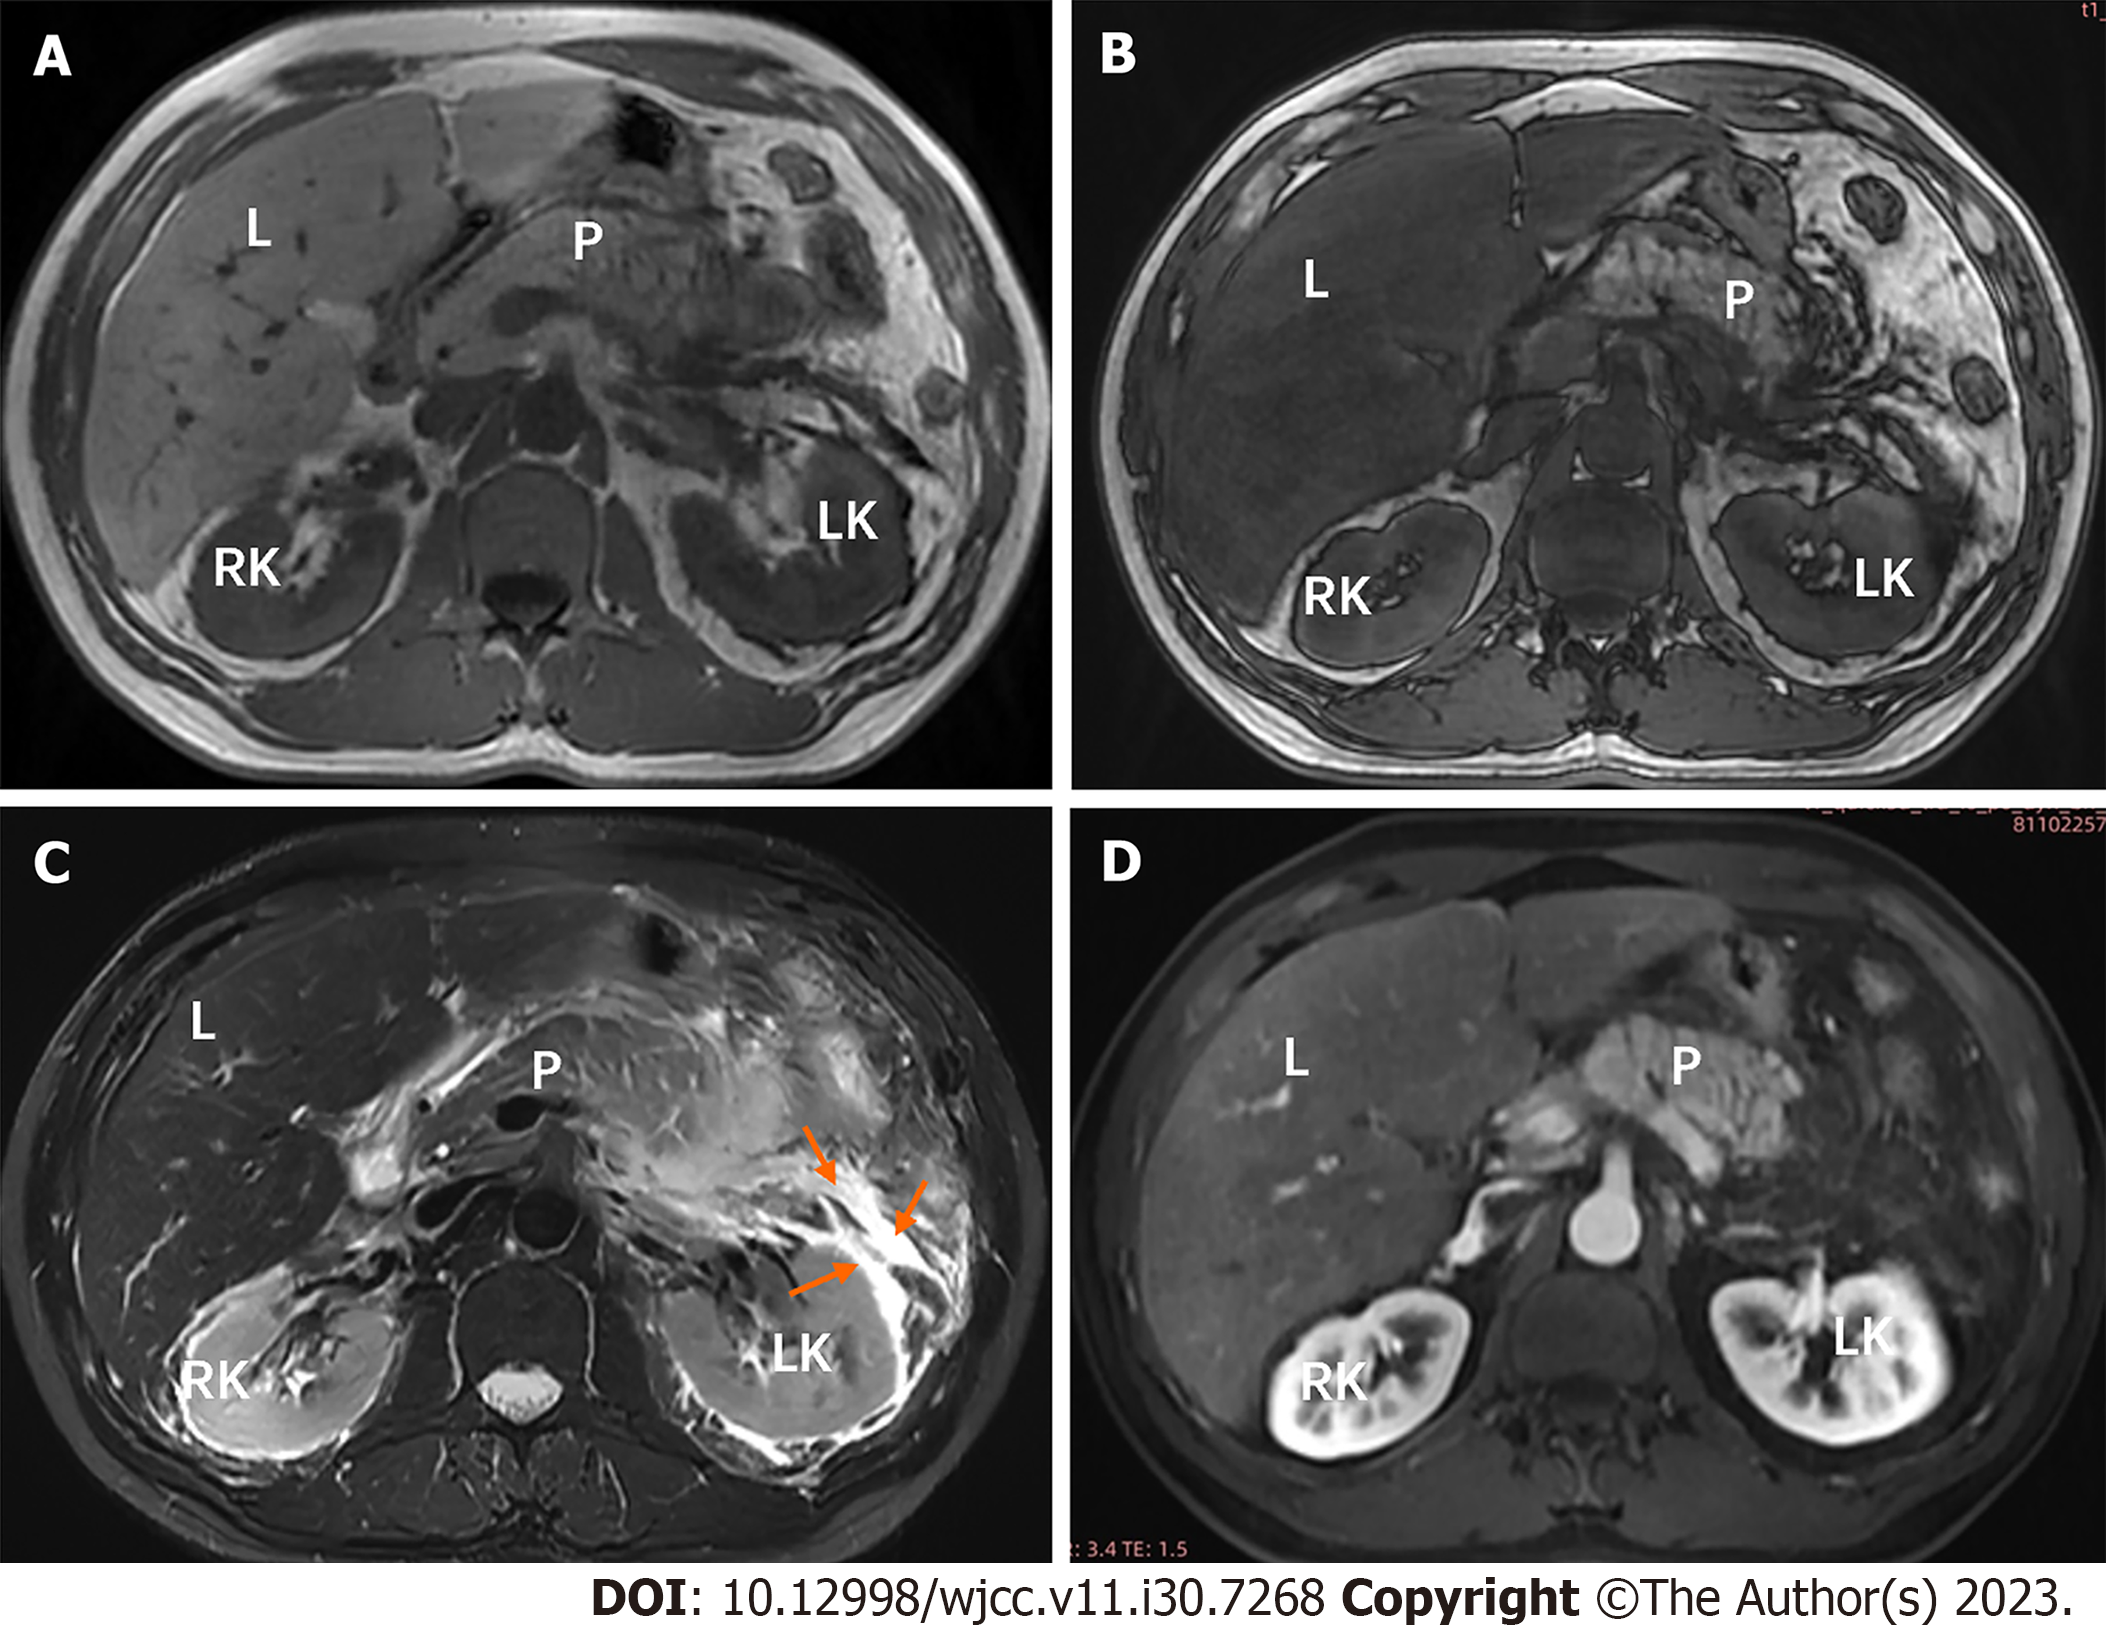
Figure 4 A 42-year-old man diagnosed with diabetes for 1 year with severe acute pancreatitis whose random blood glucose level was 19.
19 mmol/L. A and B: The pancreas is poorly defined, and it shows heterogeneous hypointensity on each sequences. Peripancreatic walled-off necrosis lesions (asterisks) are both hypointensity and hyperintensity, indicating the presence of peripancreatic fat necrosis and hemorrhage; C: Postcontrast venous phase axial magnetic resonance (MR) image shows nonenhanced areas (arrows) compatible with parenchyma necrosis (> 50% parenchyma involvement) in the head, body and tail of the pancreas (MR severity index score of 10 points); D: Postcontrast venous phase axial MR image shows nonenhanced areas (arrows) of spleen (splenic infarction), which indicates splenic artery invasion. GB: Gall bladder; L: Liver; N: Necrotic areas; P: Pancreas; RK: Right kidney; Sp: Spleen.
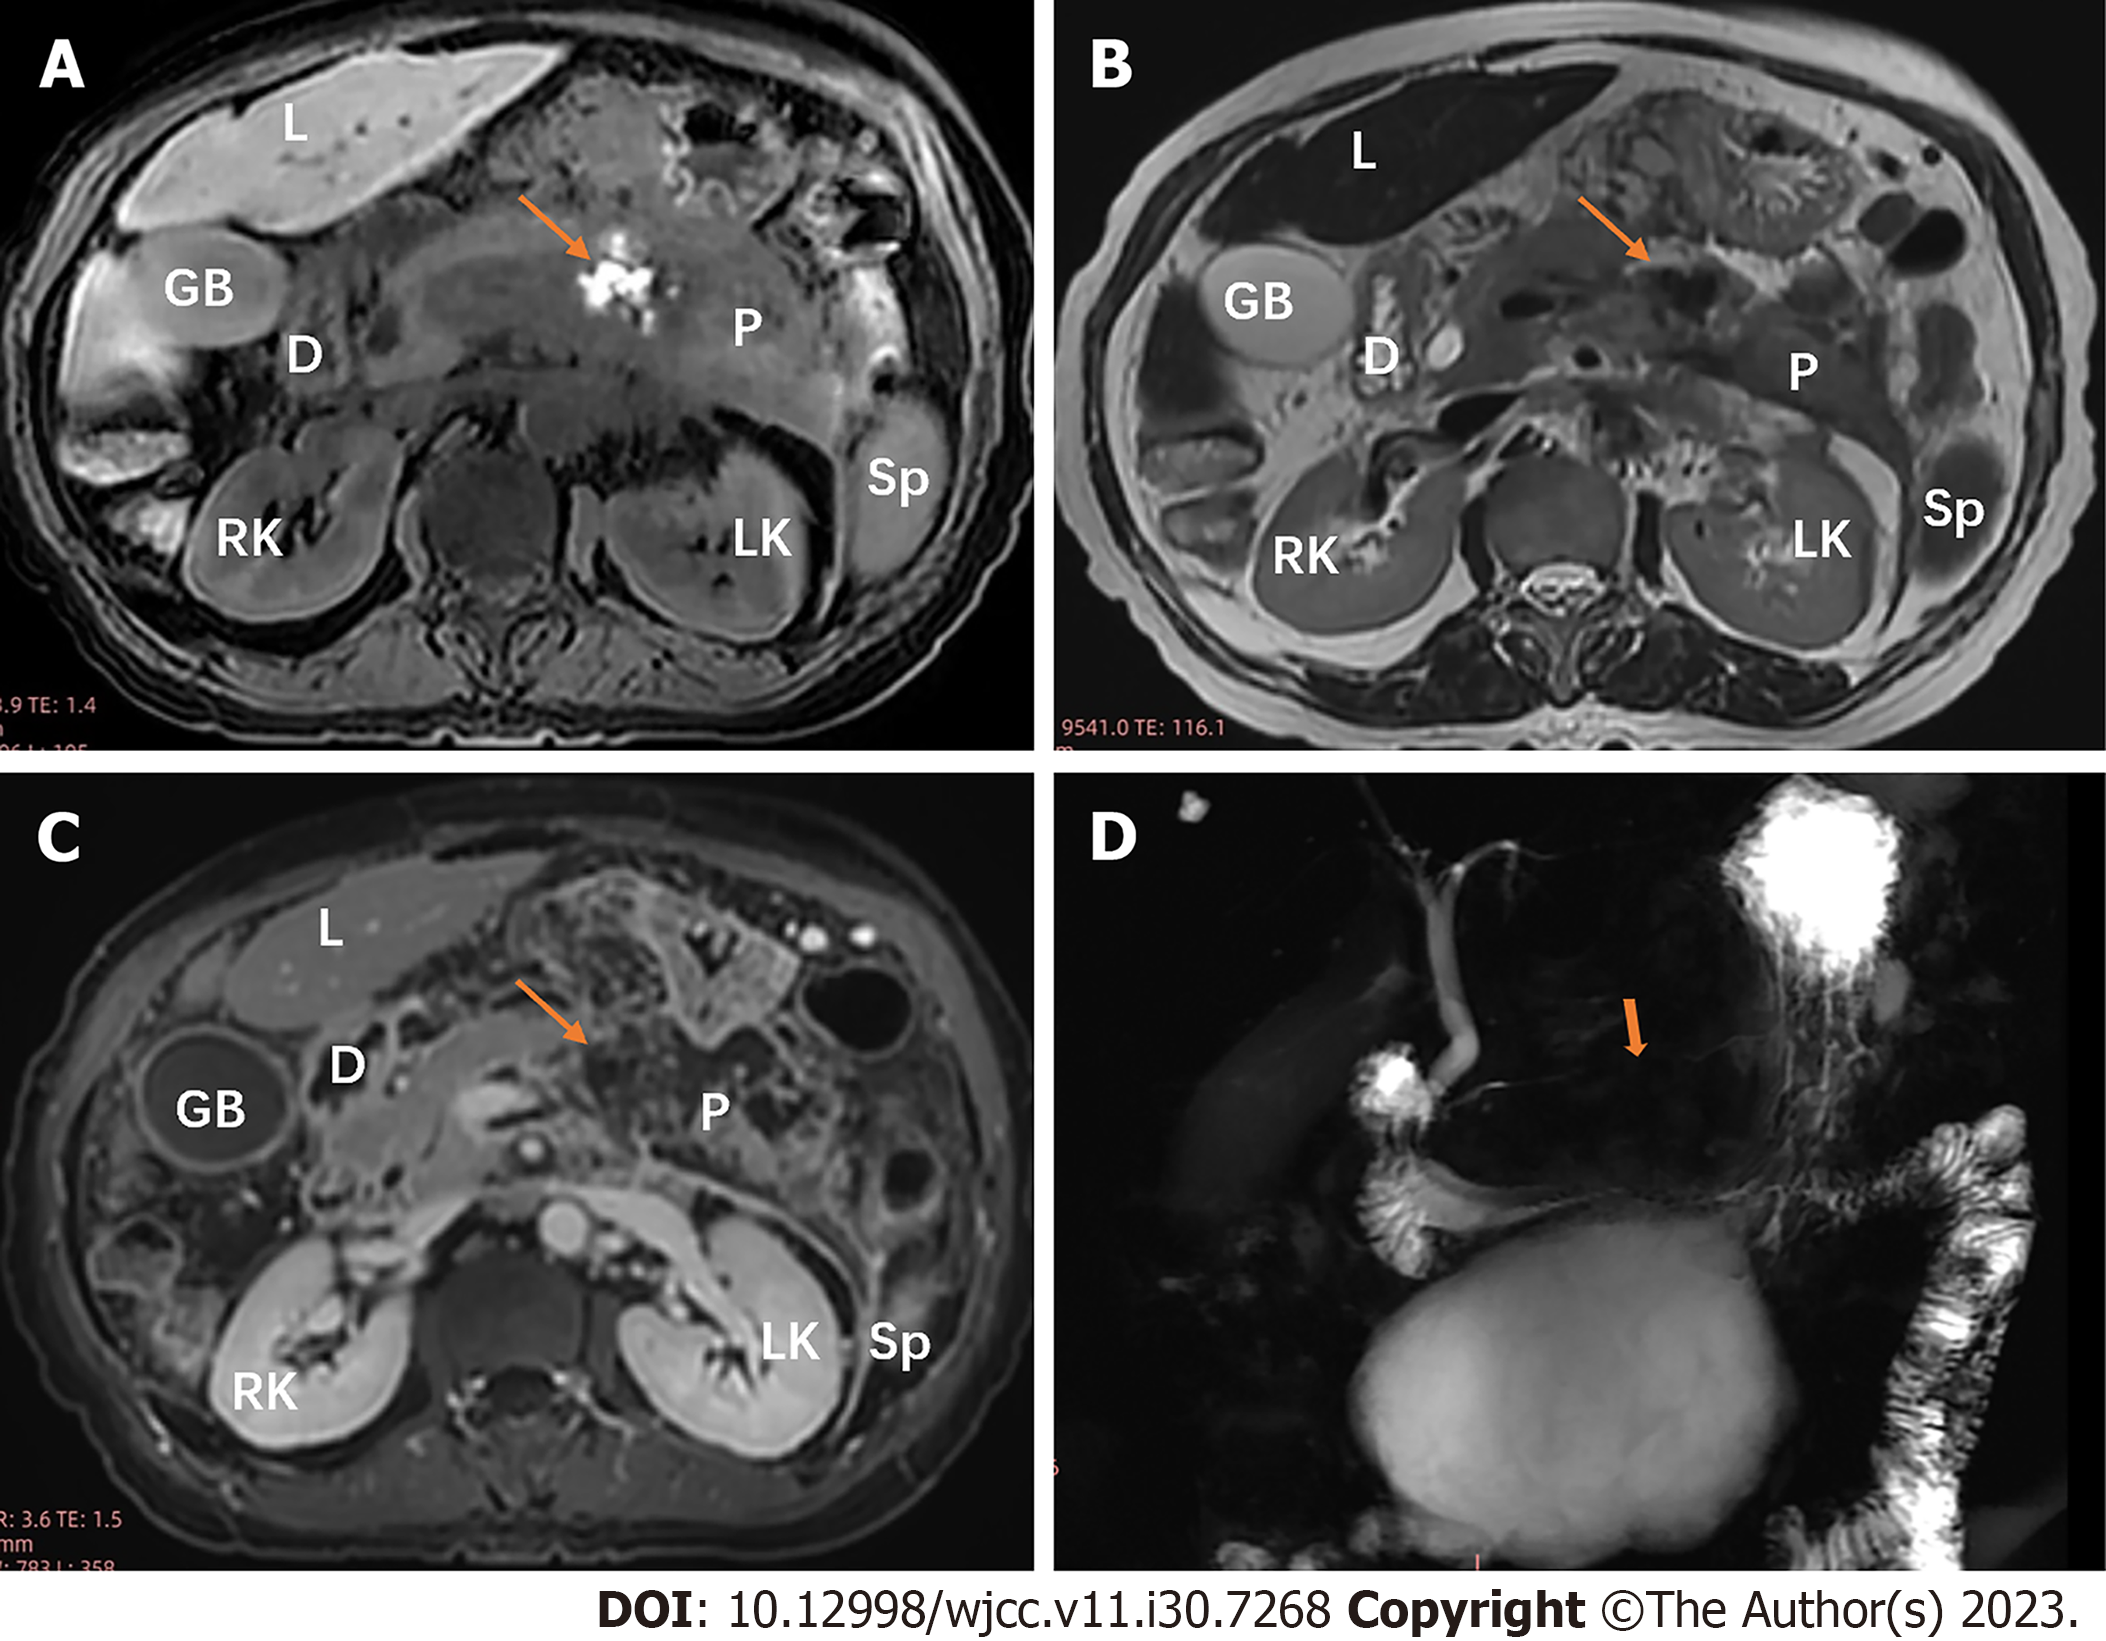
Figure 5 A 67-year-old woman with type 2 diabetes mellitus with moderately severe acute pancreatitis whose fasting blood glucose level was 7.
3 mmol/L. A: Axial T1-weighted image shows local hyperintensity (arrow) in the body of the pancreas; B: Axial T2-weighted image shows local hypointensity (arrow) in the body of the pancreas, indicating pancreatic hemorrhage; C: Postcontrast venous phase axial magnetic resonance (MR) image shows nonenhanced area (arrow) compatible with parenchyma necrosis (< 30% parenchyma involvement) in the body of the pancreas (MR severity index score of 6 points); D: Magnetic resonance cholangiopancreatography shows “disconnected pancreatic duct syndrome” in the body of pancreas. D: Duodenum; GB: Gall bladder; L: Liver; LK: Left kidney; P: Pancreas; RK: Right kidney; Sp: Spleen.
Figure 6 A 47-year-old man with type 2 diabetes mellitus with moderately severe acute pancreatitis whose average blood glucose level was 10.
05 mmol/L. A and B: Compared with the in-phase T1-weighted image (A), an unequivocal signal intensity loss in liver parenchyma is demonstrated on the out of phase T1-weighted image (B). In the left perirenal space and anterior pararenal space, acute peripancreatic fluid collections (arrows) is homogeneous hypointensity on T1-weighted image (A) and hyperintensity on T2-weighted image with fat suppression (B). L: Liver; LK: Left kidney; P: Pancreas; RK: Right kidney.
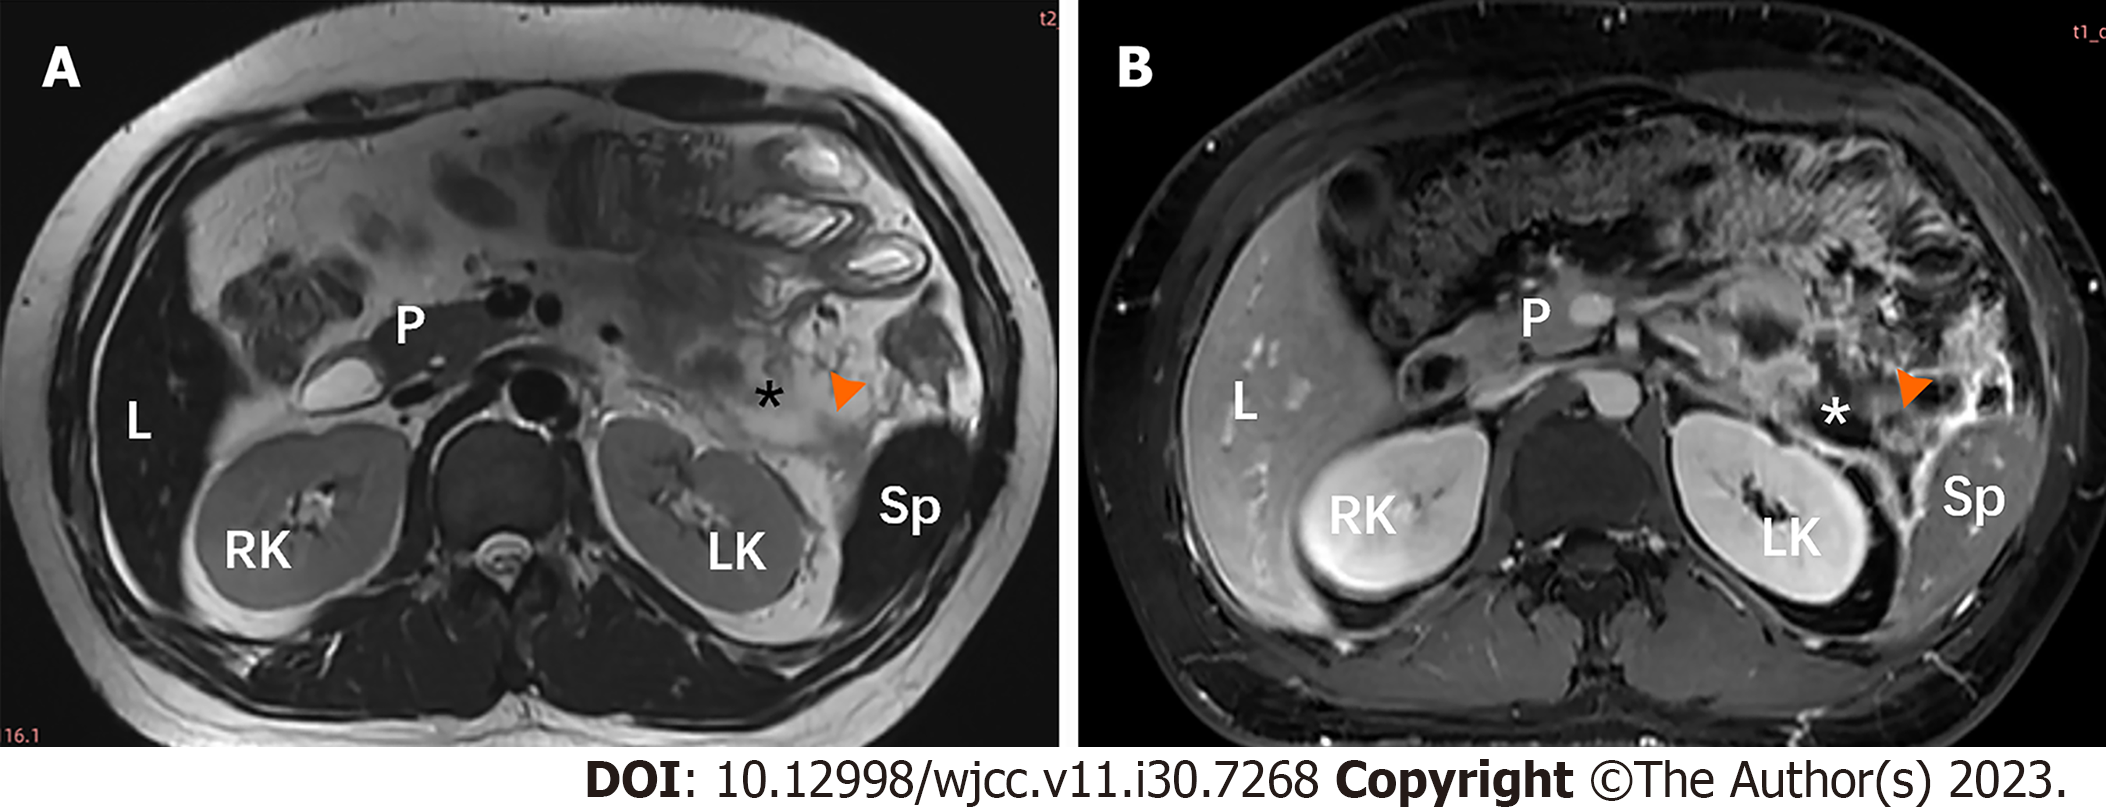
Figure 7 A 24-year-old man with type 2 diabetes mellitus with severe acute pancreatitis whose fasting blood glucose level was 23.
3 mmol/L. A and B: Peripancreatic acute necrotic collection (asterisk) is demonstrated as hyperintense areas on T2-weighted images, containing hypointense solid components (arrowhead). L: Liver; LK: Left kidney; P: Pancreas; RK: Right kidney; Sp: Spleen.
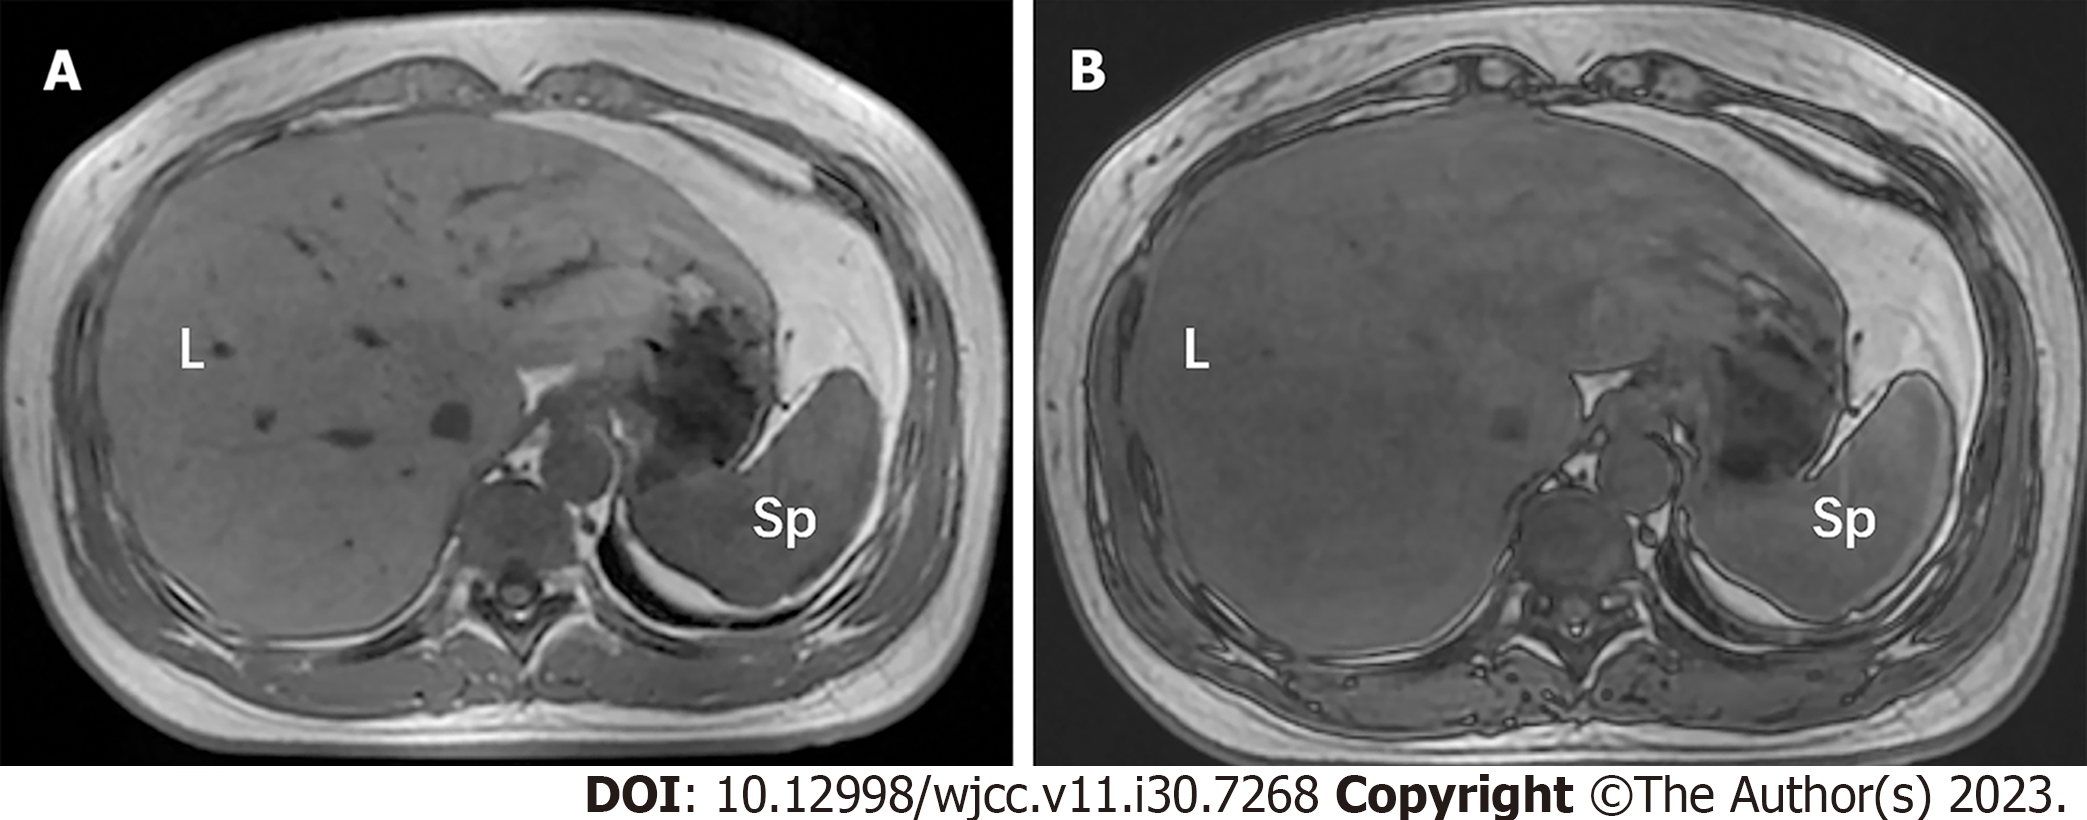
Figure 8 A 43-year-old woman with type 2 diabetes mellitus for 6 years with moderately severe acute pancreatitis whose average blood glucose level was 8.
50 mmol/L. A and B: Compared with the in-phase T1-weighted image (A), an unequivocal signal intensity loss in liver parenchyma was demonstrated on the out of phase T1-weighted image (B). L: Liver; Sp: Spleen.
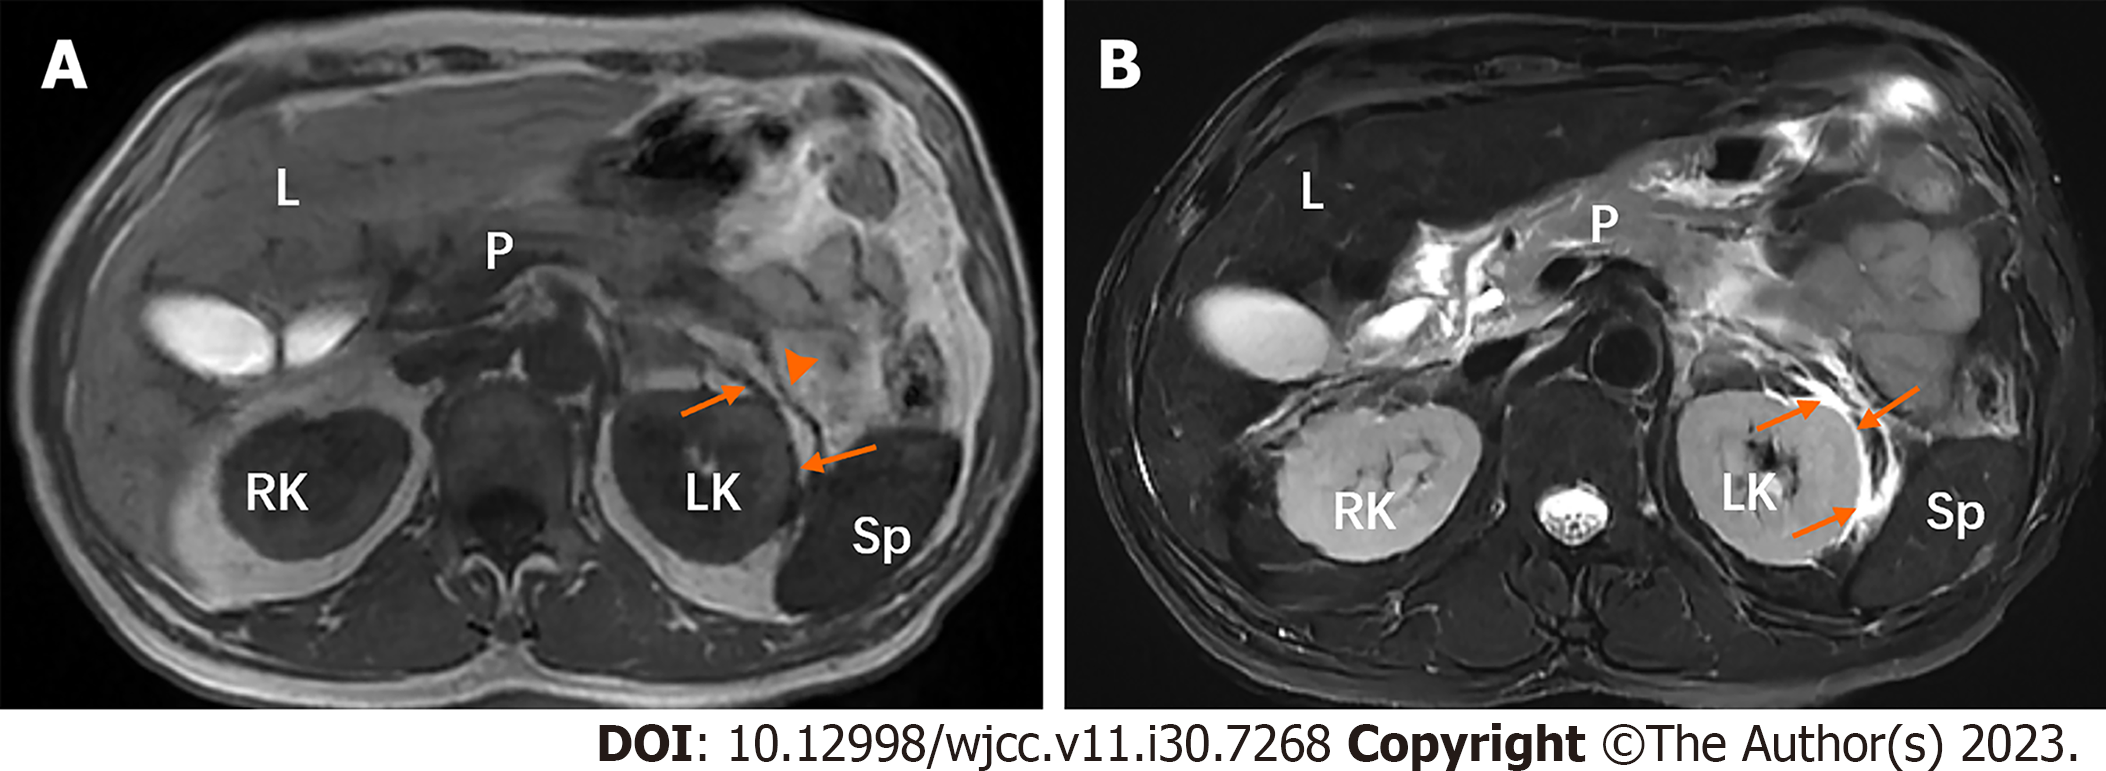
Figure 9 A 52-year-old man with type 2 diabetes mellitus over 10 years with moderately severe acute pancreatitis whose fasting blood glucose level was 15.
48 mmol/L. A and B: In the left perirenal space, there are strips (arrows) of hypointensity on T1-weighted image (A) and hyperintensity on T2-weighted image with fat suppression (B). T1-weighted image (A) also shows the thickened left renal fascia (arrowhead). L: Liver; LK: Left kidney; P: Pancreas; RK: Right kidney; Sp: Spleen.
- Citation: Ni YH, Song LJ, Xiao B. Magnetic resonance imaging for acute pancreatitis in type 2 diabetes patients. World J Clin Cases 2023; 11(30): 7268-7276
- URL: https://www.wjgnet.com/2307-8960/full/v11/i30/7268.htm
- DOI: https://dx.doi.org/10.12998/wjcc.v11.i30.7268


