Energy
How Does U.S. Electricity Generation Change Over One Week?
Subscribe to the Decarbonization Channel’s free mailing list for more like this
How Does U.S. Electricity Generation Change in a Week?
This was originally posted on the Decarbonization Channel. Subscribe to the free mailing list to be the first to see graphics related to decarbonization with a focus on the U.S. energy sector.
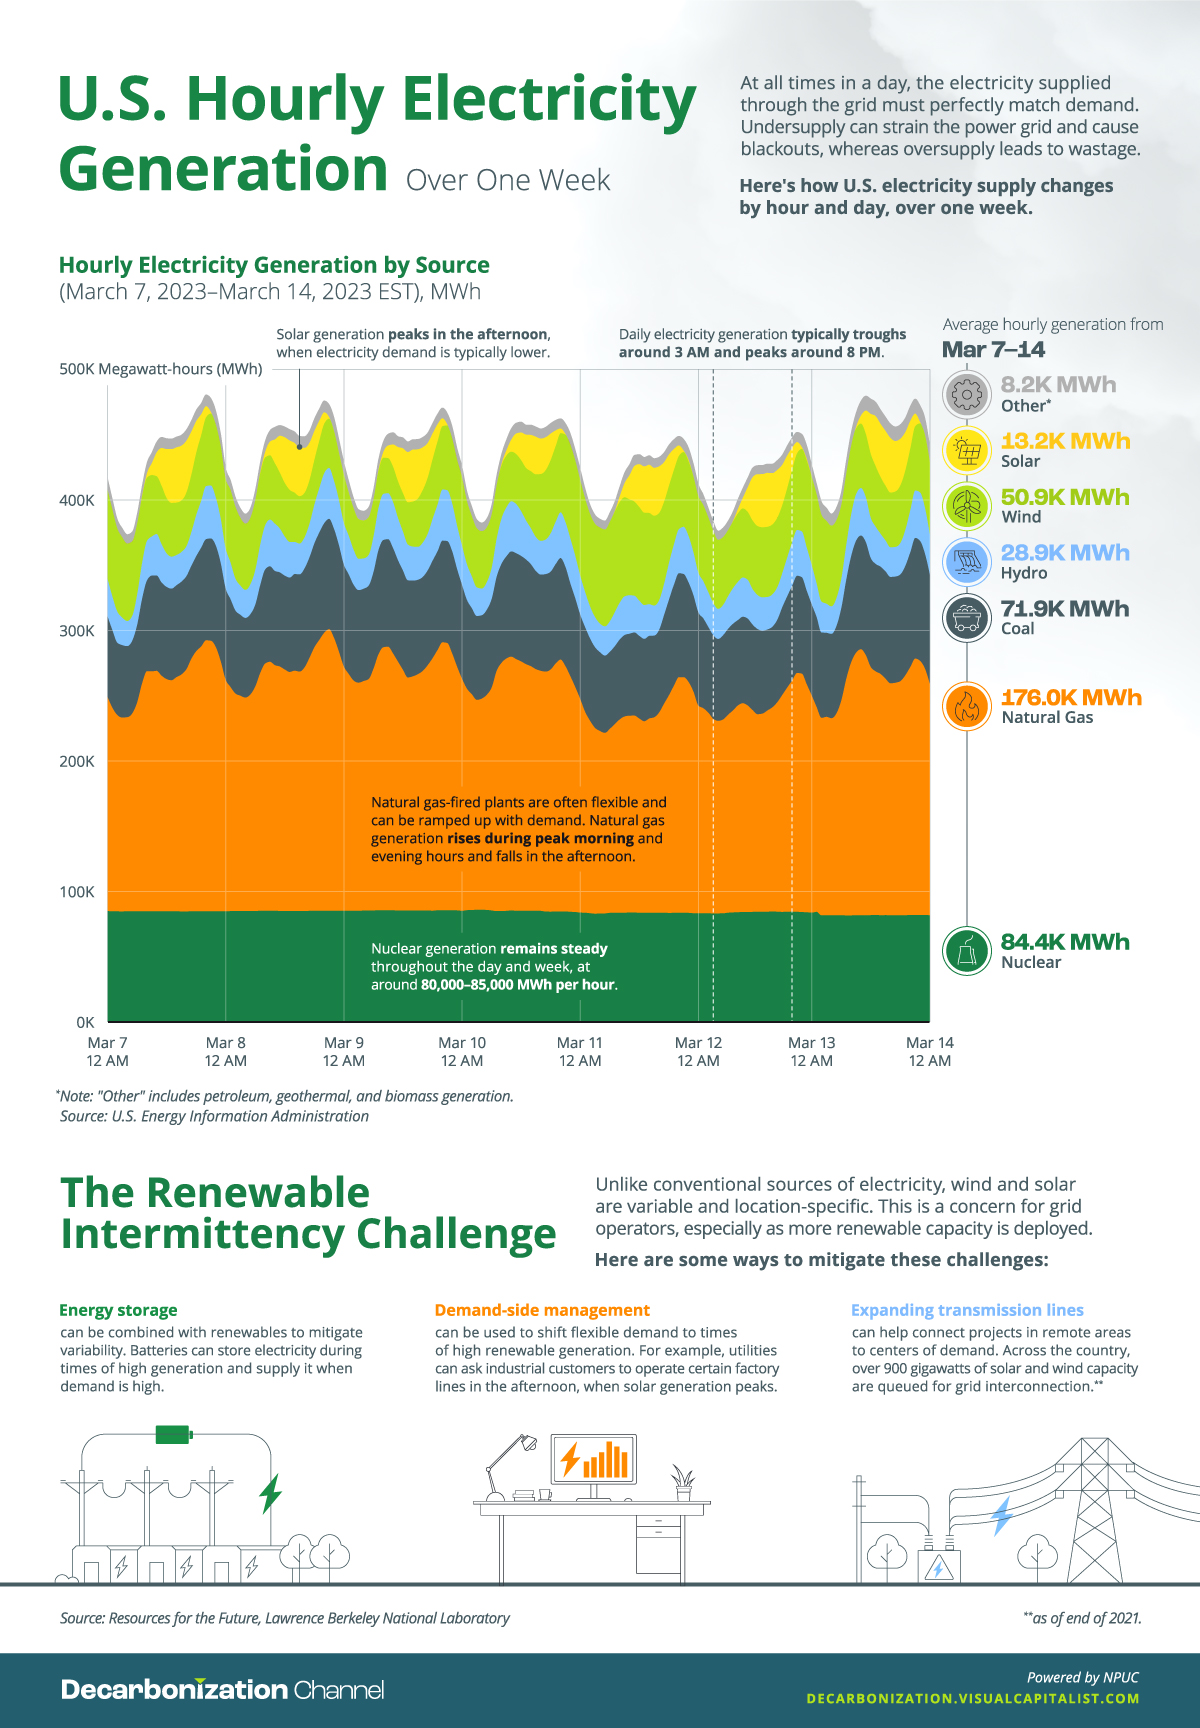
The U.S. has a dynamic electricity mix, with a range of energy sources generating electricity at different times of the day.
At all times, the amount of electricity generated must match demand in order to keep the power grid in balance, which leads to cyclical patterns in daily and weekly electricity generation.
The above graphic tracks hourly changes in U.S. electricity generation over one week, based on data from the U.S. Energy Information Administration (EIA).
The Three Types of Power Plants
Before diving in, it’s important to distinguish between the three main types of power plants in the U.S. electricity mix:
- Base load plants generally run at full or near-full capacity and are used to meet the base load or the minimum amount of electricity demanded at all times. These are typically coal-fired or nuclear power plants. If regionally available, geothermal and hydropower plants can also be used as baseload sources.
- Peak load or peaking power plants are typically dispatchable and can be ramped up quickly during periods of high demand. These plants usually operate at maximum capacity only for a few hours a day and include gas-fired and pumped-storage hydropower plants.
- Intermediate load plants are used during the transitory hours between base load and peak load demand. Intermittent renewable sources like wind and solar (without battery storage) are suitable for intermediate use, along with other sources.
Zooming In: The U.S. Hourly Electricity Mix
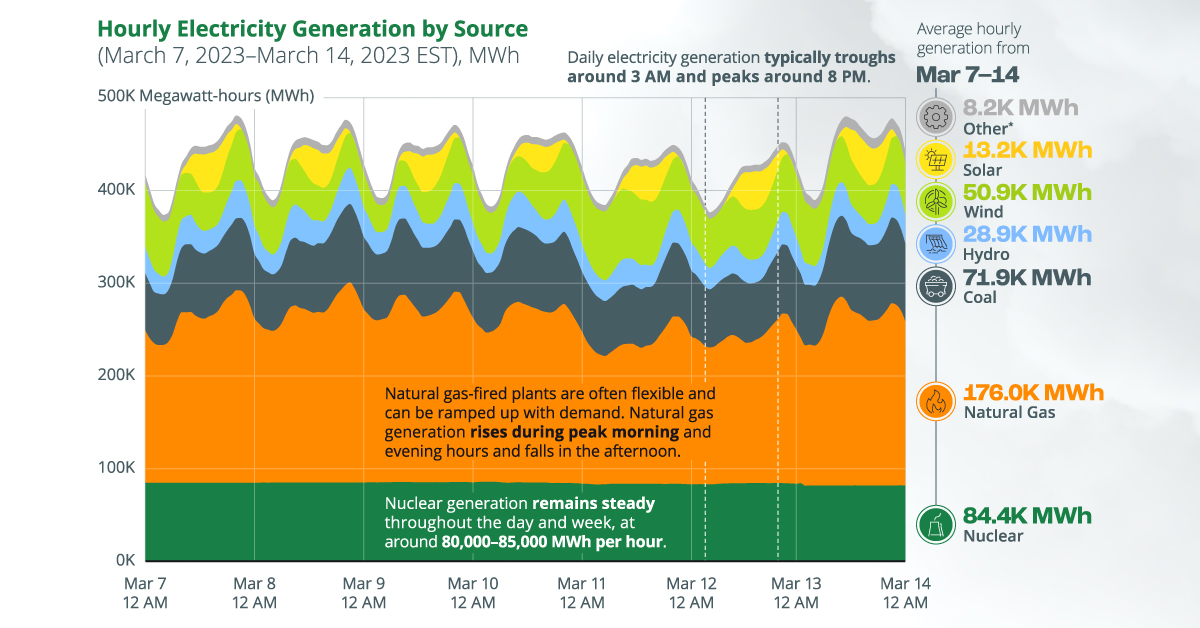
With that context, the table below provides an overview of average hourly electricity generation by source for the week of March 7–March 14, 2023, in the Eastern Time Zone.
It’s worth noting that while this is representative of a typical week of electricity generation, these patterns can change with seasons. For example, in the month of June, electricity demand usually peaks around 5 PM, when solar generation is still high, unlike in March.
| Energy Source | Type | Avg. Hourly Electricity Generation, MWh (Mar 07–14, 2023, EST) |
|---|---|---|
| Natural Gas | Fossil fuel | 175,967 |
| Nuclear | Non-renewable | 84,391 |
| Coal | Fossil fuel | 71,922 |
| Wind | Renewable | 50,942 |
| Hydro | Renewable | 28,889 |
| Solar | Renewable | 13,213 |
| Other | Mixed | 8,192 |
Natural gas is the country’s largest source of electricity, with gas-fired plants generating an average of 176,000 MWh of electricity per hour throughout the week outlined above. The dispatchable nature of natural gas is evident in the chart, with gas-fired generation falling in the wee hours and rising during business hours.
Meanwhile, nuclear electricity generation remains steady throughout the given days and week, ranging between 80,000–85,000 MWh per hour. Nuclear plants are designed to operate for long durations (1.5 to 2 years) before refueling and require less maintenance, allowing them to provide reliable baseload energy.
On the other hand, wind and solar generation tend to see large fluctuations throughout the week. For example, during the week of March 07–14, wind generation ranged between 26,875 MWh and 77,185 MWh per hour, based on wind speeds. Solar generation had stronger extremes, often reaching zero or net-negative at night and rising to over 40,000 MWh in the afternoon.
Because wind and solar are often variable and location-specific, integrating them into the grid can pose challenges for grid operators, who rely on forecasts to keep electricity supply and demand in balance. So, what are some ways to solve these problems?
Solving the Renewable Intermittency Challenge
As more renewable capacity is deployed, here are three ways to make the transition smoother.
- Energy storage systems can be combined with renewables to mitigate variability. Batteries can store electricity during times of high generation (for example, in the afternoon for solar), and supply it during periods of peak demand.
- Demand-side management can be used to shift flexible demand to times of high renewable generation. For instance, utilities can collaborate with their industrial customers to ensure that certain factory lines only run in the afternoon, when solar generation peaks.
- Expanding transmission lines can help connect high-quality solar and wind resources in remote regions to centers of demand. In fact, as of the end of 2021, over 900 gigawatts of solar and wind capacity (notably more than the country’s current renewable capacity) were queued for grid interconnection.


Who’s Building the Most Solar Energy?
This was originally posted on our Voronoi app. Download the app for free on iOS or Android and discover incredible data-driven charts from a variety of trusted sources.
In 2023, solar energy accounted for three-quarters of renewable capacity additions worldwide. Most of this growth occurred in Asia, the EU, and the U.S., continuing a trend observed over the past decade.
In this graphic, we illustrate the rise in installed solar photovoltaic (PV) capacity in China, the EU, and the U.S. between 2010 and 2022, measured in gigawatts (GW). Bruegel compiled the data..
Chinese Dominance
As of 2022, China’s total installed capacity stands at 393 GW, nearly double that of the EU’s 205 GW and surpassing the USA’s total of 113 GW by more than threefold in absolute terms.
| Installed solar capacity (GW) | China | EU27 | U.S. |
|---|---|---|---|
| 2022 | 393.0 | 205.5 | 113.0 |
| 2021 | 307.0 | 162.7 | 95.4 |
| 2020 | 254.0 | 136.9 | 76.4 |
| 2019 | 205.0 | 120.1 | 61.6 |
| 2018 | 175.3 | 104.0 | 52.0 |
| 2017 | 130.8 | 96.2 | 43.8 |
| 2016 | 77.8 | 91.5 | 35.4 |
| 2015 | 43.6 | 87.7 | 24.2 |
| 2014 | 28.4 | 83.6 | 18.1 |
| 2013 | 17.8 | 79.7 | 13.3 |
| 2012 | 6.7 | 71.1 | 8.6 |
| 2011 | 3.1 | 53.3 | 5.6 |
| 2010 | 1.0 | 30.6 | 3.4 |
Since 2017, China has shown a compound annual growth rate (CAGR) of approximately 25% in installed PV capacity, while the USA has seen a CAGR of 21%, and the EU of 16%.
Additionally, China dominates the production of solar power components, currently controlling around 80% of the world’s solar panel supply chain.
In 2022, China’s solar industry employed 2.76 million individuals, with manufacturing roles representing approximately 1.8 million and the remaining 918,000 jobs in construction, installation, and operations and maintenance.
The EU industry employed 648,000 individuals, while the U.S. reached 264,000 jobs.
According to the IEA, China accounts for almost 60% of new renewable capacity expected to become operational globally by 2028.
Despite the phasing out of national subsidies in 2020 and 2021, deployment of solar PV in China is accelerating. The country is expected to reach its national 2030 target for wind and solar PV installations in 2024, six years ahead of schedule.

-

 Markets5 days ago
Visualizing Global Inflation Forecasts (2024-2026)
-

 Green2 weeks ago
The Carbon Footprint of Major Travel Methods
-

 United States2 weeks ago
Visualizing the Most Common Pets in the U.S.
-

 Culture2 weeks ago
The World’s Top Media Franchises by All-Time Revenue
-

 voronoi1 week ago
Best Visualizations of April on the Voronoi App
-

 Wealth1 week ago
Charted: Which Country Has the Most Billionaires in 2024?
-

 Business1 week ago
The Top Private Equity Firms by Country
-

 Markets1 week ago
The Best U.S. Companies to Work for According to LinkedIn