Markets
Visualizing the Global Share of U.S. Stock Markets


Visualizing the Global Share of U.S. Stock Markets
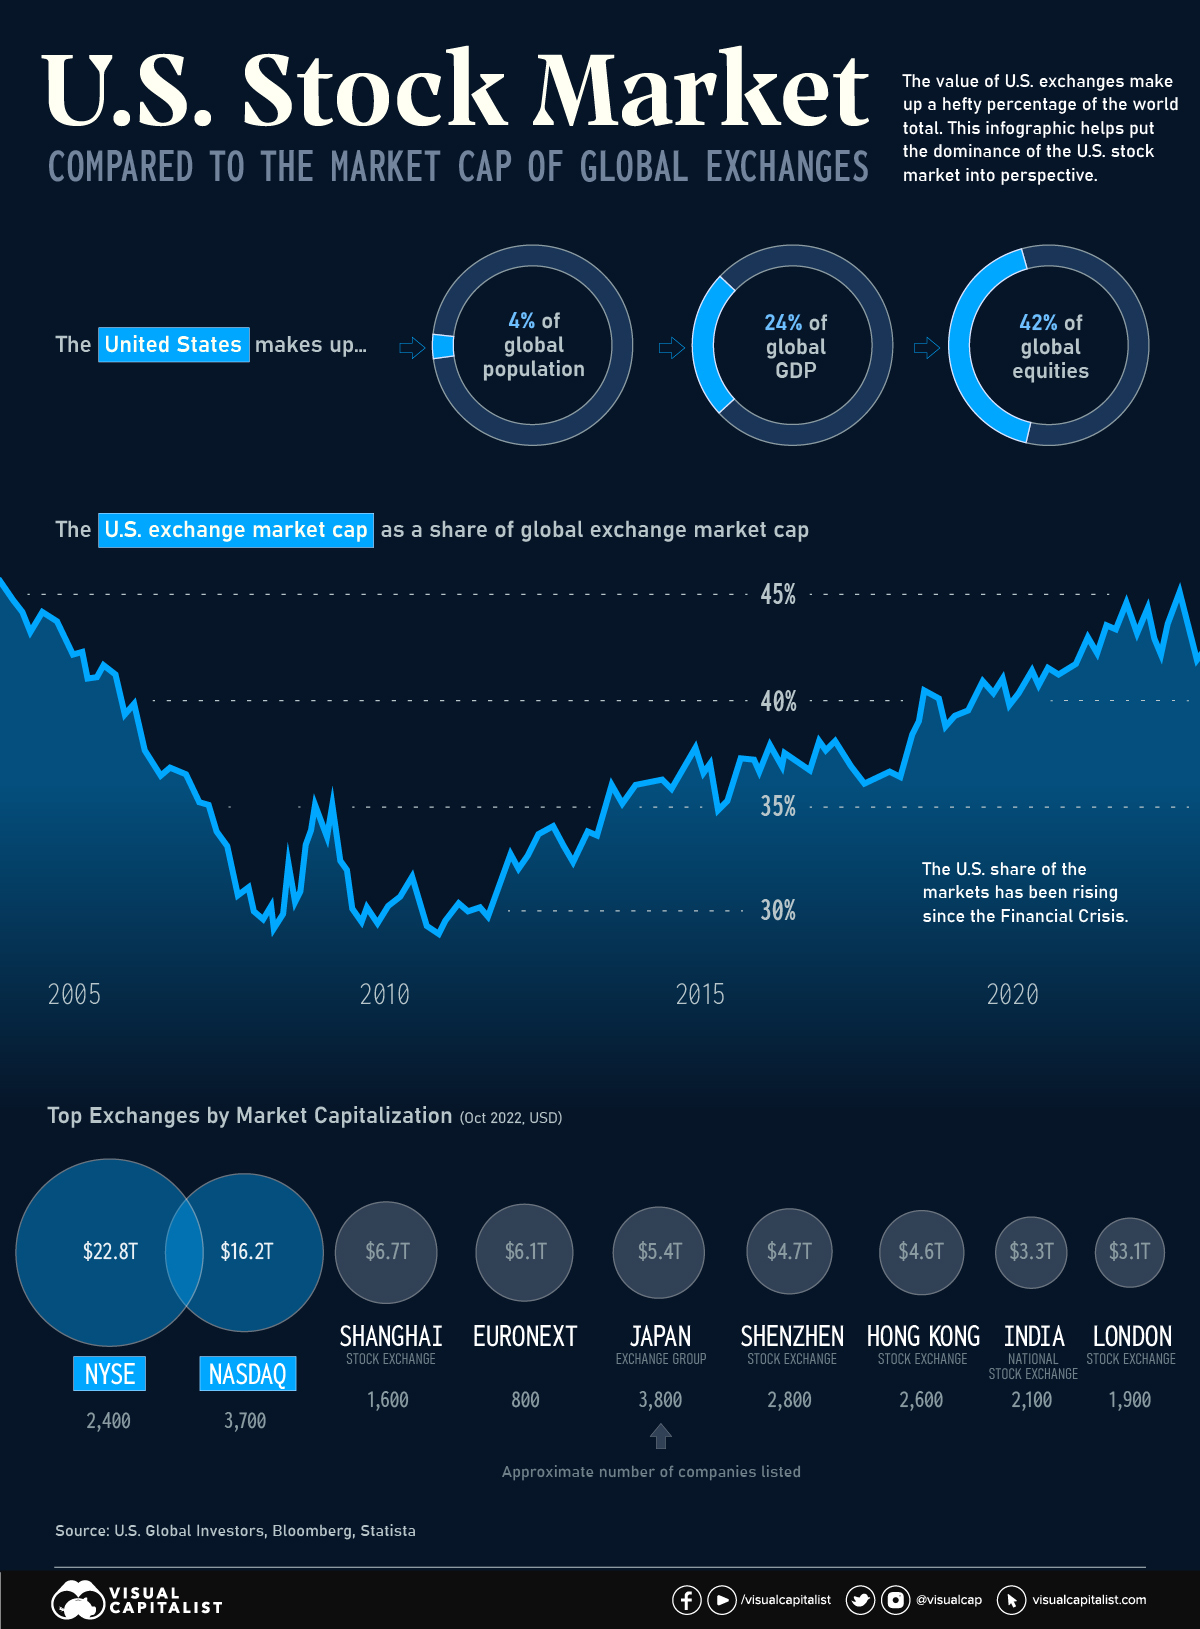
One of the most potent symbols of American financial dominance is the combined market capitalization of the country’s two biggest stock exchanges—the New York Stock Exchange (NYSE) and NASDAQ.
These two major listing hubs dwarf all other exchanges around the world. In fact, the NYSE on its own is larger than the Shanghai, Shenzhen, Japan, and Euronext exchanges put together.
| Rank | Exchange | Market Cap (Oct '22) | Location | Approx. # of companies |
|---|---|---|---|---|
| #1 | NYSE | $22.8T | United States 🇺🇸 | 2,400 |
| #2 | NASDAQ | $16.2T | United States 🇺🇸 | 3,700 |
| #3 | Shanghai Stock Exchange | $6.7T | China 🇨🇳 | 1,600 |
| #4 | EuroNext | $6.1T | Europe 🇪🇺 | 800 |
| #5 | Japan Exchange Group | $5.4T | Japan 🇯🇵 | 3,800 |
| #6 | Shenzhen Stock Exchange | $4.7T | China 🇨🇳 | 2,800 |
| #7 | Hong Kong Stock Exchange | $4.6T | Hong Kong SAR 🇭🇰 | 2,600 |
| #8 | National Stock Exchange of India | $3.3T | India 🇮🇳 | 2,100 |
| #9 | London Stock Exchange | $3.1T | UK 🇬🇧 | 1,900 |
| #10 | Toronto Stock Exchange | $2.7T | Canada 🇨🇦 | 1,500 |
One of the key reasons for this dominance is the sheer size of the U.S. economy. With a GDP of over $25 trillion, the U.S. economy is the largest in the world, and American exchanges are home to some of the world’s largest and most valuable companies, including tech giants like Apple, Amazon, and Microsoft.
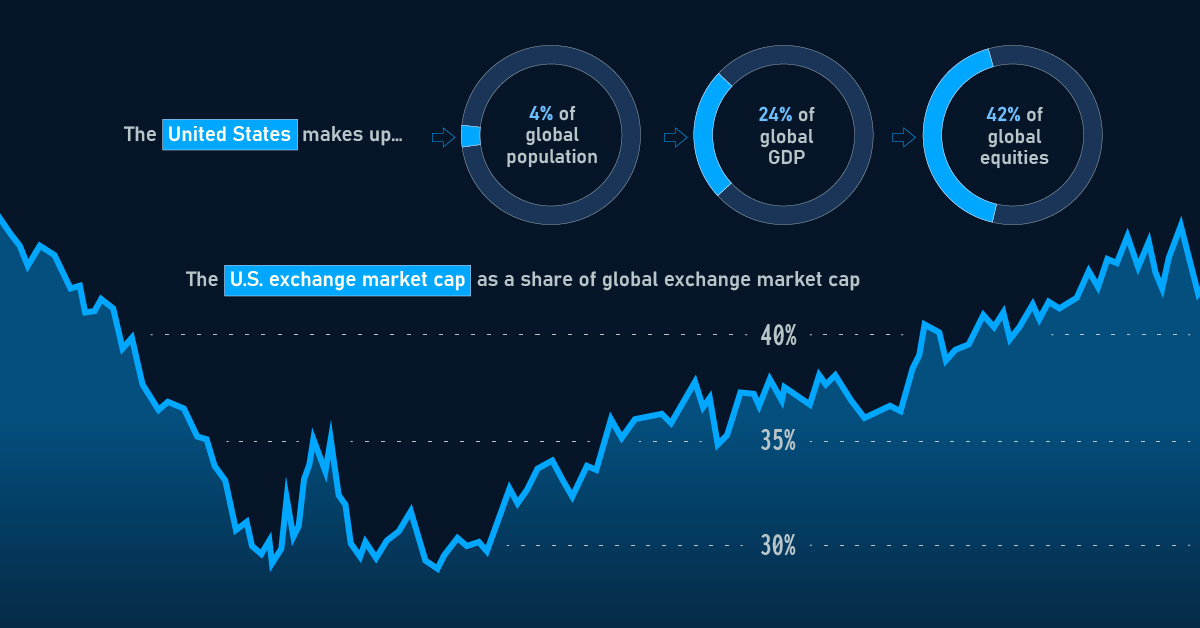
As of January 2023, the value of stocks listed on U.S. exchanges made up 42% of the global total. How does this total stack up, historically?
The U.S. Share Over Time
For much of the 1970s, the U.S. made up more than half of global stock market value. Over the course of the 1980s, the U.S. share of the global total began to dip, driven in part by the asset price bubble in Japan.
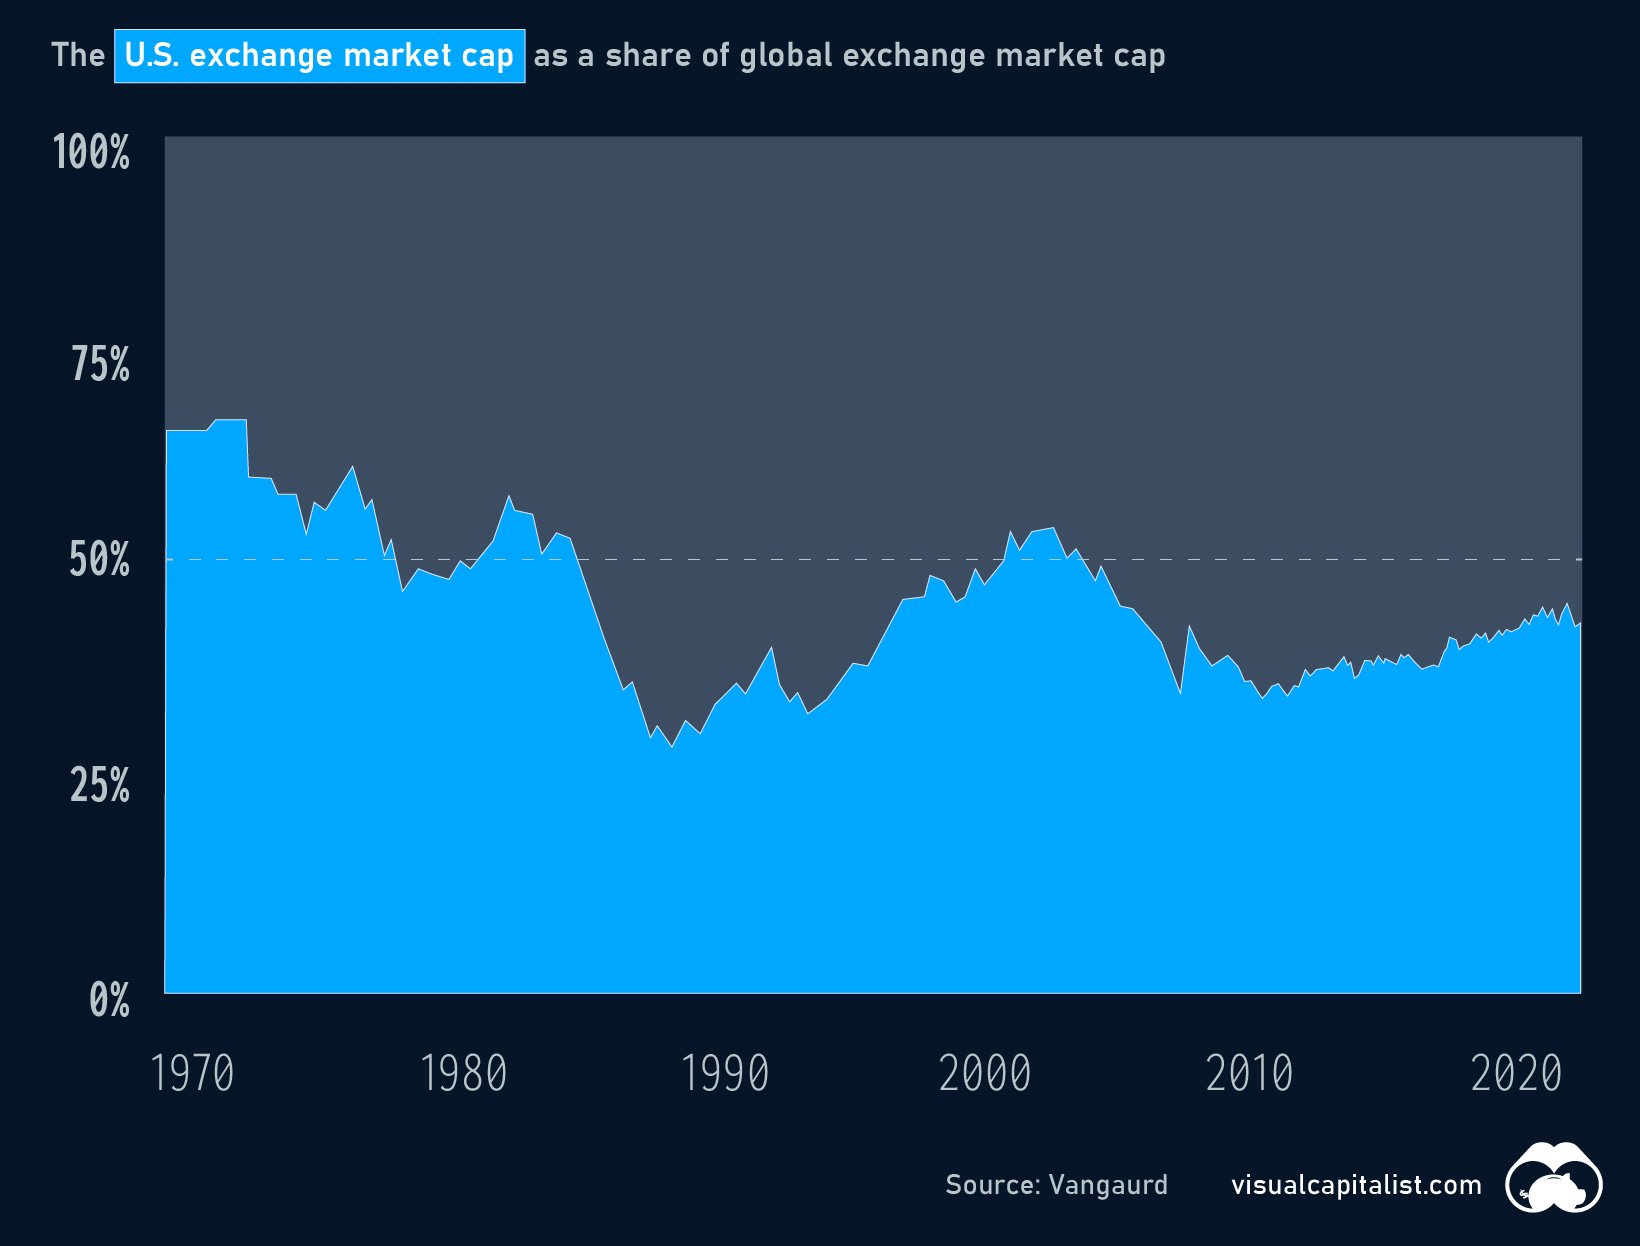
More recently, the U.S. slice of the equities pie bottomed out temporarily around the time of the Financial Crisis, but has been steadily rising ever since.
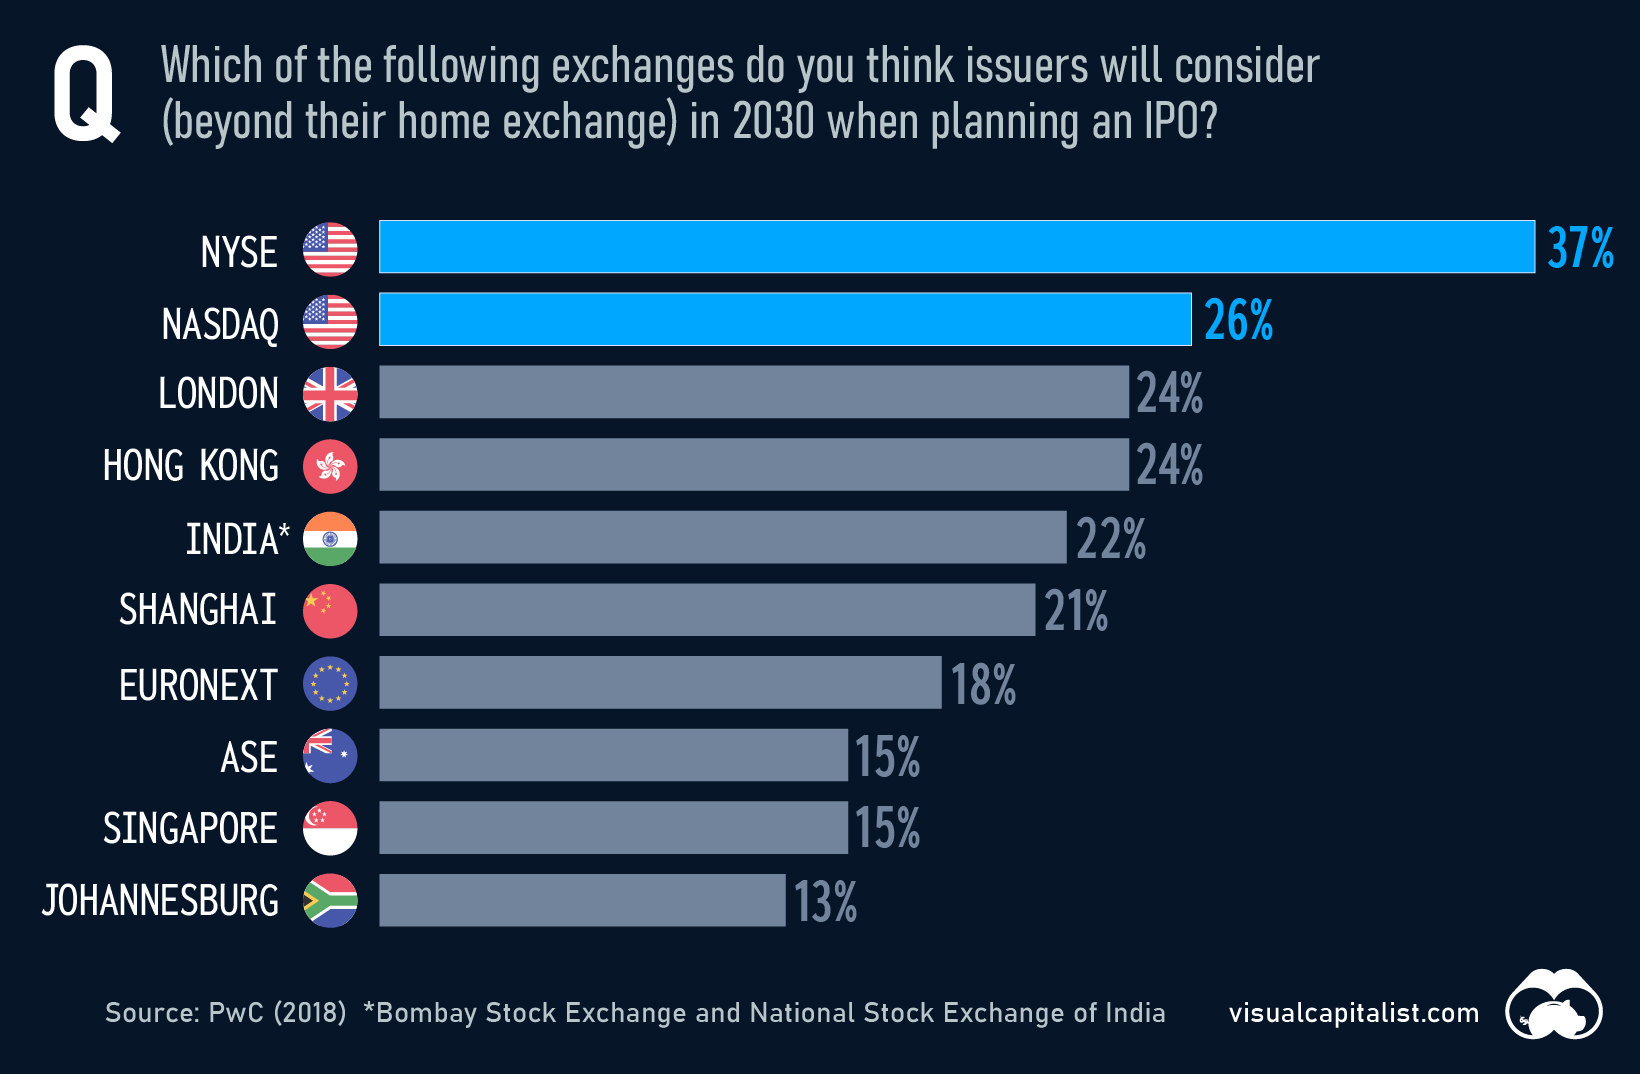
Will U.S. Exchanges Ever Be Surpassed?
U.S. stock exchanges have several advantages that make them attractive to investors, including strong regulatory oversight, a stable political and economic environment, and a diverse pool of well-known companies to invest in. The U.S. stock exchanges also have a long history of innovation and technological advancement, which has helped to maintain their position as leading global exchanges.
In 2018, PwC surveyed hundreds of capital market participants on the future of stock exchanges. Respondents felt that, by 2030, many of today’s top exchanges would remain popular choices for companies looking to go public.
Despite obvious advantages, U.S. exchanges do face plenty of competition, especially in emerging markets like China and India. The Shanghai Stock Exchange, for example, has seen significant growth in recent years and is now the world’s third-largest exchange by market capitalization.
Even as other markets continue to grow, U.S. exchanges are likely to remain a preferred destination for investors around the world for years to come.


Markets
Visualizing Global Inflation Forecasts (2024-2026)
Here are IMF forecasts for global inflation rates up to 2026, highlighting a slow descent of price pressures amid resilient global growth.


Visualizing Global Inflation Forecasts (2024-2026)
Global inflation rates are gradually descending, but progress has been slow.
Today, the big question is if inflation will decline far enough to trigger easing monetary policy. So far, the Federal Reserve has held rates for nine months amid stronger than expected core inflation, which excludes volatile energy and food prices.
Yet looking further ahead, inflation forecasts from the International Monetary Fund (IMF) suggest that inflation will decline as price pressures ease, but the path of disinflation is not without its unknown risks.
This graphic shows global inflation forecasts, based on data from the April 2024 IMF World Economic Outlook.
Get the Key Insights of the IMF’s World Economic Outlook
Want a visual breakdown of the insights from the IMF’s 2024 World Economic Outlook report?
This visual is part of a special dispatch of the key takeaways exclusively for VC+ members.
Get the full dispatch of charts by signing up to VC+.
The IMF’s Inflation Outlook
Below, we show the IMF’s latest projections for global inflation rates through to 2026:
| Year | Global Inflation Rate (%) | Advanced Economies Inflation Rate (%) | Emerging Market and Developing Economies Inflation Rate (%) |
|---|---|---|---|
| 2019 | 3.5 | 1.4 | 5.1 |
| 2020 | 3.2 | 0.7 | 5.2 |
| 2021 | 4.7 | 3.1 | 5.9 |
| 2022 | 8.7 | 7.3 | 9.8 |
| 2023 | 6.8 | 4.6 | 8.3 |
| 2024 | 5.9 | 2.6 | 8.3 |
| 2025 | 4.5 | 2.0 | 6.2 |
| 2026 | 3.7 | 2.0 | 4.9 |
After hitting a peak of 8.7% in 2022, global inflation is projected to fall to 5.9% in 2024, reflecting promising inflation trends amid resilient global growth.
While inflation has largely declined due to falling energy and goods prices, persistently high services inflation poses challenges to mitigating price pressures. In addition, the IMF highlights the potential risk of an escalating conflict in the Middle East, which could lead to energy price shocks and higher shipping costs.
These developments could negatively affect inflation scenarios and prompt central banks to adopt tighter monetary policies. Overall, by 2026, global inflation is anticipated to decline to 3.7%—still notably above the 2% target set by several major economies.
Adding to this, we can see divergences in the path of inflation between advanced and emerging economies. While affluent nations are forecast to see inflation edge closer to the 2% target by 2026, emerging economies are projected to have inflation rates reach 4.9%—falling closer to their pre-pandemic averages.
Get the Full Analysis of the IMF’s Outlook on VC+
This visual is part of an exclusive special dispatch for VC+ members which breaks down the key takeaways from the IMF’s 2024 World Economic Outlook.
For the full set of charts and analysis, sign up for VC+.

-

 Business6 days ago
The Top Private Equity Firms by Country
-

 Countries2 weeks ago
Countries With the Largest Happiness Gains Since 2010
-

 VC+2 weeks ago
VC+: Get Our Key Takeaways From the IMF’s World Economic Outlook
-

 Demographics2 weeks ago
The Countries That Have Become Sadder Since 2010
-

 Money2 weeks ago
Charted: Who Has Savings in This Economy?
-

 Technology2 weeks ago
Visualizing AI Patents by Country
-

 Economy2 weeks ago
Economic Growth Forecasts for G7 and BRICS Countries in 2024
-

 Wealth1 week ago
Charted: Which City Has the Most Billionaires in 2024?