Markets
America’s Most Valuable Company Every Year Since 1995
![]() See this visualization first on the Voronoi app.
See this visualization first on the Voronoi app.
America’s Most Valuable Company Every Year Since 1995
This was originally posted on our Voronoi app. Download the app for free on iOS or Android and discover incredible data-driven charts from a variety of trusted sources.
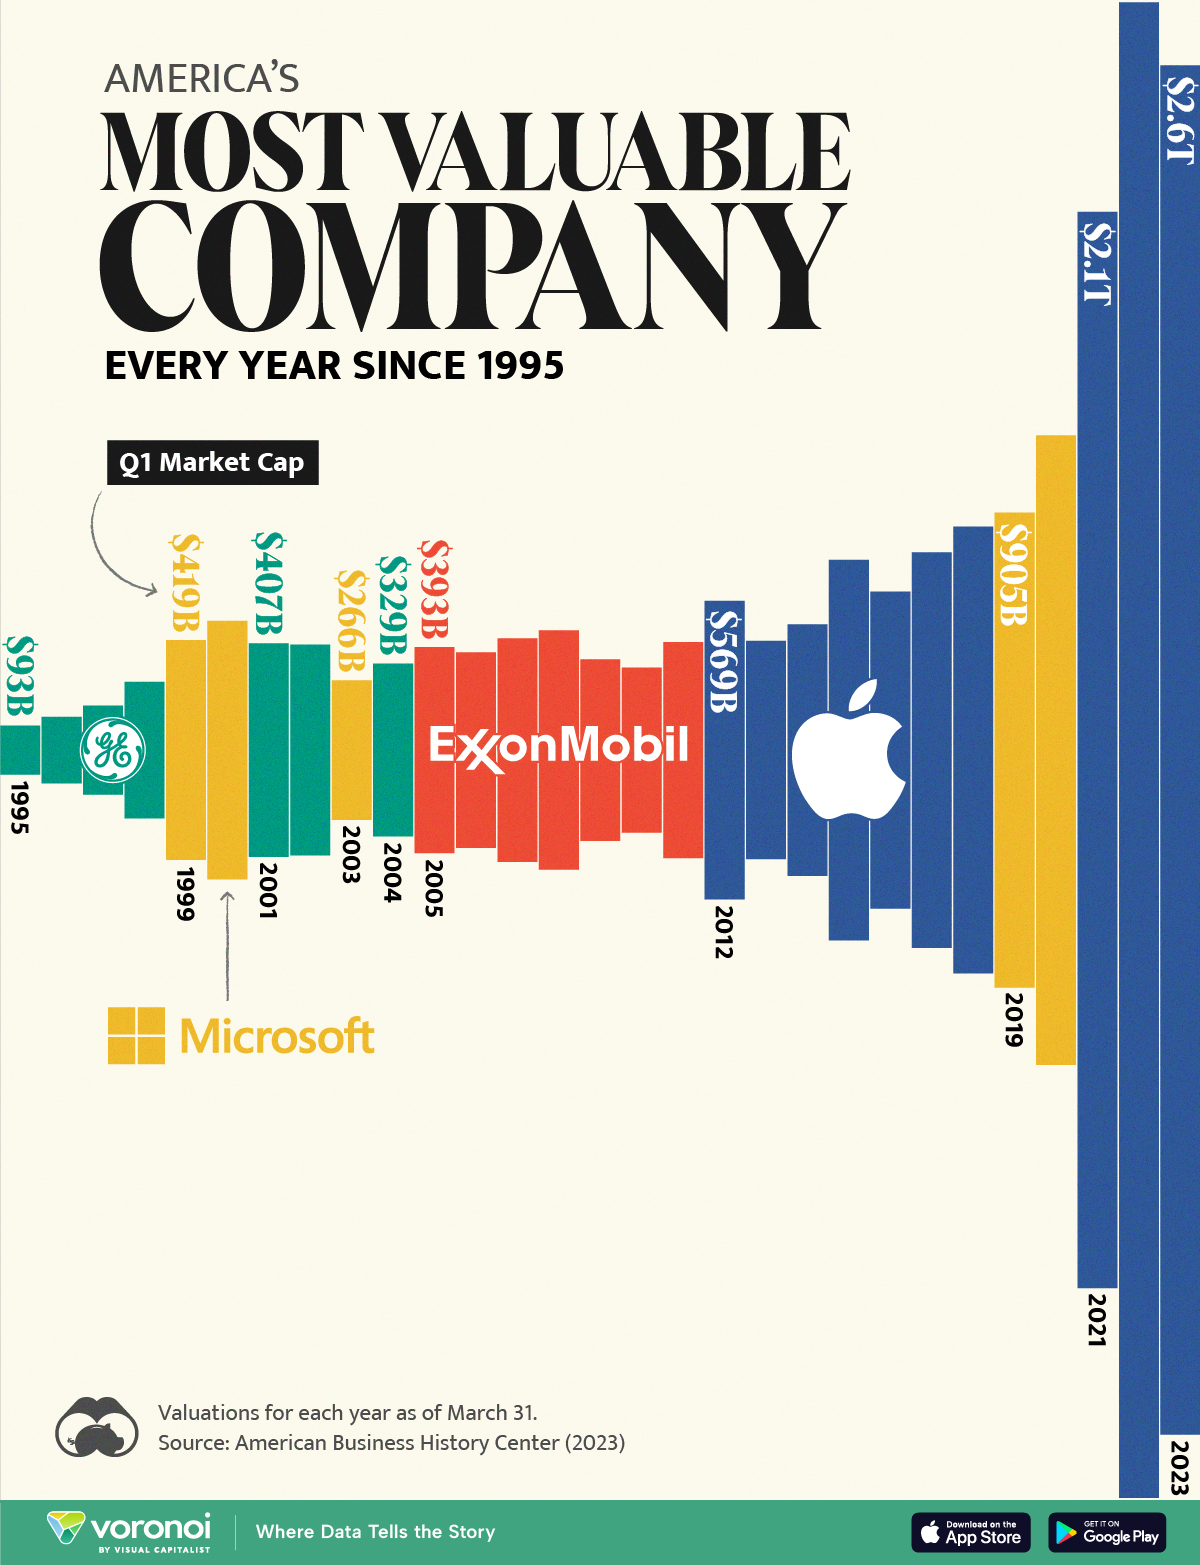
Over the last three decades, the growth of tech companies has driven a shift in the ranking of the most valuable companies in the United States.
In this graphic, we utilize data from the American Business History Center to present the history of America’s most valuable public company from 1995 to 2023. Valuations are for March 31 of that year, and are not adjusted for inflation.
The Surge of Tech Giants
In the early 1990s, the top rank was dominated by General Electric. The centenary company held a significant presence in the market with its various divisions, encompassing aerospace, power, renewable energy, digital industry, and finance.
In 1999, however, GE was surpassed by Microsoft. In that year, Bill Gates’ company launched its first online store, and Internet Explorer 5.0 was introduced, followed by more than 1 million downloads of the new version in less than a week.
| Year | Company | Market Cap (as of Q1) |
|---|---|---|
| 1995 | General Electric | $93,322 billion |
| 1996 | General Electric | $126,523 billion |
| 1997 | General Electric | $169,388 billion |
| 1998 | General Electric | $260,147 billion |
| 1999 | Microsoft | $418,579 billion |
| 2000 | Microsoft | $492,462 billion |
| 2001 | General Electric | $407,054 billion |
| 2002 | General Electric | $401,499 billion |
| 2003 | Microsoft | $266,037 billion |
| 2004 | General Electric | $329,240 billion |
| 2005 | ExxonMobil | $392,636 billion |
| 2006 | ExxonMobil | $372,792 billion |
| 2007 | ExxonMobil | $425,795 billion |
| 2008 | ExxonMobil | $455,929 billion |
| 2009 | ExxonMobil | $345,815 billion |
| 2010 | ExxonMobil | $314,154 billion |
| 2011 | ExxonMobil | $411,638 billion |
| 2012 | Apple | $568,615 billion |
| 2013 | Apple | $415,683 billion |
| 2014 | Apple | $479,069 billion |
| 2015 | Apple | $724,773 billion |
| 2016 | Apple | $604,304 billion |
| 2017 | Apple | $753,718 billion |
| 2018 | Apple | $851,318 billion |
| 2019 | Microsoft | $904,861 billion |
| 2020 | Microsoft | $1.199 trillion |
| 2021 | Apple | $2.050 trillion |
| 2022 | Apple | $2.849 trillion |
| 2023 | Apple | $2.609 trillion |
Both Microsoft and GE competed for the top spot from 2000 to 2004. However, after 2005, ExxonMobil held the position for seven years. Following the 1998 Exxon and Mobil $74 billion merger agreement, the largest oil company in the world benefited from increasing gas prices over that period.
Since 2012, however, the ranking has been dominated by Apple. Boosted by the success of its iPhone line, its biggest cash cow, the company was only behind Microsoft in 2019 and 2020 when concerns about COVID-driven supply chain shortages affected the iPhone maker’s stock price.
More recently, Microsoft briefly overtook Apple as the world’s most valuable company in January 2024, after the iPhone maker’s shares had a weak start to the year due to growing concerns over demand in China.
Meanwhile, Microsoft’s shares rose sharply thanks to the early lead the company had taken in generative artificial intelligence through an investment in ChatGPT-maker OpenAI.


Markets
Visualizing Global Inflation Forecasts (2024-2026)
Here are IMF forecasts for global inflation rates up to 2026, highlighting a slow descent of price pressures amid resilient global growth.


Visualizing Global Inflation Forecasts (2024-2026)
Global inflation rates are gradually descending, but progress has been slow.
Today, the big question is if inflation will decline far enough to trigger easing monetary policy. So far, the Federal Reserve has held rates for nine months amid stronger than expected core inflation, which excludes volatile energy and food prices.
Yet looking further ahead, inflation forecasts from the International Monetary Fund (IMF) suggest that inflation will decline as price pressures ease, but the path of disinflation is not without its unknown risks.
This graphic shows global inflation forecasts, based on data from the April 2024 IMF World Economic Outlook.
Get the Key Insights of the IMF’s World Economic Outlook
Want a visual breakdown of the insights from the IMF’s 2024 World Economic Outlook report?
This visual is part of a special dispatch of the key takeaways exclusively for VC+ members.
Get the full dispatch of charts by signing up to VC+.
The IMF’s Inflation Outlook
Below, we show the IMF’s latest projections for global inflation rates through to 2026:
| Year | Global Inflation Rate (%) | Advanced Economies Inflation Rate (%) | Emerging Market and Developing Economies Inflation Rate (%) |
|---|---|---|---|
| 2019 | 3.5 | 1.4 | 5.1 |
| 2020 | 3.2 | 0.7 | 5.2 |
| 2021 | 4.7 | 3.1 | 5.9 |
| 2022 | 8.7 | 7.3 | 9.8 |
| 2023 | 6.8 | 4.6 | 8.3 |
| 2024 | 5.9 | 2.6 | 8.3 |
| 2025 | 4.5 | 2.0 | 6.2 |
| 2026 | 3.7 | 2.0 | 4.9 |
After hitting a peak of 8.7% in 2022, global inflation is projected to fall to 5.9% in 2024, reflecting promising inflation trends amid resilient global growth.
While inflation has largely declined due to falling energy and goods prices, persistently high services inflation poses challenges to mitigating price pressures. In addition, the IMF highlights the potential risk of an escalating conflict in the Middle East, which could lead to energy price shocks and higher shipping costs.
These developments could negatively affect inflation scenarios and prompt central banks to adopt tighter monetary policies. Overall, by 2026, global inflation is anticipated to decline to 3.7%—still notably above the 2% target set by several major economies.
Adding to this, we can see divergences in the path of inflation between advanced and emerging economies. While affluent nations are forecast to see inflation edge closer to the 2% target by 2026, emerging economies are projected to have inflation rates reach 4.9%—falling closer to their pre-pandemic averages.
Get the Full Analysis of the IMF’s Outlook on VC+
This visual is part of an exclusive special dispatch for VC+ members which breaks down the key takeaways from the IMF’s 2024 World Economic Outlook.
For the full set of charts and analysis, sign up for VC+.

-

 Culture6 days ago
The World’s Top Media Franchises by All-Time Revenue
-

 Science2 weeks ago
Visualizing the Average Lifespans of Mammals
-

 Brands2 weeks ago
How Tech Logos Have Evolved Over Time
-

 Energy2 weeks ago
Ranked: The Top 10 EV Battery Manufacturers in 2023
-

 Countries2 weeks ago
Countries With the Largest Happiness Gains Since 2010
-

 Economy2 weeks ago
VC+: Get Our Key Takeaways From the IMF’s World Economic Outlook
-

 Demographics1 week ago
The Countries That Have Become Sadder Since 2010
-

 Money1 week ago
Charted: Who Has Savings in This Economy?