Misc
5 Maps Showing the Extreme Variance in U.S. Population Distribution
The United States is the third most populous country in the world with approximately 320 million people living within its borders.
However, the country is also the third largest in land size, giving it a wide and diverse geographical landscape. As a result of these factors, it is possible to have both ends of the population distribution spectrum.
Many people live in modern megacities, while others choose to reside in a vast countryside sparsely dotted by cottages and lakes. A small tract of land such as Manhattan has 1.6 million people living in a relatively small space. Meanwhile, a state that is 2,900x larger (Wyoming) has a more modest population of just 600,000 people in total.
The below visualizations use data on the country’s 3,142 counties (and county equivalents) to show the extreme variance in U.S. population distribution.
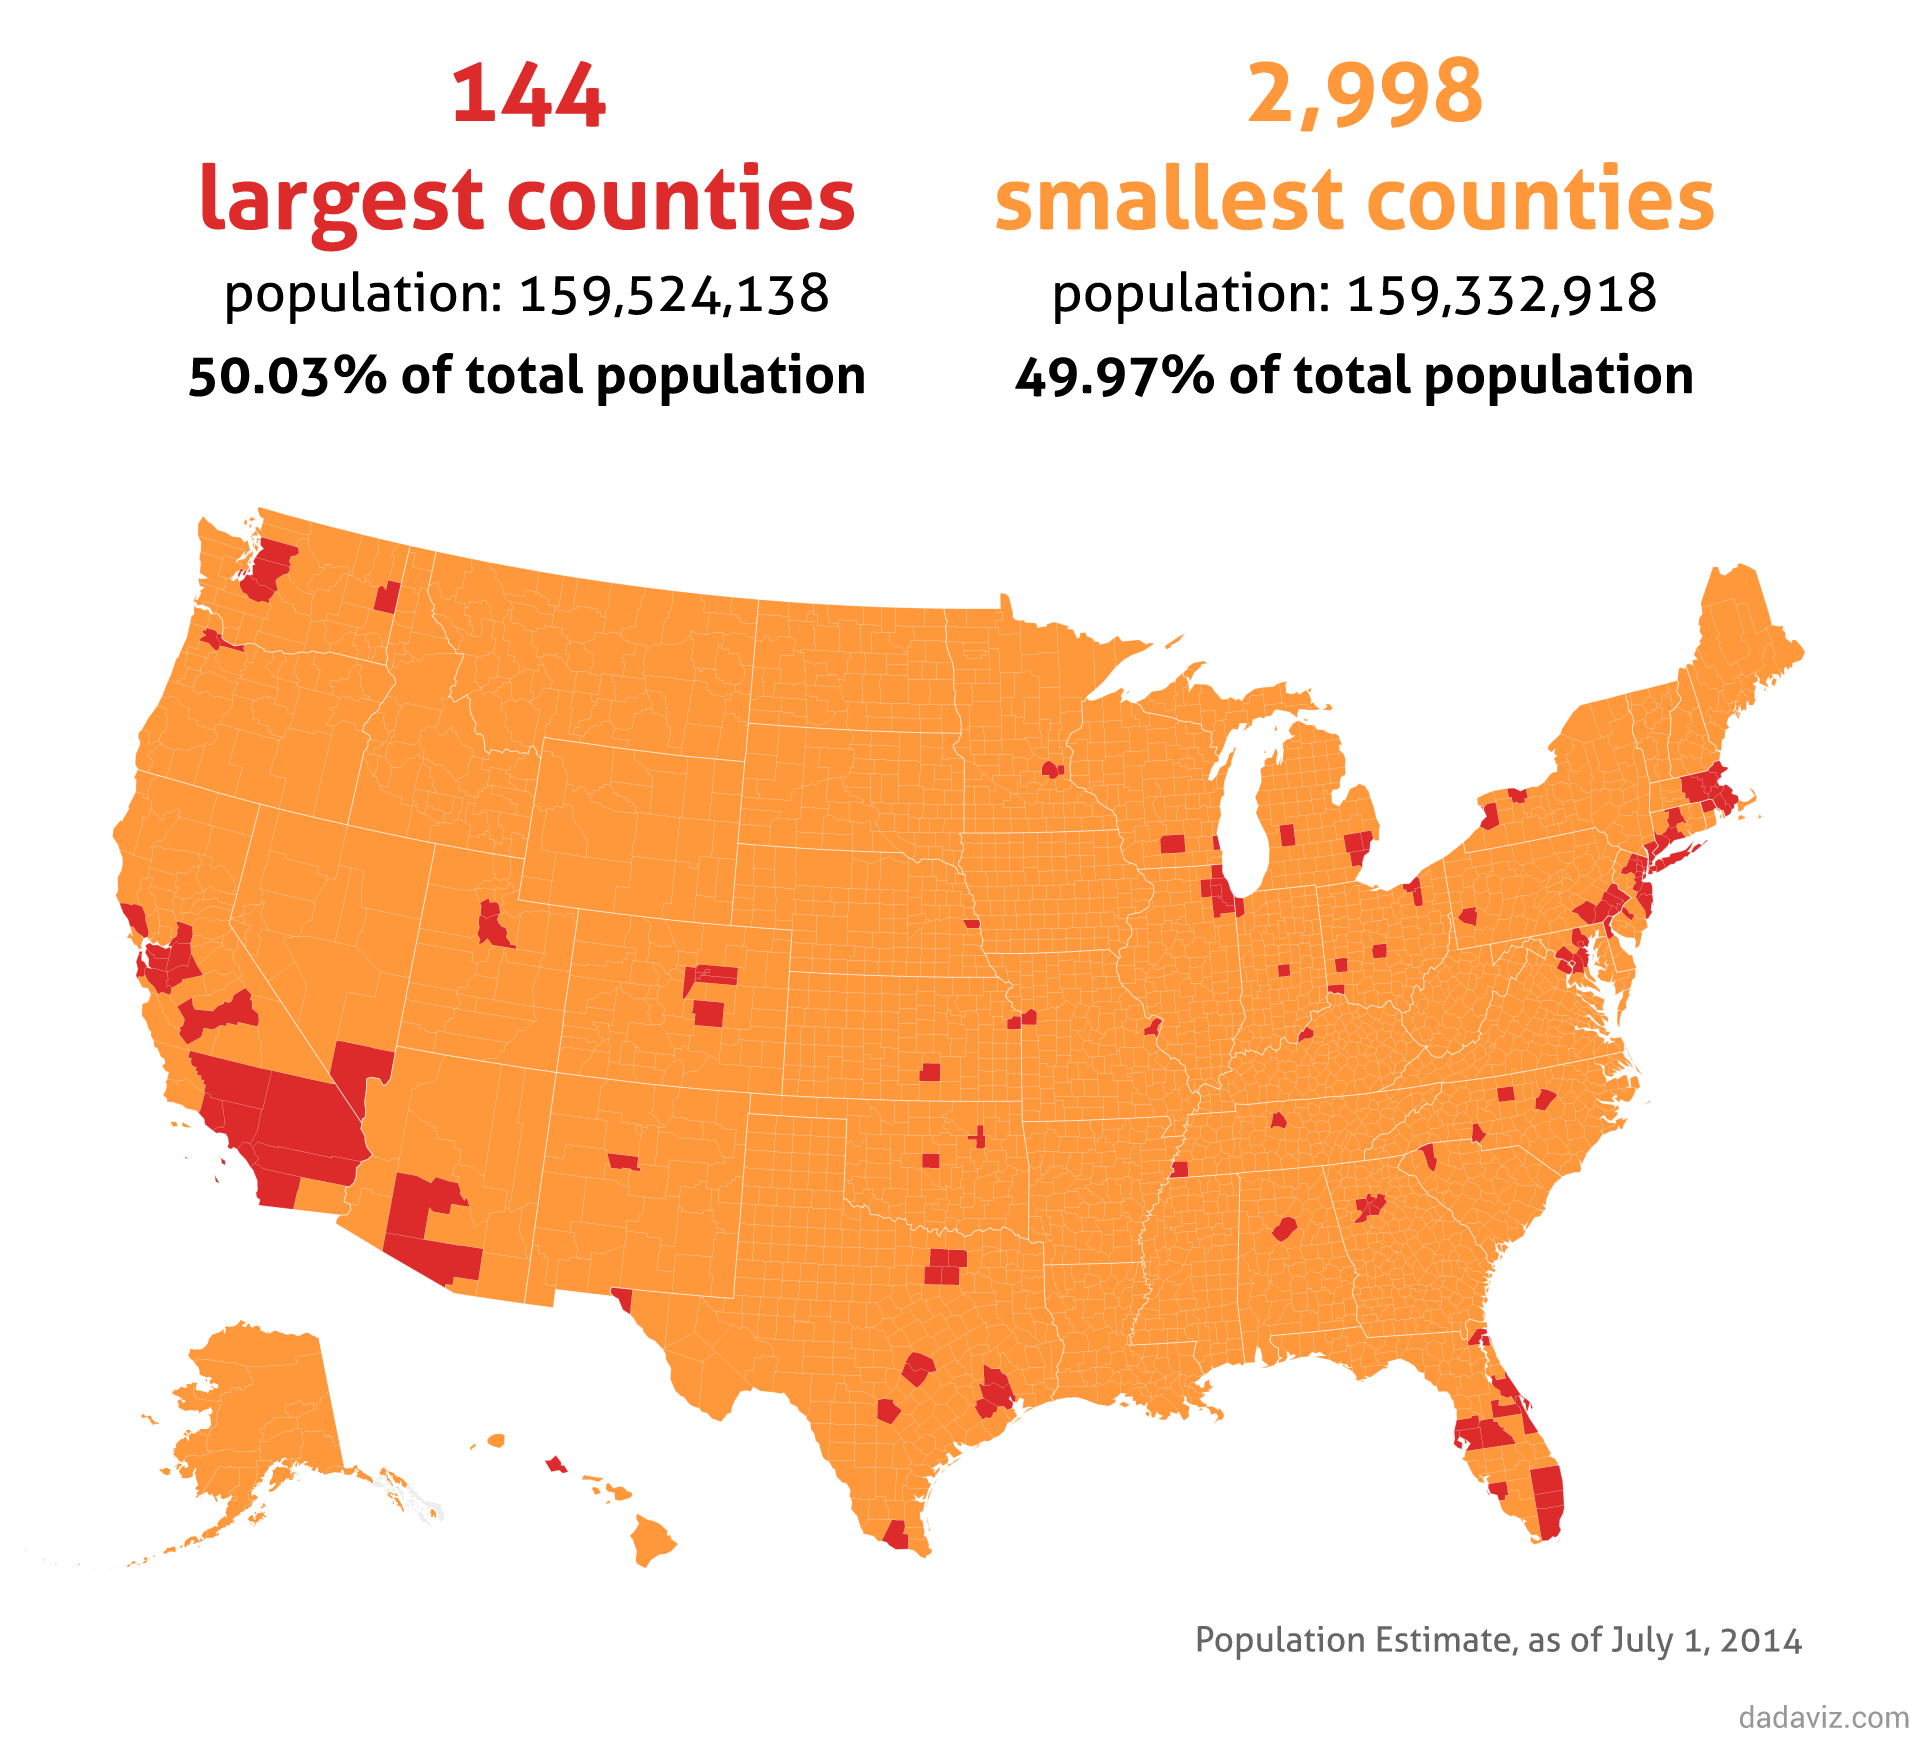
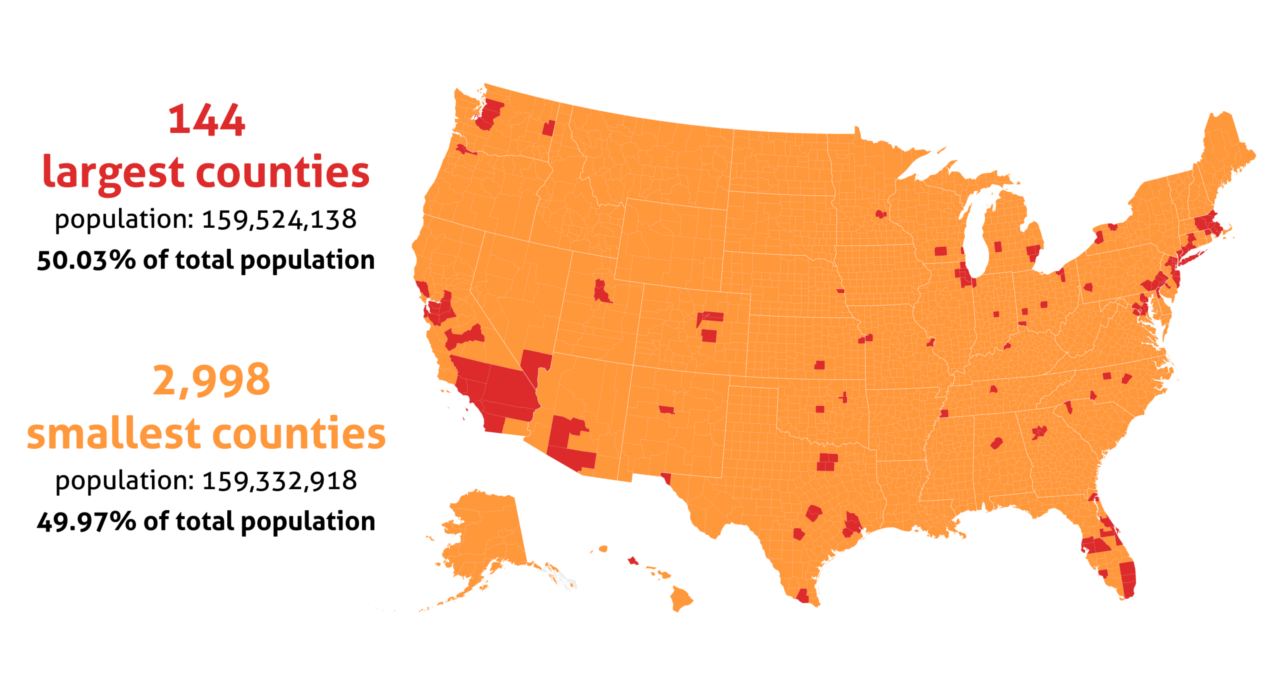
1) The 144 most populous counties in the United States account for half of the country’s population:
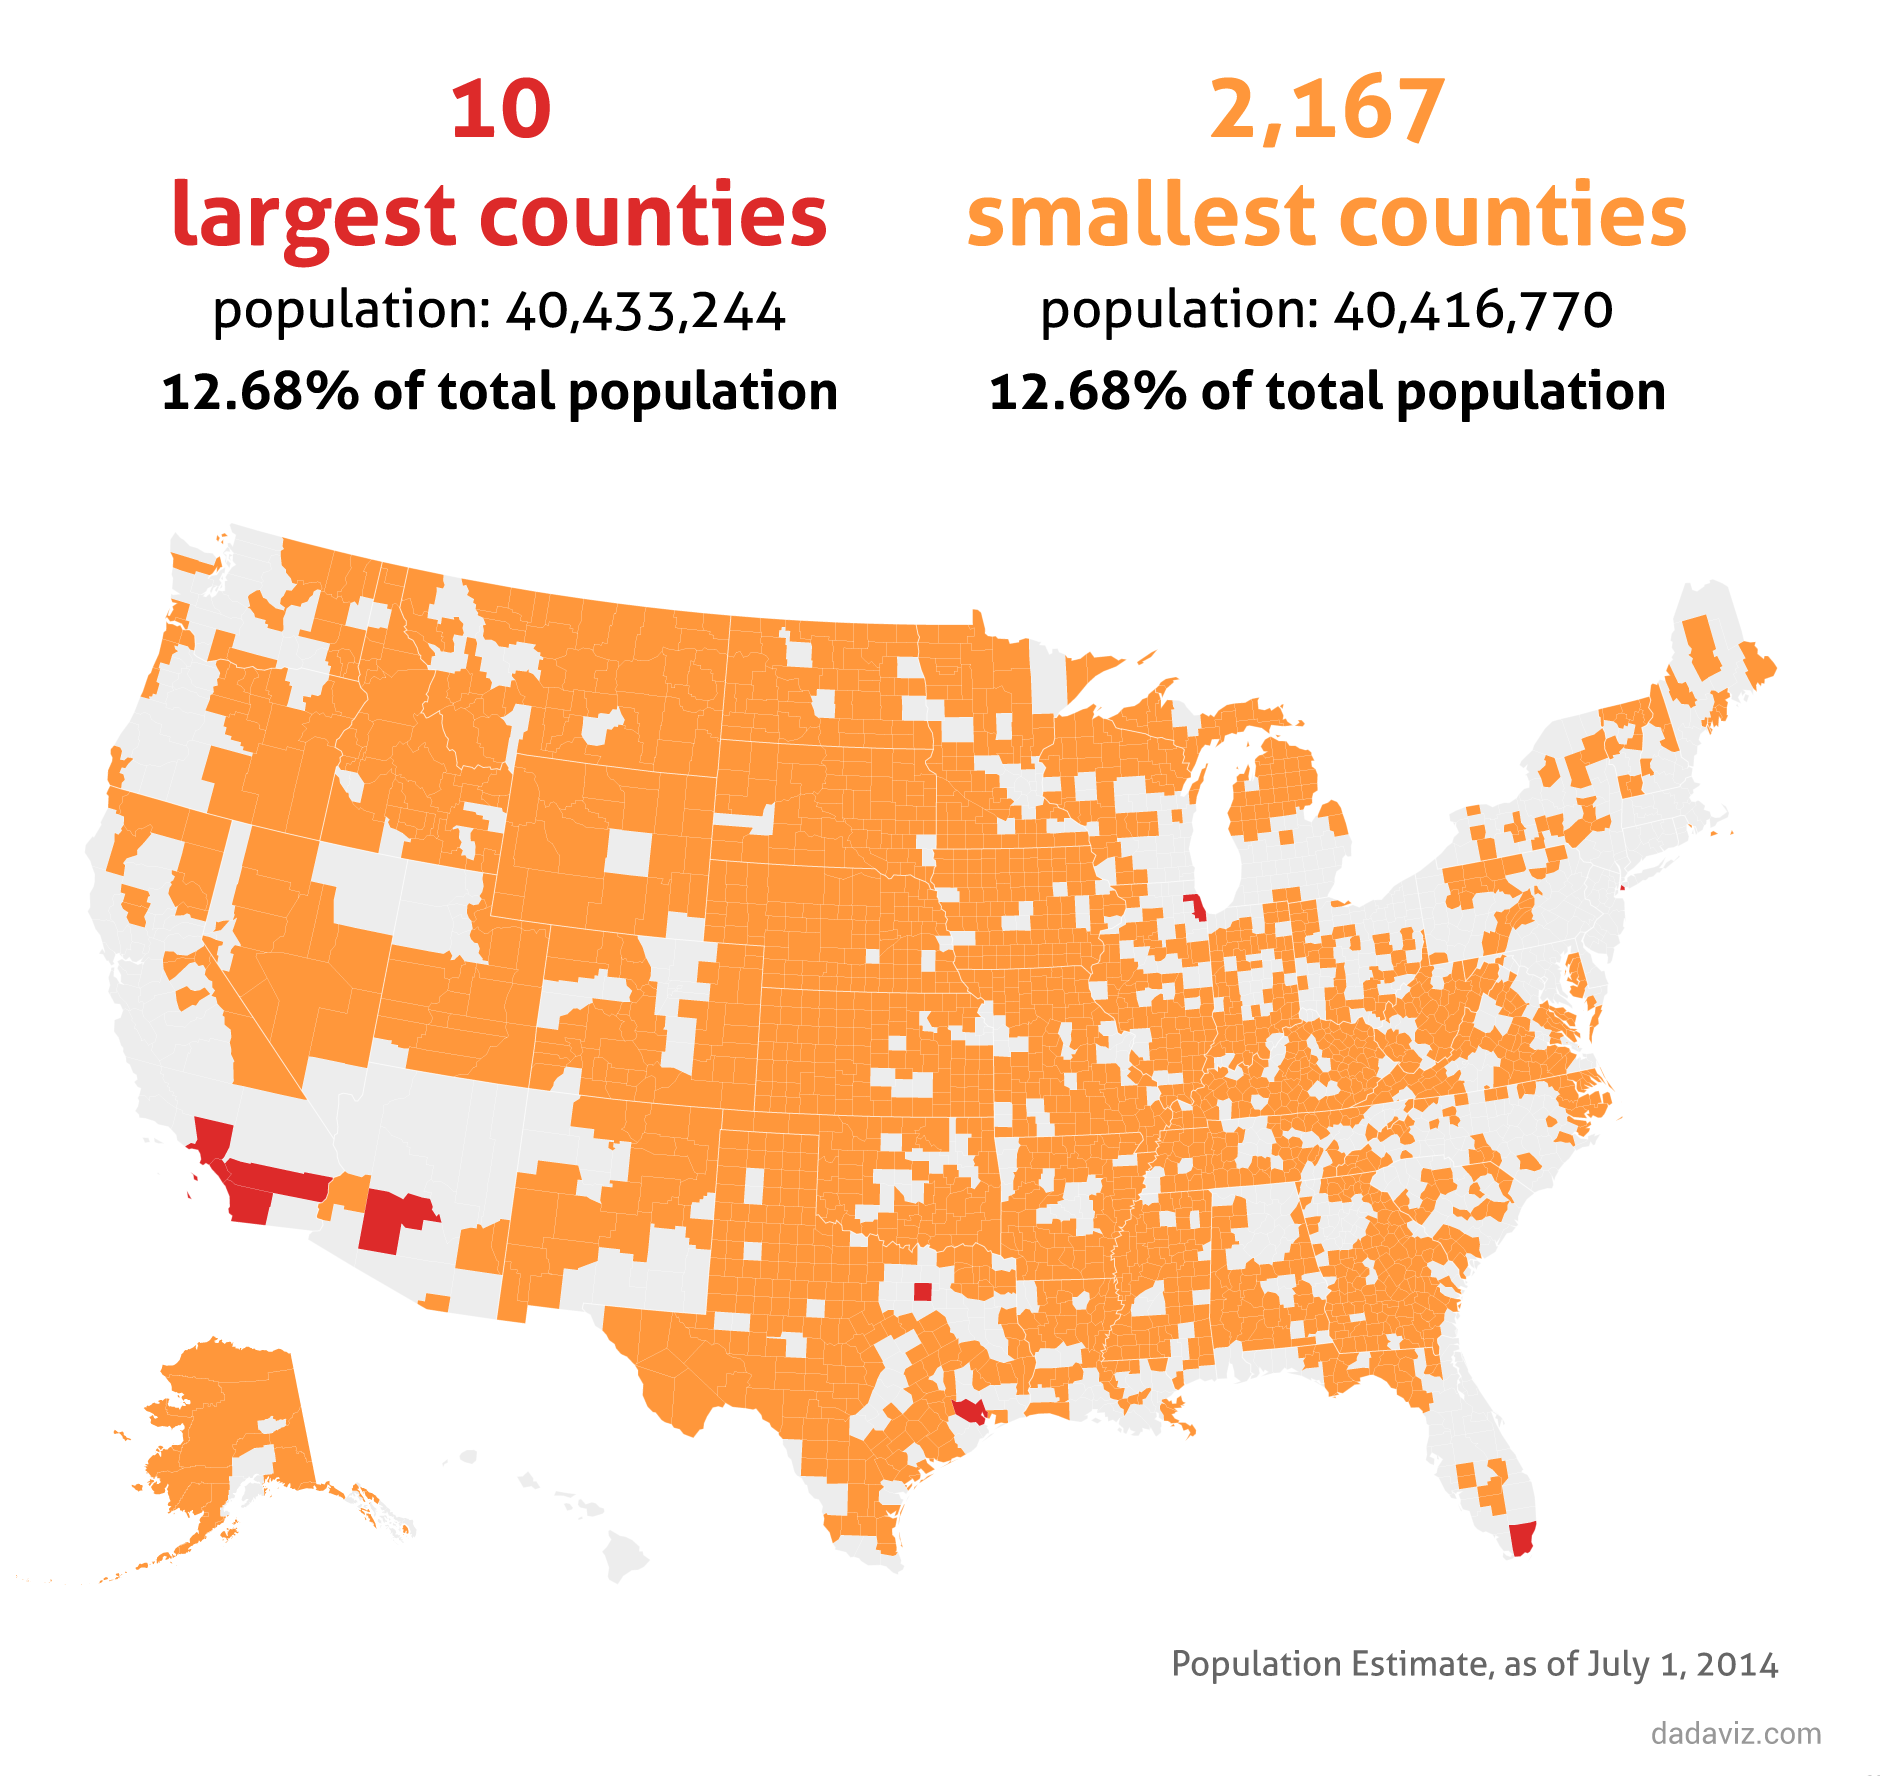
2) The 10 most populous counties have the same population as the 2,167 least populous:
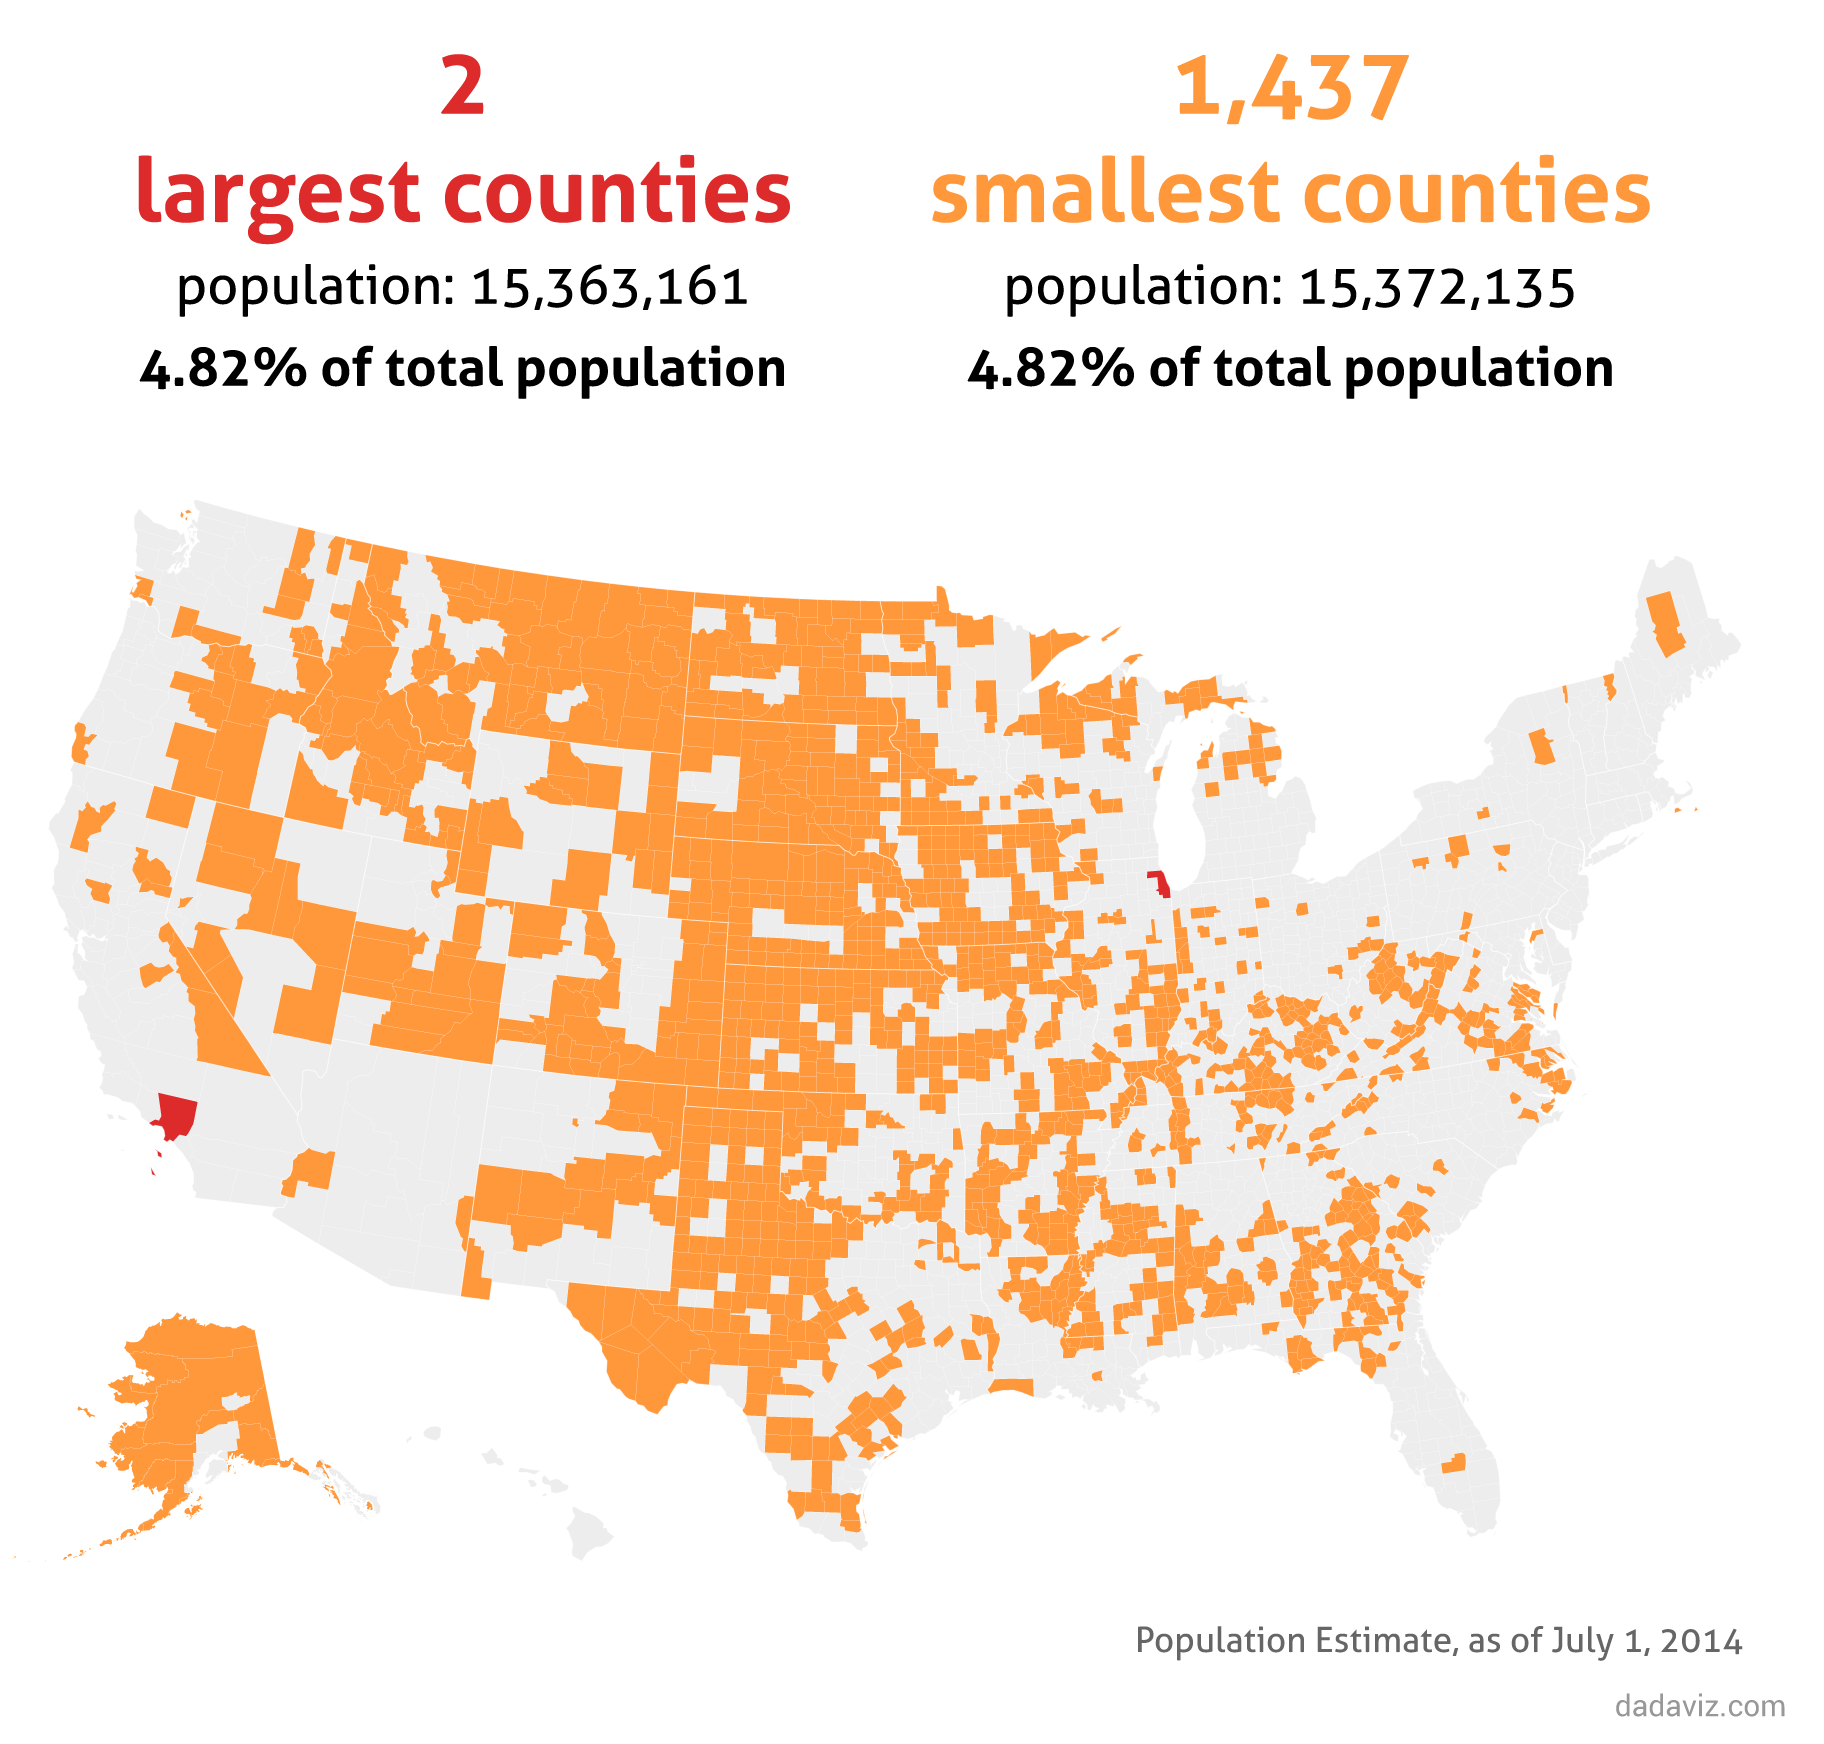
3) The two most populous counties have the same population as the 1,437 least populous:
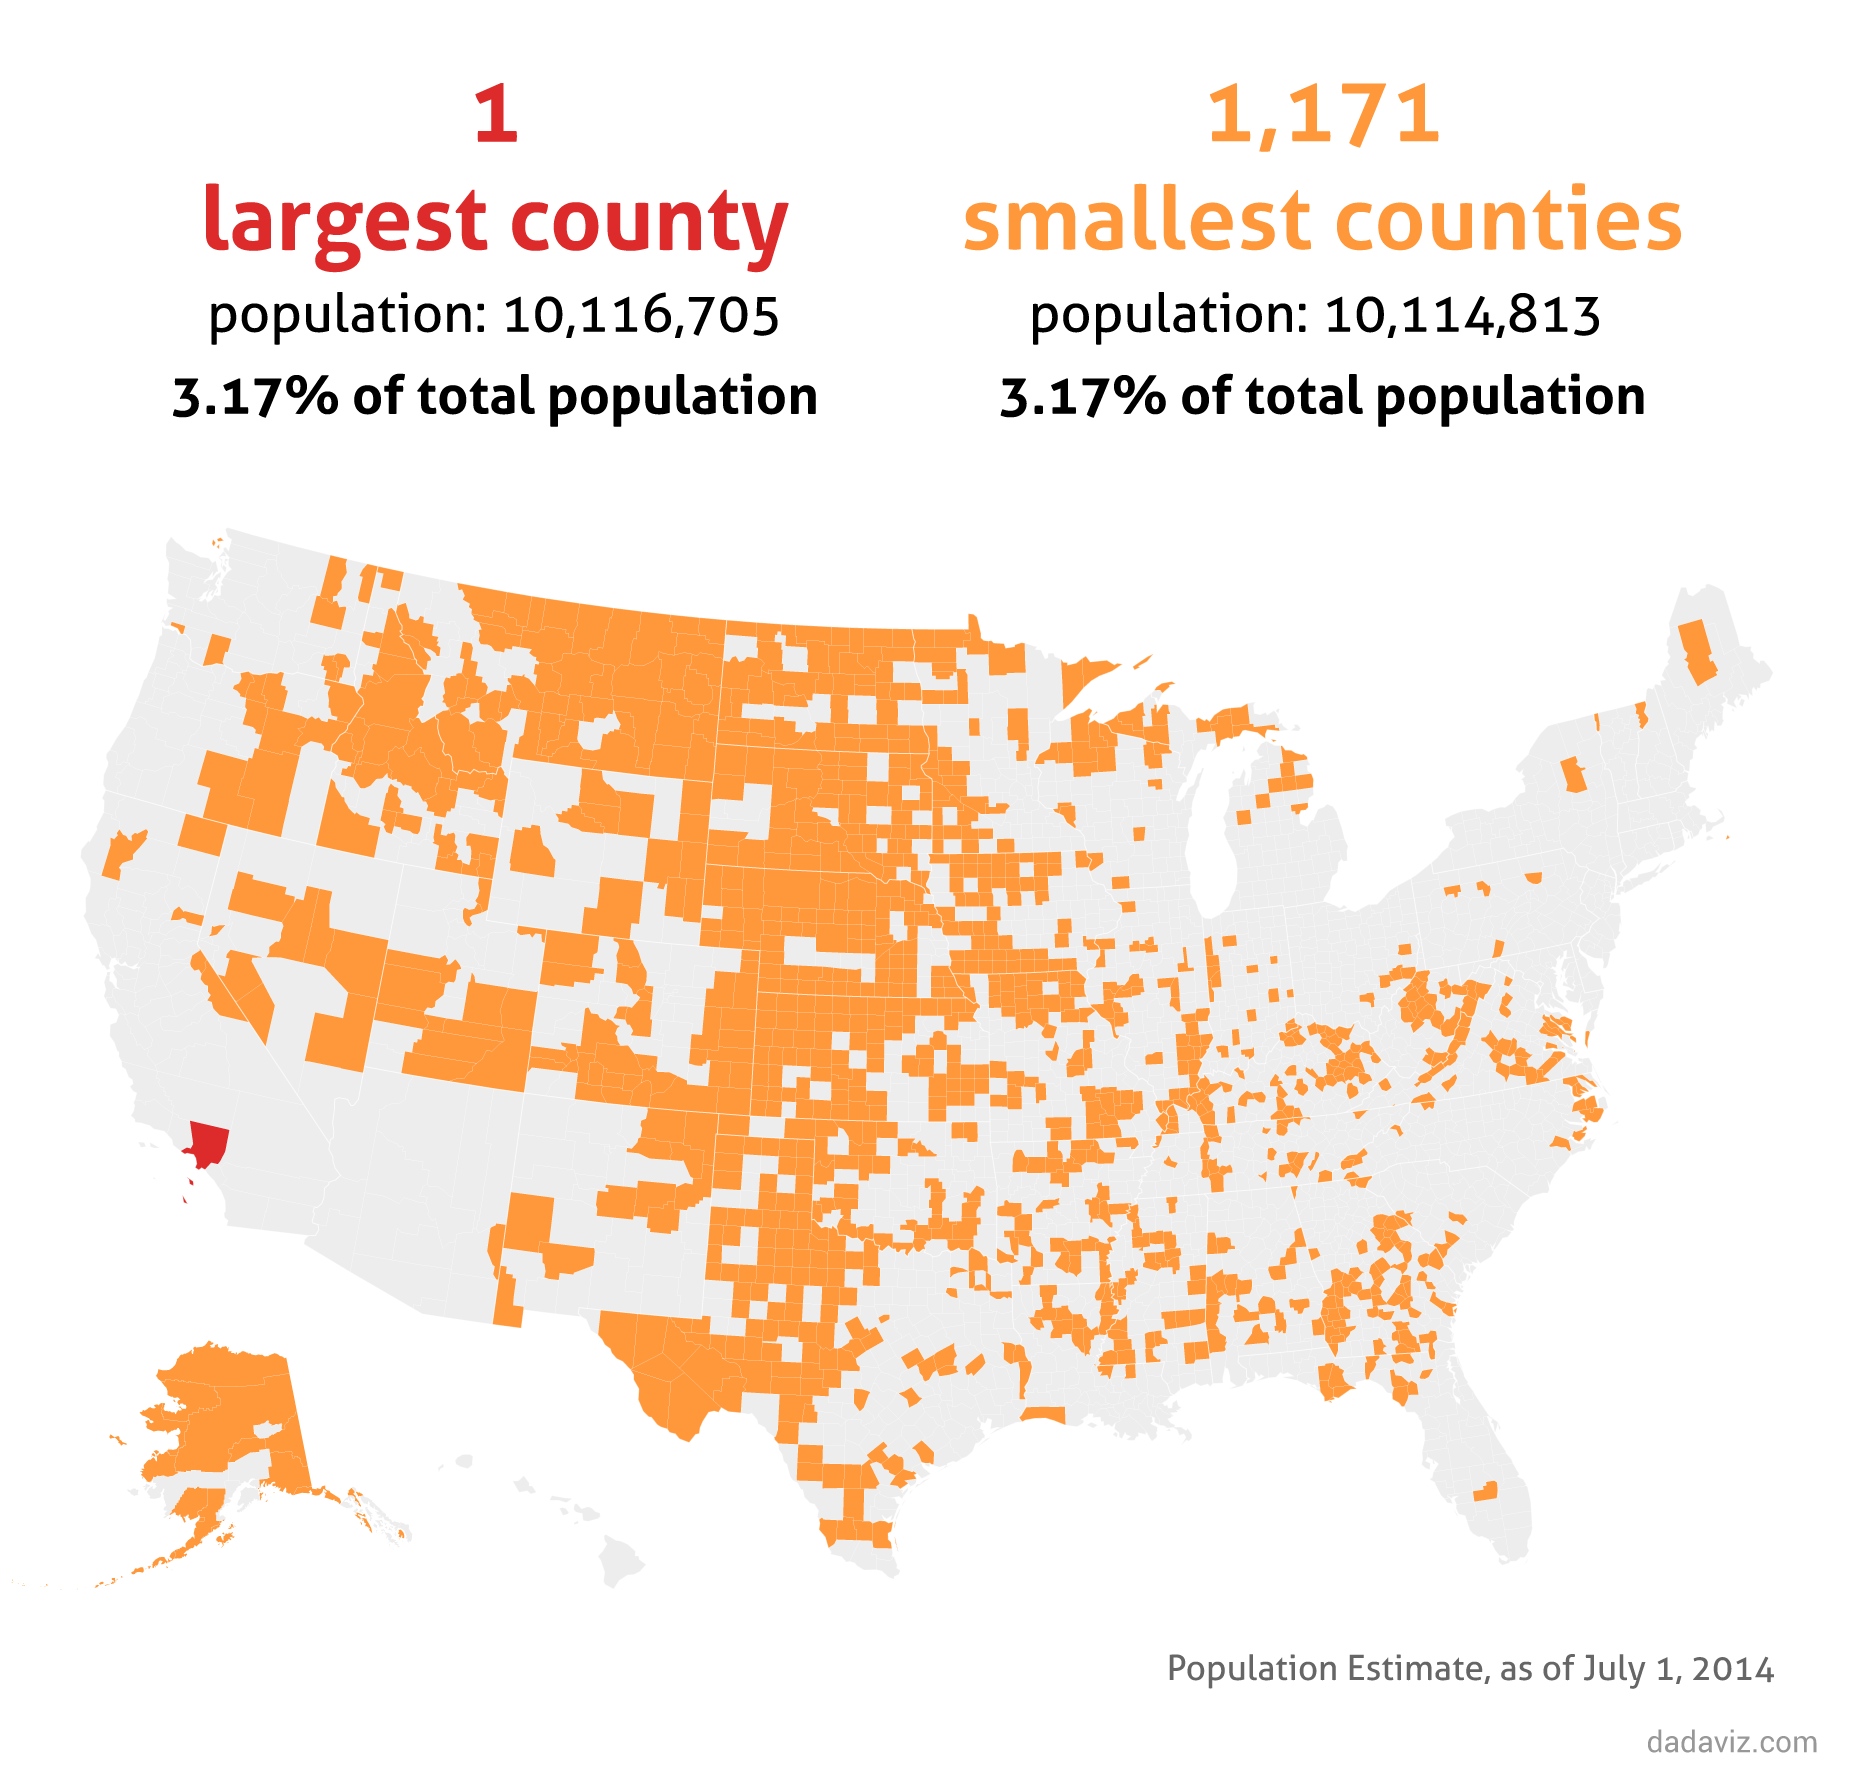
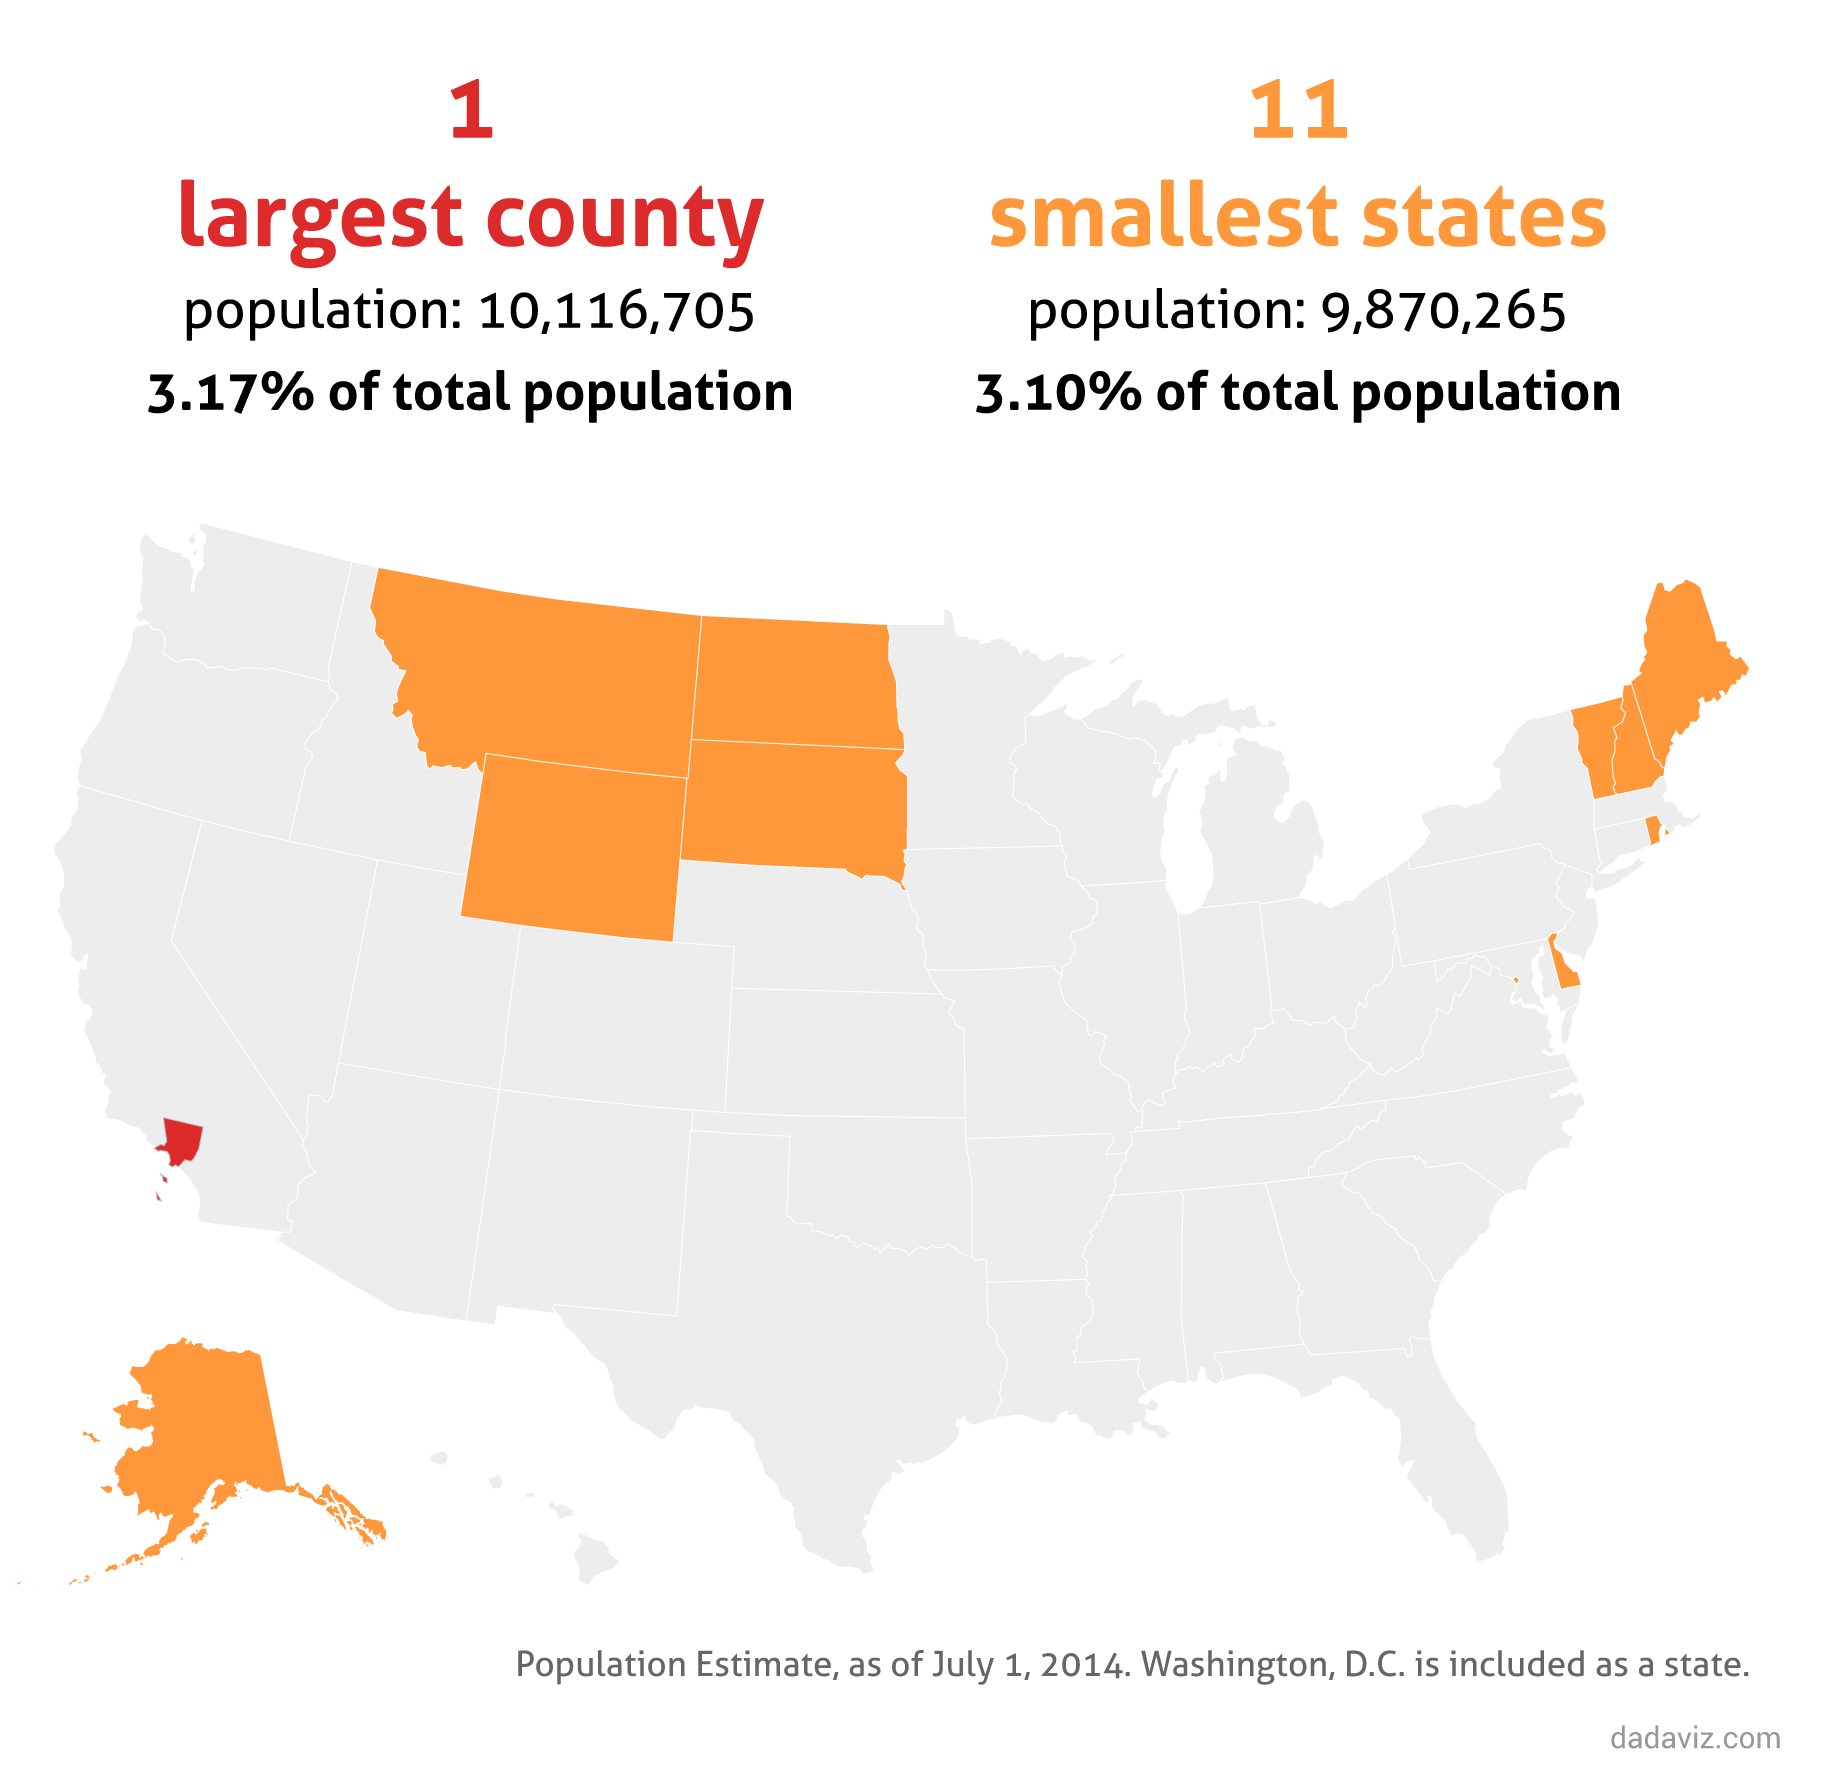
4) The most populous county (Los Angeles-Long Beach-Anaheim, CA) has the same population as the 1,171 least populous:
5) The most populous county has more people than the 11 least populous states:
Original graphics by: Dadaviz
Politics
Charted: Trust in Government Institutions by G7 Countries
How much do you trust the government and its various institutions? We look at data for G7 countries for the time period of 2006-2023.


Trust in Government Institutions by G7 Countries
This was originally posted on our Voronoi app. Download the app for free on iOS or Android and discover incredible data-driven charts from a variety of trusted sources.
How much do you trust the government, and its various institutions?
It’s likely that your level of confidence probably depends on a wide range of factors, such as perceived competency, historical context, economic performance, accountability, social cohesion, and transparency.
And for these same reasons, trust levels in government institutions also change all the time, even in the world’s most developed countries: the G7.
Confidence in Government by G7 Countries (2006-2023)
This chart looks at the changes in trust in government institutions between the years 2006 and 2023, based on data from a multi-country Gallup poll.
Specifically, this dataset aggregates confidence in multiple national institutions, including the military, the judicial system, the national government, and the integrity of the electoral system.
| Country | Confidence (2006) | Confidence (2023) | Change (p.p.) |
|---|---|---|---|
| Canada | 57% | 64% | +7 |
| Britain | 63% | 63% | +0 |
| Germany | 55% | 61% | +6 |
| France | 54% | 60% | +6 |
| Japan | 48% | 59% | +11 |
| Italy | 41% | 54% | +13 |
| United States | 63% | 50% | -13 |
What’s interesting here is that in the G7, a group of the world’s most developed economies, there is only one country bucking the general trend: the United States.
Across most G7 countries, confidence in institutions has either improved or stayed the same between 2006 and 2023. The largest percentage point (p.p.) increases occur in Italy and Japan, which saw +13 p.p. and +11 p.p. increases in trust over the time period.
In the U.S., however, confidence in government institutions has fallen by 13 p.p. over the years. What happened?
Key Figures on U.S. Trust in Institutions
In 2006, the U.S. was tied with the UK as having the highest confidence in government institutions, at 63%.
But here’s where the scores stand in 2023, across various institutions:
| 🇺🇸 Institutions | Confidence (2023) |
|---|---|
| Military | 81% |
| Judiciary | 42% |
| National Government | 30% |
| Elections | 44% |
| Overall | 49% |
Based on this data, it’s clear that the U.S. lags behind in three key indicators: confidence in the national government, confidence in the justice system, and confidence in fair elections. It ranked in last place for each indicator in the G7.
One other data point that stands out: despite leading the world in military spending, the U.S. is only the third most confident in its military in the G7. It lags behind France (86%) and the United Kingdom (83%).

-

 Technology6 days ago
All of the Grants Given by the U.S. CHIPS Act
-

 Uranium2 weeks ago
The World’s Biggest Nuclear Energy Producers
-

 Education2 weeks ago
How Hard Is It to Get Into an Ivy League School?
-

 Debt2 weeks ago
How Debt-to-GDP Ratios Have Changed Since 2000
-

 Sports2 weeks ago
The Highest Earning Athletes in Seven Professional Sports
-

 Science2 weeks ago
Visualizing the Average Lifespans of Mammals
-

 Brands1 week ago
How Tech Logos Have Evolved Over Time
-

 Energy1 week ago
Ranked: The Top 10 EV Battery Manufacturers in 2023