I often describe the stock market as a battlefield … And the evening star candlestick pattern is all about battle.
On the battlefield, preparation is key. All my posts tell you to study and arm yourself with knowledge. Take the opportunity now to join your fellow students in the Trading Challenge and prepare for battle.
The story begins in feudal Japan roughly 450 years ago. One of the three great generals to unite Japan, Oda Nobunaga, is attempting to wrest control of fertile rice lands from his enemy. Three rivers and a strong local defensive position stand in his way.
If Nobunaga is to win, his army must cross the rivers. Once they do, momentum will be on their side. But if his army is unable to cross the rivers, it will be a sign of bad things to come.
The army manages to cross the three rivers and he wins the battle. He gains control of new land and more rice — Japan’s hard currency at the time. His legend grows…
… fast forward to present day and…
Table of Contents
- 1 The Stock Market Battlefield
- 2 What Is the Evening Star Candlestick Pattern?
- 3 Benefits of the Evening Star Candlestick Pattern
- 4 Evening Star Pattern Example
- 5 Importance of Stock Indicators
- 6 How To Trade The Evening Star Candlestick Pattern in 7 Steps
- 7 Key Tips on Trading the Evening Star Candlestick Pattern
- 8 Frequently Asked Questions About the Evening Star Candlestick Chart Pattern
- 9 The Bottom Line
The Stock Market Battlefield
The scene: Stock market trader watching the computer screen, looking for the perfect moment to close a long position. Will the stock price continue to run? Or will there be a bearish reversal?
If the bulls win the battle, the trader can hold the position for more profit — like Nobunaga winning the battle in ancient Japan. But if the bears win the day, then it’s time to close the position and walk away.
A sign appears on the chart in front of the trader — the three rivers evening star candlestick pattern. The trader knows the chances of overcoming resistance is slim. Goals already met. It’s time to exit the position.

The trader places a sell order. Moments pass. The order executes and the trader leans back, thankful for the push to study patterns. Seem overly dramatic?
In my opinion, learning patterns is a key foundation of learning to trade. The names of Japanese candlestick patterns hint at emotional turmoil and refer to legends. It makes them more compelling to learn. But it goes deeper than the names and the stories.
As a trader, learning these patterns teaches you about market psychology. The battle between bulls and bears is a psychological battle. Arm yourself well and you could walk away victorious. But failure to understand the patterns could spell the end of your trading career.
What Is the Evening Star Candlestick Pattern?
A star candlestick is a reversal pattern. It signifies the momentum of a recent trend is slowing. The evening star candlestick pattern is a bearish reversal. Upward momentum, controlled by the bulls, begins to lose steam. The star is a period of balance between bulls and bears with little price movement. Then momentum shifts and the bears gain control.
I’ll show you an example on a real chart, but first, take a look at the graphic. It gives you the characteristics of the evening star candlestick pattern.
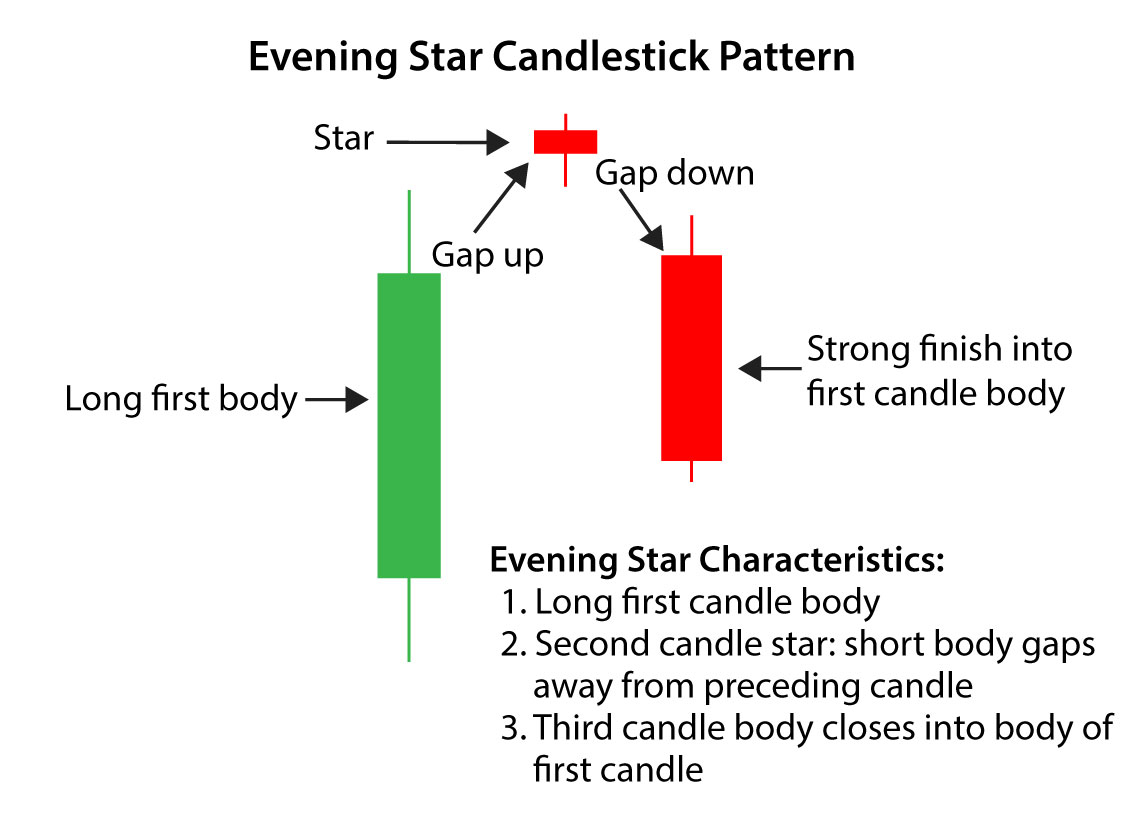
The first candlestick has a long body and is bullish — the price closes higher than it opened. Then, in the ideal evening star pattern, there is a gap up to the second candlestick. This is the star.
The star signals a slowdown in momentum. It either has a short body (called a spinning top candlestick) or nobody (called a Doji candlestick). It can be either green or red. The main thing to understand is there’s a balance between buyers and sellers.
The third candlestick is bearish — the opening price is higher than the closing price. The ideal evening star gaps down from the star to the third candlestick. The third candlestick finishes sharply into the first candle body.
Note: in the evening star pattern you pay more attention to the candle body than the shadow. Shadows are the lines extending above and below the candle body. They represent the trading range for the period. The candle body represents the open and close prices. A green candle closed higher than it opened. A red candle closed lower than it opened.
What Is the Morning Star Pattern?

The morning star pattern is the opposite of an evening star candlestick pattern. It’s a reversal pattern from a bearish to a bullish trend.
Like the evening star pattern, there are three candles with the middle candle having a long shadow to the downside that’s been bought up by the bulls. The third candle is the confirmation of the pattern turning to the upside.
You want to see the morning star pattern combined with increased volume. It’s also a more convincing pattern if it occurs around a support level.
New to trading penny stocks? Get my FREE online guide here.
How Does the Evening Star Pattern Work?
As I said earlier, the evening star candlestick pattern is an indication of a trend reversal.
The evening star pattern works as a visual guide of what’s going on in investor sentiment. The day of the evening star candle is the day of indecision between the bulls and bears.
If the third day is a gap down it may be a good indication to sell a long position. Or you might want to short the stock to take advantage of the downward move.

Benefits of the Evening Star Candlestick Pattern
All the star patterns (yes, there are others, including the morning star pattern) are reversal patterns. They all represent a stalemate between buyers and sellers. The benefit to you as a trader is that they are predictable.
A word of caution before we look at a real-life example: This is not an exact science. It’s based on experience and study — but that doesn’t mean it happens every time. You need to study!
One more word of caution: When you look at charts in different time frames, you might not see the same pattern.
I used a one-minute candlestick in the chart example below. When I looked at the two-minute candlestick for the same chart, the pattern was different. It was a bearish engulfing pattern — another reversal pattern. It confirmed what I was seeing in the one-minute candlestick chart.
The lesson to be learned by using different candlestick periods: perspective can make a huge difference in stock charts.
Let’s look at the evening star candlestick pattern on a real chart…
Evening Star Pattern Example
Look at the Boxlight Corp. (NASDAQ: BOXL) chart below. The three candlesticks in the yellow rectangle are the evening star pattern.
The first candlestick has a long body and is bullish. The second candlestick is short and in this case, it’s green, or bullish. The third candle reverses the trend, finishing sharply into the body of the first candlestick.
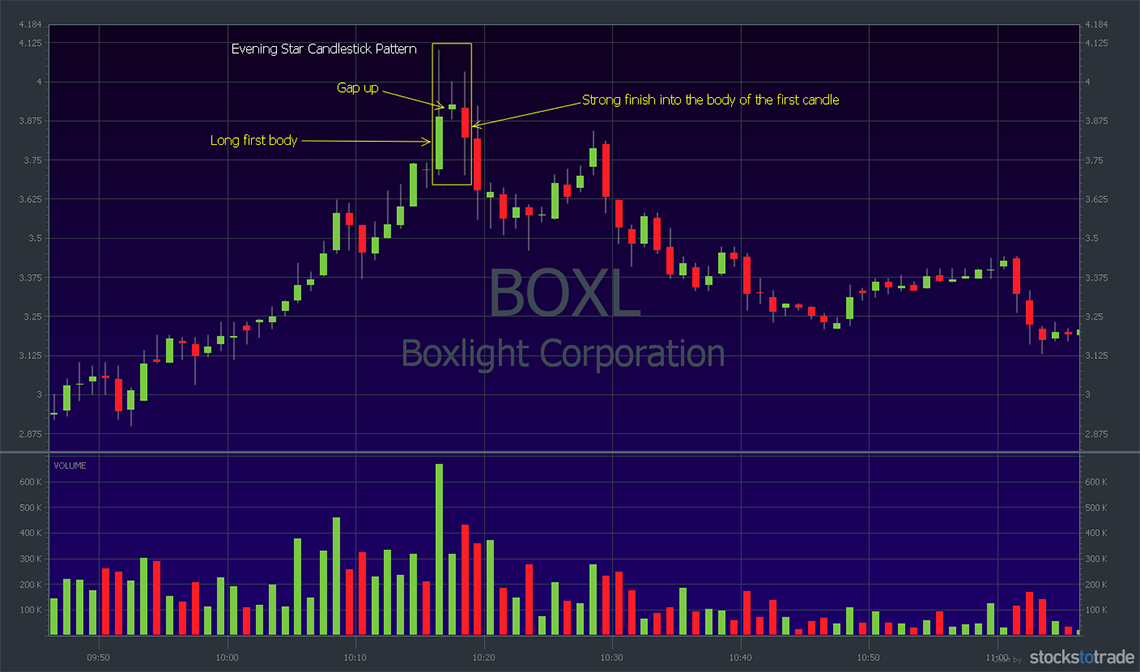
The classic evening star candlestick pattern has a gap up between the first and second candle bodies. You see this in the chart above. An ideal evening star would also gap down between the second and third candle bodies.
In the BOXL chart example, there’s no gap down. That’s OK. The perfect gap up and gap down is rarely evident and not necessary for the success of the pattern. This is especially true of intraday charts.
Steve Nison, author of “Japanese Candlestick Charting Techniques,” makes this point clear in his book. Nison brought Japanese candlestick charts to the West. The book is a classic and well worth your time if you want a better understanding of candlestick charts.
(As an Amazon Associate, we earn from qualifying purchases.)
Three White Soldiers and Black Crows
Three white soldiers (or green soldiers) is a bullish candlestick pattern. It’s used as an indication of a reversal after a downtrend on a chart.
The three soldiers are consecutive long-bodied white or green candles. They open within the body of the previous candle and close above the previous candles close. There generally aren’t long shadows on the candles.
The opposite of this candlestick pattern is the three black crows. They indicate a reversal of an uptrend.
Three Inside Up and Down
Three inside up and down is another reversal pattern. It can be the reversal of an uptrend or a downtrend.
This pattern requires three candlesticks to appear in a specific sequence. In an uptrend reversing to the downside, it will be a long white or green candle, followed by a short black or red candle that opens and closes within the body of the first candle. The third candle will be a black or red candle that closes below the close of the previous candle.
On a downtrending chart reversing to the upside, the candles will be the opposite.
Importance of Stock Indicators
Many traders use technical indicators in conjunction with patterns. Together they can provide powerful information to guide your trading plan. One of the most common indicators to use along with the evening star candlestick is the relative strength index (RSI).
RSI Indicator
The RSI indicator measures momentum to determine whether a stock is overbought or oversold. Overbought or oversold conditions, as measured by RSI, signal a likely reversal.
There are two reasons to use RSI with the evening star pattern. First, to check daily RSI levels for an overbought condition. Then, once you change the time frame (step #4 below), use RSI to confirm the reversal.
How To Trade The Evening Star Candlestick Pattern in 7 Steps
Let’s put this in perspective. If you hang out looking for evening star candlestick patterns to trade, you could be waiting a while. It’s a pattern that happens sometimes. It’s good to recognize it and even have a plan for when you see it…
… but I wouldn’t call it a trading strategy. If you’re ready to develop a strategy, take the time now to apply for the Trading Challenge.
While you’re waiting for our team to review your application, here’s one way to trade the evening star pattern…
#1 Set the Right Chart Time Frame
Setting the right time frame depends a lot on your trading strategy. You can (and should) change the time frames I’m giving you to suit your strategy. You should practice with paper trading to test your thesis.
For the sake of understanding evening star technical analysis, let’s imagine you’re looking at a longer-term chart. Let’s say it’s a one-year chart with one-day candlesticks. You’re starting with the longer-term chart to get the big picture of price action.
#2 Get to Know the Open, High, Low, and Close Prices
If you look at a chart with one-day candles, you’re essentially doing this. You’re looking at the daily open and close prices (the candle body) and the high and low prices (the shadows or wicks). In case you’re new to candlesticks, the graphic below explains it.
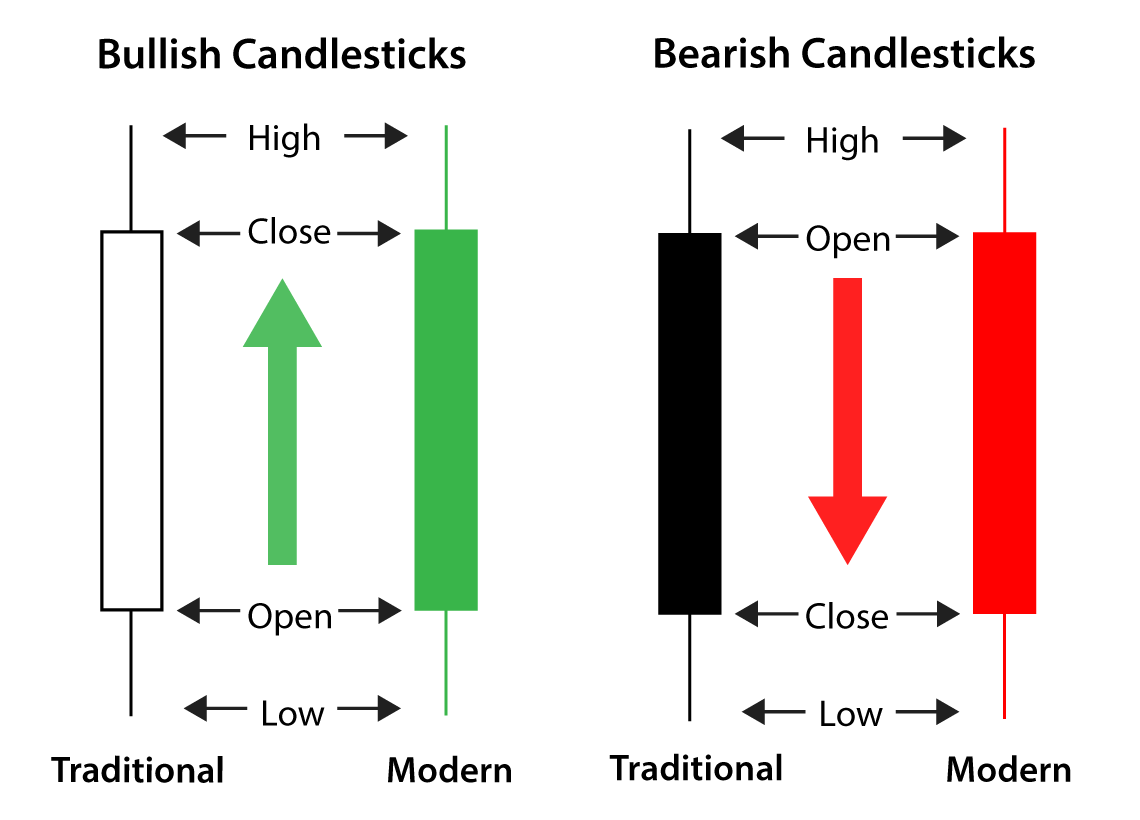
To recognize an evening star chart, you need to be familiar with the above graphic. To understand price action on any candlestick chart, this is basic knowledge. Study up.
#3 Wait for the Daily RSI to Cross Above 70
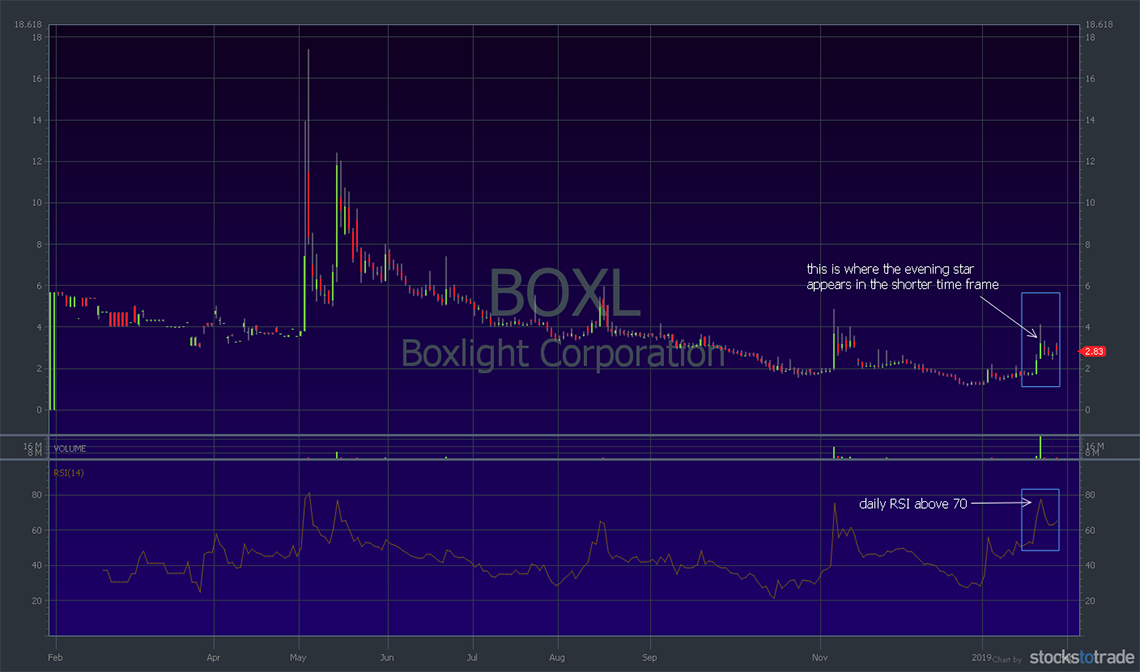
A lot of traders consider an RSI cross above 70 to be a clear overbought signal. It’s a common strategy used by forex traders. Let’s go back to the BOXL chart but add in the RSI indicator.
Below is the one-year chart with daily candlesticks. I put a rectangle around the daily RSI above 70 and where the evening star appeared on the previous chart.
#4 Downgrade the Time Frame
Once you identify the overbought condition (RSI above 70) on the longer-term chart, it’s time to zoom in. A common time frame for this is the five-minute candlestick chart. Many traders like it because it’s not too fast or too slow.
I want to reiterate the difference in charts when looking at different time frames. While downgrading the time frame to the five-minute chart is one way of playing this, it’s not set in stone. As I said above, the evening star didn’t appear in the two-minute candlestick for BOXL. It also didn’t appear in the five-minute candlestick chart.
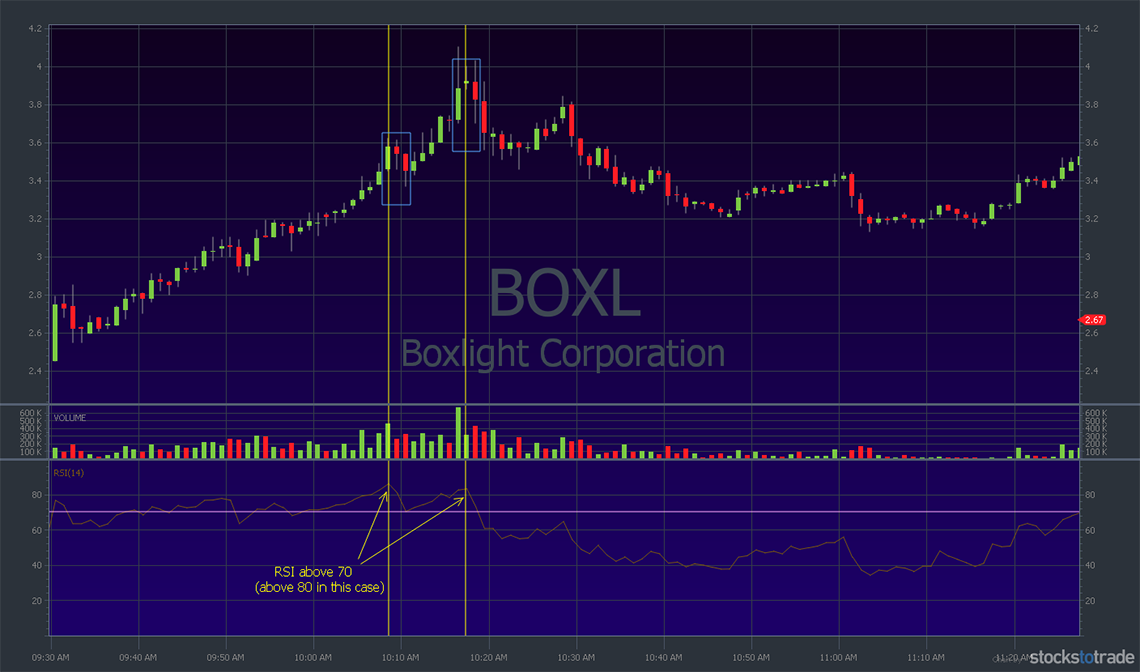
For the sake of continuity with our example, let’s go back to the BOXL one-minute candlestick chart and add the RSI. I put a horizontal line across the RSI at 70 (pink). Notice, in this case, the RSI actually goes above 80.
This can happen when you shorten the period. Remember, the RSI is calculated using a certain number of periods — 14 is most common. The shorter time frame on this chart magnifies price action in the RSI.
Looking at the chart, follow the vertical yellow lines up the chart to the candlesticks. Notice the pullbacks right after RSI peaks? The RSI gave the ‘overbought’ signal when it moved between 70 and 80. Both times (the second is our evening star pattern) the price pulled back.
#5 Short Selling
Short selling is when you borrow and sell shares of a stock. You borrow at a high price and expect the price to drop. Assuming the price drops, you then buy shares at a lower price to pay the shares back to the broker. It’s how some traders approach a downtrending market or on a downtrending stock.
Word of warning: I don’t recommend shorting for newbie traders. It’s a risky and difficult strategy. You could get caught in a short squeeze.
That said, let’s break down how the evening star pattern can signal a bearish reversal and a potential short play.
You keep an eye on the price action for the stock you want to short. Depending on the time frame you’re using, you watch for the stock to rise and for the star to appear. But you don’t jump in when you spot the star. You wait.
Why?
Because you want to confirm the reversal first. Again, shorting is a very risky strategy.
You need access to shares to short. Not all brokers will have shares to borrow. Make sure you know exactly what you are doing. Have a plan. So you need to be sure you can find shares to short. Then, wait until the third candlestick confirms the pattern. Finally, sell and wait for the price to drop.
What do you do if the price reversal doesn’t pan out?
Follow my #1 rule and cut losses quickly. When you short, you lose money if the share price rises above your entry price. That’s because you pay more for the shares needed to close your position.
So you need to…
#6 Establish a Stop Loss
A stop loss is your pre-set exit price if the trade goes wrong. You can set stop losses set electronically, but I’m not a fan. I set a mental stop. If the price moves too fast, your stop loss can get passed by. That’s called slippage.
If you use a mental stop loss, you can adjust. You can find the best available price to buy shares and close your position. In a short position, your stop-loss is higher than your entry price.
For example, you see the evening star pattern and short 500 shares at $1 each. But instead of continuing to drop, the price goes up. You decide to cut losses. Your mental stop loss is at $1.05 per share. You buy the shares at $1.05 and close your position. You lose $25 (500 shares x $.05 per share lost = $25).
Now, if you get caught in a short squeeze with an electronic stop loss, you could far more than $25. So predetermine your mental stop loss and then stick with it. If there’s some slippage past your stop loss, get out as soon as possible.
Assuming everything goes well, when do you close your position? Some traders say you should wait until the RSI drops below 30. I’d rather you had a clear trading plan going in and stick to it. That may or may not involve further use of the RSI.
Now it’s time to…
#7 (Hopefully) Take Your Profits!*
If your trade went well, enjoy the reward. Set your target before the trade. I often aim for 10%, 20%, or 30%. Those singles add up. Remember, my results aren’t typical. Trading is risky. Be aware you can lose money. Do your own research and never risk more than you afford to lose.
Key Tips on Trading the Evening Star Candlestick Pattern
Here are some tips for trading the evening star pattern …
Use a Stock Screener
But don’t use any old stock screener. Of course, if you’re just starting you can use something free like Yahoo Finance…
But when you’re ready to get serious about a stock screener, I think there’s no better choice than StocksToTrade.
Every day I’m amazed and grateful for this platform. It has all my favorite screens built-in (I helped design the platform and I’m an investor). But you can set custom screens to match whatever you’re looking for.
StocksToTrade’s newest tool, the Breaking News Chat is a game-changer. Two former Wall Street pros sift through news and only post the news that’s most relevant to the stocks I trade. It’s how you can be one of the first to see the news that can move stocks.
If you’re wondering why you should pay for a stock screener, let me lay it out. Free stock screeners have a data delay. If you’re going to day trade, you need real-time access. These volatile stocks move fast.
Plus, you get better tools all around — including access to OTC Markets (OTCMKTS) data. Not all screeners have this.
Stick to Your Trading Plan
You have a trading plan, right?
There are a limited number of patterns and a limited number of things you need to put in your plan. If you get on it and learn them, you can start creating a trading plan. Then, when the time comes to trade, you’ll know exactly what you’re going to do in any situation.
That’s power!

Never Stop Learning
This is the most important part of this entire post.
You can learn patterns like the evening star pattern. You can learn about setups and risk/reward. You can learn everything you need to learn to make a trade. But trading is vast, and no two traders are exactly alike.
I have top students who trade completely differently from me. I like to keep things simple with setups like the first green day or morning panic. But I have students who love to short or study technical indicators like the MACD or the RSI.
Some are trading small accounts and a few are trading massive accounts.
As you change and grow, what you need to know to be successful changes. It’s kinda like being rich. Nobody tells you how to act and behave once you have wads of cash. It’s a learning curve.
An excellent way for you to keep learning as a trader — starting today — is to apply for the Trading Challenge.
Frequently Asked Questions About the Evening Star Candlestick Chart Pattern
What Is the Evening Star Pattern?
The evening star pattern is a stock chart pattern that some traders use to spot a trend reversal. This three-candle chart pattern shows the bulls are running out of steam and the bears are about to take over the stock’s price action.
What Are the Differences Between Evening and Morning Star Patterns?
The evening star candlestick pattern can indicate that a stock’s uptrend may be about to reverse. The morning star candlestick pattern is the opposite — and may indicate an opportunity to buy when the stock’s downtrend reverses.
What Is the Best Candlestick Pattern to Trade?
That depends on your trading strategy. Smart traders look for patterns with multiple indicators that line up to support their thesis. It’s also key to look at multiple time frames, catalysts, and indicators like volume.
How Do You Trade the Evening Star Candlestick Pattern?
Learn to recognize the patterns and join the trend. If you’re long a position, this pattern can be a sign to exit your position. If you short sell, the evening star trend reversal can be a cue to ride the downside momentum.
The Bottom Line
The evening star pattern signals a trend reversal from a bullish to a bearish. Traders who spot this pattern may use it to determine when it’s time to exit long positions or enter short trades. Study up!
Join my Trading Challenge to get access to all my live webinars, DVDs, video lessons, and to learn my favorite patterns to trade.
I want to hear from you! Do you use the evening star candlestick pattern when you trade? Comment below and let me know how it works for you.

Leave a reply