Sentiment Analysis: Definition, Importance, Indicator Types, Benefits and Examples
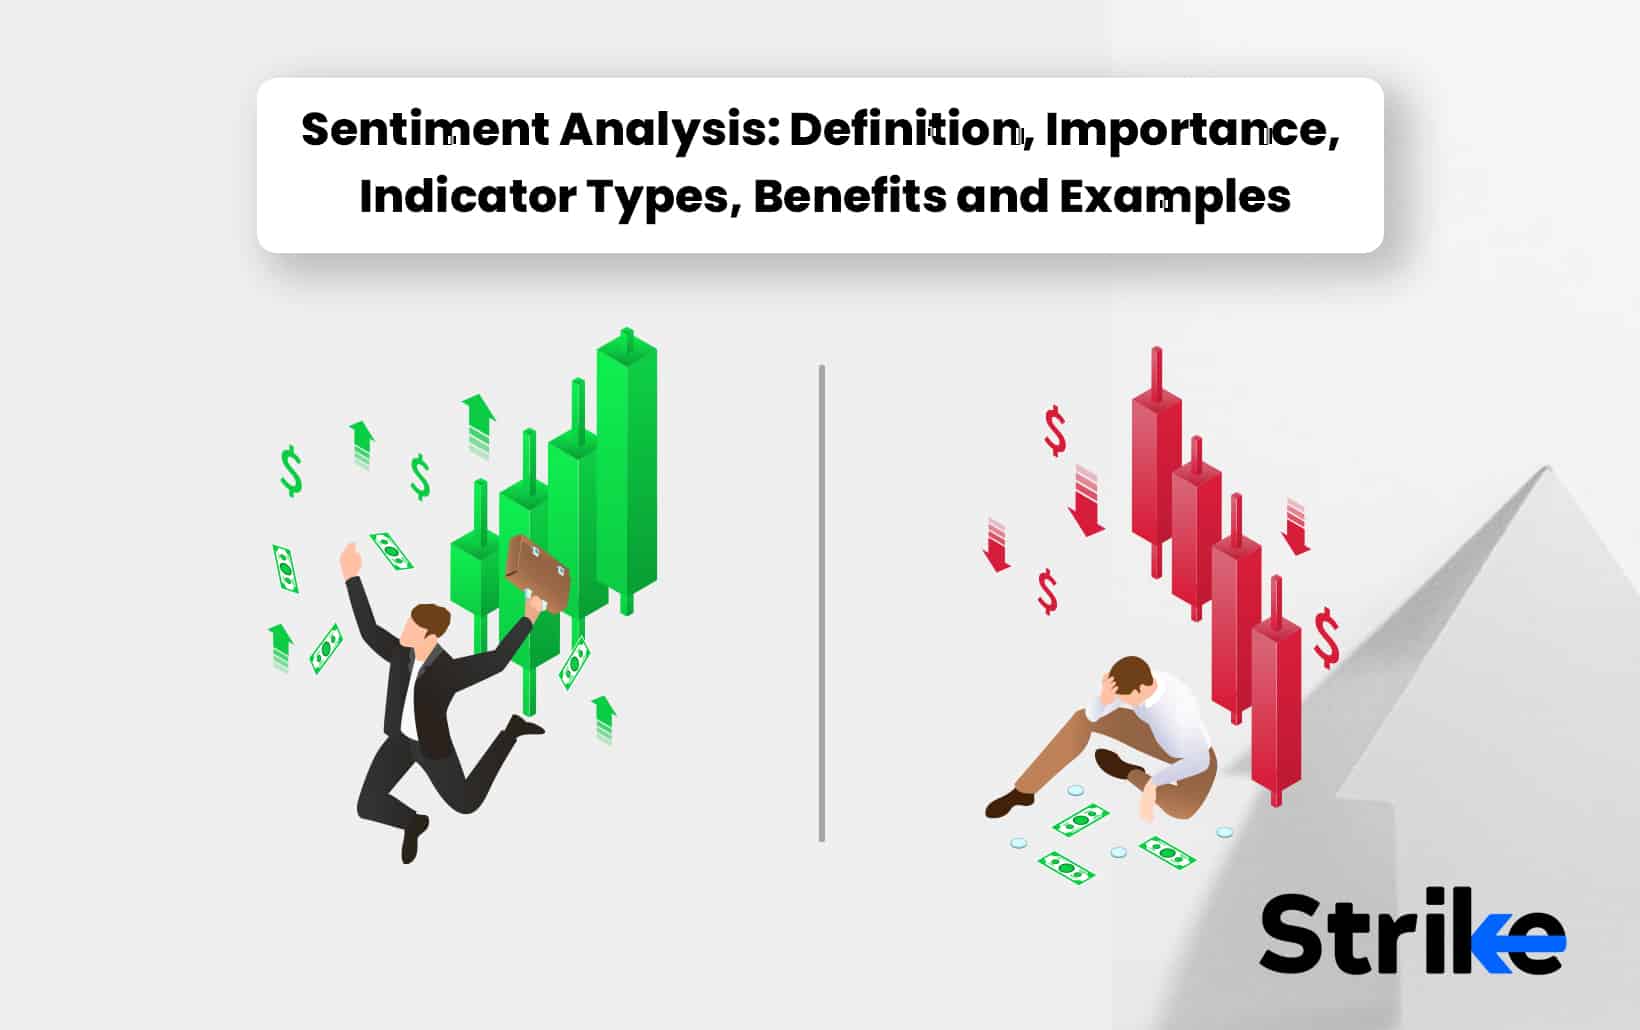
Table of content show
Sentiment analysis refers to the process of computationally determining whether information like content, texts or social media posts convey positive, negative or neutral opinions. Sentiment analysis allows traders to gain insights into market emotions and behavior. Understanding overall investor sentiment can provide valuable context for interpreting chart patterns and technical indicators.
There are different types of sentiment indicators. Surveys poll individual or institutional investors about their outlook. News analytics determine if news articles on companies or the broader economy are optimistic or pessimistic. Social media sentiment analysis mines data from forums, blogs and platforms like Twitter to quantify positive or negative comments. Alternative data sources track data points like Google searches, restaurant reservations and online retail sales.
Excessively bullish or bearish sentiment readings can foreshadow potential trend reversals as markets may become “overbought” or “oversold”. Sentiment scores near an extreme could flag an asset as vulnerable to a pullback. Divergences between sentiment and price action may also occur before reversals. Tracking shifts in investor psychology provides context on herd behavior and crowd emotions influencing markets, sentiment is also triggered by certain price action on a daily basis to trap traders. It helps determine sustainability of current trends or predict short-term swings. Overall, sentiment analysis offers a behavioral dimension complementing technical and fundamental analysis. When incorporated strategically, it yields insightful macro perspectives on market cycles and vulnerable areas.
What is Sentiment Analysis?
Sentiment analysis, also known as opinion mining, is a natural language processing technique that identifies and extracts subjective information from source materials. The goal of sentiment analysis is to determine the attitude, opinions, or emotions expressed within a text toward certain topics, individuals, events or entities. This is done by analyzing text data using techniques like text analysis, computational linguistics and biometrics.
Sentiment analysis is the study and understanding of the psychology, perspective, opinion and sentiment of the market participants.
The demand and supply of the market is in turn triggered by constant sentimental drive between traders and investors.
Market and economic related information is subjective. The subjective approach of market knowledge leads to generation of specific sentiment. This sentiment becomes the fuel and trigger for further development in the trends of particular stock or overall broader market.
The listed stocks have their specific social media handles and channels and thereby convey the messages related to company’s performance or company’s history or strategies to grow the business by their respective social media handles, email marketing or appearing on news channels.
This way sentiment is usually created that in-turn has potential to impact the stock’s overall performance.
Sentiment analysis has become an increasingly important tool for organizations to understand how people feel about their products, services, initiatives or campaigns. It provides insight into the general public opinion, customer experiences, and reactions to campaigns. Sentiment analysis solutions process text data from surveys, reviews, social media, online forums and other sources to classify the underlying sentiment as positive, negative or neutral. Advanced systems identify more nuanced sentiments like joy, sadness, anger, and surprise.
The market related news that has potential to affect the demand and supply of a stock is directly or indirectly affected by change in sentiment of public participants. The sentiment is measured by public opinion on social media platforms or the sentiment is directly reflected onto market action by observing market trends.
Sentiment analysis has broad applications across domains like business, politics, social media analytics, and public health. Companies use it to develop marketing strategies, understand customers, and monitor brand reputation. In business, it is used to gain real-time insights into customer experiences to improve products or services based on feedback. Politically, public opinions and attitudes are measured from tweets, posts, surveys, and news content. Sentiment analysis also has growing use in social media monitoring, contextual advertising and customer relationship management.
How Does Sentiment Analysis Work?
Sentiment analysis is a methodology that understands the psychological characteristics and behaviors of market participants. The sentiment of market participants is the driving force behind market’s demand and supply cycles that causes the prices to fluctuate and cause movement.
In today’s era of capital markets, market volatility is constantly prone to immediate change in effect that is important for traders and investors. Predicting this market volatility is very uncertain thus the sentiment analysis comes into picture. The concept of sentiment analysis involves analyzing public opinion, psychological perspectives, sentiments and opinions regarding particular stock, sector or industry. It assists in finding volatility and broader market trends.
Sentiment analysis works by learning and understanding the emotions, perspectives, opinions and core philosophies found in the media which is defined as opinion mining. The end result is figuring out the polarity of market sentiment which can be bullish, bearish or neutral.
Sentiment analysis involves looking at social media posts, news reports, opinions of experts and going through published reports and researches to understand the opinions of these expert economists, media people and veteran traders and investors. This way sufficient volume of shares can be altered.
By studying the texts, sentiment analysis tools can spot connections and behavioral similarities between stock price movements and sentiment. Investors and traders thus use various indicators and algorithms to determine market sentiments.
For example, a strong bullish signal conveyed by a major economist and a positive news regarding a particular sector in which that stock exists has potential to become a complementary analysis that can trigger market sentiment to turn bullish and eventually have the stock get into a bull run.
What is the Importance of Sentiment Analysis?
Sentiment analysis is important for understanding people’s opinions and emotions towards products, services, organizations, individuals, events, and topics. Sentiment analysis has become an increasingly important technique across various domains because its ability to automatically extract subjective information from textual data at scale enables numerous applications. Thus, owing to the proliferation of opinion-rich online content.
For businesses, sentiment analysis is a key tool to gain real-time insights into public and customer opinions to support data-driven decisions. It provides a pulse on the market by analyzing customer satisfaction, attitudes towards brands, reception of campaigns or product features, and tracking brand reputation. Companies use it to develop marketing, communication and business strategies. It is invaluable for customer relationship management to improve products or services based on feedback.
Sentiment analysis of financial news, earnings calls, analyst reports and other content allows hedge funds and stock traders to generate trade signals by gauging overall market sentiment. The scores are fed into quantitative models for algorithmic trading in stocks, FX and other tradable assets. Broad market sentiment indices are offered by vendors to provide insights into investor psychology.
Sentiment analysis is thus crucial for gathering instant insights that drive competitive advantage. It enables marketing analytics, contextual advertising, predictive analytics, brand tracking and several other applications. With exponential growth of unstructured opinionated text on digital platforms, sentiment analysis promises to become even more central for efficient business operations and strategic decision-making. Ongoing advances in natural language processing to handle challenges like sarcasm detection and aspect-based sentiment analysis are expanding the scope of this technology.
What are the Indicator Types for Sentiment Analysis?
The four main types of sentiment analysis indicators in stock market are volatility index, bullish percent index.
1. Volatility Index
The Volatility Index, also known as INDIA VIX, is a real-time market index that represents the implied volatility of the NIFTY 50 stock market index over the next 30 days. It is calculated using options prices and is designed to reflect investors’ consensus view of future expected stock market volatility.
The VIX is used as an indicator of investor sentiment and market volatility. It acts as a barometer of fear or complacency in the market. Higher VIX levels indicate increased fear and anxiety among investors, signaling potentially higher volatility looking forward. Lower VIX signifies investor complacency and expectations of stability in the near future.
The VIX is useful for gauging market conditions for trading and risk management purposes. High VIX indicates turbulent markets where lower risk trades are preferable. Low VIX suggests stable, trending markets suitable for higher risk directional trades. The absolute VIX level as well as changes in VIX are analyzed by traders for insight into shifting market psychology.
Options traders utilize VIX for pricing options and generating trading signals. A rise in VIX typically reflects higher premiums for index options across all strikes. Comparing VIX to historical averages provides overbought or oversold conditions useful for options trading. Volatility analysis, including VIX term structure slopes formed by different expiration dates, also provides trading information. This volatility analysis is essential for understanding market conditions and making informed trading decisions.
2. Bullish Percent Index
The Bullish Percent Index (BPI) is a breadth indicator that measures the percentage of stocks on a particular exchange that are displaying bullish (rising) short-term price momentum. The indicator aims to measure overall market strength and sentiment.
BPI is calculated by taking the number of stocks satisfying the bullish/rising criteria and dividing it by the total number of stocks in the index. Common criteria include an X-day moving average crossover or closing above a recent high. The indicator ranges from 0 to 100 – higher readings signify broader participation in the uptrend.
The Bullish Percent Index provides insights into market momentum and the health of an uptrend or downtrend. High BPI levels (>70) indicate strong and widespread momentum across stocks suggesting a bullish market. Low BPI (<30) indicates weak participation implying potential reversal from uptrend.
Divergence with major indexes gives early warning signals of a maturing trend. For individual stocks, comparison with the broader index BPI shows if momentum is aligned with the overall market. BPI also aids sector rotation strategies by identifying leading/lagging groups.
3. Moving Averages
Moving averages are one of the most basic yet widely used indicators in technical analysis. A moving average is the average price of a security over a set time period. It creates a smoothed trendline that filters out short-term noise from price fluctuations.
The simple moving average (SMA) is the simplest form calculated by taking the arithmetic mean of closing prices over N periods. Other popular types are the exponential moving average (EMA) which applies weighting factors and the weighted moving average (WMA) which assigns higher weights to recent data.
Moving averages help identify the underlying trend direction. Prices trading above a rising moving average indicate an uptrend, while prices below a falling moving average signal a downtrend. The slopes of faster and slower moving averages provide trend signals – a faster MA crossing above a slower MA is considered bullish.
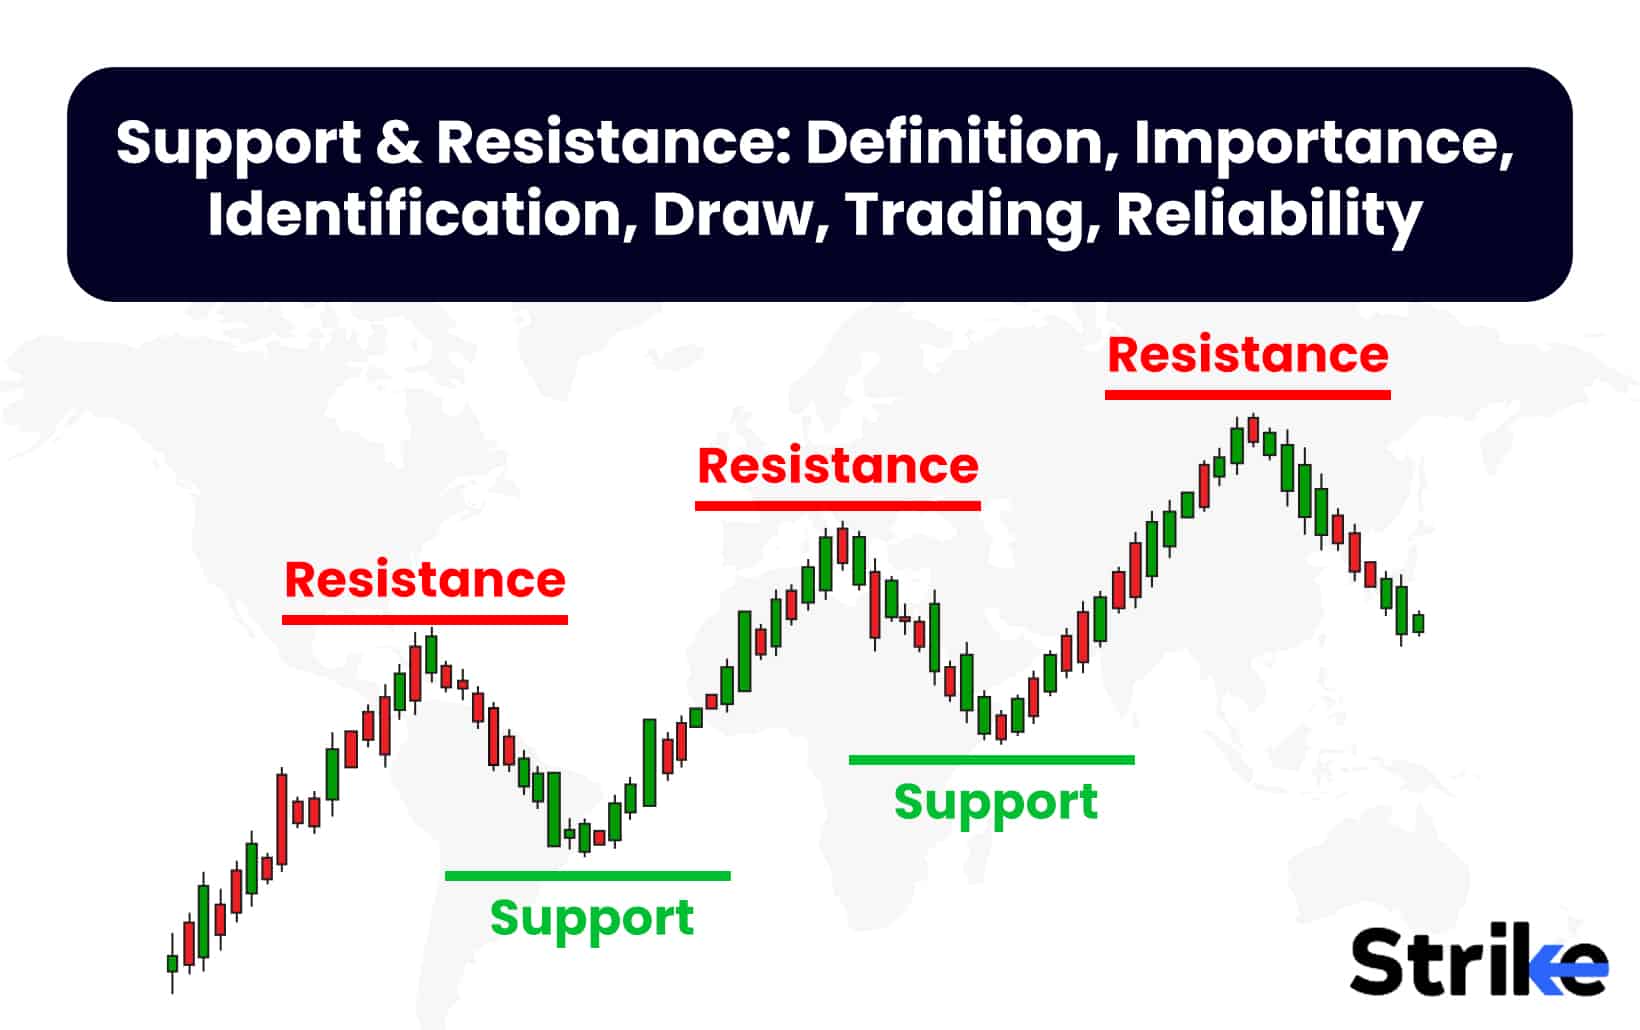
The areas where the price oscillates around its moving average are viewed as support and resistance zones. Closes below or above the MA after a period of trading flat suggest potential breakouts. Moving averages also help filter stock movements to distinguish high-level trends from lower timeframe fluctuations.
4. High-Low Index
The High-Low Index, also known as the High-Low Indicator or High-Low Method, is a technical analysis tool that measures the percentage of stocks reaching new highs versus new lows on a particular exchange. The goal is to measure overall market strength.
The High-Low Index is calculated by taking the number of stocks making new X-period highs and dividing it by the number making new lows. Typically X is taken as 52 weeks. Readings above 40% indicate broad market strength, while levels below 10% reflect weakness. The indicator ranges from 0 to 100.
The High-Low Index provides insights into market momentum and participation across stocks. High readings suggest bullishness, with buying interest across large portions of the market. Low readings indicate bearish sentiment and weakening participation. It identifies whether these uptrends/downtrends are broad-based or narrow.
How Does Sentiment Analysis Contribute to The Stock Market Investors?
Sentiment analysis has become an increasingly valuable tool for stock market participants seeking an edge in trading and investing decisions. By extracting the prevailing mood from textual data sources, sentiment analysis provides valuable insights into the psychology of the market at various points in time. This allows investors to measure overall market sentiment and also gain perspective on specific stocks.
At the broad market level, sentiment indicators help investors assess whether investors are overly optimistic or pessimistic about the near-term outlook. High positive sentiment warns of investor complacency and heightened risk of a reversal, while extremely negative sentiment suggests investor capitulation and a potential market bottom. Comparing current sentiment levels to historical extremes and averages provides perspective on market psychology.
For specific stocks, sentiment analysis of news articles, analyst reports, earnings calls, investor message boards and social media discussions provides a data-driven approach to incorporate investor emotions into trading decisions. Sentiment analysis helps answer questions like how positive/negative is the narrative around a certain stock, how investor perception changes around events like earnings, is hype building or fading in online communities etc.
Sentiment indicators allow determining market buzz and chatter on particular stocks in real-time to capitalize on opportunities earlier than just relying on price and fundamentals alone. They aid in confirmation or contradiction of conventional chart and valuation signals. For momentum traders especially, learning social media excitement and chatter levels provides an additional edge.
In portfolio construction, sentiment metrics allow investors to monitor the prevailing investor psychology and risk appetite across sectors. It suggests areas of potential rotation to exploit sectoral imbalances in positioning and expectations, when sentiment appears elevated towards certain sectors while languishing in others.
Sentiment plays a role in steering option trading decisions. High positive sentiment decreases upside potential but increases premiums due to higher implied volatility. This alters the cost-benefit analysis for options buyers and sellers. Sentiment extremes often coincide with excessive volatility that reverts to the mean over time.
While most useful as a complementary input, sentiment by itself also generates trade signals such as contrarian fades of excessive bullish or bearish extremes. However, the nuances of market structure, positioning dynamics and fundamentals also need to be accounted for. Overall, sentiment analysis provides stock market participants an additional analytical perspective to enhance investment processes. Just like other indicators, its signals are most valuable when interpreted in the context of holistic analysis rather than in isolation.
What Are the Key Sources of Data Used for Stock Market Sentiment Analysis?
Stock market sentiment analysis relies on processing textual content from a variety of sources that provide insights into investor psychology. The main 4 categories of data sources include news and media, social media and forum,company content and market data sources. They are given below.
- News and Media Content
Analysts run sentiment analysis on millions of news articles from financial publications, wires, websites, newspapers etc. to generate sentiment scores and track trends. Both general market commentary as well as stock-specific news is analyzed.
Transcripts of earnings calls, presentations, interviews and shows are parsed to identify sentiment signals within prepared remarks as well as Q&A conversations.
The tone in analyst reports and investor letters from major banks, funds and research houses provides insights into their market outlook and stock opinions.
Strike.money is one of a kind tool that provides news, announcements, corporate actions, deals (bulk, block and insider deals) about listed scripts on their platform.

Social Media and Forums
Tweets are a rich data source given the reach, speed and real-time nature. Sentiment analysis parses millions of finance-related tweets to measure sentiment momentum.
Popular boards like Moneycontrol or Economic Times contain valuable discussions. Sentiment analysis tracks hype levels on specific stocks and sectors.
Market commentary from blogs, forums like Moneycontrol, and review/rating platforms also comprise useful data.
Company Content
Transcripts and audio data from quarterly earnings calls are analyzed to assess management sentiment, response to questions etc. which provides forward-looking insights.
Sentiment data is extracted from, annual reports, investor presentations and other material containing management commentary.
Company press releases announcing partnerships, products, M&A etc. provide data for determining positive or negative sentiment.
Market Data Sources
Indicators tracking investor risk appetite like the INDIA VIX also offer sentiment data from a market psychology perspective rather than textual data.
Data like consumer confidence indices, insider buying/selling, fund flows etc. also complement textual analysis.
The most effective sentiment analysis utilizes a combination of these sources to build a holistic perspective on market psychology, cross-validating signals from diverse datasets. The textual data is processed using natural language processing, machine learning and other techniques to generate sentiment metrics.
How Can Sentiment Analysis Be Used to Predict Stock Market Trends?
Sentiment analysis provides useful predictive signals for discerning market trends when interpreted in the context of price action, fundamentals and other factors, but works best when integrated as one component of holistic analysis rather than relied upon in isolation.
At the broad market level, sentiment metrics serve as contra-indicators to measure extremes in bullishness or bearishness. High positive sentiment implies investor complacency, herd mentality and overvalued conditions that often precede market tops as optimism eventually reverts. Extremely bearish sentiment shows capitulation signaling that a market bottom is near as pessimism gets exhausted.
Quantifying market sentiment allows recognizing such extremes through metrics like percentage above/below historical averages or scoring relative to bull/bear thresholds based on backtesting. Divergence between price trends and sentiment indicators also holds predictive power for trend changes.
For individual stocks, bullish or bearish momentum in news, social media forums and other unstructured data sources anticipates price movement as it takes time for broader attention and volumes to build up. Sentiment metrics also allow quantifying emerging narratives, investor chatter and identifying rising stocks before technical breakouts.
Incorporating sentiment signals into predictive models like neural networks, regression or ensemble models allows backtesting to determine predictive value and optimal integration strategy. Signals derived from sentiment data tend to be most effective for short-term directional predictions over daily to weekly horizons when combined with price, technicals and fundamentals.
However, sentiment is just one component of overall market analysis. Relying solely on sentiment without considering other dynamics like valuations, earnings trajectory, liquidity conditions, technical support/resistance leads to suboptimal predictions. Sentiment provides clues about market psychology rather than fundamentals.
Isolating precise market turning points purely based on sentiment is also challenging. Sentiment by nature operates in waves of greed and fear that build up and revert gradually rather than instantly at precise tops or bottoms. The magnitude of sentiment swings matters more than exact timing. Integrating sentiment as an additional input factor into holistic analysis frameworks yields the most utility.
What Are the Popular Techniques Used in Stock Market Sentiment Analysis?
Sentiment analysis in finance utilizes a combination of natural language processing, computational linguistics, text mining and machine learning techniques to extract sentiment from textual data. The most popular 6 approaches are given below..
Lexicon-Based Techniques
These techniques rely on dictionaries of words annotated with their sentiment orientation as positive, negative or neutral. finance-specific lexicons assign sentiment scores to words, phrases, emojis, acronyms etc. Presence of explicit sentiment terms indicates overall polarity. Negative handling with negators like ‘not’ is important. Lexicons are fast and simple but lack nuance.
Natural Language Processing
NLP techniques preprocess text data for sentiment analysis by handling spoken languages. This includes tokenization, stopword removal, lemmatization, part-of-speech tagging to distill the text into grammatical constituents and normalize sentences. This simplifies sentiment parsing. Topic modeling analyses document themes. Named entity recognition identifies brands, companies, people mentioned.
Machine Learning Approaches
Machine learning trains algorithms on large datasets of text labeled with sentiment to learn indicative features. Supervised methods like logistic regression, SVM, random forest, and Naive Bayes are commonly used. Neural networks like CNN, RNN and LSTM have also gained popularity. Word embeddings provide pretrained features. Transfer learning leverages pretrained language models.
Aspect-Based Sentiment Analysis
This technique analyzes sentiment towards specific targets like stocks, people, or market events within text through fine-grained analysis instead of just broader polarity classification. This requires topic detection, subjectivity classification, and named entity recognition.
Multimodal Analysis
This combines textual data with other data modalities like stock price movements, market events, and visual cues from video, images and charts to obtain a multidimensional perspective on sentiment.
Backtesting
Backtesting sentiment strategies on historical data evaluates the efficacy of techniques. Parameter tuning and robustness checks are critical. Insights from behavioral finance help assess strategy assumptions. Combining sentiment with fundamental and technical factors is ideal.
Sentiment analysis also leverages domain-specific knowledge from finance and a feedback loop between textual and market data for continuous model improvement. Both shallow and deep learning techniques have advantages. Ensemble stacking of multiple methods enhances robustness. Overall, a hybrid approach combining lexicon, NLP, ML and expert rules tailored to financial applications yields the most effective sentiment analytics.
What Are the Benefits of Sentiment Analysis in The Stock Market?
Sentiment analysis has emerged as an important technique for stock market analysis owing to the proliferation of textual data related to markets. Here are 7 core benefits it offers are given below.
Understand Market Psychology and Investor Behavior
Sentiment metrics provide insights into investor psychology that influence market movement based on human emotions like fear, greed, optimism, capitulation etc. Quantifying evolving market narratives and revealing the underlying sentiment among different investor cohorts allows anticipating potential trends.
Identify Trading Opportunities
Extreme bullish or bearish sentiment readings that diverge from fundamentals often represent trading opportunities. Overly positive sentiment suggests potential overheating while extremely negative sentiment indicates capitulation. Sentiment helps time contrarian trades against the herd mentality. It also aids in momentum strategies by revealing stocks gaining increasing attention.
Supplement Traditional Analysis
Sentiment indicators serve as additional inputs for analysis by providing clues from a perspective beyond just technical and fundamental factors. They help measure investor expectations, risk appetite, market positioning and momentum. Combining sentiment signals with traditional analysis creates a more holistic forecasting framework.
Monitor Real-Time Reactions
Sentiment analysis of news, social media, earnings calls and other text sources allows gauging instant reactions to events. This high frequency, real-time view enables exploiting short-term mispricings and opportunities ahead of price adjustment. It provides an information advantage over just waiting for data releases.
Evaluate Relative Value
Comparing sentiment across stocks, sectors and asset classes highlights discrepancies in bullishness and bearishness. This allows identifying relatively overvalued or undervalued assets based on lopsided positioning and expectations that eventually revert to fair value.
Build Sentiment-Based Models
Incorporating sentiment data into quantitative and algorithmic trading strategies allows exploiting inefficiencies arising from the impact of investor psychology on markets. Sentiment indicators augment models, simulations and risk management frameworks.
Lower Information Barriers
Sentiment data derived from public data democratizes access to insights from investor psychology. Smaller traders gain transparency into market narratives, wisdom of the crowds and Wall Street outlooks using sentiment indicators.
While not a crystal ball, adding an evidence-based sentiment layer provides incremental strategic value across trading, investment and risk monitoring use cases. It enhances the probability of success over relying purely on single-lens perspectives devoid of gauging market emotions.
What Are the Challenges of Sentiment Analysis in The Stock Market?
Sentiment analysis provides useful insights into investor psychology but has challenges including language ambiguity, discrepant signals, bias, linking impact, prediction limits, evolving slang, sarcasm, and short-term focus that warrant awareness. There are 9 key challenges to consider when applying sentiment analysis to the stock market. They are given below.
Subjectivity and Ambiguity in Language
Human language is complex. The same statement conveys different emotions based on context, sarcasm, cultural references etc. Figurative expressions like metaphors are difficult for algorithms to comprehend. This makes accurately determining sentiment from text challenging.
Extracting Relative Timeframes
Text often lacks precise time references. Words like ‘now’, ‘currently’ are relative and difficult to anchor to exact timeframes for backtesting sentiment strategies. Inferring whether sentiment pertains to short-term vs long-term outlook is also tough.
Discrepancies in Indicated Sentiment
There are also discrepancies between broad market sentiment and that for individual stocks. Also, different data sources convey conflicting sentiment signals for the same assets leading to uncertainty in interpretation.
Data Bias and Manipulation
Certain sources like social media have self-selection biases in their user demographics that do not reflect whole populations. Sentiment data also intentionally is manipulated to influence perceptions.
Linking Sentiment to Price Impact
While sentiment analysis provides insights into prevailing psychology, quantifying the tangible link between specific sentiment shifts and subsequent price impact involves uncertainties.
Limitations in Prediction Capabilities
Sentiment analysis has limitations in making precise market predictions due to the inherent complexity in financial markets. Sentiment operates more in waves rather than providing precise reversal points.
Evolving Language and Slang
Financial language and slang evolves rapidly online. Sentiment lexicons require frequent updating to keep pace. Contextual understanding also needs continuous training with new data.
Difficulty in Processing Sarcasm
Sarcasm and irony pose challenges in correctly identifying sentiment orientation. Most algorithms struggle to grasp implied meaning which requires nuanced language understanding.
Focus on Short-Term Horizons
Much sentiment analysis focuses on short-term intraday horizons for trading. But longer-term investment applications warrant analysis of how sentiment builds and evolves over months and years.
While hugely valuable, sentiment analysis has its limitations. Prudent usage involves being aware of the challenges, validating signals across data sources, integrating it as one component of holistic analysis, continuous retraining to handle language evolution and leveraging techniques like ensembling to mitigate risks.
What Are Examples of Sentiment Analysis?
Sentiment analysis is used to extract and analyze subjective information from textual data sources like social media posts, product/movie reviews, survey responses, news articles and more to identify writer attitudes, opinions and emotions. Examples of sentiment analysis include customer sentiment analysis, Financial sentiment analysis, political sentiment analysis etc. They are given below.
Customer Sentiment Analysis
Companies perform sentiment analysis on customer reviews, survey responses, social media mentions etc. to understand satisfaction with products, services and brand. It provides insights into pain points, desires and perception which guides marketing. Positive and negative keywords identify sentiment polarity and aspects like features. Competitor analysis is also done.
Financial Sentiment Analysis
In trading and investment, sentiment analysis parses news, earnings calls, analyst reports, social media etc. to measure market psychology. It identifies investor optimism, risk appetite, relative bullishness/bearishness etc. Signals are incorporated into forecasting models and trading strategies. Extremes hint at potential reversals.
Political Sentiment Analysis
Analysis of speeches, debate transcripts, manifestos, social media etc. reveals public opinion on leaders, parties and policies. This provides inputs for election strategy and understanding voter bases. Sentiment helps estimate support by demographics, geographies and topics. It is also used to detect fake news, misinformation and propaganda.
Brand Monitoring
Companies track brand mentions online and perform sentiment analysis to monitor reputation. It measures response to ad campaigns and incidents. Trends are analyzed to detect PR crises, evaluate brand health and loyalty. Competitor brand perception is also evaluated.
Healthcare Sentiment Analysis
Patient feedback on hospitals, doctors etc. is analyzed to measure satisfaction and improve services. Analysis of community posts identifies treatment concerns and questions. Pharma companies assess sentiment towards drugs and campaigns. Public health agencies monitor mental wellbeing.
Employee Sentiment Analysis
Surveys, feedback, emails and internal communication by employees is analyzed to evaluate job satisfaction, engagement, concerns and work culture. Sentiment metrics identify attrition risks and areas of improvement. Analysis over time shows the impact of interventions.
Customer Service Sentiment
Chat and call transcripts are analyzed to evaluate customer service experience. Sentiment identifies pain points and agent performance. Common complaints and queries get highlighted through topic modeling. Analysis aids in improving support resources.
Research and Development
Scientific publications, patents, grants etc. are analyzed to determine sentiment towards technologies, research progress and scientists. It provides competitive benchmarking and reputation insights. Trends identify rising stars, promising research and commercial viability.
How Can Sentiment Analysis Help Identify Market Indicators?
Sentiment analysis reveals market psychology indicators like excessive bullish/bearish extremes and evolving narratives that act as precursors to price movements when integrated prudently within holistic technical and fundamental analysis. The insights gained into investor psychology and crowd wisdom helps reveal several market indicators and signals that are precursors to price movement.
Measuring overall market sentiment is valuable for identifying extremes of bullishness or bearishness. High positive sentiment warns of investor complacency that often precedes market tops when optimism gets exhausted. Extreme bearishness signifies capitulation indicating potential bottoms as pessimism reaches max fear. Comparing current sentiment to historical averages provides context on prevailing psychology.
Sentiment analysis also aids in quantifying evolving market narratives, expectations and investor chatter on specific assets. Increased positive mentions and hype for a stock in news, forums and social media provides momentum indications and rising popularity. Peaking bearish sentiment reveals market disillusionment flagging potential reversal setups.
Aspect-based sentiment analysis identifies relative bullishness across sectors, asset classes or factor styles. Divergences in sentiment help spot areas of crowding and lopsided positioning. For example, weakening sentiment and skepticism in a sector compared to rising enthusiasm in another area suggests potential rotation trades.
Incorporating sentiment factors along with technical indicators, market structure analysis and fundamentals within machine learning models allows backtesting to check efficacy in predicting future indicators like volatility, liquidity, momentum, trading ranges etc. The time series models identify optimal integration strategies and sentiment thresholds as market timing signals.
However, sentiment is most effective as an ancillary factor for anticipating moves rather than the sole trigger. Price levels, support-resistance, economic drivers, valuations and risk metrics provide structure. Sentiment reveals what market participants are feeling given the technical-fundamental backdrop. Combining these lenses offers the most insightful market indicators.
The key is prudent usage by considering nuances of market internals, causality challenges and text analytics limitations while benefiting from the valuable incremental perspective offered by analyzing investor emotions and narratives. Sentiment analysis shows promise in revealing market indicators, but needs to be integrated as one component of holistic analysis instead of being relied upon in isolation.
What Are the Implications of Sentiment Analysis in Stock Market Forecasting?
Sentiment indicators provide meaningful predictive insights for the stock market when used prudently. 10 key implications of sentiment analysis in forecasting includes data-driven approach, identification of inflection points at the earliest, better event analysis etc. They are given below.
More Data-Driven Approach
Sentiment indicators provide additional predictive variables for forecasting models like neural networks, regression, ensemble methods etc. This enables a more data-driven approach to prediction incorporating signals from investor psychology and market narratives revealed through textual analysis.
Earlier Identification of Inflection Points
Sentiment often reveals shifts in market psychology before reflected fully in price action. Incorporating sentiment data enables earlier detection of impending trend reversals, momentum exhaustion and extremes indicating market tops or bottoms.
Better Event Analysis
Quantifying instant reactions revealed through textual sentiment analysis of news, social media, earnings calls etc. allows better gauging likely post-event price impacts, rather than waiting for lagging data releases. Investor responses are incorporated into event-trade strategies.
Filtering the Signal from the Noise
Sentiment metrics help distinguish between short-term market noise versus sustained shifts in investor psychology that are precursors to durable trends. They aid in focusing on material signals relevant for longer-term forecasts.
More Holistic Perspective
Sentiment indicators augment traditional price, technicals, fundamentals and macro factors. This multifaceted perspective helps reduce overreliance on any single view, providing a more holistic framework for forecasting.
Challenges from Indicator Discrepancies
Conflicting sentiment signals from different data sources make integrating indicators difficult. For example, social media sentiment diverges from that in analyst reports or fundamentals. Reconciling and prioritizing indicators poses challenges.
Difficulty in Precise Market Timing
While useful for directional forecasting, sentiment-based indicators are less reliable for pinpointing exact tops or bottoms. Sentiment operates more in waves rather than offering precise reversal points due to inherent noise.
Susceptibility to Cognitive Biases
The act of manually tracking and interpreting sentiment introduces individual cognitive biases. Overweighting sentiment or seeing false signals that confirm one’s biases are risks requiring objective model-based integration.
Language Complexity and Evolution
The complexity of financial language makes accurately quantifying sentiment difficult as context and nuance vary. Models need continuous updating as language conventions evolve over time.
Lagging Fundamental Indicators
Since sentiment analysis perceptions rather than fundamentals directly, it does not replace analyzing leading indicators like forward earnings, yields, valuations which are key predictors. Sentiment complements but does not supersede such indicators.
Sentiment analysis holds meaningful predictive potential for stock market forecasting when applied prudently in balance with holistic analysis of all relevant factors. It does not eliminate uncertainty or human discretion in prediction but provides an incremental data-driven approach to combine insights from investor psychology and market narratives with traditional indicators and models.
How Can Sentiment Analysis Be Used as A Trading Strategy?
Sentiment analysis is used as a trading strategy as it helps to provide insights into the overall market psychology and bias. Traders leverage sentiment extremes to identify potential turning points and inform counter-trend trade entry or exit timing.
Sentiment often becomes overly bullish or bearish near market tops and bottoms respectively. Identifying such sentiment extremes through metrics like standard deviation above historical averages or investor optimism surveys suggests potential reversal setups to trade contrary to prevailing sentiment.
Measuring rising positive sentiment and hype for specific assets helps time entry into momentum trades. Sentiment momentum indicates increasing attention and likelihood of continuing upside before eventual euphoria peak.
Divergence in sentiment between correlated assets like stocks in the same sector flags potential mean reversion setups. The declining stock is bought and the rallying one sold short, if sentiment falls for one stock while rising in another.
Elevated market euphoria signifies increased risk of corrections. Measuring sentiment allows dynamically adjusting position sizing, tightening stops, and moderating new longs to account for higher prevalent risk.
Gauging instant reaction through real-time sentiment analysis around earnings, data releases, analyst days provides an edge in trading the subsequent price movements once the initial surge of emotions subsides.
Factor investing strategies benefit from sentiment signals on factor cycle turns. For example, peak pessimism identifies good entry points for deep value strategies. High volatility fear offers opportunities in low volatility stocks.
The optimal usage involves combining sentiment data with price action, technicals, fundamentals, and risk management principles. Sentiment by itself is insufficient and prone to false signals. But it provides information to guide trading decisions beyond just reacting to price and charts.
Backtesting is critical to determine efficacy of sentiment indicators, evaluate combinational strategies with other signals, set risk parameters and reject spurious relationships. Ongoing iteration and validation across market environments is key to develop robust sentiment-based trading strategies. Like other forms of analysis, sentiment is most effective when not used in isolation but as an additional perspective integrated into the trading process.
How Does Sentiment Analysis Contribute to Quantitative Models?
Sentiment data provides useful signals that augment quantitative models by incorporating indications of investor psychology into quantitative finance models to improve predictive accuracy, risk management, and domain-specific contextualization when integrated prudently.
Sentiment indicators act as extra predictive features that are incorporated into quantitative models like neural networks, regression, random forest etc. This enhances model accuracy by accounting for investor psychology effects.
Measuring reaction sentiment around earnings, data releases, M&A etc. helps estimate the likely post-event price impact for better event modeling. It captures instant response before tangible data updates.
Indicators like the VIX provide sentiment-driven risk metrics that are added to risk models for more robust drawdown estimates, volatility forecasting, position sizing and portfolio optimization.
Sentiment helps determine cyclicality of factors like value, growth, momentum etc. and aids in factor rotation strategies by identifying factor inflection points based on investor enthusiasm and neglect.
Sentiment has been shown to contribute to explaining mispricing in assets. Adding proxies like investor surveys improves multi-factor asset pricing models seeking to quantify misvaluation.
Comparing model indicators with sentiment measures derived from independent textual data helps validate signals, remove spurious relationships and avoid overfitting by distinguishing durable signals from temporary noise.
Sentiment analysis using financial language models and contextual tuning allows adapting general NLP models to finance-specific applications like algo trading, stock prediction, credit risk modeling etc.
However, prudent usage involves not overplaying sentiment signals since relationships in financial markets are nuanced. Backtesting determines useful integration strategies and thresholds where sentiment provides value. Sentiment is best used as one augmenting component within overall quantitative analysis frameworks. The market behavior revealed through sentiment analysis should align logically with the conceptual model philosophy for effective synergistic contribution to the model.
Does Market Sentiment Refer to The Overall Consent About a Stock?
No, market sentiment does not simply refer to overall consensus about a particular stock. Market sentiment is a more nuanced concept that captures the prevailing investor psychology and emotions towards financial markets or specific securities.
While consensus view is an element, sentiment goes beyond agreement to quantify the intensity of bullishness or bearishness in quantitative terms. It aims to identify extremes in optimism, pessimism, fear, greed, confidence etc. that impacts asset prices and lead to inflection points.
For example, a stock has an overwhelmingly positive commentary and bullish sentiment in social forums and news. But this enthusiastic consensus without any counter views itself represents an extreme sentiment signal, even if there is agreement. High unanimity often precedes market tops as it signifies euphoria and overconfidence.
Likewise, strongly bearish consensus during market crashes reflects panic and capitulation – again an extreme sentiment reading predicting a reversal, even though there is consensus. Neutral sentiment is difficult to maintain for extended periods in markets because of human nature.
Therefore, healthy sentiment ebbs and flows in waves between greed and fear. Oscillating diversity of narratives rather than sustained unanimity indicates robust two-sided thinking. Prolonged extremes in either direction, whether reflecting consensus or polarization, are signals detected through sentiment analysis.
Additionally, different groups of investors have varying sentiments on the same stock. For example, retail traders on social media forums are euphoric while institutional sentiment remains cautious. These discrepancies also provide trade signals.
Is the Market Sentiment Bullish when Prices Are Rising?
No, rising asset prices alone do not necessarily imply bullish market sentiment. While sentiment tends to align directionally with market trends, the relationship is more nuanced in terms of the intensity and extremes in sentiment.
Is the Market Sentiment Bearish when Prices Are Falling?
No, falling asset prices alone do not necessarily imply bearish market sentiment. While sentiment tends to align directionally with market trends, the relationship is more nuanced in terms of the intensity and extremes in sentiment.
Can Technical Indicators Help Investors Measure Market Sentiment?
Yes, certain technical indicators help investors measure overall market sentiment to some extent. However, relying solely on technical indicators has limitations in capturing the full psychology behind market sentiment.
Arjun is a seasoned stock market content expert with over 7 years of experience in stock market, technical & fundamental analysis. Since 2020, he has been a key contributor to Strike platform. Arjun is an active stock market investor with his in-depth stock market analysis knowledge. Arjun is also an certified stock market researcher from Indiacharts, mentored by Rohit Srivastava.
Shivam is a stock market content expert with CFTe certification. He is been trading from last 8 years in indian stock market. He has a vast knowledge in technical analysis, financial market education, product management, risk assessment, derivatives trading & market Research. He won Zerodha 60-Day Challenge thrice in a row. He is being mentored by Rohit Srivastava, Indiacharts.
Leave a Reply


Recently Published


More in this topic

Join the stock market revolution.
Get ahead of the learning curve, with knowledge delivered straight to your inbox. No spam, we keep it simple.
Comments