Evening Star Candlestick: Definition, Structure, Trading, Advantages, and Disadvantages
By  Arjun Remesh |
Reviewed by
Arjun Remesh |
Reviewed by  Shivam Gaba |
Updated on February 28, 2024
Shivam Gaba |
Updated on February 28, 2024
Table of content show
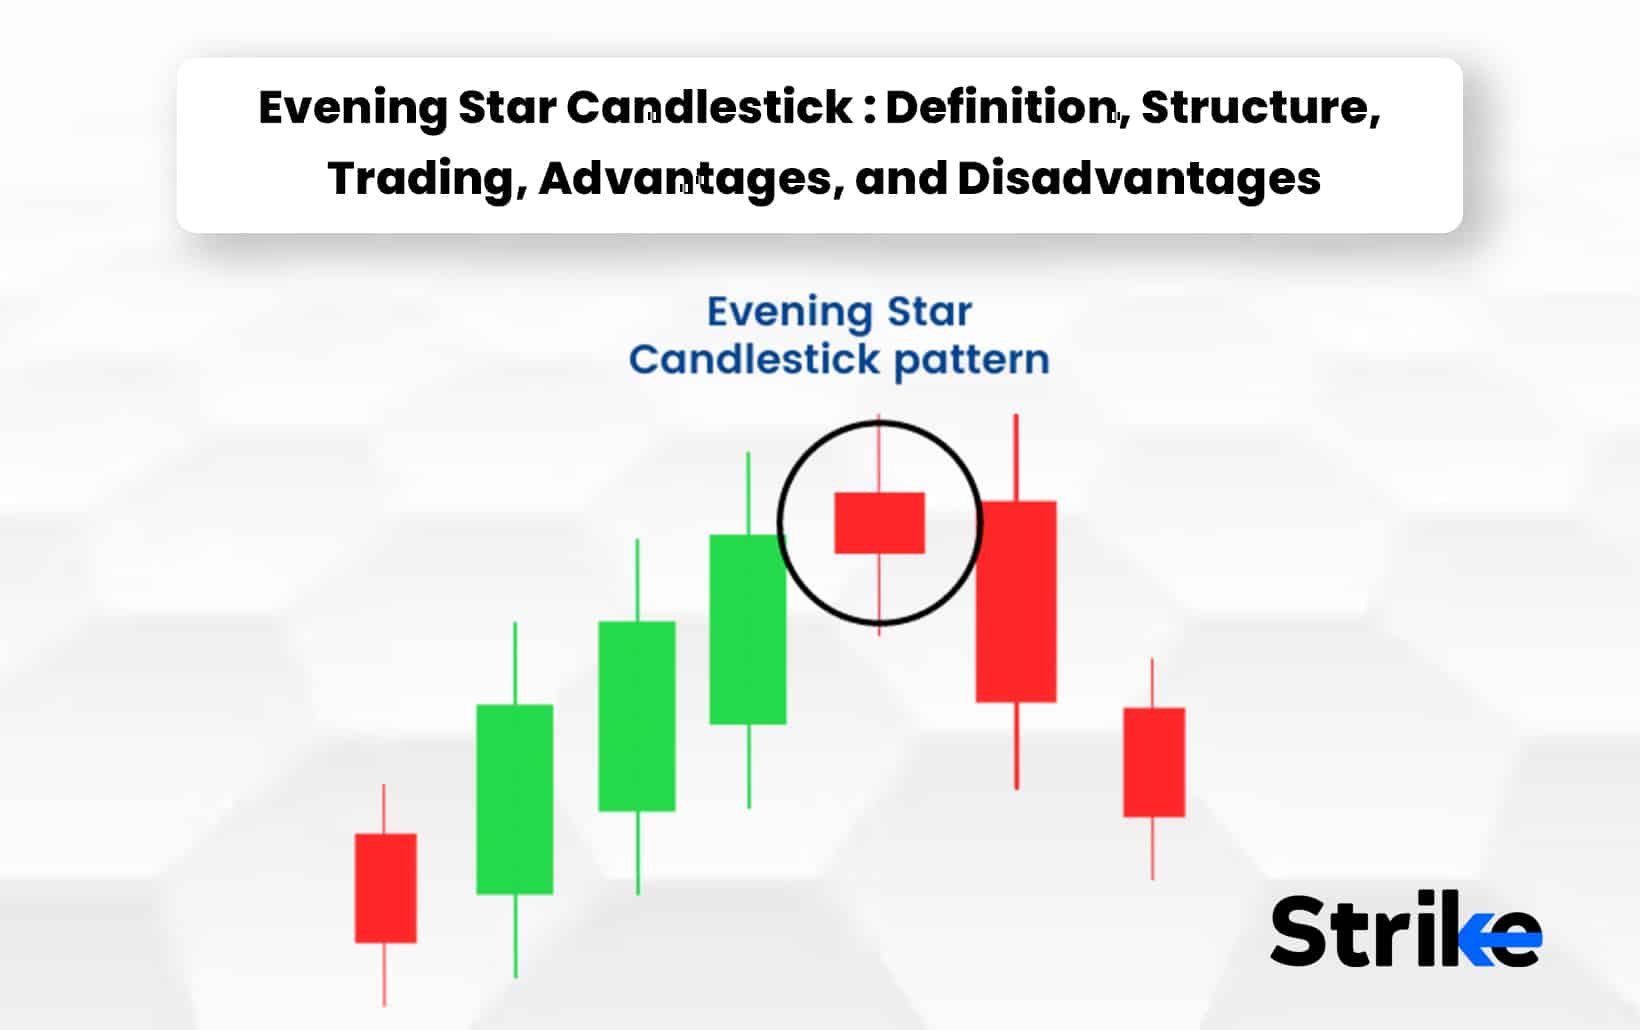
The Evening Star pattern is a candlestick pattern that appears at the top of the uptrend and predicts that a downtrend is approaching. An Evening Star is a bearish reversal candlestick pattern comprising three candles: one big bullish candlestick, one small-bodied candle, and one bearish candle.
The evening star is a reliable sign that a downward trend has started. The pattern usually forms over three days. The huge white candle indicating a steady price increase will be visible on the first day; it will be followed by a smaller candle indicating a noticeably slower rise in prices. The third day will have a large red candle with an opening price that is lower than the second day and then ends near the middle of the first day.
Traders trade this pattern by selling or shorting the asset after the formation of the bearish candle, with a stop loss placed above the pattern high. Profit targets are established either at the closest support level or at a previous low.
What is an Evening Star Candlestick?
The Evening Star pattern is a technical analysis indicator that shows the change from bullish to bearish momentum in an upward price trend. The pattern doesn’t appear very often, but it is regarded as a reliable bearish indicator.

The psychology behind the pattern is that the market sentiment at the moment is bullish, and the prices continue to hit higher highs. This bullish attitude persists until the first candle of the evening star forms. The market experiences another bullish day when the second candle forms as it gaps up. Traders anticipate profit-taking because the market has risen significantly and has been rising for a while. This results at the beginning of the selling pressure, which makes it more difficult for the bulls to continue driving the prices upward. The market closes roughly where it opened, thus producing a Doji or a spinning top candlestick pattern. The appearance of the bearish candle on the third candle demonstrates that the bears have taken control of the prices. The market gaps are down, and more people expect a trend reversal.
How useful is Evening Star Candlestick?
The evening star candlestick pattern is a useful technical analysis tool for traders as it provides a visual representation of a likely trend reversal. This candlestick pattern is also used by traders as an entry signal for a short position or as a sell signal. Traders use the high of the evening star pattern as the stop-loss level. The closest support level or prior low can be used by traders as a profit objective for their short position.
How is the Evening Star Candlestick Pattern Structure?
The Evening Star candlestick is a three-candlestick pattern. The first candle has a long body and shows a significant price increase, with the close price settling above the open price. The asset price is moving upward, as seen in this bullish candle.

The second candle is the “star” with a little body. This candle is either bullish or bearish or without a body( neutral). The asset price closes at a level that is extremely near to the open price with balanced buying and selling orders, according to the star feature. The star indicates a slowdown in the earlier bullish momentum. An ideal Evening Star pattern has a gap up from the first candle to the star. This indicates that there were few or no transactions between the previous close price and the open price, which caused the open price to rise quickly.
The third candle is generally bearish, with the close price lower than the open price and a gap down from the previous star. The first candle’s upward trend has been reversed, eliminating the price increase. This candle provides a selling signal and verifies the Evening Star pattern, ideally with a gap down.
How Many Days Does an Evening Star Pattern Take to Develop on A Daily Chart?
The Evening star candlestick pattern forms over a period of three days. The first day consists of a big white candle denoting an ongoing price increase. The second day contains a shorter candle that shows a more controlled rise in price. The third day displays a large red candle that starts at a lower price than the day before and closes close to the middle of the first day.
When do Evening Star Candlestick Patterns occur?
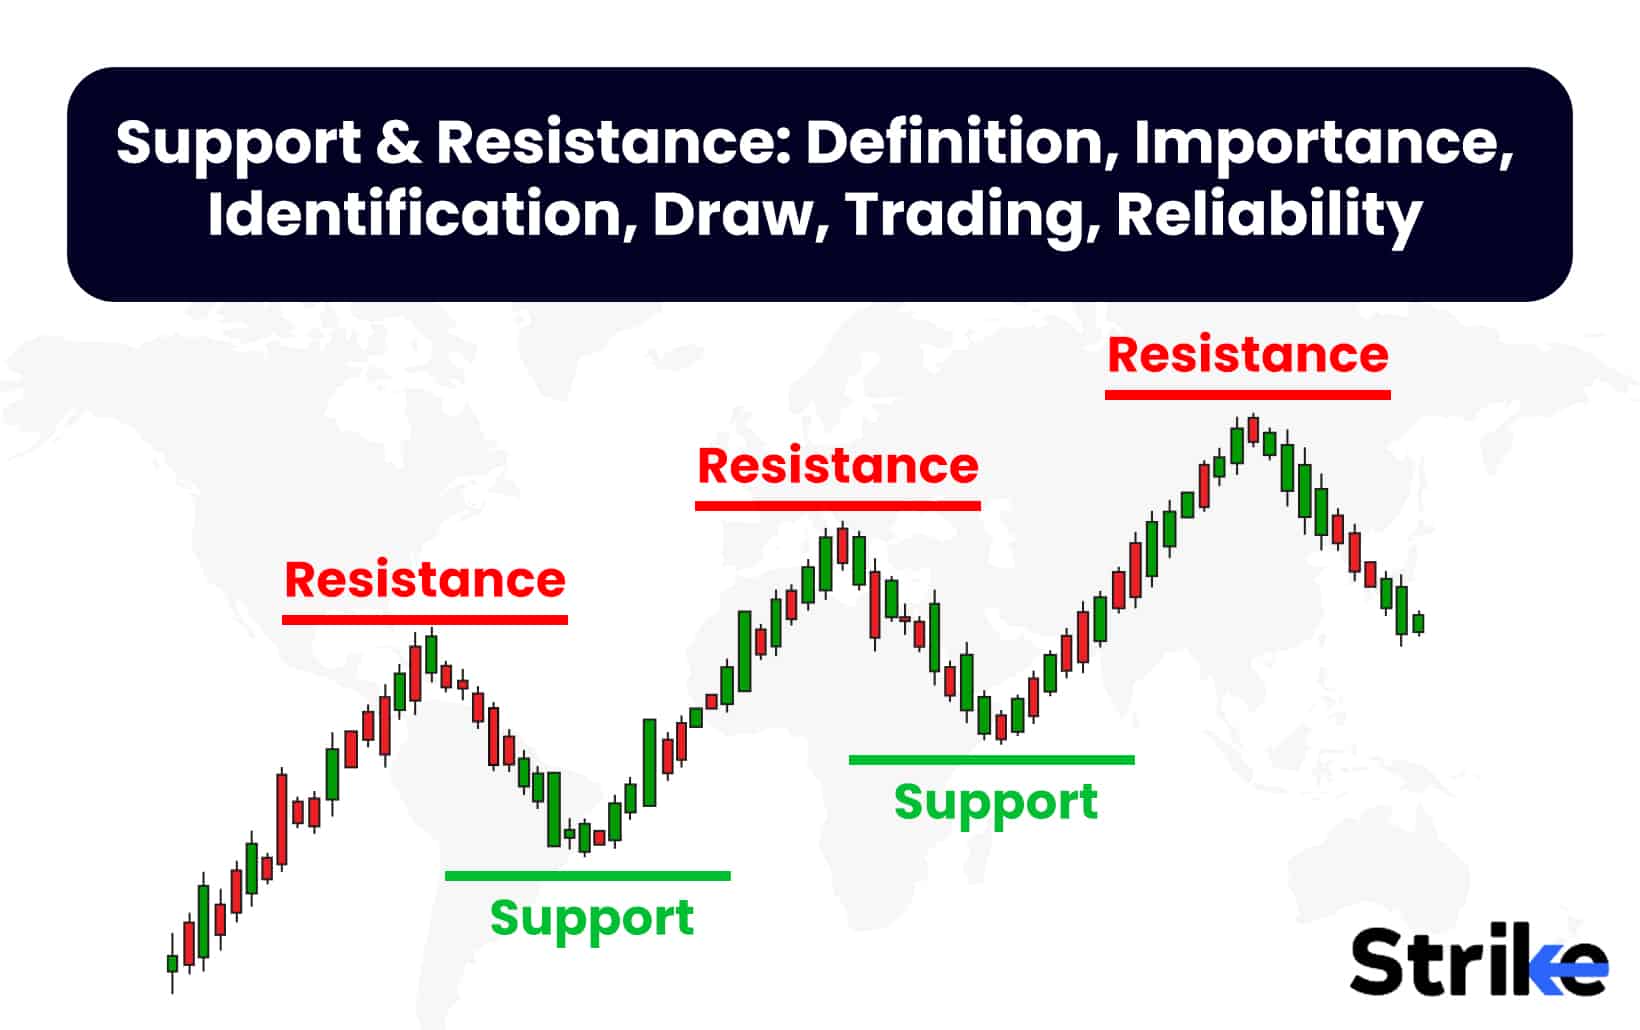
The Evening Star Candlestick pattern usually appears at the top of an uptrend. Each peak and trough that follows is higher than those that were discovered earlier in the trend. The uptrend, therefore, consists of higher swing lows and higher swing highs.
How to Identify Evening Star Candlestick Patterns in Technical Analysis?
The evening star candlestick pattern has four steps that one has to comprehend to identify the pattern.
- Identify an uptrend that is already existing by looking at the market’s higher highs and higher lows. Analyze the previous price movement and understand how the pattern fits into the current trend.
- Large bullish candle: The large bullish candle is the result of strong buying pressure and the persistence of the existing uptrend. The traders should only look for long trades as there is no demonstration of a reversal at this time.
- Small bearish or bullish candle: The second candle is small, occasionally a Doji candle, that shows the first indication of a sluggish uptrend. This candle frequently gaps higher as it hits a higher high.
- Large bearish candle: This candle shows the first real indication of fresh selling pressure. This candle spans down from the previous candle’s closure and marks the beginning of a new downtrend in non-forex markets.
Traders will notice lower highs and lows after a successful reversal following the price action, but they should always control the risk of a failed move by using strategically placed stop-loss.
How accurate are Evening Star Candlestick Patterns?
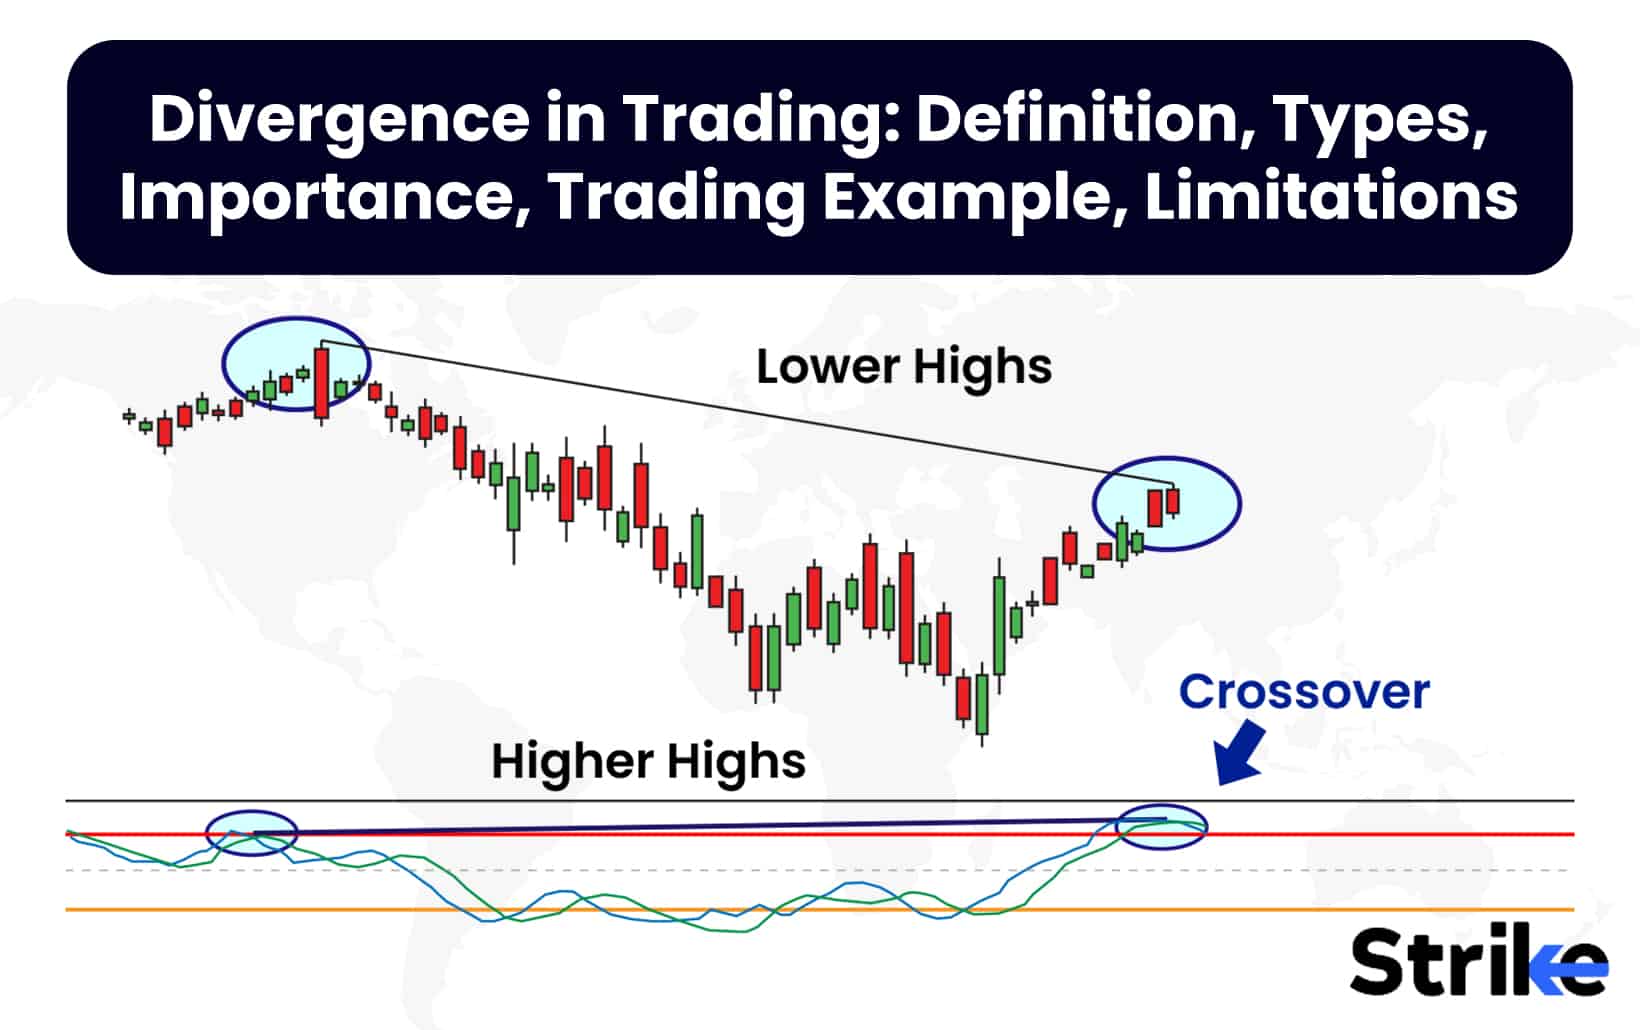
Traders find the evening star candlestick pattern accurate the majority of the time when it comes to predicting a potential downtrend. It can, however, be challenging to figure it out in the noise of stock-price data. Traders frequently utilize price oscillators and trendlines to confirm whether an evening star pattern has formed, helping to identify it properly.
Is it possible to improve the accuracy of the Evening Star Candlestick Pattern?
Yes, it is possible to improve the accuracy of the Evening Star Candlestick Pattern. The three possible ways to improve the accuracy of the pattern are to confirm it with other indicators, analyze the pattern in multiple time frames, and look at the context.
- Confirm with other indicators: Traders use additional technical indicators, such as moving averages, to verify the pattern’s accuracy.
- Analyze with different timeframes: Examining the pattern over different time frames contributes to the pattern’s confirmation.
- Look at the context: Analysis of the evening star pattern should take into account previous market trends and patterns.
Traders can improve the accuracy of the evening star candlestick pattern by constantly practising and developing a better understanding of the pattern.
What is the success rate of Evening Star Candlestick Patterns?
The Evening Star candlestick pattern is a reliable bearish reversal pattern with a success rate of roughly about 70.2%. Using additional technical indicators improves its ability to forecast bearish reversals. For instance, there is always a high probability that the price will reverse from the prior uptrend and move lower when the pattern appears close to a significant resistance level. The resistance level frequently prompts other sellers to enter the market and aid in price reduction.
How Should Traders React to an Evening Star Candlestick?
Traders must look to enter at the opening of the very next candle once the formation is complete. More careful traders choose to postpone their entrance and observe whether the price movement moves lower. The disadvantage of this is that the trader enters at a much weaker level, especially in volatile markets.
Targets be set at previous levels of support or consolidation regions. Stops are set above the most recent swing high because a breach of this level would render the reversal invalid. Traders should always practice careful risk management while ensuring a positive risk-to-reward ratio, as there is no assurance in the stock market.
What are Examples of an Evening Star Candlestick Pattern?
The chart below provides an example of an Evening Star Candlestick Pattern:

The three days that are demonstrated on the chart start with a long white candle, which implies prices have increased from significant buying pressure; the second day also displays an upsurge in prices, but the extent of the increase is small compared to the former day; finally, the third day shows a long red candle whose selling pressure has pushed the price to about the middle of the first day. These are the signs that an evening star pattern has emerged.
Technical analysts who trade this investment can think about shorting it or selling it in expectation of a future decline.
What Indicator is Best to Trade with Evening Star Candlestick Pattern?
The most effective indicators to use with the Evening Star candlestick trading strategy depend on the trader’s personal approach and objectives. Two of the popular indicators combined with the Evening Star pattern are the Relative Strength Indicator and the Stochastic oscillator.
The RSI is used to identify overbought situations, which can predict early warning signs of a likely downward price reversal. Another technical indicator that can be used to spot overbought conditions is the stochastic oscillator.
The trading style and technique of each trader will ultimately determine which indicators work best with the Evening Star candlestick trading strategy. Traders should experiment to determine which indicators and methods are most effective for them.
Can you trade the Evening Star Candlestick Pattern with Bollinger Bands?
Yes, you can trade the evening star candlestick pattern with Bollinger Bands. Bollinger Bands are a volatility indicator that helps traders spot extreme levels where price reversals happen. An Evening Star pattern above the upper band is a prominent signal for an upcoming downtrend.
Is It a Good Idea to Take a Short Trade After the Evening Star Pattern?
Yes, it is a good idea to take a short trade after the Evening Star Pattern. Short trade with a good strategy proves profitable for traders after the Evening Star Pattern. Traders must ensure that the price chart must display an evening star pattern. A resistance level must be present for the evening star pattern to exist. The Evening Star Pattern must finish above the 50-day Simple Moving Average. The 50-day simple moving average is a trendline that displays the daily graphical representation of closing prices for a stock, averaged over the previous 50 days.
Enter a short position at the opening of the next candle once all these conditions have been met. The stop-loss would be set up within the highest high of the evening star formation. The size of the complete Evening star formation, from high to low, is used to determine the take profit level. Start a short position at the opening of the next candle after confirming all these conditions.
Just above the evening star formation’s peak, a stop-loss would be set up. The size of the complete Evening star formation, from high to low, is used to determine the take profit level. The goal is set to be exactly twice as long as the full Evening star formation.
What are the advantages of the Evening Star Candlestick Pattern?
The four main advantages of the Evening Star Candlestick Patterns are that they are easy to spot, they have high reliability and flexibility, and they have a clear stop-loss level.
- The three-candle formation is easy to stop. This makes it easier for us to discover and recognize the Evening Star pattern, making it accessible to both new and seasoned traders.
- The pattern is regarded as one of the most dependable bearish reversal indications, making it an effective tool for traders trying to profit from probable market declines.
- The Evening Star trading method is adaptable to a range of market scenarios and can be used in conjunction with other technical analysis instruments to build a thorough trading strategy.
- This trading approach is safer since traders can use stop-loss orders and other risk management strategies to limit their potential losses.
The Evening star pattern is a simple yet effective bearish reversal pattern. The pattern is adaptable and is easily interpreted by both new and experienced traders.
What are the disadvantages of the Evening Star Candlestick Pattern?
The four major disadvantages of the Evening Star Candlestick Pattern are false signals, market volatility, over-reliance on technical analysis, and lack of diversification.
- False signals: The Evening Star pattern generates false signals that could result in possible losses because it is not always a trustworthy indicator of a bearish reversal.
- Market volatility: Market conditions change rapidly and unpredictably. There are erratic price changes that set off stop-loss orders and result in losses.
- Over-reliance on technical analysis: The Evening Star pattern is based on price action technical analysis, which is interpreted differently depending on market conditions and external economic factors. Poor decision-making can result from relying too heavily on technical analysis.
- Lack of diversification: Focusing too heavily on a single trading technique leads to a lack of diversification, enhancing the risk of losses if the strategy doesn’t work out as expected.
Conclusively, Traders should not completely rely on the Evening Star pattern as they are subject to false signals and continuously changing market conditions.
Is Evening Star Candlestick Profitable?
Yes, the Evening Star Candlestick Pattern can prove to be profitable if traded cautiously. The Evening Star pattern does not ensure constant profits, but it is a reliable signal of a trend reversal. Useful risk management techniques, like putting stop-loss orders and restricting the number of your transactions, are essential for minimizing potential losses. The success of the Evening Star candlestick pattern, like any other trading method, ultimately depends on the knowledge, proficiency, and risk management of the trader.
Is Evening Star Candlestick Bullish?
No, Evening Star Candlestick is not a Bullish candlestick pattern. The Evening Star Candlestick pattern is a potential bearish trend reversal pattern.
What are other types of Triple Candlestick Patterns?
The three other types of triple candlestick patterns are the Morning Star candlestick pattern, Three white soldiers pattern and Three Black Crows pattern.
- Morning star candlestick pattern: A morning star candlestick pattern is a visual pattern made up of three candlesticks that are considered bullish signs by technical analysts. A morning star develops in a downward direction and marks the beginning of an uptrend.
- Three white soldiers pattern: The Three White Soldiers pattern occurs when three long bullish candles follow a downtrend, indicating a reversal has occurred. Particularly when it happens following an extended downturn and a brief period of consolidation, this type of triple candlestick pattern is regarded as one of the most powerful bullish signs. The reversal candle is the first of the “three soldiers”. It either signifies the end of the decline or that the consolidation phase that followed the downtrend has ended.
The second candlestick must be larger than the body of the first candle for the Three White Soldiers pattern to be legitimate. The final candlestick must be at least the size of the second candle and have little to no shadow to complete the Three White Soldiers pattern.
- Three Black Crows Pattern: Three Black Crows patterns appear when three bearish candles are created after a significant uptrend, indicating a reversal. The body of the second candle should be larger than the first candle’s and should be close to the first candle’s low. Finally, the body of the third candle should be the same size as the body of the second candle or larger, with no lower shadow or a very brief one.
The final candlestick must be at least the same size as the second candle and have little to no shadow for the Three Black Crows pattern to be complete.
What is the difference between an Evening Star Candlestick and a Morning Star Candlestick?
Morning Star and Evening Star candlestick patterns indicate upcoming significant trend reversals that could change market sentiment. The Morning Star is regarded as a positive sign, whilst the Evening Star indicates a change for the negative.
Evening Star indicates a bearish trend reversal, whereas Morningstar indicates a bullish trend reversal.
What Is the Difference Between Evening Star and Hanging Man Candlestick?
The major difference between the Evening Star and Hanging Man Candlestick patterns is that the former is a three-candle pattern while the latter is a single-candle pattern. The Hanging Man predicts a probable reversal but not necessarily a big shift in trend, whereas the Evening Star predicts a more significant change in momentum.
Arjun is a seasoned stock market content expert with over 7 years of experience in stock market, technical & fundamental analysis. Since 2020, he has been a key contributor to Strike platform. Arjun is an active stock market investor with his in-depth stock market analysis knowledge. Arjun is also an certified stock market researcher from Indiacharts, mentored by Rohit Srivastava.
Shivam is a stock market content expert with CFTe certification. He is been trading from last 8 years in indian stock market. He has a vast knowledge in technical analysis, financial market education, product management, risk assessment, derivatives trading & market Research. He won Zerodha 60-Day Challenge thrice in a row. He is being mentored by Rohit Srivastava, Indiacharts.
Leave a Reply


Recently Published
More in this topic

Join the stock market revolution.
Get ahead of the learning curve, with knowledge delivered straight to your inbox. No spam, we keep it simple.
Comments