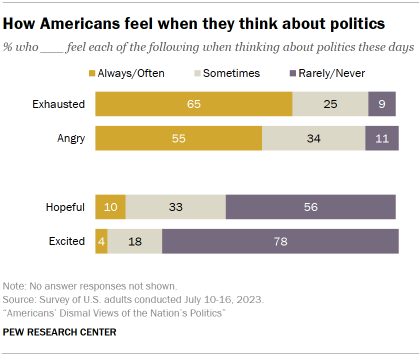
65% say they always or often feel exhausted when thinking about politics

Pew Research Center conducted this study to better understand how Americans view the state of U.S. politics today, and to explore in depth how the public thinks about the quality of their political representation and the relationship between political actors and the people they represent. This analysis seeks to examine feelings about the U.S. government, the political environment, elected officials and political candidates and shed further light on the specific factors contributing to overall views.
This report is based primarily on a survey of 8,480 adults from July 10 to July 16, 2023. Some of the analysis in this report is based on a survey of 5,115 adults from June 5 to 11, 2023. Everyone who took part in these surveys is a member of the Center’s American Trends Panel (ATP), an online survey panel that is recruited through national, random sampling of residential addresses. This way nearly all U.S. adults have a chance of selection. The survey is weighted to be representative of the U.S. adult population by gender, race, ethnicity, partisan affiliation, education and other categories. Read more about the ATP’s methodology.
Here are the questions used for the report, along with responses, and its methodology.
Americans have long been critical of politicians and skeptical of the federal government. But today, Americans’ views of politics and elected officials are unrelentingly negative, with little hope of improvement on the horizon.
Majorities say the political process is dominated by special interests, flooded with campaign cash and mired in partisan warfare. Elected officials are widely viewed as self-serving and ineffective.
A comprehensive new Pew Research Center study of the state of the nation’s politics finds no single focal point for the public’s dissatisfaction. There is widespread criticism of the three branches of government, both political parties, as well as political leaders and candidates for office.
Notably, Americans’ unhappiness with politics comes at a time of historically high levels of voter turnout in national elections. The elections of 2018, 2020 and 2022 were three of the highest-turnout U.S. elections of their respective types in decades.
But voting in elections is very different from being satisfied with the state of politics – and the public is deeply dissatisfied.
- Just 4% of U.S. adults say the political system is working extremely or very well; another 23% say it is working somewhat well. About six-in-ten (63%) express not too much or no confidence at all in the future of the U.S. political system.
- Positive views of many governmental and political institutions are at historic lows. Just 16% of the public say they trust the federal government always or most of the time. While trust has hovered near historic lows for the better part of the last 20 years, today it stands among the lowest levels dating back nearly seven decades. And more Americans have an unfavorable than favorable opinion of the Supreme Court – the first time that has occurred in polling going back to the late 1980s.
- A growing share of the public dislikes both political parties. Nearly three-in-ten (28%) express unfavorable views of both parties, the highest share in three decades of polling. And a comparable share of adults (25%) do not feel well-represented by either party.
- Candidate choices are underwhelming. As the presidential campaign heats up, 63% of Americans say they are dissatisfied with the candidates who have emerged so far. Setting aside the presidential campaign, there has been a downward trend in views of the quality of all political candidates. Just 26% rate the quality of political candidates as very or somewhat good, down about 20 percentage points since 2018.
- Majorities back age and term limits and eliminating the Electoral College. Reflecting the public’s frustration with the federal government and political leaders, large shares of Americans support various changes to the political system, including for such long-standing proposals as establishing term limits for members of Congress and scrapping the Electoral College. Age limits – for both federal elected officials and members of the Supreme Court – draw broad support. But there is little appetite in the public for increasing the size of the U.S. House or modifying the allocation of Senate seats.
The new study of Americans’ views of the state of the political system is primarily based on a survey conducted July 10-16, 2023, among 8,480 adults, with additional data from a survey conducted June 5-11, 2023, among 5,115 adults. Both were conducted on Pew Research Center’s nationally representative American Trends Panel.
A little more than a year before the presidential election, nearly two-thirds of Americans (65%) say they always or often feel exhausted when thinking about politics, while 55% feel angry. By contrast, just 10% say they always or often feel hopeful about politics, and even fewer (4%) are excited.
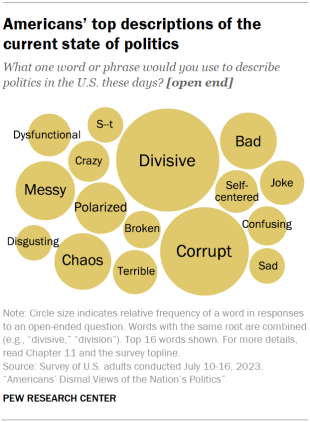
The survey also provides people several opportunities to describe in their own words their feelings about the political system and elected officials. When asked to sum up their feelings about politics in a word or phrase, very few (2%) use positive terms; 79% use negative or critical words, with “divisive” and “corrupt” coming up most frequently.
We also asked people to identify the strengths of the political system, as well as its weaknesses. Among the positive responses, roughly one-in-ten point to the structures of U.S. government, including its system of checks and balances (12%), freedoms and democratic values (9%) and the opportunity to vote in elections (8%).
Yet it is telling that a majority of Americans are unable or unwilling to identify strong points of the nation’s political system. While about a third gave no answer, another 22% write “nothing” – meaning that in their view, the political system does not have any strengths.
Explore this report
This overview covers key takeaways from our study of Americans’ attitudes about the political system and political representation. For more in-depth analysis, we encourage you to explore the full report. All chapters are listed out in the table of contents and at the bottom of the page.
These views and other negative sentiments are widely shared among older and younger Americans, White, Black, Hispanic and Asian adults, people who are highly engaged in politics and those who are less engaged. And in most cases, the partisan differences in these attitudes are relatively modest.
In an era defined by partisan polarization, the parties share little common ground politically. But they do share a deep unhappiness with the current state of politics.
The impact of partisan polarization
Ordinary Americans are more polarized than in the past. Partisan divisions on issues are wider than they were a few decades ago, and many Americans hold deeply negative views of those on the “other side” of politics.
Yet the public also is highly critical of the impact of partisan polarization on politics.
More than eight-in-ten Americans (86%) say the following is a good description of politics: “Republicans and Democrats are more focused on fighting each other than on solving problems.”
Asked to describe in their own words the biggest problem with the political system, 22% of Americans volunteer partisan polarization or lack of partisan cooperation. Only critiques of politicians (31%) are mentioned more frequently.
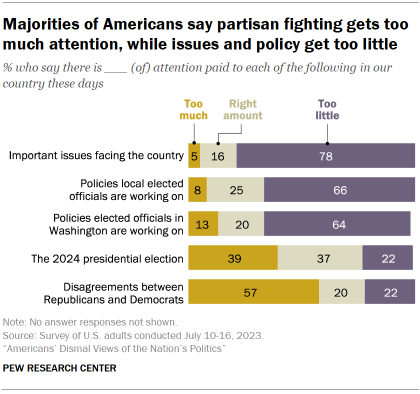
Most people (57%) also believe that conflicts between Republicans and Democrats receive too much attention these days. And 78% say there is too little focus on important issues facing the country.
Persistent concerns over money in politics
The public’s belief that special interests and campaign donors have too much influence on politics is not new. Since the 1970s, large majorities have said that the government “is run by a few big interests looking out for themselves,” rather than for the benefit for all the people.
Yet money in politics emerges again and again as a major source of public frustration.
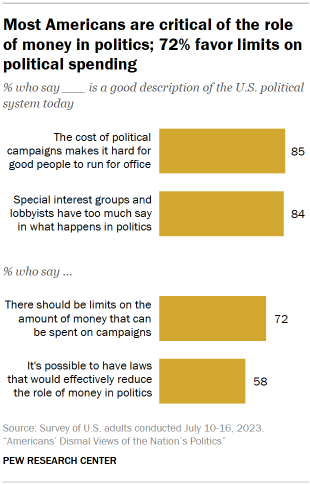
- Most say the cost of campaigns keeps good candidates from running. An overwhelming majority (85%) holds the view that “the cost of political campaigns makes it hard for good people to run for office.”
- Members of Congress are widely seen as mixing financial interests with their work. About eight-in-ten Americans (81%) say members of Congress do a very or somewhat bad job of “keeping their personal financial interests separate from their work in Congress.”
- Americans feel major donors have too much influence. Large majorities say big campaign donors (80%) and lobbyists and special interests (73%) have too much influence on decisions made by members of Congress.
People in members’ own districts, by contrast, are widely viewed as having too little influence (70% say this).
A sizable majority (72%) – including comparable majorities in both parties – support limits on the amounts of money individuals and organizations can spend on political campaigns. And 58% believe it is possible to have laws that would effectively reduce the role of money in politics. (Explore this further in Chapter 5.)
Views of the parties and possible changes to the two-party system
Neither party is particularly popular with the public. Only about four-in-ten adults have a favorable view of the Democratic Party (37%), while about as many (36%) have a favorable impression of the Republican Party.
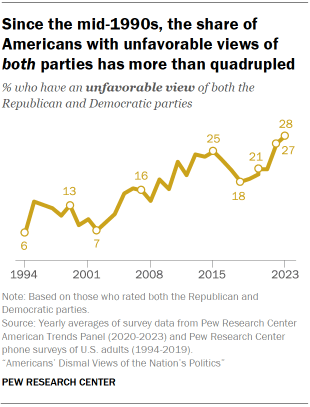
An increasing share of Americans express negative opinions of both parties. Currently, 28% of the public has an unfavorable opinion of both the Republican and Democratic parties.
That is little changed from a year ago, but nonetheless is the highest share expressing dislike of both parties in nearly three decades. In 1994, just 6% of Americans viewed both parties negatively.
Many people are open to the idea of having more political parties: 37% say the phrase “I often wish there were more parties to choose from” describes their views extremely or very well. Nearly half of independents and those who identify with other parties (47%) – including 56% of Democratic-leaning independents – say this. (Views of the two major parties, the party system and support for additional parties are discussed in more detail in Chapter 4 and Chapter 9.)
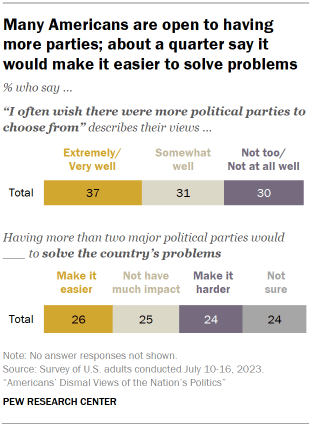
However, there is considerable skepticism that having more parties would make it easier for the country to solve its problems. About a quarter (26%) say it would make it easier to solve problems, while nearly as many (24%) say it would make it harder; a quarter say it would not have much impact.
The survey includes a number of proposals to change the way politics is run in this country. Some have attracted majority public support for many years, including ending the Electoral College system, placing term limits on members of Congress, automatically registering all citizens to vote and requiring all voters to show government-issued photo identification to vote. (Opinions about proposals for changing the political system are covered in Chapter 10.)
Large majorities of Americans also support:
- Age limits for federal elected officials. Amid widespread concern over the advanced age of many political leaders, including President Joe Biden, former President Donald Trump and some members of Congress, 79% of the public favors putting a maximum age in place for elected officials in Washington, D.C. These views also are widely shared across partisan lines.
- Age limits for the Supreme Court. Nearly as many Americans (74%) support putting age limits in place for justices of the Supreme Court. Democrats (82% favor) are more supportive of creating age limits for the justices than are Republicans (68%).
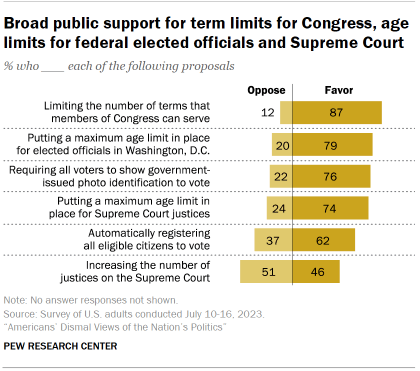
Another proposal that would dramatically affect the Supreme Court – increasing the number of justices – attracts considerably less support from the public.
Slightly more Americans oppose (51%) than favor (46%) increasing the number 0f justices on the court. There is a wide partisan gap in these views: Democrats (66%) are more than twice as likely as Republicans (27%) to favor expanding the court.
Other important findings
Recent presidential campaigns viewed as too long, not informative. Americans are not just unhappy about the current state of politics; they also take a critical view of recent presidential campaigns. Nearly eight-in-ten (78%) say recent nominees have not been good candidates, while large majorities also say the campaigns have not focused on the right issues or been informative, and 72% say they “lasted too long.” (Chapter 8)
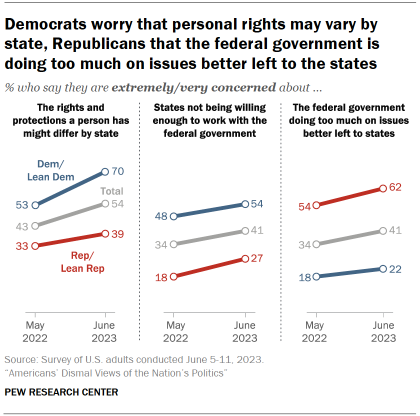
Growing public concerns over different dimensions of federal-state relations. A majority of Americans (54%) are extremely or very concerned that “the rights and protections a person has might be different depending on which state they are in,” up from 43% just a year ago. Increasing shares also express concerns about the federal government doing too much that is better left to the states, as well as state governments not being willing enough to work with the federal government. (Chapter 2)
Elected officials are held in extremely low regard. When asked why local and national elected officeholders run for office, relatively small shares of Americans say they run to serve the public or address issues they care about. By contrast, majorities say all or most politicians are motivated by selfish reasons, including 63% who say all or most ran for office to make a lot of money. (Chapter 7)
Majority says voting can affect the country’s direction. Nearly six-in-ten (57%) say voting by people like them can affect the country’s future direction, though just 20% say it can affect this a lot. Adults younger than 50 are less likely than older people to say voting can have at least some effect on the country’s future direction. (Chapter 5)


