
Monitoring Amazon EKS with Splunk Enterprise and Splunk Cloud
June 6, 2018Amazon Elastic Container Service for Kubernetes (Amazon EKS) is a managed service that makes it easy for you to run Kubernetes on AWS without needing to stand up or maintain your own Kubernetes control plane.
Congratulations to the AWS team for shipping such a great product. Based on the data provided by CNCF, more than half of all companies who run Kubernetes choosing to do so on AWS. Managing Control Plane is not the most straightforward task. EKS does that for you. The only thing that is up to you - to bootstrap working nodes and run your applications.
We are proud to announce that our solution for Monitoring Kubernetes works with the Amazon EKS from day one.
To get started follow the Installation instructions and use appropriate configuration for the specific version of Kubernetes. At this moment only Kubernetes version 1.10 can be deployed on EKS.
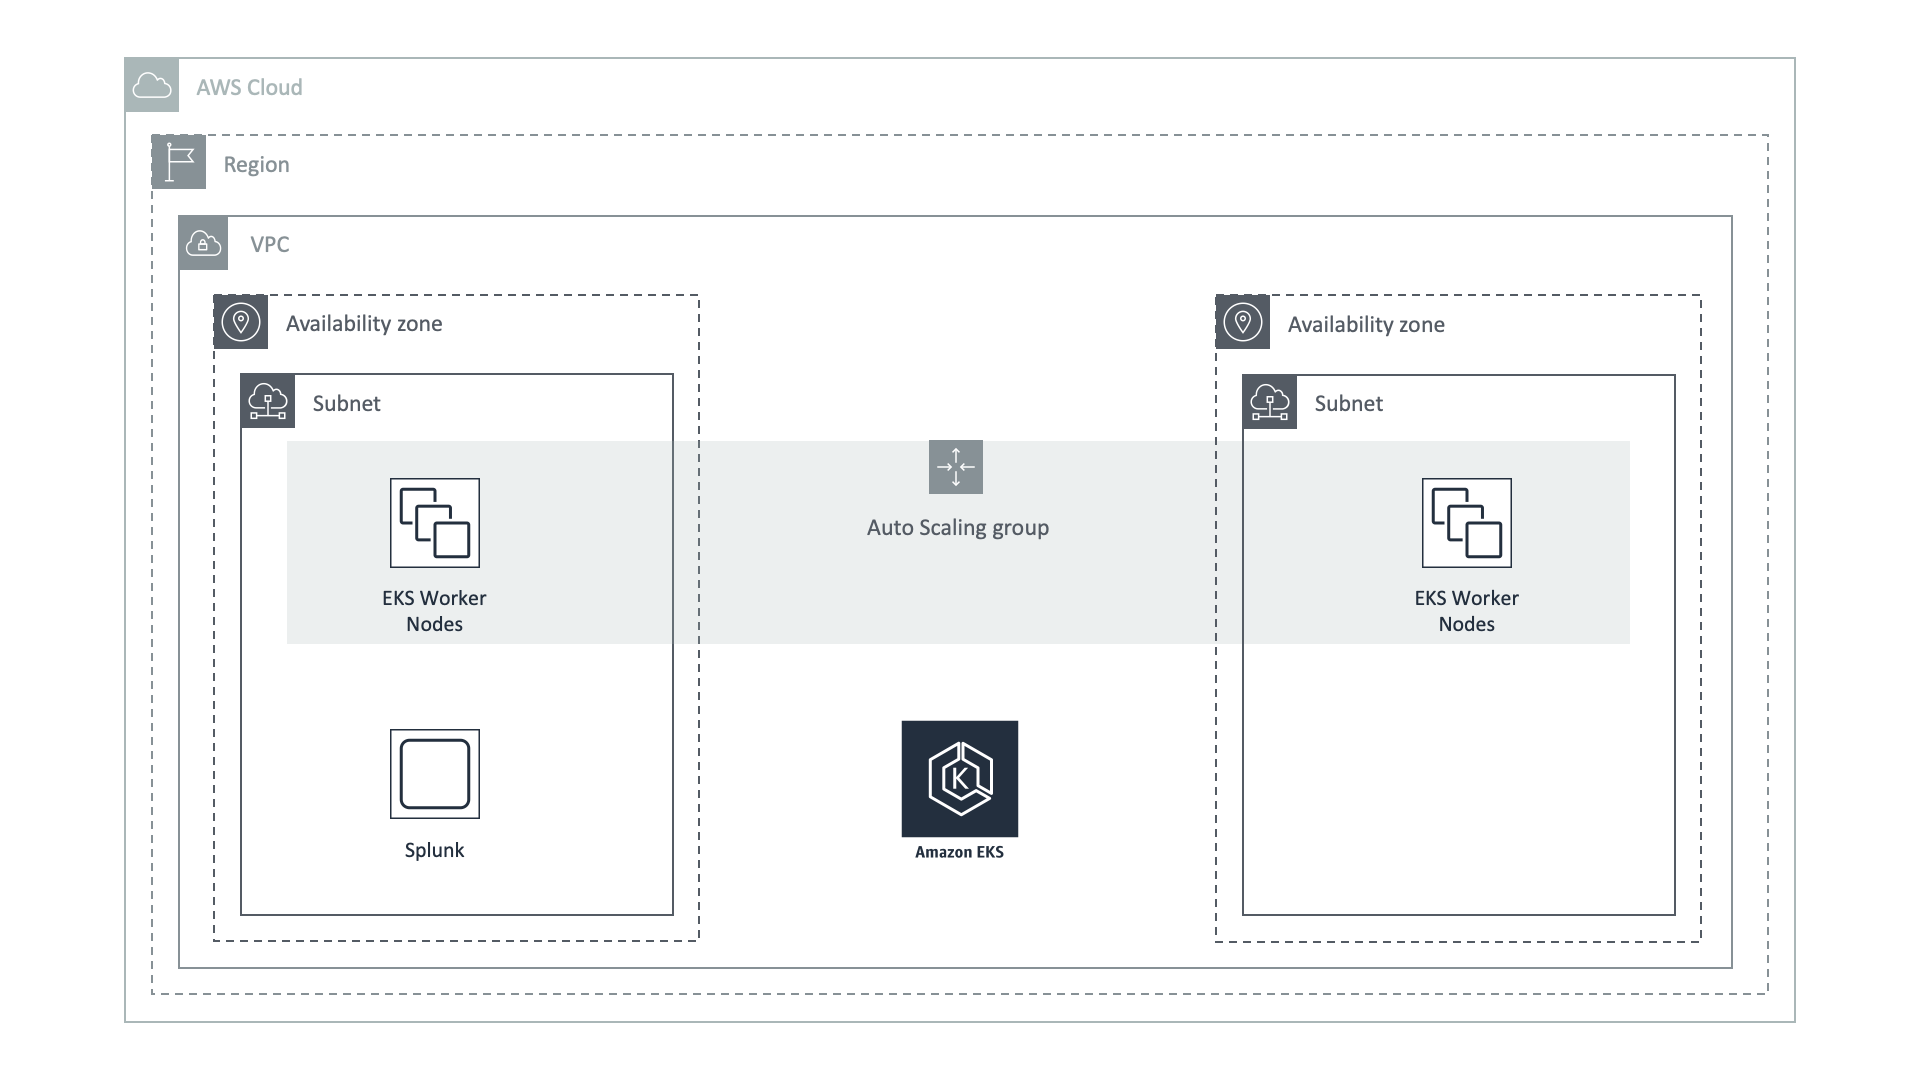
In our example we used EKS and Splunk deployed at the same Region and the same VPC. But there is no special requirements on your Splunk Enterprise deployment. You can also use Splunk Cloud with our solution. The only requirement is to give EKS cluster access to the Splunk HTTP Event Collector endpoint, which is usually deployed on port 8088.
After performing all the steps from the Installation instructions you will see that DaemonSet for worker nodes will schedule Pods with our collector on every worker node, and one addon Pod will be deployed for collecting Kubernetes events. Because you don't have access to the Master nodes - you can delete DaemonSet for masters or safely ignore it.
With the default configuration, you will get metrics from the worker nodes, you will see detailed metrics for the nodes, pods, containers and processes. Container and host logs will be automatically forwarded as well.
From the control plane you will be able to see the Kubelet metrics in the application.
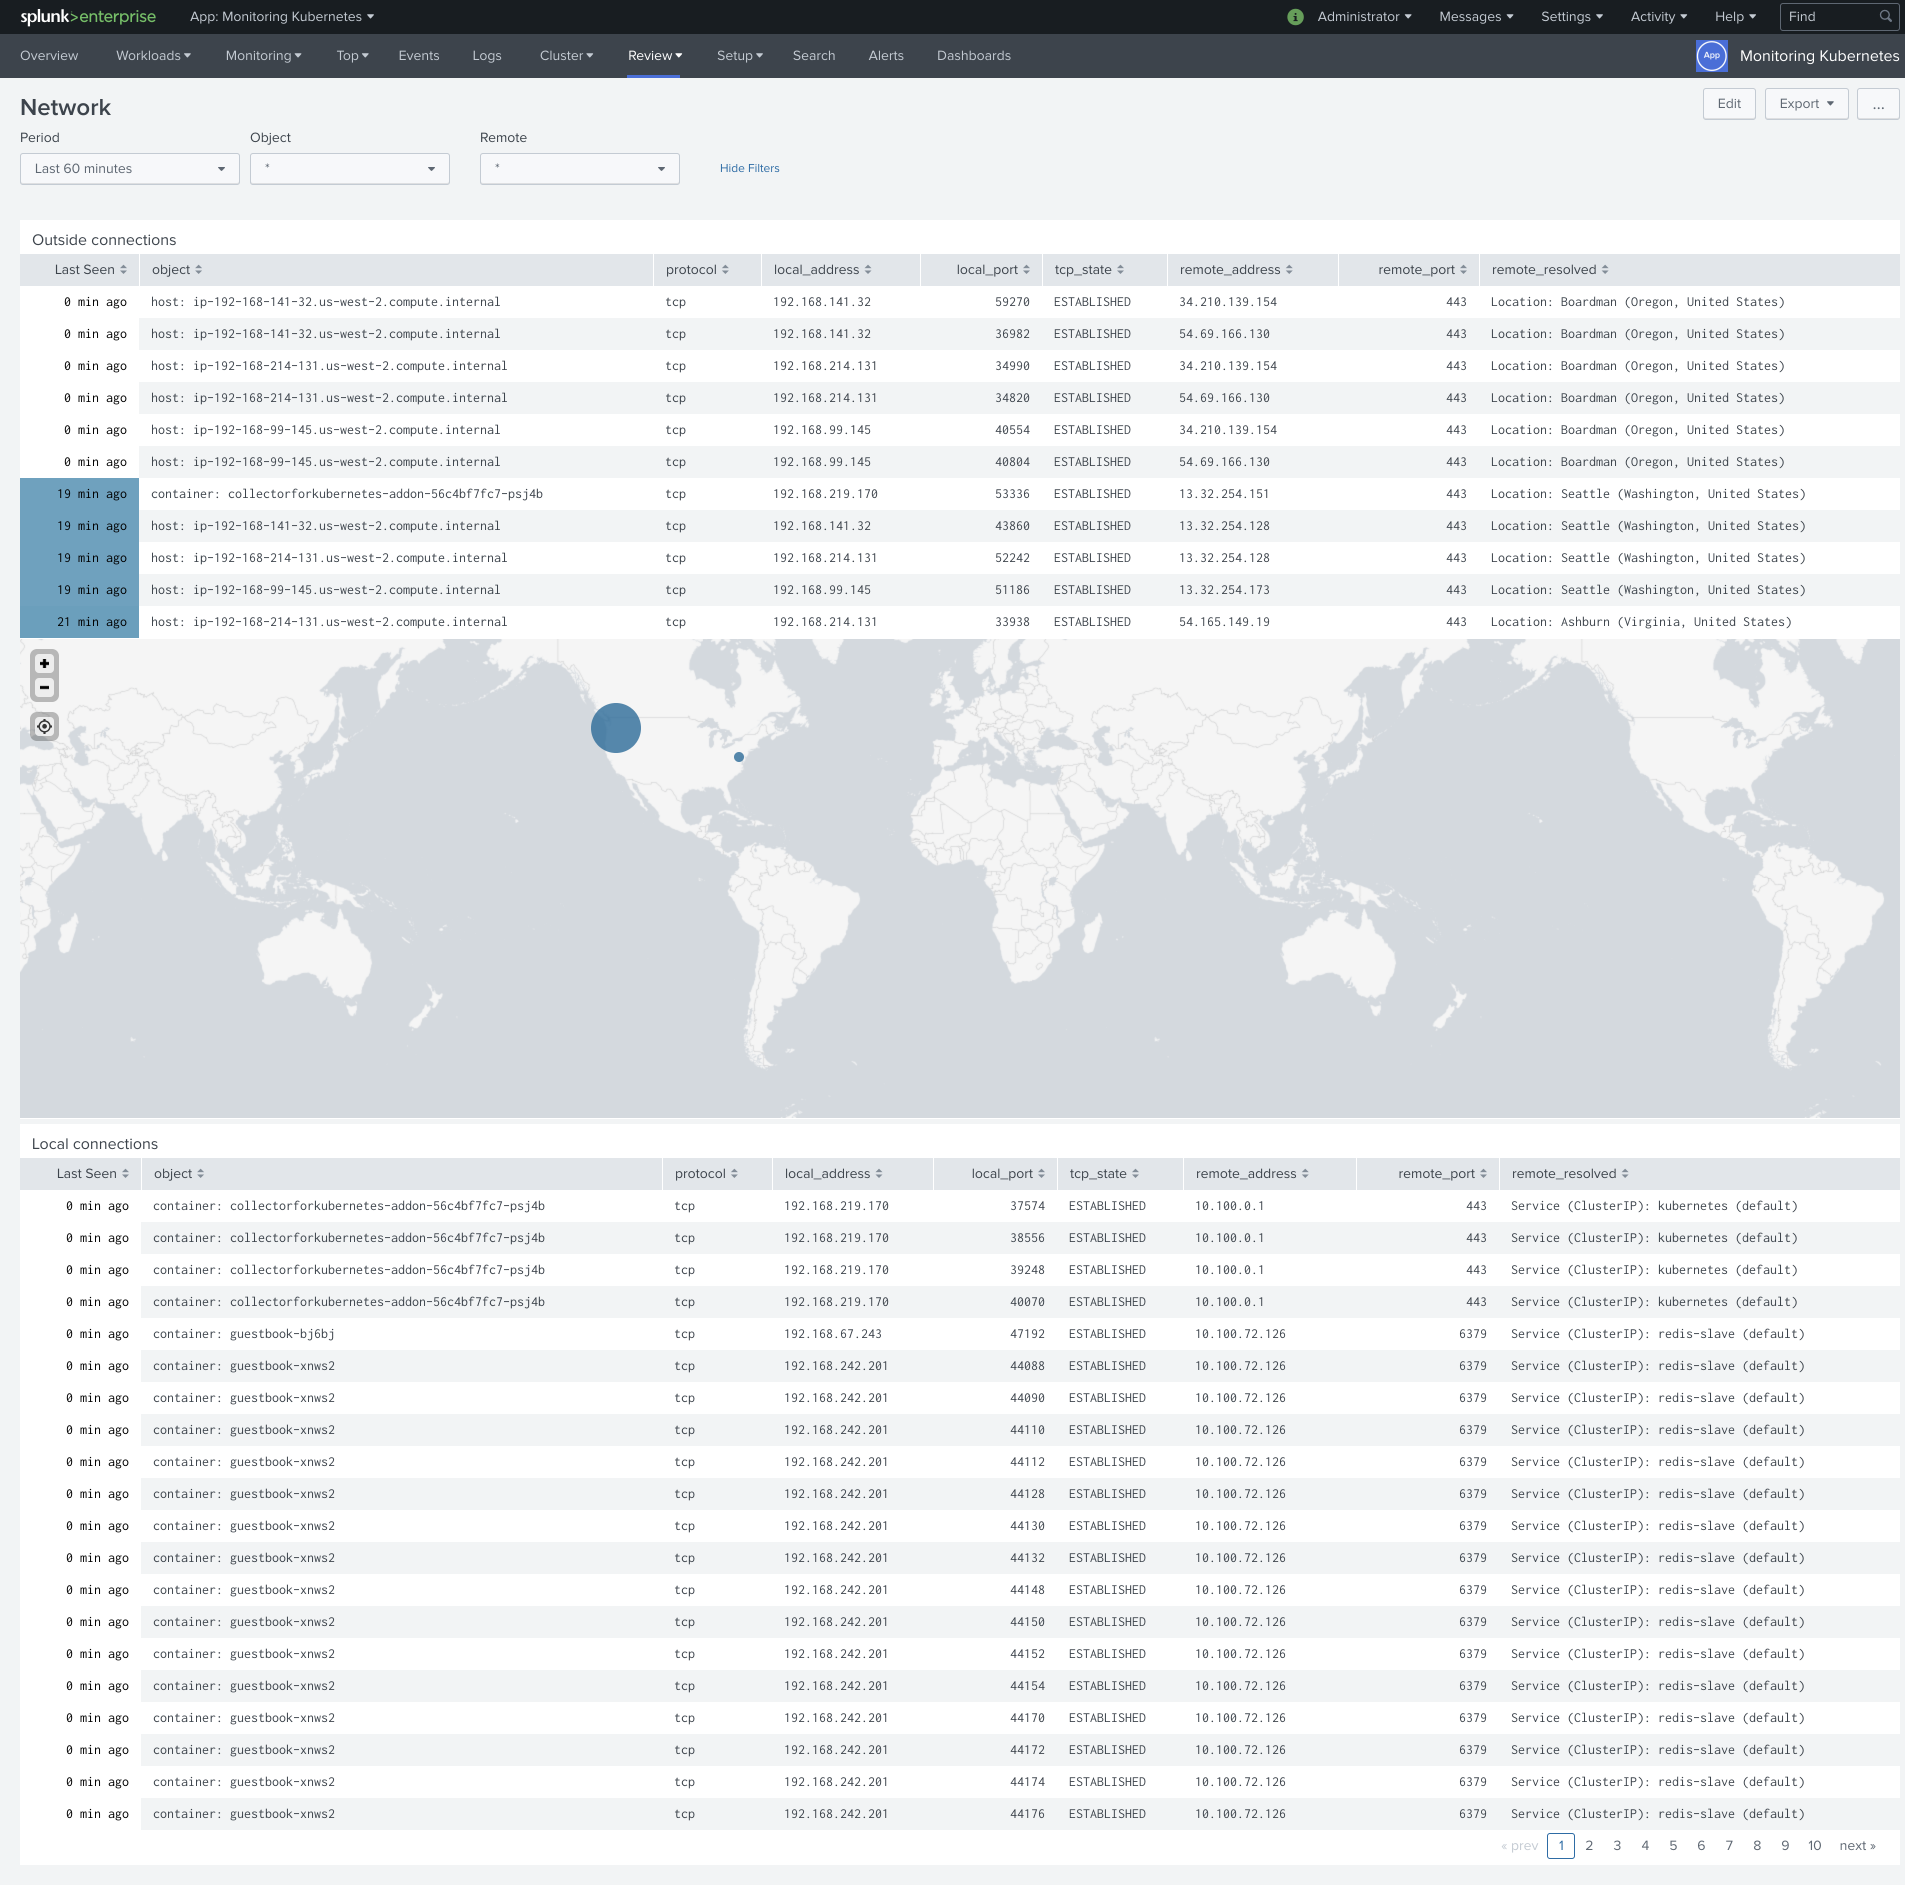
You will be able to review Network
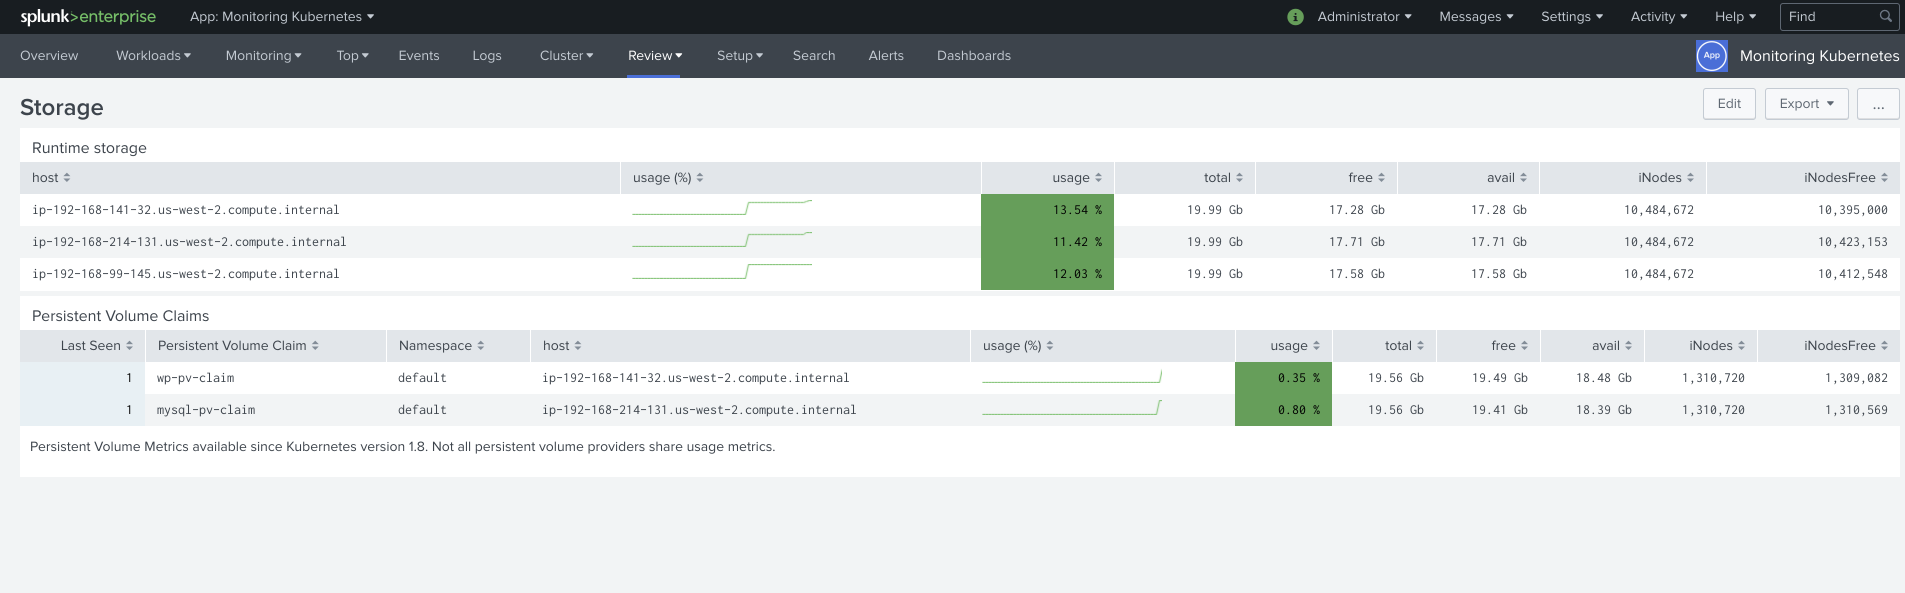
And monitor PVC and Instance storage usage
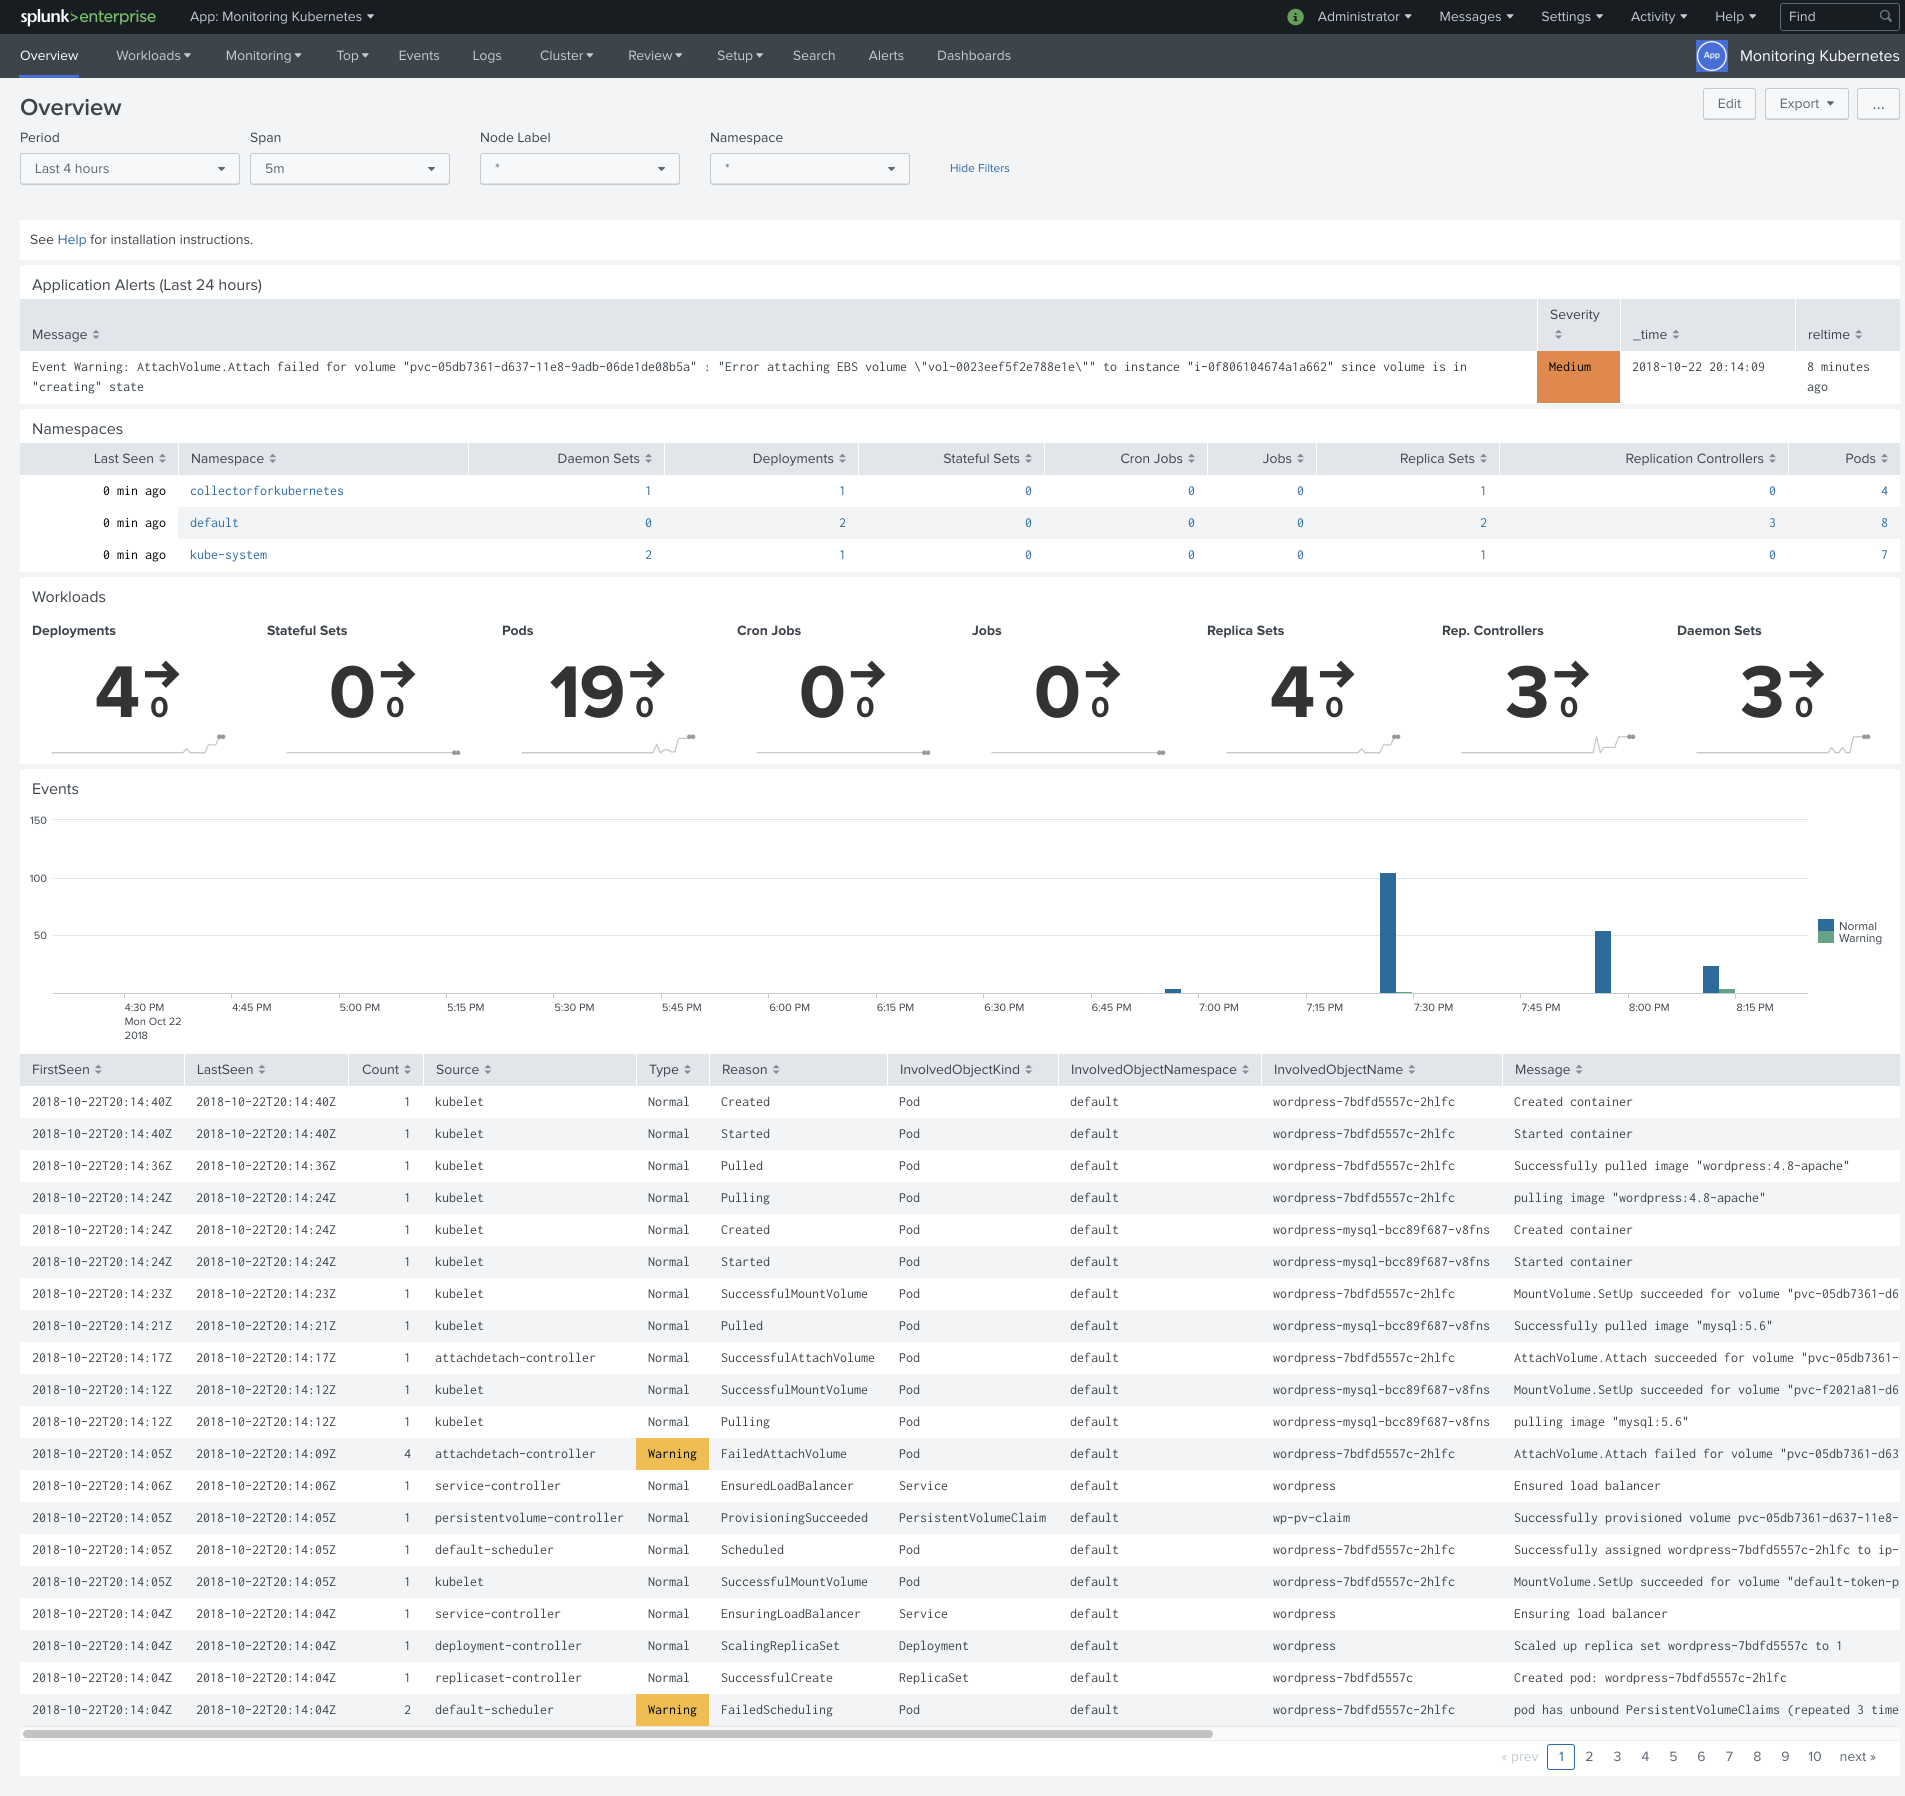
We have over 30 alerts pre-built for you, which will highlight for you issues with your deployments and workloads you are running
All other Cluster information will be unavailable because you don't have access to the metrics of Scheduler, etcd, and controller. But you can still collect metrics from API Server. By default in our configuration we expect every collector on master nodes to collect metrics from the Kubernetes API processes. But because in the case of EKS you don't have access to the Master nodes you can schedule collection of the Kubernetes API from the addon.
In our configuration file find the section of ConfigMap with the file definition for the addon 004-addon.conf and
add a section as in the example below (lines 6-42).
1 2 3 4 5 6 7 8 9 10 11 12 13 14 15 16 17 18 19 20 21 22 23 24 25 26 27 28 29 30 31 32 33 34 35 36 37 38 39 40 41 42 | 004-addon.conf: | [general] ... [input.prometheus::kubernetes-api] # disable prometheus kubernetes-api metrics disabled = false # override type type = prometheus # specify Splunk index index = # override host host = kubernetes-eks-api-server # override source source = kubernetes-api # how often to collect prometheus metrics interval = 60s # prometheus endpoint endpoint.kubeapi = https://${KUBERNETES_SERVICE_HOST}:${KUBERNETES_SERVICE_PORT}/metrics # token for "Authorization: Bearer $(cat tokenPath)" tokenPath = /var/run/secrets/kubernetes.io/serviceaccount/token # server certificate for certificate validation certPath = /var/run/secrets/kubernetes.io/serviceaccount/ca.crt # client certificate for authentication clientCertPath = # Allow invalid SSL server certificate insecure = true # include metrics help with the events includeHelp = false |
After that restart the addon pod. Find the pod id
$ kubectl get pods --namespace collectorforkubernetes
NAME                                            READY     STATUS    RESTARTS   AGE
collectorforkubernetes-addon-546bd58878-4qk44   1/1       Running   0          48m
collectorforkubernetes-g2wbg                    1/1       Running   0          55m
collectorforkubernetes-gwdg5                    1/1       Running   0          55m
collectorforkubernetes-rsh44                    1/1       Running   0          55m
And delete the addon pod with
$ kubectl delete pod collectorforkubernetes-addon-546bd58878-4qk44 --namespace collectorforkubernetes
pod "collectorforkubernetes-addon-546bd58878-4qk44" deleted
New pod will be scheduled with updated configurations. In few minutes you should be able to see API Kubernetes Metrics in our application.
Links
If you are getting errors when trying to access the API from CLI, like
error: the server doesn’t have a resource type “cronjobs”orerror: You must be logged in to the server (Unauthorized), check the article Common errors when setting up EKS for the first time. You need to be sure that you are creating EKS cluster with the same IAM that is going to access the API. In our case, we were using MFA for managing temporary sessions, which caused errors similar to the described above.


