


Effect of Palmitic Acid on Tertiary Structure of Glycated Human Serum Albumin


Department of Physical Pharmacy, Faculty of Pharmaceutical Sciences in Sosnowiec, Medical University of Silesia in Katowice, 40-055 Katowice, Poland
Processes 2023, 11(9), 2746; https://doi.org/10.3390/pr11092746
Submission received: 15 August 2023
/
Revised: 9 September 2023
/
Accepted: 12 September 2023
/
Published: 14 September 2023
(This article belongs to the Special Issue Processes in 2023)
Abstract
:Non-enzymatic glycation is a process, which can be best described as a significant posttranslational modification of various proteins. It emerges in hyperglycemic conditions and may have an impact on albumin stability as well as its activity and physical and chemical properties, essentially affecting all its physiological functions. The goal of this research was to answer the following questions: (i) how does the glycation of defatted human serum albumin by glucose–fructose syrup (GFS) alter its tertiary structure; (ii) does palmitic acid (PA), a component of palm oil, affect the in vitro glycation process and cause conformational changes of glycated albumin; and (iii) does PA inhibit the formation of Advanced Glycation End-Products (AGEs)? Therefore, in order to point out differences in the tertiary structure of macromolecules, the absorption and emission of fluorescence spectra and their second derivatives, excitation fluorescence and synchronous spectra, Red-Edge Excitation Shift (REES effect), and the degree of modification of sulfhydryl groups of defatted, non-glycated (HSA) and glycated human serum albumin (gHSA) with GFS and glycated with GFS and PA were investigated. In the present study, it has been confirmed that the glycation of albumin in the presence of GFS and PA causes changes in both HSA and gHSA tertiary structures, respectively. Moreover, palmitic acid, at ratios of 1.5:1 and 3:1 with glycated albumin, does not exhibit inhibition of AGEs formation. This study indicates the fact that the structural changes, especially those of glycated albumin, are important for treatment planning because the type of the interaction between the components and their primary transporter may be altered as the disease progresses or in the elderly.
1. Introduction
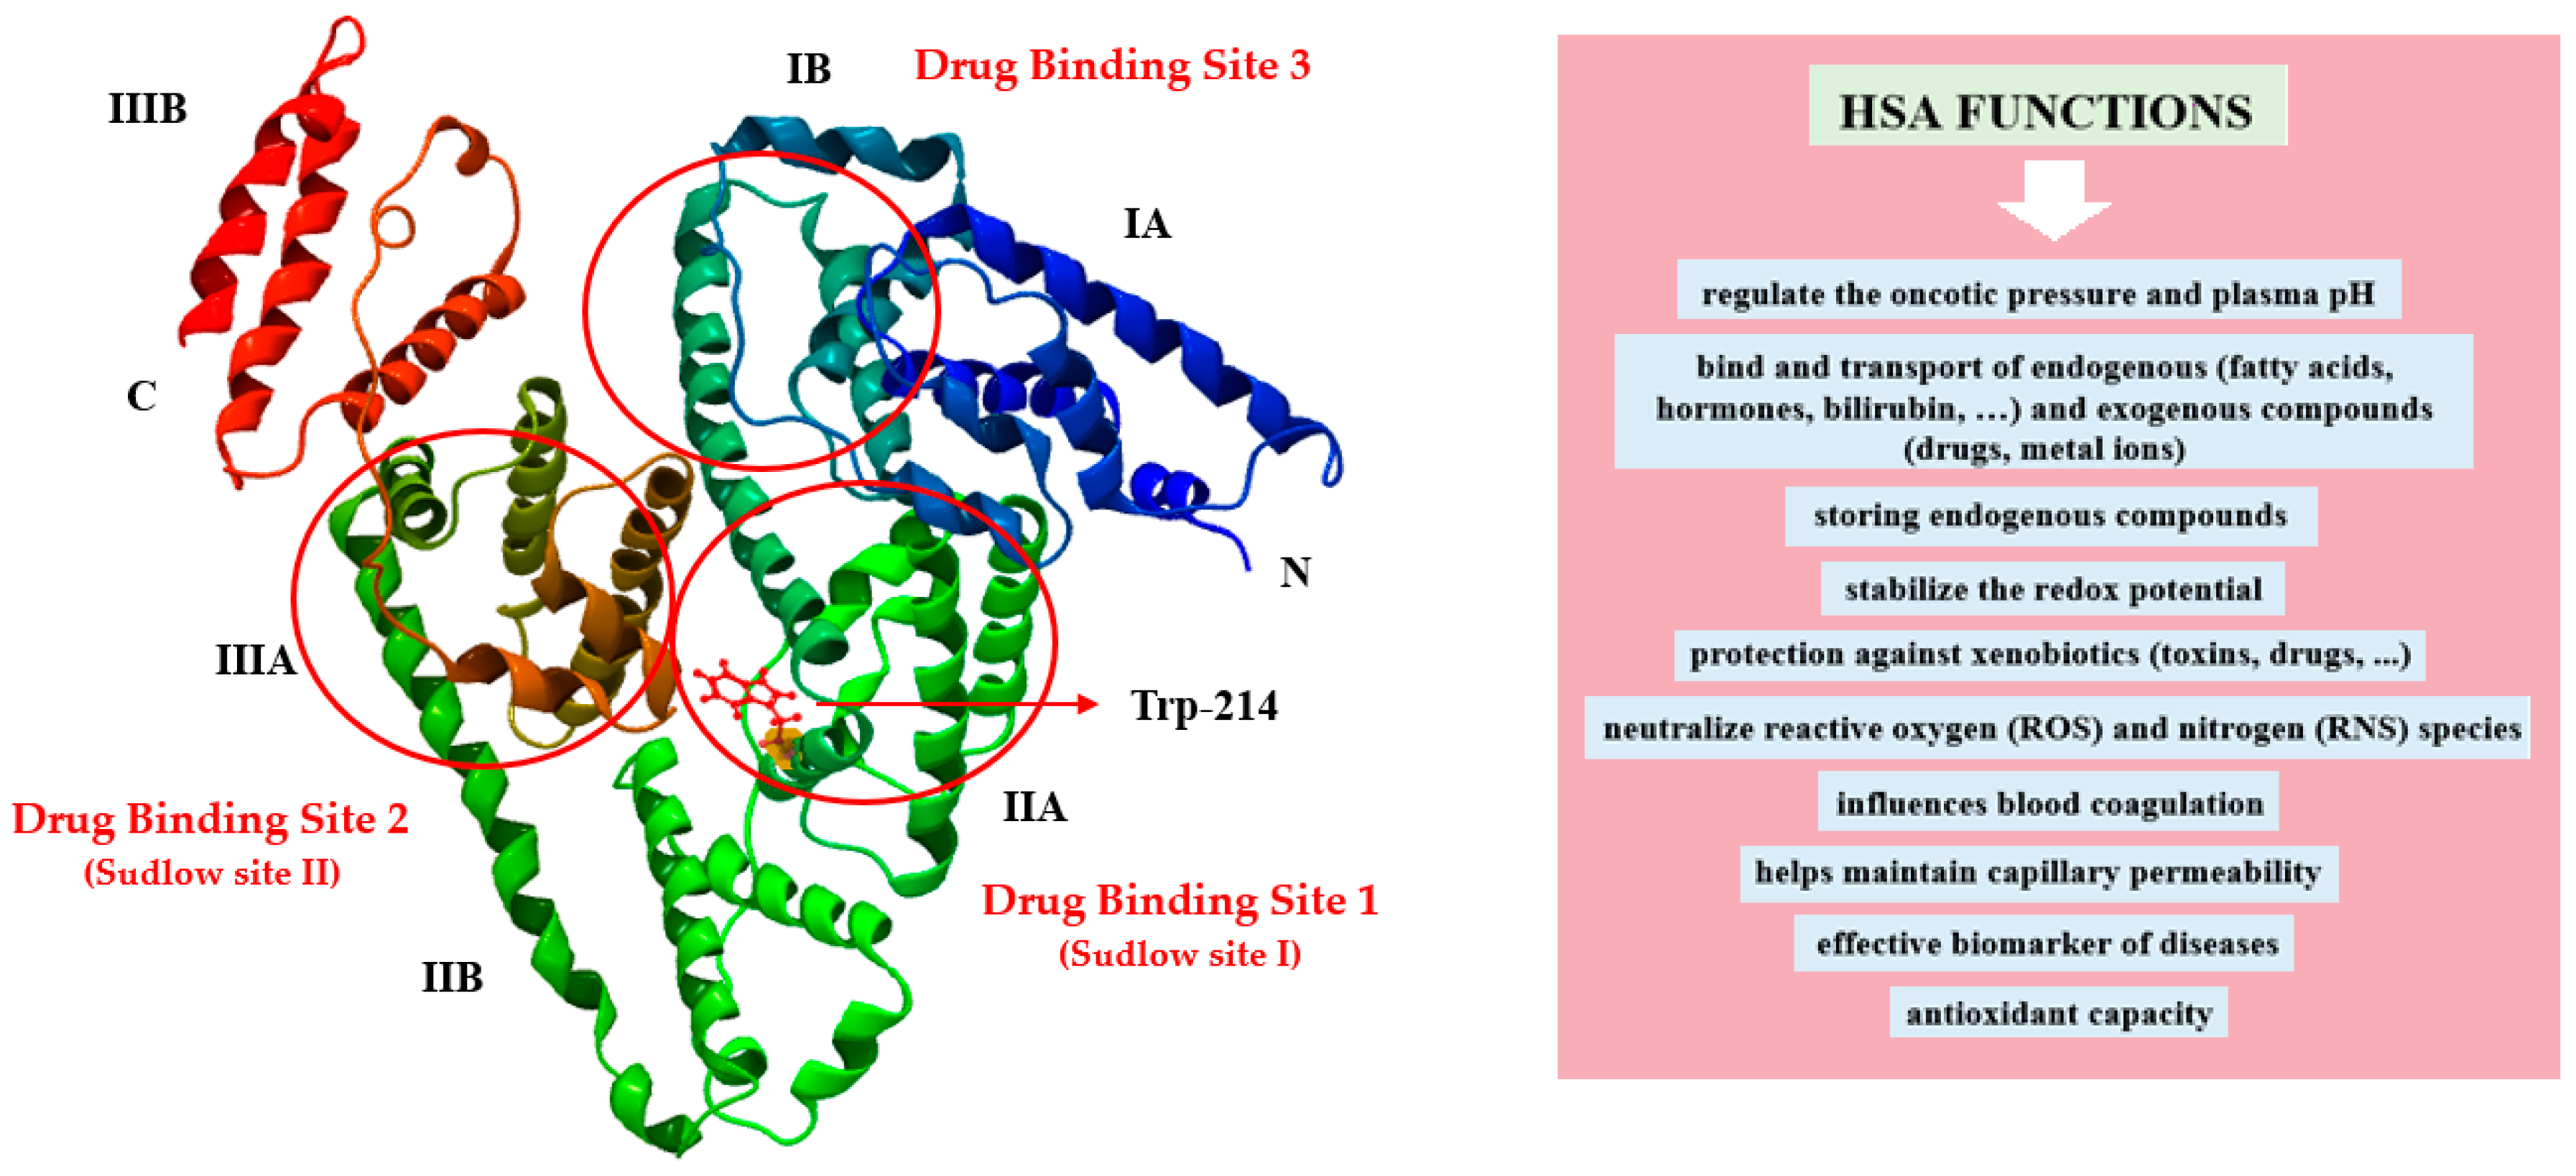
Present at levels of 30–50 g·L−1 in blood, human serum albumin (HSA) is the principal plasma constituent, constituting approximately 50–60% of all plasma proteins [1]. Synthesized in the liver (about 12–25 g/day) as preproalbumin, HSA undergoes maturation within the endoplasmic reticulum and Golgi apparatus before secretion by hepatocytes [1,2]. Albumin exists in both intra- and extravascular compartments and ionizes at physiological pH ~7.4 (pK 4.8), explaining its high solubility in water [3]. HSA performs a variety of physiological and pharmacological functions in vivo (Figure 1), making it an optimal candidate for clinical and biotechnological applications. Specifically, HSA regulates oncotic pressure and plasma pH, exhibits antioxidant and enzymatic activities, and inactivates toxic substances. Additionally, it delivers various biologically endo- and exogenous substances, such as pharmaceuticals, hormones, fatty acids, nutrients, and metabolites, to their intended tissues [1,4]. In serum, the dissolvability of bioactive compounds is increased through the transport in complexes with HSA, which also contributes to the reduction of their potential toxicity and the prevention of their oxidation. Moreover, the bioavailability, distribution, pharmacokinetic, and pharmacodynamic properties of these compounds may undergo changes as a result of their binding with albumin. According to Sudlow’s classification, drugs bind to HSA at two high-affinity binding sites known as site I and site II, which are situated within specific pockets in subdomain IIA and IIIA, respectively [5,6]. Hydrophobic interactions dominate the drug binding within subdomain IIA, whereas it is slightly different in subdomain IIIA, where apart from hydrophobic interaction, there are also electrostatic interactions and hydrogen bonds [5]. The subdomain IB’s third active site, known as site 3, has been determined to be the primary binding site for certain compounds exhibiting distinct properties like bilirubin photoisomer, hemin, and fusidic acid [5,7]. Figure 1 illustrates the molecular conformation of HSA, with the locations of Sudlow’s sites I and II and site 3, while also presenting its main functions in the body.
The HSA molecule is a single-chain, globular, heart-shaped protein of 585 amino acids residues with a molecular weight between 66.5 and 66.9 kDa. High-resolution X-ray crystallography structures reveal three structurally similar α-helical domains in albumin: domain I (aa: 1–195), domain II (aa: 196–383), and domain III (aa: 384–585). Those domains are divided into pairs of subdomain “A” (comprising six α-helical) and “B” (comprising four α-helical). HSA is also reinforced by 17 intramolecular disulfide bridges that contribute to its structural integrity and stability [6]. HSA contains one tryptophanyl residue (Trp-214) (Figure 1), 17 tyrosyl residues, 35 cysteinyl residues, and a single unbound sulfhydryl group SH (Cys-34), which can undergo a variety of structural modifications [1,10]. The process of non-enzymatic glycation, which represents a significant posttranslational modification of albumin, is visible during the persistent state of hyperglycemia. It might have an impact on albumin’s stability, activity, physical and chemical properties, and physiological functions [11]. Reactive glycation products, known as Advanced Glycation End-Products (AGEs), are formed during the final stages of the glycation process. AGEs comprise a heterogeneous mixture of compounds that can contribute to various organ and tissue disorders [12]. The progression of AGEs formation is amplified by aging and diabetes-induced hyperglycemia; thus, therapy should focus on inhibiting AGEs formation using specific substances (AGEs inhibitors). In general, 10% of albumin in healthy people is glycated, whereas this amount can increase 2–3 times during diabetes mellitus [11]. Consequently, glycated albumin serves as a reliable biochemical marker for short-term glycemic monitoring in diabetic patients and provides insights into subsequent complications [13].
Having strong nucleophilic properties, lysine (Lys) residues and arginine (Arg) residues as well as Cys-34 characterize a group of highly reactive amino acids prone to glycation of HSA in vivo (Figure 2) and in vitro glycation [11,14].
Human serum albumin, a carrier protein, is essential in transporting both unsaturated and saturated fatty acids (FAs). The structure of HSA is modulated by the amount of bound fatty acids, particularly during high-affinity binding packing [15]. The crystallographic analysis allowed for the identification of nine FA-binding sites within the HSA macromolecule, designated as FA1–FA9. These sites include all six subdomains of the protein, as illustrated in Figure 2 [16]. The FA active sites are categorized into two main groups based on their affinity: high affinity sites, which include FA2, FA4 and FA5, and low affinity sites, namely FA1, FA3, FA6, and FA7 [17]. Notably, the FA2 site coincides with the location of the first Sudlow binding site. Fatty acid binding to FA2 not only stabilizes the β-conformation of HSA but also initiates the ligand-induced structural transition [4,18]. Research indicates that Sudlow’s site II consists of two regions: an apolar region that accommodates the methylene tail of FAs, linking to FA3 and a polar region where the carboxylate group of FAs associates with FA4 [2]. Importantly, the fatty acids’ carboxylate head group reacts with Tyr-401 and Lys-525 residues [18].
Palmitic acid (PA), a straight chain of saturated fatty acid, accounts for 20–30% of total FAs in the human system. It can bind to seven regions in the HSA molecule, with two specific sites situated within subdomain IIIA [19,20]. PA is a substance whose source can be found either in the diet or synthesized endogenously using various nutrients, including carbohydrates and fatty acids [21]. Although PA is recognized for its essential physiological roles, this aspect has often been overshadowed by the emphasis on its adverse health effects [22].
In the present study, glucose–fructose syrup (55% GLC + 45% FRC, GFS) has been employed as an in vitro glycating agent for HSA. The impact of GFS on the human system has been thoroughly investigated. It appears to have a crucial role in the development of obesity, which itself being a chronic non-communicable disease, increases the risk of developing type 2 diabetes, lipid metabolism disorders, hypertension, cardiovascular diseases, kidney stones, gout, and some cancers [23,24,25]. High consumption of GFS may also lead to oxidative stress [26].
The binding properties of albumin may be affected by conformational reorganization in its spatial structure, which can be the effect of glycation. Additionally, significant drug interactions may be observed, especially in polytherapy. This knowledge is crucial in therapy planning, as the strength and nature of ligands’ interactions with their primary transporter might alter as the disease progresses, such as in the case of diabetes. The goal of this research is to answer the following: (i) how glycation of defatted human serum albumin by glucose–fructose syrup altered its tertiary structure; (ii) whether palmitic acid affects the in vitro glycation process and causes conformational changes of glycated albumin, which is a protein that simulates diabetes in the organism; and (iii) whether palmitic acid inhibits the formation of AGEs. Therefore, to show differences in the tertiary structure of macromolecules, the absorption and emission fluorescence spectra, as well as their second derivatives, excitation fluorescence and synchronous spectra, Red-Edge Excitation Shift (REES effect), and the degree of modification of sulfhydryl groups of defatted, unglycated serum albumin (HSA), HSA glycated with glucose–fructose syrup (gHSA), and HSA glycated with the syrup in the presence of palmitic acid (PA) with molar ratios of PA:gHSA 1.5:1 and 3:1 have been investigated.
2. Materials and Methods
2.1. Chemicals
Crystallized, lyophilized, and high-purity fatty-acid-free human serum albumin, fraction V (HSA, Lot No. 6312A) and palmitic acid (PA, Lot No. 6798H) were purchased from MP Biomedicals LLC (Inc., Illkirch, France). D(+)-glucose (GLC, Lot No. A0299881) and D(−)-fructose (FRC, Lot No. A0282904) were supplied by POCH S.A. (Gliwice, Poland). Sodium azide (NaN3, Lot No. BCBD6941V) and 5,5′-dithiobis-(2-nitrobenzoic acid) (Ellman’s Reagent, DTNB, Lot No. 69-78-3) were provided by Sigma-Aldrich Chemical Co. (Darmstadt, Germany) and methanol for spectroscopy from Merck KGaA (Darmstadt, Germany, Lot No. 32373611/18). The highest degree of purity of all chemicals was guaranteed and used as received by the producer.
2.2. Sample Preparation
A working solution of defatted human serum albumin (HSA) at 5.0 × 10⁻⁶ mol·L−1, glucose (GLC), and fructose (FRC) each at 1.25 mol·L−1 were prepared in phosphate buffer solution (pH 7.4 ± 0.1, 0.05 mol·L−1) with sodium azide (0.015 mol·L−1). A stock solution of palmitic acid (PA) at a concentration of 0.4 mol·L−1 was made by dissolving the required amounts in methanol. In order to study in vitro glycation of HSA by glucose–fructose syrup (GFS) and the influence of fatty acid–palmitic acid on the structure and the binding properties of glycated albumin, six samples were prepared:
- Control sample: solution of defatted HSA at a concentration of 5.0 × 10⁻⁶ mol·L−1.
- Solution of defatted HSA at 5.0 × 10⁻⁶ mol·L−1 in the presence of GFS (55% GLC + 45% FRC) at 0.05 mol·L−1.
- and 4. Control sample: solution of HSA at 5.0 × 10⁻⁶ mol·L−1 in the presence of PA in molar ratio PA:HSA 1.5:1 and PA:HSA 3:1, respectively.
- and 6. solution of HSA at 5.0 × 10⁻⁶ mol·L−1 in the presence of GFS (55% GLC + 45% FRC) at 0.05 mol·L−1 and PA in molar ratio PA:gHSA 1.5:1 and PA:gHSA 3:1, respectively.
The albumin solutions were filtered through non-pyrogenic membrane filters with a pore size of 0.22 μm (Merck KGaA, Darmstadt, Germany), then transferred into sterile capped test tubes, and incubated at a constant temperature of 37 °C for 21 days (the half-life of HSA [27]). After incubation, the solutions of glycated human serum albumin, both without (gHSA) and with palmitic acid (PA:gHSA 1.5:1, PA:gHSA 3:1), as well as the control samples (HSA, PA:HSA 1.5:1, PA:HSA 3:1), were dialyzed overnight at room temperature to remove excess residual sugars—unbound GLC and FRC (GFS). Dialysis was carried out against a phosphate buffer (0.05 mol·L−1) at pH 7.4 ± 0.1, and the albumin solutions were again re-filtered through membrane filters. All glassware and spatulas used for preparing the samples were sterilized in a lab dryer at 100 °C to prevent bacterial growth during preparation. The purity of both non-glycated (HSA, PA:HSA 1.5:1, PA:HSA 3:1) and glycated albumin (gHSA, PA:gHSA1.5:1, PA:gHSA 3:1) was confirmed, as the ratio of absorbance at 255 nm and 280 nm was less than 0.5 [28].
The modification of the free thiol group in the Cys-34 residue within macromolecules was quantitatively assessed using 5,5′-dithio-bis-(2-nitrobenzoic acid) (Ellman’s reagent, DTNB), freshly prepared. Ellman’s reagent, at a concentration of 0.01 mol·L−1, was added to HSA, gHSA, PA:gHSA1.5:1, and PA:gHSA 3:1 in a 3:1 DTNB:albumin molar ratio, and then incubated in the dark for 30 min [29]. The solutions of HSA, PA:gHSA1.5:1, PA:gHSA 3:1, and DTNB, which were prepared in the same manner, were treated as blanks.
2.3. Experimental Procedures
2.3.1. Fluorescence and UV-Vis Spectroscopy: Instrument and Measurement Conditions
The fluorescence (emission, excitation, and synchronous fluorescence spectra) and absorbance measurements for the samples of glycated human serum albumin (gHSA) both without and with palmitic acid (PA:gHSA 1.5:1, PA:gHSA 3:1), as well as the control samples (HSA), were recorded at 37 °C using a JASCO spectrofluorometer FP-6500 (Hachioji, Tokyo, Japan) and a spectrophotometer JASCO V-760 (Hachioji, Tokyo, Japan), respectively. For the analysis, quartz cuvettes with an optical path length of 10 mm were used. All protein fluorescence spectra were corrected for solvent dispersion (phosphate buffer, 0.05 mol·L−1, pH 7.4 ± 0.1) using software provided by JASCO (Spectra Manager program, Easton, MD, USA), and then presented using OriginPro version 8.5 SR1 software (Northampton, MA, USA).
The fluorescence spectra for the tryptophanyl (Trp-214) and thyrosyl (Tyr) residues of HSA, gHSA, PA:gHSA 1.5:1, and PA:gHSA 3:1 were measured at λex = 275 nm (λem = 285–400 nm), while the fluorescence spectra for almost exclusively the Trp-214 residue were measured at λex = 295 nm (λem = 305–400 nm). The Red Edge Excitation Shift effect (REES) of gHSA was compared to HSA, PA:gHSA1.5:1 and PA:gHSA 3:1 with the use of λex = 290 nm, λex = 295 nm, and λex = 300 nm (λem = 305–400 nm). Fluorescent Advanced Glycation End-products (AGEs) in non-glycated and glycated serum albumin were measured using excitation wavelengths at λex = 335 nm, λex = 370 nm (λem = 390–500 nm), and λex = 485 nm (λem = 500–580 nm). The synchronous fluorescence spectra were recorded at wavelength intervals of ∆λ = 15 nm (λem = 280–330 nm, λex = 265–315 nm) and ∆λ = 60 nm (λem = 310–380 nm, λex = 250–320 nm) to investigate the fluorophores of albumin’s Tyr residues and Trp-214 residue, respectively (∆λ represents the difference between the emission (λem) and excitation (λex) wavelengths, (Δλ = λem − λex)). The excitation fluorescence spectra of HSA, gHSA, PA:gHSA 1.5:1, and PA:gHSA 3:1 were recorded at λex = 250–310 nm (λem = 330 nm). The measurements were conducted with a spectral bandwidth of 3 nm for both excitation and emission monochromators, a sample scanning speed of 100 nm/min, “Medium” signal sensitivity, and a response time of 4 s. During the measurements of AGEs, slit widths were set at 5/5 nm, and only for λex = 485 nm was the sensitivity set to “High”.
The second derivatives of absorption and fluorescence spectra for HSA, gHSA, PA:gHSA 1.5:1, and PA:gHSA 3:1 were obtained using the Spectra Analysis program (Spectra Manager), employing the Savitzky and Golay algorithm, second-order polynomial, and 15 data points. The spectra were smoothed with the Savitzky and Golay method and a convolution width of 11. Before obtaining the second derivative spectra, the zero-order spectra of gHSA (or PA:gHSA 1.5:1, PA:gHSA 3:1) were arithmetically normalized to the maximum absorbance, and the emission fluorescence intensities were aligned to the maximum wavelength of HSA (or gHSA).
2.3.2. Analysis of Free Sulfhydryl Groups
The absorption spectra of HSA, gHSA, PA:gHSA 1.5:1, PA:gHSA 3:1, DTNB, and DTNB-HSA, DTNB-gHSA, DTNB-PA:gHSA 1.5:1, and DTNB-PA:gHSA 3:1 complexes were recorded at 37 °C using a V-530 spectrophotometer (Hachioji, Tokyo, Japan) with quartz cells measuring 1.0 cm × 1.0 cm × 4.0 cm. The absorption spectra of the reaction mixture, proteins, and DTNB blank were recorded at 412 nm.
The molar concentrations of thiol in non-(HSA) and glycated albumins (gHSA, PA:gHSA1.5:1, and PA:gHSA 3:1) were determined using Equation (1) [30]:
where is the molar absorption coefficient at λ = 412 nm ( = 14,150 mol−1∙L∙cm−1); is the absorbance of the DTNB-albumins complex at λ = 412 nm; is the absorbance of the DTNB blank at λ = 412 nm; is the absorbance of proteins at λ = 412 nm.
The percentage content of free sulfhydryl groups , representing the number of free sulfhydryl groups per 100 molecules of non-glycated and glycated albumins, was calculated using Equation (2):
where is the molar concentration of free sulfhydryl groups; are the molar concentrations of non-glycated (HSA) and glycated (gHSA, PA:gHSA1.5:1, and PA:gHSA 3:1) albumin.
2.3.3. Visualization of the Macromolecule
The 3D structure of human serum albumin was generated by CLC Drug Discovery Workbench version 1.0.2. (CLC Bio, a QIAGEN Company: Aarhus, Denmark) using the PDB ID: 4K2C [31].
3. Results and Discussion
3.1. The Structural Modification–Glycation of Defatted Human Serum Albumin
Ultraviolet spectra of non-(HSA) and glycated (gHSA) defatted albumin ([HSA] = [gHSA] 5 × 10⁻⁶ mol·L−1) with glucose–fructose syrup (GFS) (Figure 3a, main view), along with the absorption spectrum of gHSA (gHSAnorm) normalized to the maximum absorbance of the HSA (Figure 3a, insert). Figure 3b presents the second derivative of the absorption spectrum of HSA and gHSAnorm. These observations are used to demonstrate that structural changes in albumin occur under the influence of glycation.
The absorption spectrum of HSA as a native compound in aqueous solution is characterized by one main band at 279 nm. As shown in Figure 3, between 250 nm and 300 nm, the absorbance of gHSA (A279nm(gHSA) = 0.161) is higher than that of HSA (A279nm(HSA) = 0.097), and the full width at half maximum (FWHM) of the spectral band of gHSA increases from 25 nm to 68 nm (ΔFWHM = 43 nm) (Figure 3a, main view; Table S1 in Supplementary Materials). This observation confirms a structural alteration in the environment of the 52 phenylalanine residues (Phe), which can be found in almost every part of the albumin structure, one tryptophanyl residue (Trp-214) in subdomain IIA, and/or 17 tyrosyl (Tyr) residues within various subdomains of the albumin (IIA, IIIA, IB, and IIB). Moreover, distinct differences in the UV spectra between HSA and gHSA have been observed in the 300 nm to 500 nm range. After normalizing the gHSA spectrum to HSA, a significant absorbance for glycated albumin has been noticed (Figure 3a, in the insert). For each wavelength of 330 nm, 360 nm, 400 nm, and longer, gHSA absorbs UV radiation more highly compared to HSA incubated under the same conditions (Table S1 in Supplementary Materials). Notably, HSA does not absorb radiation with wavelengths of 330 nm and longer. This fact may be indicative of the formation of albumin Advanced Glycation End-products (AGEs) as a result of the reaction with GFS [32]. Sarmah et al. have reported the hyperchromicity in the absorbance of HSA incubated with glyoxal (HSA + GO) as compared to native HSA [33]. They suggested that the observed growth in absorbance is possibly a result of structural changes in specific amino acid residues resulting from interaction with glyoxal (GO), the formation of AGEs, and the aggregation from AGEs-induced crosslinking. Except for the hyperchromicity in the absorbance at λmax 280 nm, the authors indicate a shoulder between 320 nm and 330 nm in the GO-modified albumin, which might be a result of AGEs generation in the presence of glyoxal [33]. The same shoulder at λmax 330 nm only for glycated albumin (gHSA) can be observed in Figure 3a.
The first derivative (dAbs/dλ) indicates the rate of change of absorbance (Abs) with respect to wavelength (λ). Whereas the second derivative d2Abs/dλ2 of the spectrum shows how this rate of change is varying. The rate of alteration in the Phe residues is evident in the spectrum between 250 nm and 270 nm. Alterations within the 270 nm to 293 nm range indicate modifications in the environment of Trp-214 and Tyr residues, whereas changes in the spectrum between 293 nm and 305 nm are specific to the Trp-214 residue [34,35]. Qualitative analysis of the second derivatives of HSA and gHSAnorm electron spectra reveals that glycation of HSA induces changes to the tertiary structure surrounding Phe, Trp-214, and Tyr residues (significant differences within the Phe residues and the smallest difference with Trp-214), as shown in Figure 3b. HSA comprises 52 Phe residues distributed across all six subdomains, 17 Tyr residues situated in five subdomains (excluding subdomain IIIB), and a single Trp-214 residue located in subdomain IIA [1]. This suggests that glycation-related structural changes impact the whole albumin, not only a specific fragment of the macromolecule. Moreover, during in vitro conditions, HSA glycation promotes the creation of soluble HSA oligomers and structures resembling molten globules and amyloid-like formations [36]. It has already been proven that the lysine (Lys), arginine (Arg) residues, as well as the cysteinyl residue (Cys-34), frequently become targets for albumin glycation due to their pronounced nucleophilic characteristics [37]. The main glycation sites of HSA, among the 59 lysine and 24 arginine residues of the macromolecule, are Lys-525, Lys-538, and Lys-545 (situated near subdomain IIIA); Lys-414, Lys-439, Lys-475, Arg-410, Arg-428, and Arg-472 (found in subdomain IIIA); and Lys-199, Lys-212, Lys-233, Lys-276, Lys-281, Lys-286, and Arg-218 (found in subdomain IIA) [37,38]. HSA contains 35 cysteine residues, with 34 forming intramolecular disulfide bonds. In plasma, the singular free thiol, Cys-34, constitutes nearly 80% of all thiol groups. Cys-34, situated in the crevice between helices 2 and 3 within subdomain IA of HSA [39], is one of the major ligand-binding sites known as site V. This site binds both endogenous and exogeneous thiol-containing compounds, including cysteine, glutathione, and captopril, as well as metal ions like Cd2+, Au3+, Hg2+, and Ag+ in a reversible manner [39]. The glycation of the -SH group on Cys-34 can affect the spatial structure, stability, activity, and properties of albumin. The concentration of free thiol group(s) in both HSA and gHSA was assessed using Ellman’s reagent (5,5′-dithiobis(2-nitrobenzoic acid), DTNB), with absorbance at 412 nm directly proportional to the thiol -SH residue concentration [40]. The molar concentrations of thiol [SH] and the percentage content of free sulfhydryl groups were determined using Equations (1) and (2), respectively. Nearly five times lower [SH] and SH-percentage content of gHSA (Table S2 in Supplementary Materials) support the previously hypothesized theory that a free thiol group of Cys-34 can potentially be subjected to the glycation process. Structural modification of Cys-34 leads to a decreased antioxidant capacity in albumin and the subsequent formation of protein cross-links [9]. The presented data concerning the second derivative absorption spectra, as affected by the glycation process in the whole molecule, along with the quantitative data, surely lead to the conclusion that glycation of HSA alters the structure and induces a reduction in [SH]% values. Similarly, Maciążek-Jurczyk et al. have reported a reduction in [SH]% in oxidized ([SHoHSA]% = 0.44%) compared to unmodified albumin ([SHHSA]% = 4.40%) [41]. The authors emphasized the crucial importance of cysteine’s -SH group oxidation in guiding the folding mechanism of protein chains, a process that plays an essential role in the function and stability of peptides and proteins.
Glycation induces structural changes in macromolecules, as evidenced by changes in both the ultraviolet and the second derivative absorption spectra of HSA and gHSA. To prove this theory, the excitation spectra of albumins have been investigated (Figure S1 in Supplementary Materials). The fluorescence excitation spectrum characterizes the electron distribution of the ground state molecules. When dealing with a pure product without interference from other molecules in the solution, we should observe the same excitation and absorption spectra of a fluorophore. The results presented reveal a reduction in the fluorescence of glycated HSA compared to non-glycated albumin. At λmax = 279 nm, the fluorescence intensity of HSA is 71.84, whereas for gHSA it is only 17.89 (Figure S1 in Supplementary Materials). This observation confirms that glycated HSA possesses a conformation different from that of non-glycated HSA in the ground state. Maciążek-Jurczyk et al. [41] also used fluorescence excitation spectroscopy to confirm that the oxidation of human serum albumin by chloramine T at a 25:1 ChT:HSA = ChT:oHSA molar ratio induces structural changes in albumin.
To illustrate the conformational changes in the environment of the Trp-214 and Tyr residues of HSA due to glycation, synchronous and emission spectra of HSA and gHSA have been analyzed (Figure 4a,b). It is worth noting that the wavelength of 295 nm primarily excites Trp-214, while at 275 nm, both Tyr and Trp-214 residues are excited. Furthermore, it should be emphasized that it is not possible to separately observe the fluorescence of these fluorophores. Synchronous fluorescence spectroscopy serves as an informative source about the structure of the macromolecules as it enables the separation of emission spectra that originate from Trp-214 and Tyr residues, as demonstrated in the main view of Figure 4a,b. The wavelength intervals, which relate to the minimal overlap of fluorescence from Trp-214 and Tyr residues in the synchronous band, are specified as Δλ = 60 nm and Δλ = 15 nm, respectively.
The tertiary structure of albumin fluorophores and their surrounding environment are prone to changes. The intensity and position of maximum fluorescence of albumin (λmax) are affected by subtle structural modifications in the vicinity of the Trp-214 and Tyr residues [42]. Figure 4 indicates that the fluorescence intensity of glycated albumin (gHSA) is significantly lower than that of non-glycated albumin (HSA). Reductions in Trp-214 and Tyr fluorescence intensities at maximum emission wavelengths of gHSA relative to HSA—75.65% (Figure 4a, main view), 54.15% (Figure 4b, main view), 77.58% (Figure 4a insert), and 64.86% (Figure 4b insert)—were observed. These results demonstrate alterations in the tertiary conformation of albumin due to glycation, particularly around the Trp-214 and Tyr residues. Such modifications could potentially affect ligand binding at the two primary binding regions located in the specialized cavities of subdomain IIA (Trp-214, Tyr-263) and/or IIIA (Tyr-401, Tyr-411, Tyr-452, Tyr-497), corresponding to Sudlow’s sites I and II. The loss of fluorescence intensity and a blue-shift in albumin glycated by the use of glyoxal, methylglyoxal, and glyceraldehyde, compared to native HSA, has been reported by Khan et al. [43]. They suggested that after glycation, human serum albumin may adopt a more compact form and transition to aggregate-like structures. Using Δλ = 60 nm and Δλ = 15 nm, no shifts in the λmax of both albumins’ Trp-214 and Tyr residues have been recorded (as shown in the main view of Figure 4a,b). This indicates the stability of both spectral bands, regardless of glycation. Concurrently, no changes in the hydrophobicity surrounding the albumin chromophore (Trp-214 and Tyr residues) and/or alterations in the HSA conformation in the environment of remaining residues have been observed. By contrast, the emission spectra of gHSA, when excited at λex = 275 nm and λex = 295 nm, exhibit a blue-shift (Δλmax = −12 nm) and a red-shift (Δλmax = +5 nm) in maximum fluorescence, respectively (data are collected in Table 1). This phenomenon likely suggests that Trp-214 of gHSA is in a more polar environment and is also more exposed to the solvent than HSA, whereas Tyr residues of gHSA are less exposed to the solvent than HSA. Additionally, evidence of changes in gHSA’s conformation relative to HSA is demonstrated by a decrease in the full width at half maximum (FWHM) for gHSA (Table 1). A reduction in the fluorescence intensity and FWHM values for gHSA has been ascribed to conformational alterations within HSA. Sarmah et al. [33] have explained the gradual decrease of the Trp-214 fluorescence intensity of albumin in the presence of glyoxal (GO) as a result of local unfolding and steric hindrance occurring in the hydrophobic pocket located in the subdomain IIA of HSA. The fluorescence quenching caused by the change in the microenvironment, in the authors’ view, could be attributed to the modifications of Lys and Arg residues by GO, located near Trp-214 in the subdomain IIA.
It is noteworthy that the synchronous fluorescence spectrum of gHSA reveals an additional signal in the region between λem = 370 nm and 500 nm, characterized by λmax ≅ 420 nm (Figure 4a, main view). This signal is indicative of the presence of fluorescent Advanced Glycation End-products (AGEs) and/or additional fluorophores formed during albumin glycation [44].
In this study, to directly monitor the dynamics, flexibility/mobility, and stability of the microenvironment of the Trp-214 residue of human serum albumin, another sensitive and reliable tool was used: Red Edge Excitation Shift (REES) [42,45]. REES is a shift in the emission maximum to higher wavelengths as the excitation wavelength increases, which corresponds to a decrease in excitation energy [42]. Due to the possibility of separating tryptophanyl (Trp) emission from tyrosine (Tyr) and phenylalanine (Phe) residues by excitation at λex > ~292 nm, the Trp REES effect is a potentially excellent probe of protein conformational change, intrinsic disorder, and perhaps even changes in the equilibrium of conformational states [46]. To investigate the REES effect, HSA and gHSA were excited at λex = 290 nm, λex = 295 nm, and λex = 300 nm. The fluorescence emission spectra for Trp-214 in glycated albumin differ from those in non-glycated HSA across all excitation wavelengths, as detailed in Table S3 of the Supplementary Materials. A significant red-shift in the fluorescence of the maximum emission was observed for gHSA (Δλem = 20 nm) compared to HSA (Δλem = 5 nm). This pronounced shift in gHSA suggests that the glycation of albumin using GFS induces changes in albumin’s conformation, especially within the hydrophobic pocket containing the Trp-214 residue. These changes contribute to the decreased mobility of the fluorophore environment and/or restricted access to the polar solvent. Through their study of the REES effect, Rokos et al. [47] indicate that the decreased mobility in the oxidative protein environment, particularly in the presence of Trp-214, is caused by the stiffening of the protein matrix. Alternatively, according to Valeur [48], the REES effect stems from the microheterogeneity observed within the Trp environment and the electronic coupling between the tryptophan’s indole and neighboring dipoles. This results in a varied spectrum of electronic transition energies of Trp. In their research, Kwok et al. [46] presented a thermodynamic model that captures the REES effect of tryptophan, providing insights into the conformational flexibility of proteins, even those with numerous tryptophan residues. A model to track the REES effect of a fluorescent ligand was presented by Kabir et al. [49], which could potentially enable the analysis of “hidden” states associated with a protein ligand. Moreover, Knight et al. [50] have determined that quantifying the REES effect provides high sensitivity to changes in protein conformational states and dynamics. The authors emphasize that this effect has immediate potential for applications in the biopharmaceutical sector, particularly in quality assurance, formulation, and drug development.
The analysis of the second derivative spectra provides additional insights into the structural alterations in the protein’s tertiary conformation induced by glycation. This method excels at monitoring even the most subtle changes in the surroundings of aromatic amino acids (primarily tryptophanyl residues) in macromolecules. These nuances are often overlooked in classical fluorescence spectra. Figure 5a,b presents the emission spectra of HSA and gHSA normalized to HSA (gHSAnorm) and their second derivative fluorescence spectra (2nd HSA and 2nd gHSAnorm). Changes observed in the 2nd HSA and 2nd gHSAnorm, within the wavelength range of 370–400 nm and in the region below 320 nm, indicate structural reorganization around the Trp and Tyr residues [51,52]. At λex = 275 nm, the 2nd HSA displays two maximum peaks (at wavelengths 301 nm and 324 nm) and a marked valley at 311 nm, while the 2nd gHSAnorm illustrates one peak maximum at a wavelength of 302 nm (Figure 5a, main view). For λex = 295 nm, the 2nd HSA and the 2nd gHSAnorm present only one peak maximum at a wavelength of 323 nm (Figure 5b, main view). In Figure 5b, within the wavelength range 370–400 nm, a bathochromic shift (∆λmax = +13 nm) of the 2nd gHSAnorm is observed only at λex = 295 nm (as shown in the insert), which indicates that upon glycation of human albumin, the environment around Trp-214 becomes more polar. This corroborates the previous conclusion derived from the analysis of non- and glycated HSA emission spectra excited at λex = 295 nm (Figure 4a, in the insert), demonstrating that Trp-214 of gHSA is more accessible to the solvent than Trp-214 of HSA.
In this research, the empirical parameter H (relative peak composition) defined by Mozo-Villarias is used as a sensitive indicator of polarity changes in the environment of amino acid residues (Trp-214, Tyr) of both HSA and gHSA [51]. The values of the parameter H for HSA and gHSAnorm are presented in Table 2.
Glycation of albumin leads to a decrease in polarity around Tyr residues (λex = 275 nm) and an increase in polarity around Trp-214 (λex = 295 nm), as evidenced by changes in the H parameter values for 2nd gHSAnorm (Table 2). Qualitative analysis of the second derivative spectra reveals that not only the primary Trp-214 but also the Tyr residues participate in the glycation process of human serum albumin.
3.2. The Influence of Palmitic Acid on the Glycation Process of Defatted Human Serum Albumin—The Structural Modification of gHSA
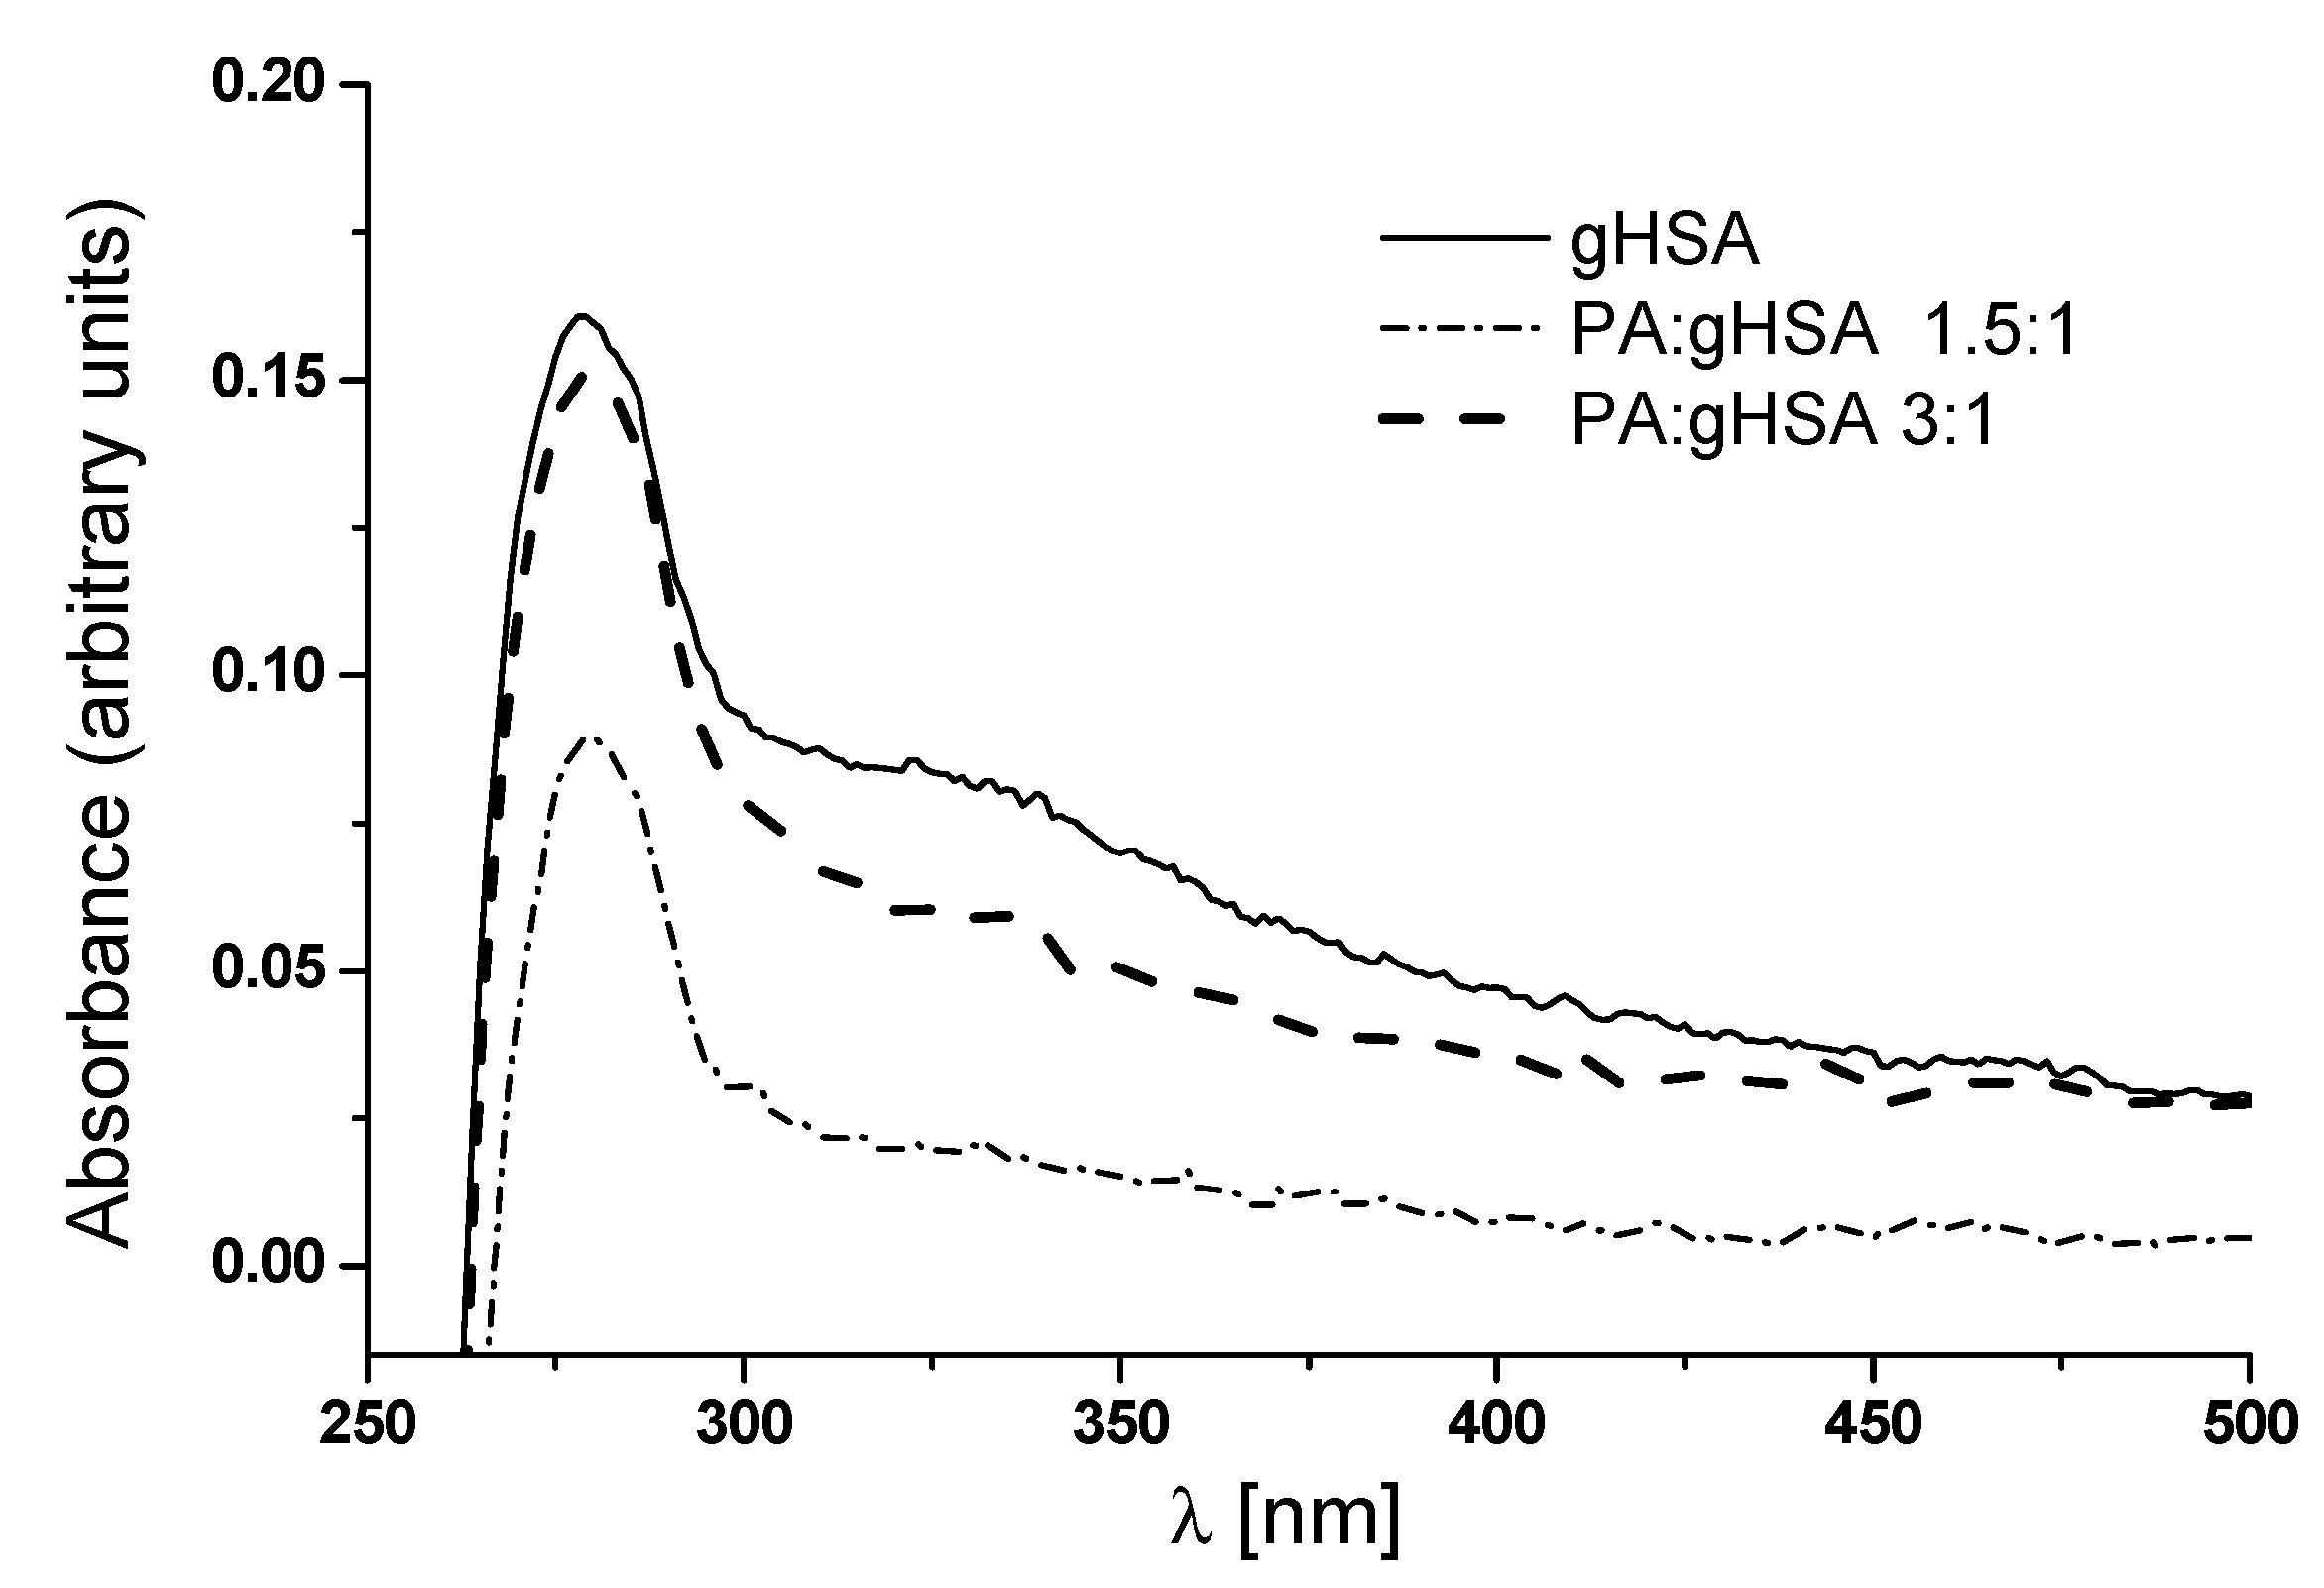
As shown in Figure 6, one peak at λmax 279 nm with a subtle shoulder in the region between 320 nm and 330 nm can be observed in the absorbance spectrum of defatted glycated serum albumin (gHSA). According to Sarmah et al., the shoulder observed in the glyoxal (GO)-modified albumin can be ascribed to the formation of Advanced Glycation End-products (AGEs) in the presence of GO [33]. In the absorbance spectrum of serum albumin glycated in the presence of palmitic acid (PA) at molar ratios of PA:gHSA 1.5:1 and PA:gHSA 3:1, there is only a hypochromicity at λmax 279 nm compared to gHSA. Moreover, differences in the UV spectra between gHSA and PA:gHSA at ratios of 1.5:1 and 3:1 have been observed in the 300–500 nm region. It is well known that the peak at 278 nm is related to the π → π* transitions of aromatic amino acids (Trp-214, Tyr, and Phe). The intensity of the peak at 279 nm decreases in PA:gHSA 1.5:1 and PA:gHSA 3:1, suggesting that the formation of the palmitic acid–albumin complex might change the microenvironment of the chromophore amino acid residues. As stated earlier, human serum albumin does not absorb radiation with wavelengths of 300 nm or longer. That is why the increase in albumin absorbance in the wavelength range of 300–500 nm is attributed to the presence of AGEs [32].
Subtle changes in the tertiary structure of albumin around phenylalanine (Phe), tryptophanyl (Trp-214), and tyrosyl (Tyr) residues, caused by glycation in the presence of palmitic acid, are visible in the second derivative spectrum d2Abs/dλ2 (Figure S2 in Supplementary Materials). During the second derivative of the absorption spectrum for PA:gHSA 1.5:1 and PA:gHSA 3:1, no differences were observed at wavelengths of 250 nm and 305 nm, implying that the concentration of both samples is the same. In the 250 nm to 305 nm range, differences were detected in the 2nd gHSA compared to 2nd PA:gHSAnorm 1.5:1 and 2nd PA:gHSAnorm 3:1 absorption spectra. The least pronounced changes were observed around the Trp-214 and Tyr residues, while the most distinct were found in the vicinity of the Phe residues. Based on this data, it can be concluded that the conformation of glycated, defatted albumin (gHSA) might be altered by the addition of PA. Although palmitic acid has an inhibitory effect on the glycation process, it does not contribute to significant changes in the Phe, Tyr, and Trp-214 residues of glycated serum albumin. Using FT-IR spectroscopy, Oleszko et al. have confirmed that PA binding to two high-affinity sites of bovine serum albumin (BSA) leads to major structural changes. BSA, an analogue of HSA, only slightly influenced BSA’s secondary structure at other sites [15]. The authors have claimed that regular study of fatty acid–albumin interactions, using an experimental model that mimics metabolic disorders such as dyslipidemia, insulin resistance, diabetes, and obesity, may lead to the development of new tools for personalized nanopharmacotherapy.
To evaluate the modification of cysteine (Cys-34) sulfhydryl groups in gHSA, PA:gHSA 1.5:1, and PA:gHSA 3:1, the Ellman’s method has been used [40]. Absorption spectra of these samples in complex with Ellman’s reagent were recorded. Using Equation (1), the molar concentration of free sulfhydryl groups [SH] was calculated. Subsequently, using Equation (2), the percentage of free sulfhydryl groups was determined, as detailed in Table S2 in the Supplementary Materials. The second derivative absorption spectra show some alterations in glycated proteins when palmitic acid is present within IIA, IB, and/or IIIA subdomains, which are the major drug-binding sites. However, the quantitative data indicate that PA destabilizes the conformation during glycation and causes an increase in the concentration of free sulfhydryl groups [SH] and their percentage values [SH]% (refer to Table S2 in Supplementary Materials). Fatty acids (FAs) binding to serum albumin play an important role in regulating antioxidant properties and increasing the steric availability of the Cys-34 thiol group [53]. Because Cys-34 is situated in a hydrophobic crevice of subdomain IA, it may play a crucial role in drug binding [6]. Yamasaki et al. have reported that the binding site for echinocandins, such as caspofungin and micafungin, on HSA is within subdomain IA [54]. Considering this, the critical role of PA in shaping the binding properties of glycated albumin becomes evident. Meanwhile, Yamazaki et al. have described a strong affinity of FAs for HSA via several Lys and Arg sites. Interestingly, their observations suggested only a slight impact from the binding of oleate, laurate, caproate, and linoleate on the glycation process [55].
In the fluorescence emission spectra comparing PA:gHSA 1.5:1 and PA:gHSA 3:1 to gHSA, changes were registered not only in the fluorescence intensity of macromolecule fluorophores near the Trp-214 and Tyr residues but also in the position of the maximum emission fluorescence (λmax) (Table 3, Figure S3 in Supplementary Materials).
The spectra of PA:gHSA 1.5:1 and PA:gHSA 3:1 are more intense compared to the spectrum of gHSA, as evidenced by a red-shift at λex = 275 nm and a blue-shift at λex = 295 nm (Table 3). These data showcase a decrease in the hydrophobicity of the Tyr residues and an increase in the hydrophobicity of the Trp-214 residue, both of which are highly sensitive to changes in their surrounding environment. Furthermore, using Δλ = 60 nm (Figure S3a, main view in Supplementary Materials) and Δλ = 15 nm (Figure S3b, main view in Supplementary Materials), aside from an increase in fluorescence intensity at λmax of PA:gHSA 1.5:1 and PA:gHSA 3:1 relative to gHSA, no changes in the shift λmax of Trp-214 and Tyr macromolecule residues and fluorescent AGEs (fluorophores created during albumin glycation) have been observed. This may indicate the stability of bands in the synchronous spectra, regardless of the presence of fatty acids in the structure of albumin. Glycation of HSA in the presence of PA causes a two-fold and 1.5-fold increase in fluorescence intensity around Trp-214 and Tyr residues, respectively (Figure S3a,b, main view in Supplementary Materials). The change in the conformation of PA:gHSA 1.5:1 and PA:gHSA 3:1 relative to gHSA is further confirmed by the growth of the FWHM, as shown in Table 3.
To investigate the REES effect, fluorescence spectra of gHSA, PA:gHSA 1.5:1, and PA:gHSA 3:1 excited at λex = 290 nm, λex = 295 nm, and λex = 300 nm were recorded (Table S3 in Supplementary Materials). At each of these excitation wavelengths, the emission fluorescence spectra of Trp-214 macromolecules are not identical. A significant red-shift in the maximum emission of PA:gHSA 3:1 fluorescence (Δλem = 33 nm) relative to gHSA and PA:gHSA 1.5:1 (Δλem = 20 nm) has been observed. The higher shift for PA:gHSA 3:1 indicates that palmitic acid, present in the structure of glycated albumin (at molar ratio PA:gHSA 3:1), reduces the mobility of the Trp-214 environment, thus inducing changes in albumin conformation.
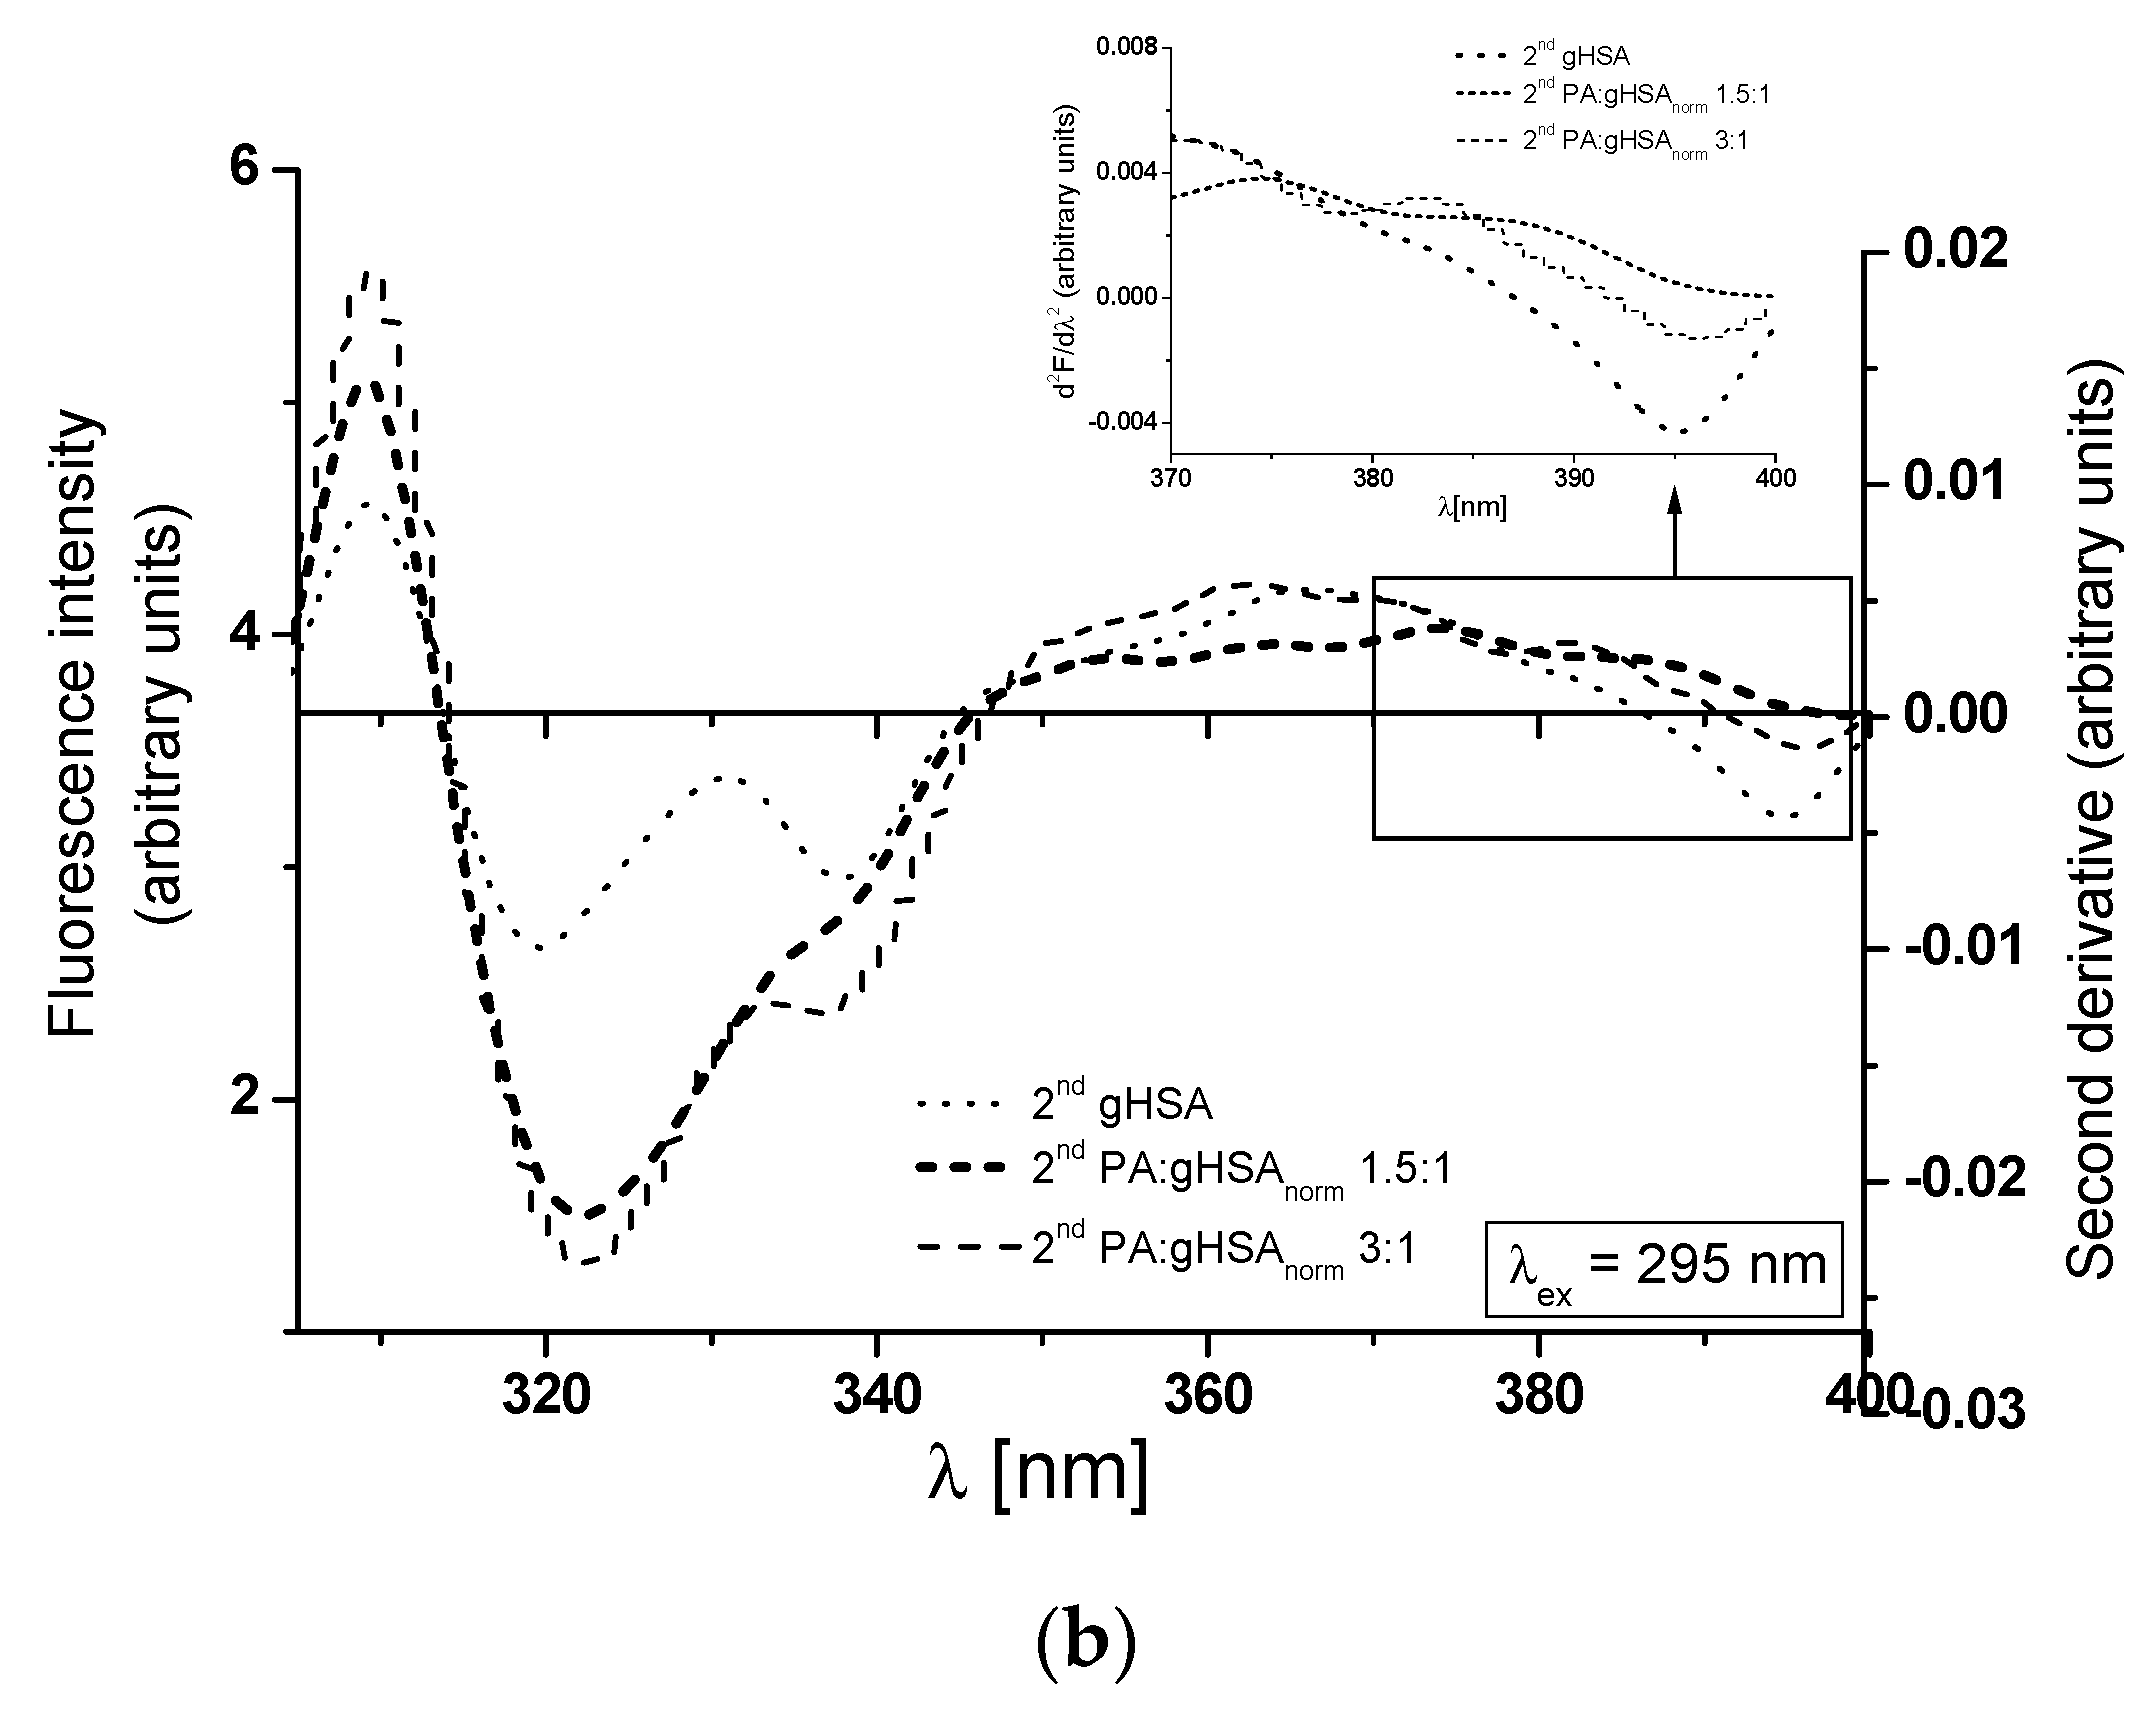
At λex = 275 nm, the 2nd gHSA, the 2nd PA:gHSAnorm 1.5:1, and the 2nd PA:gHSAnorm 3:1 show only one peak maximum at a wavelength of 301 nm (Figure 7a, main view). For λex = 295 nm, the 2nd gHSA and the 2nd PA:gHSAnorm 3:1 display two peak maxima (at wavelengths of 323 nm and ~340 nm), while the 2nd PA:gHSAnorm 1.5:1 exhibits only one peak maximum at a wavelength of 323 nm (Figure 7b, main view). As illustrated in Figure 7, significant changes in the shape of the second derivative spectra of macromolecules can be observed in the wavelength range of 370–400 nm (Figure 7a,b, in the insert). These observations may suggest the influence of palmitic acid on the glycation process of HSA, particularly in the environment of the Trp-214 residue. The values of the second derivative spectra for gHSA, PA:gHSAnorm 1.5:1, and PA:gHSAnorm 3:1 have been determined using the peak-to-peak method as an empirical parameter H [51]. The values of parameter H for the study proteins are collected in Table 4.
The inclusion of PA in the structure of glycated HSA results in reduced polarity surrounding Tyr residues at λex = 275 nm and Trp-214 residues at λex = 295 nm. This change is evident in the increased values of the parameter H for both the 2nd PA:gHSAnorm 1.5:1 and the 2nd PA:gHSAnorm 3:1, as shown in Table 4. Importantly, the differences in polarity compared to gHSA are more pronounced for PA:gHSAnorm 3:1 than for PA:gHSAnorm 1.5:1.
3.3. Palmitic Acid as an Inhibitor of the Formation of Advanced Glycation End-Products
It is well established that Advanced Glycation End-products (AGEs) play a crucial role in the pathogenesis of various diseases, including vascular complications of diabetes and aging-related diseases. The use of fluorescence spectroscopy has enabled the assessment of the impact of glucose–fructose syrup (GFS, a sweetener commonly found in processed foods) and palmitic acid (PA, a prevalent saturated fatty acid) on the glycation of human serum albumin in an in vitro environment and therefore for the formation of AGEs in the modified proteins. For this reason, the fluorescence emission spectra of AGEs created in defatted, glycated albumin (gHSA) with GFS and glycated albumin with GFS in the presence of PA at a molar ratio of PA:gHSA 1.5:1 and PA:gHSA 3:1 were registered at λex = 335 nm (Figure 8a), λex = 370 nm (Figure 8b), and λex = 485 nm (Figure 8c). Using similar spectroscopic parameters, the emission fluorescence spectra of AGEs derived from non-glycated, defatted albumin (HSA) were also recorded.
As illustrated in Figure 8, the higher relative fluorescence intensity (Fmax) obtained for gHSA, PA:gHSA 1.5:1, and PA:gHSA 3:1 in comparison to HSA indicates the formation of AGEs in glycated albumins.
For all the excitation wavelengths, PA:gHSA 3:1 demonstrates the highest AGEs fluorescence intensity, as shown in Table 5. This observation could suggest that palmitic acid does not inhibit the formation of AGEs. After excitation at λex = 335 nm (Figure 8a) and λex = 370 nm (Figure 8b), the AGEs fluorescence intensity in glycated albumin in the presence of palmitic acid (PA:gHSA 3:1 and PA:gHSA 1.5:1) increases by 80–85% compared to non-glycated HSA. This is accompanied by a blue-shift in the maximum fluorescence (Fmax) (Table 5), reflecting a more hydrophobic environment for AGEs. At λex = 485 nm (Figure 8c), except for an increase in the Fmax of AGEs in PA:gHSA 1.5:1 (about 54%) and PA:gHSA 3:1 (about 63%), no shift is observed. Moreover, greater values of Fmax of AGEs were obtained for defatted, glycated HSA than for non-glycated HSA (Figure 8a–c). The increase in AGEs fluorescence intensity in gHSA compared to HSA is about 78%, 79%, and 62% at λex = 335 nm, λex = 370 nm, and λex = 485 nm, respectively (Table 5). These are accompanied by a blue-shift of maximum fluorescence, indicating a decrease in the polarity of the fluorophore’s microenvironments. The most well-known fluorescent AGEs—argpyrimidine and pentosidine—show maximum fluorescence around λem = 400–440 nm and λem = 375–385 nm, respectively [56]. S. Vetter and V. Indurthi indicated that the AGEs formed in albumin glycated by glucose are atypical in terms of the fluorescence of pentosidine or argpyrimidine. Instead, they display a red-shifted fluorescence with peak values around λem = 420 nm and λem = 435 nm when excited at λex = 330 nm or λex = 365 nm, respectively [36]. The varied shift in Fmax following albumin glycation (Figure 8a–c) demonstrates that fluorescent AGEs constitute a chemically heterogeneous mixture of compounds with different properties.
4. Conclusions
Fluorescence and absorption spectroscopy are optimal analytical methods allowing for research on the tertiary structure of proteins and their modifications. The analysis, based on absorption and fluorescence spectra; their second derivatives; excitation fluorescence and synchronous spectra; the REES effect; and the degree of modification of sulfhydryl groups of defatted, non-glycated (HSA), glycated (gHSA) with glucose–fructose syrup (GFS), and glycated with GFS in the presence of palmitic acid (PA) human serum albumin at molar ratios of PA:gHSA 1.5:1 and PA:gHSA 3:1, demonstrated that (i) glycation of defatted HSA by GFS, as a glycating agent, causes conformational changes in the entire protein structure, particularly in subdomains IIA and IIIA, IB, and IIB, where one tryptophanyl (Trp-214) residue and 17 tyrosyl (Tyr) residues are located, respectively; as a consequence of glycation reactions, the binding properties of albumin may be changed, even if they happen at a distance from a binding site; (ii) PA, at ratios of 1.5:1 and 3:1 with glycated albumin, influences the in vitro glycation process and induces conformational changes in gHSA. These changes are evident as alterations in the hydrophobicity environment of Tyr and Trp-214 residues, along with a significant decrease in the mobility of the Trp-214 environment; (iii) in the PA:gHSA samples at ratios of 1.5:1 and 3:1, PA does not inhibit the formation of AGEs (Advanced Glycation End-products).
Supplementary Materials
The following supporting information can be downloaded at https://www.mdpi.com/article/10.3390/pr11092746/s1, Table S1: Absorbance of non-glycated (HSA), glycated and defatted (gHSA), and glycated in the presence of palmitic acid (PA) albumin at molar ratios of PA:gHSA 1.5:1 and PA:gHSA 3:1; protein concentration, 5 × 10⁻⁶ mol∙L−1; λmax = 279 nm, λ = 330 nm, λ = 360 nm, and λ = 400 nm; Table S2: Absorbance of non-glycated (HSA), glycated and defatted (gHSA), and glycated in the presence of palmitic acid (PA) human serum albumin in molar ratio PA:gHSA 1.5:1 and PA:gHSA 3:1 for a wavelength of 412 nm and the percentage of free sulfhydryl groups [SH]%; Table S3: The position (λmax) of the maximum fluorescence (Fmax) and the shift of the maximum fluorescence emission (∆λ) determined for non-glycated (HSA), glycated and defatted (gHSA), and glycated in the presence of palmitic acid (PA) human serum albumin in molar ratio PA:gHSA 1.5:1 and PA:gHSA 3:1; λex = 290 nm, λex = 295 nm and λex = 300 nm; Figure S1: Excitation spectra of HSA and gHSA at 5 × 10⁻⁶ mol·L−1 concentration; t = 37 °C; Figure S2: Second derivative of glycated, deffated (2nd gHSA) and glycated in the presence of palmitic acid (PA) serum albumin in molar ratio PA:gHSA 1.5:1 and PA:gHSA 3:1 (2nd PA:gHSAnorm 1.5:1, 2nd PA:gHSAnorm 3:1) absorption spectrum. Protein concentration, 5 × 10⁻⁶ mol·L−1; t = 37 °C; Figure S3: Main view: synchronous fluorescence spectra of glycated, defatted (gHSA) and glycated in the presence of palmitic acid (PA) human serum albumin in molar ratio PA:gHSA 1.5:1 and PA:gHSA 3:1 at 5 × 10⁻⁶ mol∙L−1 concentration (a) Δλ = 60 nm (λex = 220–440 nm), (b) Δλ = 15 nm (λex = 265–305 nm). Insert: comparison of gHSA, PA:gHSA 1.5:1, and PA:gHSA 3:1 emission spectrum excited at (a) λex = 295 nm and (b) λex = 275 nm; t = 37 °C.
Funding
This research was supported by the Medical University of Silesia, Katowice, Poland (Grant No. PCN-2-105/K/0/F and PCN-2-012/K/1/F).
Data Availability Statement
Data are contained within the article or Supplementary Materials.
Conflicts of Interest
The author declares no conflict of interest. The funders had no role in the design of the study; in the collection, analyses, or interpretation of data; in the writing of the manuscript; or in the decision to publish the results.
References
- Peters, T. All About Albumin. In Biochemistry, Genetics, And Medical Applications; Academic Press: San Diego, CA, USA, 1995; pp. 9–19; discussion 228–234. [Google Scholar]
- Fanali, G.; di Masi, A.; Trezza, V.; Marino, M.; Fasano, M.; Ascenzi, P. Human serum albumin: From bench to bedside. Mol. Asp. Med. 2012, 33, 209–290. [Google Scholar] [CrossRef] [PubMed]
- Merlot, A.M.; Kalinowski, D.S.; Richardson, D.R. Unraveling the mysteries of serum albumin-more than just a serum protein. Front. Physiol. 2014, 12, 299. [Google Scholar] [CrossRef]
- Al-Harthia, S.; Lachowicz, J.I.; Nowakowski, M.E.; Jaremko, M.; Jaremko, Ł. Towards the functional high-resolution coordination chemistry of blood plasma human serum albumin. J. Inorg. Biochem. 2019, 198, 110716. [Google Scholar] [CrossRef] [PubMed]
- Karimi, M.; Bahrami, S.; Ravari, S.B.; Zangabad, P.S.; Mirshekari, H.; Bozorgomid, M.; Shahreza, S.; Sori, M.; Hamblin, M.R. Albumin nanostructures as advanced drug delivery systems. Expert Opin. Drug Deliv. 2016, 13, 1609–1623. [Google Scholar] [CrossRef] [PubMed]
- Sudlow, G.; Birkett, D.J.; Wade, D.N. The characterization of two specific drug binding sites on human serum albumin. Mol. Pharmacol. 1975, 11, 824–832. [Google Scholar] [PubMed]
- Otagiri, M.; Chuang, V.T.G. Albumin in Medicine: Pathological and Clinical Applications; Springer: Singapore, 2016. [Google Scholar]
- Cardoso, T.; Almeida, A.S.; Remião, F.; Fernandes, C. Enantioresolution and Binding Affinity Studies on Human Serum Albumin: Recent Applications and Trends. Chemosensors 2021, 9, 304. [Google Scholar] [CrossRef]
- Mishra, V.; Heath, R.J. Structural and Biochemical Features of Human Serum Albumin Essential for Eukaryotic Cell Culture. Int. J. Mol. Sci. 2021, 22, 8411. [Google Scholar] [CrossRef]
- Carter, D.C.; Ho, J.X. Structure of Serum Albumin. Adv. Protein Chem. 1994, 45, 153–203. [Google Scholar] [CrossRef]
- Shaklai, N.; Garlick, R.L.; Bunn, H.F. Nonenzymatic glycosylation of human serum albumin alters its conformation and function. J. Biol. Chem. 1984, 259, 3812–3817. [Google Scholar] [CrossRef]
- Chilelli, N.C.; Burlina, S.; Lapolla, A. AGEs, rather than hyperglycemia, are responsible for microvascular complications in diabetes: A “glycoxidation-centric” point of view. Nutr. Metab. Cardiovasc. Dis. 2013, 23, 913–919. [Google Scholar] [CrossRef]
- Mehrotra, R.; Kalantar-Zadeh, K.; Adler, S. Assessment of glycemic control in dialysis patients with diabetes: Glycosylated hemoglobin or glycated albumin? Clin. J. Am. Soc. Nephrol. 2011, 6, 1520–1522. [Google Scholar] [CrossRef] [PubMed]
- Rondeau, P.; Bourdon, E. The glycation of albumin: Structural and functional impacts. Biochimie 2011, 93, 645–658. [Google Scholar] [CrossRef] [PubMed]
- Oleszko, A.; Hartwich, J.; Gąsior-Głogowska, M.; Olsztyńska-Janus, S. Changes of albumin secondary structure after palmitic acid binding. FT-IR spectroscopic study. Acta Bioeng. Biomech. 2018, 20, 59–64. [Google Scholar] [PubMed]
- Simard, J.R.; Zunszain, P.A.; Hamilton, J.A.; Curry, S. Locating of high and low affinity fatty acid binding sites on human serum albumin revealed by NMR drug-competition analysis. J. Mol. Biol. 2006, 361, 336–351. [Google Scholar] [CrossRef] [PubMed]
- Coverdale, J.P.C.; Katundu, K.G.H.; Sobczak, A.I.S.; Arya, S.; Blindauer, C.A.; Stewart, A.J. Ischemia-modified albumin: Crosstalk between fatty acid and cobalt binding. Prostaglandins Leukot. Essent. Fat. Acids. 2018, 135, 147–157. [Google Scholar] [CrossRef] [PubMed]
- Bhattacharya, A.A.; Curry, S.; Franks, N.P. Binding of the general anesthetics propofol and halothane to human serum albumin: High resolution crystal structures. J. Biol. Chem. 2000, 275, 38731–38738. [Google Scholar] [CrossRef] [PubMed]
- Kragh-Hansen, U.; Watanabe, H.; Nakajou, K.; Iwao, Y.; Otagiri, M. Chain length-dependent binding of fatty acid anions to human serum albumin studied by site-directed mutagenesis. J. Mol. Biol. 2006, 363, 702–712. [Google Scholar] [CrossRef]
- Carta, G.; Murru, E.; Lisai, S.; Sirigu, A.; Piras, A.; Collu, M.; Batetta, B.; Gambelli, L.; Banni, S. Dietary Triacylglycerols with Palmitic Acid in the sn-2 Position Modulate Levels of N-acylethanolamides in Rat Tissues. PLoS ONE 2015, 10, e0120424. [Google Scholar] [CrossRef]
- Carta, G.; Murru, E.; Banni, S.; Manca, C. Palmitic Acid: Physiological Role, Metabolism and Nutritional Implications. Front. Physiol. 2017, 8, 902. [Google Scholar] [CrossRef]
- Innis, S.M. Palmitic Acid in Early Human Development. Crit. Rev. Food Sci. Nutr. 2016, 56, 1952–1959. [Google Scholar] [CrossRef]
- Johnson, R.J.; Perez-Pozo, S.E.; Lillo, J.L.; Grases, F.; Schold, J.D.; Kuwabara, M.; Sato, Y.; Hernando, A.A.; Garcia, G.; Jensen, T.; et al. Fructose increases risk for kidney stones: Potential role in metabolic syndrome and heat stress. BMC Nephrol. 2018, 19, 315. [Google Scholar] [CrossRef] [PubMed]
- Lubawy, M.; Formanowicz, D. High-Fructose Diet–Induced Hyperuricemia Accompanying Metabolic Syndrome-Mechanisms and Dietary Therapy Proposals. Int. J. Environ. Res. Public Health 2023, 20, 3596. [Google Scholar] [CrossRef] [PubMed]
- Goncalves, M.D.; Lu, C.; Tutnauer, J.; Hartman, T.E.; Hwang, S.K.; Murphy, C.J.; Pauli, C.; Morris, R.; Taylor, S.; Bosch, K.; et al. High-fructose corn syrup enhances intestinal tumor growth in mice. Science 2019, 363, 1345–1349. [Google Scholar] [CrossRef] [PubMed]
- Girard, A.; Madani, S.; Boukortt, F.; Cherkaoui-Malki, M.; Belleville, J.; Prost, J. Fructose-enriched diet modifies antioxidant status and lipid metabolism in spontaneously hypertensive rats. J. Nut. 2006, 22, 758–766. [Google Scholar] [CrossRef] [PubMed]
- Mester, S.; Evers, M.; Meyer, S.; Nilsen, J.; Greiff, V.; Sandlie, I.; Leusen, J.; Andersen, J.T. Extended plasma half-life of albumin-binding domain fused human IgA upon pH-dependent albumin engagement of human FcRn in vitro and in vivo. MAbs 2021, 13, 1893888. [Google Scholar] [CrossRef] [PubMed]
- Wilfinger, W.W.; Mackey, K.; Chomczynski, P. Effect of pH and ionic strength on the spectrophotometric assessment of nucleic acid purity. Biotechniques 1997, 22, 474–481. [Google Scholar] [CrossRef] [PubMed]
- Maciążek-Jurczyk, M.; Sułkowska, A. Spectroscopic analysis of the impact of oxidative stress on the structure of human serum albumin (HSA) in terms of its binding properties. Spectrochim. Acta Part A Mol. Biomol. Spectrosc. 2015, 136, 265–282. [Google Scholar] [CrossRef]
- Riener, C.K.; Kada, G.; Gruber, H.J. Quick measurement of protein sulfhydryls with Ellman’s reagent and with 4,40 -dithiodipyridine. Anal. Bioanal. Chem. 2002, 373, 266–276. [Google Scholar] [CrossRef]
- RCSB Protein Data Bank. Available online: http://www.rcsb.org (accessed on 7 May 2023).
- Schmitt, A.; Schmitt, J.; Münch, G.; Gasic-Milencovic, J. Characterization of advanced glycation end products for biochemical studies: Side chain modifications and fluorescence characteristics. Anal. Biochem. 2005, 338, 201–215. [Google Scholar] [CrossRef]
- Sarmah, S.; Das, S.; Roy, A.S. Protective actions of bioactive flavonoids chrysin and luteolin on the glyoxal induced formation of advanced glycation end products and aggregation of human serum albumin: In vitro and molecular docking analysis. Int. J. Biol. Macromol. 2020, 165, 2275–2285. [Google Scholar] [CrossRef]
- Balestrieri, C.; Colonna, G.; Giovane, A.; Irace, G.; Servillo, L. Second-derivative spectroscopy of proteins. A method for the quantitative determination of aromatic amino acids in proteins. Eur. J. Biochem. 1978, 90, 433–440. [Google Scholar] [CrossRef] [PubMed]
- Levine, R.L.; Federici, M.M. Quantitation of aromatic residues in proteins: Model compounds for second-derivative spectroscopy. Biochemistry 1982, 21, 2600–2606. [Google Scholar] [CrossRef] [PubMed]
- Vetter, S.W.; Indurthi, V.S. Moderate glycation of serum albumin affects folding, stability, and ligand binding. Clin. Chim. Acta 2011, 412, 2105–2116. [Google Scholar] [CrossRef] [PubMed]
- Anguizola, J.; Matsuda, R.; Barnaby, O.S.; Hoy, K.S.; Wa, C.; DeBolt, E.; Koke, M.; Hage, D.S. Review: Glycation of human serum albumin. Clin. Chim. Acta. 2013, 425, 64–76. [Google Scholar] [CrossRef] [PubMed]
- Maciążek-Jurczyk, M.; Szkudlarek, A.; Chudzik, M.; Pożycka, J.; Sułkowska, A. Alteration of human serum albumin binding properties induced by modifications: A review. Spectrochim. Acta A Mol. Biomol. Spectrosc. 2018, 188, 675–683. [Google Scholar] [CrossRef] [PubMed]
- Narazaki, R.; Maruyama, T.; Otagiri, M. Probing the cysteine 34 residue in human serum albumin using fluorescence techniques. Biochim. Biophys. Acta. 1997, 1338, 275–281. [Google Scholar] [CrossRef] [PubMed]
- Ellman, G.L. Tissue sulfhydryl groups. Arch. Biochem. Biophys. 1959, 82, 70–77. [Google Scholar] [CrossRef] [PubMed]
- Maciążek-Jurczyk, M.; Morak-Młodawska, B.; Jeleń, M.; Kopeć, W.; Szkudlarek, A.; Owczarzy, A.; Kulig, K.; Rogóż, W.; Pożycka, J. The Influence of Oxidative Stress on Serum Albumin Structure as a Carrier of Selected Diazaphenothiazine with Potential Anticancer Activity. Pharmaceuticals 2021, 14, 285. [Google Scholar] [CrossRef]
- Demchenko, A.P.; Ladokhin, A.S. Red-edge-excitation fluorescence spectroscopy of indole and tryptophan. Eur. Biophys. J. 1988, 15, 369–379. [Google Scholar] [CrossRef]
- Khan, M.S.; Tabrez, S.; Rabbani, N.; Shah, A. Oxidative Stress Mediated Cytotoxicity of Glycated Albumin: Comparative Analysis of Glycation by Glucose Metabolites. J. Fluoresc. 2015, 25, 1721–1726. [Google Scholar] [CrossRef]
- Kessel, L.; Kalinin, S.; Nagaraj, R.H.; Larsen, M.; Johansson, L.B. Time-resolved and steady-state fluorescence spectroscopic studies of the human lens with comparison to argpyrimidine, pentosidine and 3-OH-kynurenine. Photochem. Photobiol. 2002, 76, 549–554. [Google Scholar] [CrossRef] [PubMed]
- Geddes, C.D.; Lakowicz, J.R. Reviews in Fluorescence; Springer: New York, NY, USA, 2015. [Google Scholar]
- Kwok, A.; Camacho, I.S.; Winter, S.; Knight, M.; Meade, R.M.; Van der Kamp, M.W.; Turner, A.; O’Hara, J.; Mason, J.M.; Jones, A.R.; et al. A Thermodynamic Model for Interpreting Tryptophan Excitation-Energy-Dependent Fluorescence Spectra Provides Insight into Protein Conformational Sampling and Stability. Front. Mol. Biosci. 2021, 8, 778244. [Google Scholar] [CrossRef] [PubMed]
- Rokos, H.; Moore, J.; Hasse, S.; Gillbro, J.M.; Wood, J.M.; Schallreuter, K.U. In vivo fluorescence excitation spectroscopy and in vivo Fourier-transform Raman spectroscopy in human skin: Evidence of H2O2 oxidation of epidermal albumin in patients with vitiligo. J. Raman Spectrosc. 2004, 35, 125–130. [Google Scholar] [CrossRef]
- Valeur, B. Molecular Fluorescence. In Principles and Applications; Wiley: London, UK; VCH: Weinheim, Germany, 2002. [Google Scholar]
- Kabir, M.L.; Wang, F.; Clayton, A.H.A. Red-Edge Excitation Shift Spectroscopy (REES): Application to Hidden Bound States of Ligands in Protein-Ligand Complexes. Int. J. Mol. Sci. 2021, 22, 2582. [Google Scholar] [CrossRef] [PubMed]
- Knight, M.J.; Woolley, R.E.; Kwok, A.; Parsons, S.; Jones, H.B.; Gulácsy, C.E.; Phaal, P.; Kassaar, O.; Dawkins, K.; Rodriguez, E.; et al. Monoclonal antibody stability can be usefully monitored using the excitation-energy-dependent fluorescence edge-shift. Biochem. J. 2020, 477, 3599–3612. [Google Scholar] [CrossRef] [PubMed]
- Mozo-Villarías, A. Second derivative fluorescence spectroscopy of tryptophan in proteins. J. Biochem. Biophys. Methods 2002, 50, 163–178. [Google Scholar] [CrossRef] [PubMed]
- Kumar, V.; Sharma, V.K.; Kalonia, D.S. Second derivative tryptophan fluorescence spectroscopy as a tool to characterize partially unfolded intermediates of proteins. Int. J. Pharm. 2005, 294, 193–199. [Google Scholar] [CrossRef] [PubMed]
- Belinskaia, D.A.; Voronina, P.A.; Shmurak, V.I.; Vovk, M.A.; Batalova, A.A.; Jenkins, R.O.; Goncharov, N.V. The Universal Soldier: Enzymatic and Non-Enzymatic Antioxidant Functions of Serum Albumin. Antioxidants 2020, 9, 966. [Google Scholar] [CrossRef]
- Yamasaki, K.; Sakurama, K.; Nishi, K.; Tsukigawa, K.; Seo, H.; Otagiri, M.; Taguchi, K. An in-vitro comparative study of the binding of caspofungin and micafungin to plasma proteins. J. Pharm. Pharmacol. 2022, 74, 88–93. [Google Scholar] [CrossRef]
- Yamazaki, E.; Inagaki, M.; Kurita, O.; Inoue, T. Kinetics of fatty acid binding ability of glycated human serum albumin. J. Biosci. 2005, 30, 475–481. [Google Scholar] [CrossRef]
- Holm, T.; Raghavan, C.T.; Nahomi, R.; Nagaraj, R.H.; Kessel, L. Effects of photobleaching on selected advanced glycation end products in the human lens. BMC Res. Notes 2015, 8, 5. [Google Scholar] [CrossRef]
Figure 1.
Location of HSA drug-binding sites and the Trp-214 residue, along with the main functions of albumin in the body, adapted from Refs. [8,9].

Figure 2.
The 3D model of HSA, illustrating the primary fatty-acid-binding sites (FA1–FA9), with specific emphasis on (a) lysine (Lys) residues and (b) arginine (Arg) residues, both of which are implicated in the in vivo glycation process.
Figure 2.
The 3D model of HSA, illustrating the primary fatty-acid-binding sites (FA1–FA9), with specific emphasis on (a) lysine (Lys) residues and (b) arginine (Arg) residues, both of which are implicated in the in vivo glycation process.

Figure 3.
(a) Main view: zero-order absorption spectra for non-(HSA) and glycated albumin (gHSA). Insert: a comparison of the normalized absorption spectrum for gHSA (gHSAnorm) to that of HSA. The shoulder between 320 nm and 330 nm for gHSA (in the main view) and gHSAnorm (in the insert) is marked in red; (b) the second derivative of absorption spectra for both HSA and gHSAnorm.

Figure 4.
Synchronous spectra of albumin (non-glycated HSA and glycated gHSA): (a) Δλ = 60 nm (λex = 220–440 nm); (b) Δλ = 15 nm (λex = 265–305 nm) (in the main view). Emission spectra of HSA and gHSA, excited at (a) λex = 295 nm and (b) λex = 275 nm (in the insert).
Figure 4.
Synchronous spectra of albumin (non-glycated HSA and glycated gHSA): (a) Δλ = 60 nm (λex = 220–440 nm); (b) Δλ = 15 nm (λex = 265–305 nm) (in the main view). Emission spectra of HSA and gHSA, excited at (a) λex = 295 nm and (b) λex = 275 nm (in the insert).


Figure 5.
In the main view: glycated albumin emission spectra gHSA normalized to non-glycated HSA (gHSAnorm), together with the second derivative fluorescence spectra of HSA and gHSAnorm (2nd HSA, 2nd gHSAnorm) for (a) λex = 275 nm and (b) λex = 295 nm. In the insert: detail of the Trp-214 region, covering the 370–400 nm wavelength range.

Figure 6.
Absorption spectra of defatted glycated albumin (gHSA) and glycated albumin in the presence of palmitic acid (PA) at molar ratios of PA:gHSA 1.5:1 and 3:1.
Figure 6.
Absorption spectra of defatted glycated albumin (gHSA) and glycated albumin in the presence of palmitic acid (PA) at molar ratios of PA:gHSA 1.5:1 and 3:1.

Figure 7.
Main view: the second derivative fluorescence spectra of glycated, defatted serum albumin (2nd gHSA), and albumin glycated in the presence of palmitic acid (PA) at molar ratios of PA:gHSA 1.5:1 and 3:1 (2nd PA:gHSAnorm 1.5:1 and 2nd PA:gHSAnorm 3:1): (a) λex = 275 nm; (b) λex = 295 nm. Insert: detail of the Trp-214 region, covering the 370–400 nm wavelength range.


Figure 8.
Emission fluorescence spectra of AGEs in non-glycated (HSA), glycated (gHSA), and glycated in the presence of palmitic acid (PA) albumin (with molar ratios of PA:gHSA 1.5:1 and PA:gHSA 3:1) at excitation wavelengths of (a) λex = 335 nm, (b) λex = 370 nm, and (c) λex = 485 nm. Albumin concentration was 5 × 10⁻⁶ mol·L−1; t = 37 °C.


Table 1.
Full width at half maximum (FWHM) and the position (λmax) of the maximum fluorescence intensity (Fmax) for HSA and gHSA at 5 × 10⁻⁶ mol∙L−1 concentration; λex = 275 nm and λex = 295 nm.
Table 1.
Full width at half maximum (FWHM) and the position (λmax) of the maximum fluorescence intensity (Fmax) for HSA and gHSA at 5 × 10⁻⁶ mol∙L−1 concentration; λex = 275 nm and λex = 295 nm.
| λex = 275 nm | λex = 295 nm | |||||||
|---|---|---|---|---|---|---|---|---|
| λmax (nm) | Δλmax (nm) | Fmax | FWHM (nm) | λmax (nm) | Fmax | Δλmax (nm) | FWHM (nm) | |
| HSA | 321 | 12 | 72.68 | 33.21 | 333 | 21.9 | 5 | 25.72 |
| gHSA | 309 | 25.54 | 24.45 | 338 | 4.9 | 21.68 | ||
Table 2.
Parameter H determined for gHSA and gHSAnorm at λex = 275 nm and λex = 295 nm.
| H275nm | λmin (nm) | λmax (nm) | H295nm | λmin (nm) | λmax (nm) | |
|---|---|---|---|---|---|---|
| HSA | 0.152 | 300 | 290 | 0.009 | 395 | 373 |
| gHSAnorm | 0.334 | 302 | 289 | 0.006 | 396 | 375 |
Table 3.
Full width at half maximum (FWHM) and the position (λmax) of the maximum fluorescence intensity (Fmax) for gHSA, PA:gHSA 1.5:1, and PA:gHSA 3:1; λex = 275 nm and λex = 295 nm.
Table 3.
Full width at half maximum (FWHM) and the position (λmax) of the maximum fluorescence intensity (Fmax) for gHSA, PA:gHSA 1.5:1, and PA:gHSA 3:1; λex = 275 nm and λex = 295 nm.
| λex = 275 nm | λex = 295 nm | |||||
|---|---|---|---|---|---|---|
| λmax (nm) | Fmax | FWHM (nm) | λmax (nm) | Fmax | FWHM (nm) | |
| gHSA | 309 | 25.54 | 24.45 | 338 | 4.90 | 21.68 |
| PA:gHSA 1.5:1 | 312 | 41.36 | 29.98 | 332 | 9.50 | 24.09 |
| PA:gHSA 3:1 | 313 | 41.94 | 29.41 | 338 | 10.70 | 24.03 |
Table 4.
Parameter H of gHSA, PA:gHSAnorm 1.5:1, and PA:gHSAnorm 3:1 Trp-214 and Tyr residues; λex = 275 nm and λex = 295 nm.
Table 4.
Parameter H of gHSA, PA:gHSAnorm 1.5:1, and PA:gHSAnorm 3:1 Trp-214 and Tyr residues; λex = 275 nm and λex = 295 nm.
| H275nm | λmin (nm) | λmax (nm) | H295nm | λmin (nm) | λmax (nm) | |
|---|---|---|---|---|---|---|
| gHSA | 0.157 | 301 | 289 | 0.002 | 395 | 372 |
| PA:gHSAnorm 1.5:1 | 0.230 | 301 | 289 | 0.003 | 395 | 375 |
| PA:gHSAnorm 3:1 | 0.235 | 301 | 289 | 0.006 | 395 | 372 |
Table 5.
The position (λmax) of the maximum fluorescence intensity (Fmax) of AGEs in HSA, gHSA, PA:gHSA 1.5:1, and PA:gHSA 3:1 for the excitation wavelengths λex = 335 nm, λex = 370 nm, and λex = 485 nm.
Table 5.
The position (λmax) of the maximum fluorescence intensity (Fmax) of AGEs in HSA, gHSA, PA:gHSA 1.5:1, and PA:gHSA 3:1 for the excitation wavelengths λex = 335 nm, λex = 370 nm, and λex = 485 nm.
| λex = 335 nm | λex = 370 nm | λex = 485 nm | ||||
|---|---|---|---|---|---|---|
| λmax | Fmax | λmax | Fmax | λmax | Fmax | |
| HSA | 441 | 17.31 | 449 | 15.95 | 531 | 33.18 |
| gHSA | 424 | 80.98 | 445 | 75.52 | 534 | 87.51 |
| PA:gHSA 1.5:1 | 420 | 92.38 | 441 | 85.65 | 531 | 72.03 |
| PA:gHSA 3:1 | 420 | 115.56 | 441 | 103.49 | 531 | 89.48 |
Disclaimer/Publisher’s Note: The statements, opinions and data contained in all publications are solely those of the individual author(s) and contributor(s) and not of MDPI and/or the editor(s). MDPI and/or the editor(s) disclaim responsibility for any injury to people or property resulting from any ideas, methods, instructions or products referred to in the content. |
© 2023 by the author. Licensee MDPI, Basel, Switzerland. This article is an open access article distributed under the terms and conditions of the Creative Commons Attribution (CC BY) license (https://creativecommons.org/licenses/by/4.0/).
Share and Cite
MDPI and ACS Style
Szkudlarek, A. Effect of Palmitic Acid on Tertiary Structure of Glycated Human Serum Albumin. Processes 2023, 11, 2746. https://doi.org/10.3390/pr11092746
AMA Style
Szkudlarek A. Effect of Palmitic Acid on Tertiary Structure of Glycated Human Serum Albumin. Processes. 2023; 11(9):2746. https://doi.org/10.3390/pr11092746
Chicago/Turabian StyleSzkudlarek, Agnieszka. 2023. "Effect of Palmitic Acid on Tertiary Structure of Glycated Human Serum Albumin" Processes 11, no. 9: 2746. https://doi.org/10.3390/pr11092746
Note that from the first issue of 2016, this journal uses article numbers instead of page numbers. See further details here.