1. Introduction
The international metropolis is the intermediate stage of the urban internationalization process. Its importance is that a mature and stable manufacturing industry promotes the re-optimization and re-adjustment of the service industry. The two industries are interdependent, mutually promoted, and integrated, which lays the foundation for the international transformation of the city [
1]. Of the industries, producer services stand out and have gradually become the core thrust of the evolution of the industrial structure of the international metropolis [
2], enabling economic development and structural adjustment. Service-oriented production continues to grow, based on human capital and knowledge capital transition, relying on the modern service industry, optimizing the production process for industrial assignment [
3]. The advantageous service industry dominated by intelligent manufacturing has further clarified the functional status and international role of the city [
4], and has constructed a strong and distinctive city card. The establishment of an international metropolis depends on the integration of emerging areas and characteristics of the service industry and the manufacturing industry to achieve breakthrough development. With this background, five major cities—New York, London, Paris, Tokyo, and Hong Kong—have become recognized as international metropolises. Shanghai, with Japan as the development template, has entered the ranks of “quasi-international metropolis”. However, at a critical moment when manufacturing is weak and support services have not yet risen, Shanghai’s urban transformation is facing major problems [
5]: on the one hand, rising labor costs, gradual expansion of land pressure, and the question of whether employment density can also drive economic growth need to be discussed [
6]. On the other hand, the new manufacturing strategy led by
Made in China 2025 needs to reconstruct the urban industrial value chain, break through the “external success secret” of the low-end locking of the value chain and extensive economic development. As an advanced manufacturing country as well as a large overseas net asset country, Japan’s manufacturing industry is the core industry that supports its economic development and the driving force of economic growth. The real economy, mainly manufacturing, is the foundation that supports the growth of the Japanese economy [
7]. In the face of the negative impact on the economy caused by trade friction between the US and China and the COVID-19 outbreak, Japan has accelerated its digital transformation strategy to maintain and enhance the international competitiveness of Japanese manufacturing. China is in the process of urbanization; however, the Japanese manufacturing industry developed technological solidity and brand advantages etc., in the 1980s [
8]. Therefore, China needs to transform from a manufacturing country to a manufacturing power country, and it needs to learn from the experience and lessons learned from the development of Japan’s consumer goods industry [
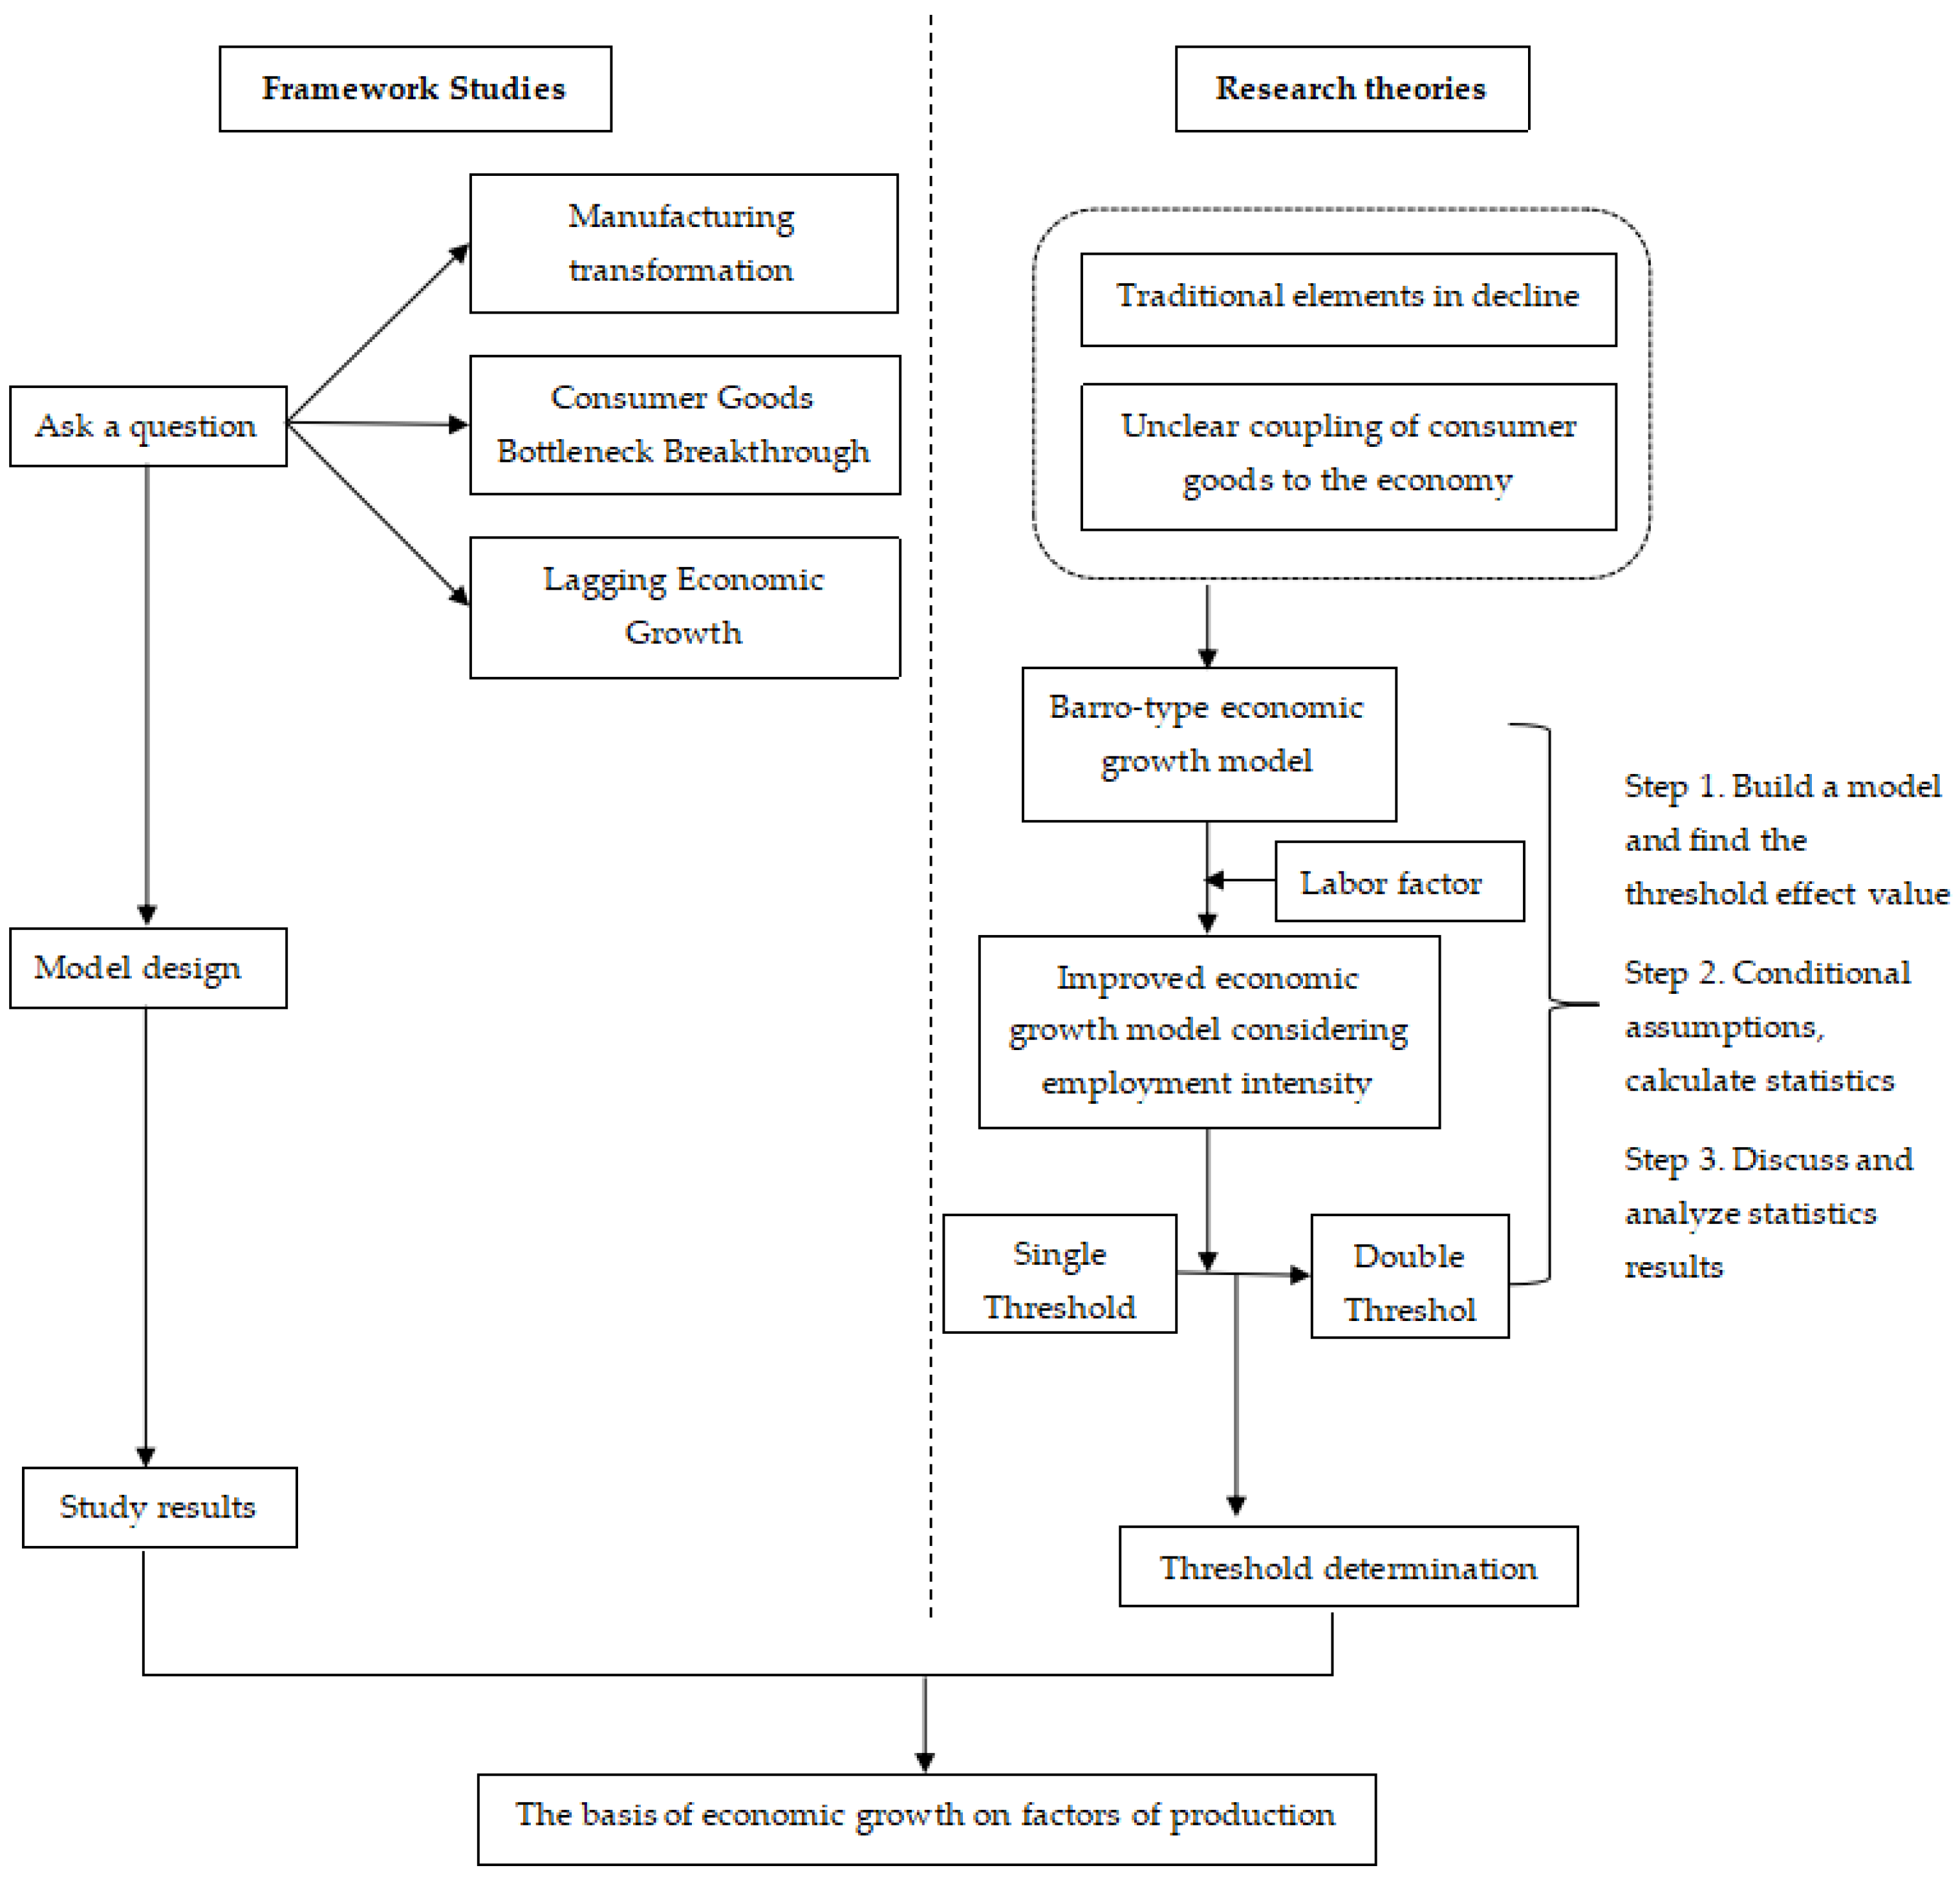
9]. Therefore, based on the new manufacturing background, this paper selects the consumer goods industry, which covers demand orientation and consumer factors, and takes “manufacturing + service” as the core research object. It compares the employment density of Shanghai and Japan’s consumer goods industry to boost economic growth, so as to provide useful enlightenment for the development of Shanghai’s international metropolis. The layout of this article is as follows: first, we present the existing literature to outline the relationship between employment density, population density, and economic development, and to formulate theoretical hypotheses. Second, we examine the threshold effects of employment density in each consumer goods industry on the economic development of urban areas in Shanghai and Tokyo, based on a Barro-type economic growth equation. This conducts a comparative analysis of empirical results. Finally, the article will provide suggestions for transforming and upgrading Shanghai’s consumer goods industry and government policy formulation based on empirical results. The overall analytical framework of this paper is shown in
Figure 1.
2. Literature Review
Under the background of new manufacturing, the manufacturing paradigm of the industry is undergoing subversion and innovation, and the economic leap of regional development has become a research hotspot [
10]. As the product of the progress of the times, the consumer goods industry evolved from the definition of the current urban industry and integrated it into the perspective of consumers. The consumer goods industry emphasizes the importance of services and is an important driving force for urban economic development. The change of its manufacturing paradigm has already brought a leap-forward change to the urban economic growth mode and economic efficiency. As “light manufacturing,” the consumer goods industry needs to pinpoint its competitive advantage and the markets it serves, taking into account all the demands, production situations, and time savings that can be made [
11]. In the important stage of late industrialization, Shanghai should learn from the successful experience of international metropolises and create a high-quality development path with Chinese characteristics. As one of the international metropolises, Tokyo in Japan has a relatively mature industrial structure. The development of the consumer goods industry has its characteristics and radiates to the surrounding areas to form the Tokyo metropolitan area. In addition, scholars have studied Japan’s industrial economic development model and concluded that “employment-industrial change-access to development space economic growth” Japan’s development experience model [
12,
13]. The most original core change force of this model is employment density, which catalyzes industrial upgrading, brings a strong labor force, and absorbs external capital, making social and economic growth glow with new opportunities [
14]. These studies provide a theoretical foundation for this article. Therefore, based on the study of the development of Japan’s consumer goods industry, research on the micro mechanism of Shanghai’s consumer goods industry development on urban economic growth is of great significance.
As a representative indicator to measure the degree of industrial agglomeration [
15], employment density is often used by scholars to study the economic development effect of industry on cities [
16]. Governments often incorporate employment density into evaluation indicators when supporting industry resources and measures. Most scholars’ research results show that industrial agglomeration has an essential impact on regional economic development, but due to the differences in research objects and perspectives, the conclusions are not the same. In terms of China’s manufacturing industry, Shao and Li found that manufacturing industry agglomeration and economic growth showed an “inverted U-shaped” trend, and the negative effect of the manufacturing industry in most sample regions is more significant [
17]. Taking the service industry in the Beijing-Tianjin-Hebei region as the research object, Zhou and Wang believed that employment density could significantly promote economic growth in the short term, and the long-term effect would weaken if the region were in the transition stage of the old and new models [
18]. Guo, in the analysis of the dynamic agglomeration effect of urban industry, by taking Shanghai as an example to confirm the agglomeration economic effect and industrial development showed a significant positive correlation [
19]. Foreign scholars also pay attention to the pulling effect of employment density on economic growth. Patrícia [
20] found that the increase in the density of employment space promoted the mobility of workers between enterprises, thereby increasing income generation and productivity; Guldmann [
21] is concerned about the rise of modern big cities. He believes that some big cities in countries with rapid economic growth and the population and employment density of these cities are relatively high. By constructing the Garin–Lowry model, it is found that the employment distribution of modern big cities has a vital role in promoting economic growth and affects the distribution of the service industry. Viladecans-Marsal [
22] argues that the level of employment in neighboring cities has contributed to industrial agglomeration, thereby driving long-term economic development and expanding the size of cities. The economic effects of agglomeration in different regions and industries are different. Focusing on the international metropolis, Shanghai, the consumer goods industry, has continued to stimulate economic growth in recent years as a service-oriented manufacturing industry. With the increasingly intensive employment, whether the agglomeration economic effect of the consumer goods industry can become the cornerstone of Shanghai’s sustainable development remains to be studied.
Industrial agglomeration further brings regional agglomeration. As the external manifestation of industrial agglomeration, Population density is closely related to the vitality of the urban economy [
23]. Population density is an important cornerstone affecting regional economic development. Population agglomeration brings economies of scale through sharing mechanisms, human resource externalities, and other channels that improve industrial production efficiency [
24] and promotes regional economic development. For example, in international metropolises such as Tokyo, Japan, and London, population density correlates with per capita income. If the regional population is too dense, the diseconomies of scale caused by the increase in production costs and the decrease in operating efficiency will also slow down economic development, resulting in negative impacts [
25]. Therefore, some scholars have conducted empirical research on this, found a “first rise and then fall” relationship between population density and economic growth [
26], explored the inflection point of this relationship, and studied the economic significance. In addition, in different stages of population expansion, the dominant model of economic growth is different [
27]. From resource-intensive and labor-intensive to knowledge-intensive, the development logic of the industry is also advancing with the times. In different stages of population density, industries have different boosting effects and ways on the economy. Under the background of the integration of production and consumption, the consumer goods industry is experiencing subversion and change. Simultaneously, the demographic dividend is excessive to the demographic capital dividend, and the scale effect will gradually be constrained by the crowding effect [
28]. In this context, it is particularly important to clarify the contribution of consumer goods industry agglomeration to urban economic development under the threshold of population density.
To sum up, under the background of new manufacturing, consumer goods gradually come into everyone’s view as a product of the new era. Shanghai’s consumer goods industry’s high-quality development will drive Shanghai’s industrialization process to be improved more quickly. Employment density is widely recognized in the academic world as an essential reference indicator for studying the industry on urban development. There is an inflection point in the relationship between employment density and economic growth in scholars’ studies. However, the role of employment density in Shanghai’s consumer goods industry’s smile curve has not been verified. Industrial agglomeration has a significant influence on the development of cities, and there are no precise results on the economic development of Shanghai’s consumer goods industry. The construction of an international metropolis is mainly driven by “service + manufacturing”, and the typical consumer goods industry is the core sector to stimulate urban transformation and boost economic transition. Under the background of new manufacturing, the employment density of Shanghai’s consumer goods industry is still in urgent need of investigation. This paper takes the consumer goods industry in Shanghai and Tokyo as the research objects, uses panel data to establish a regression model, and uses population density as a threshold variable to test the relationship between employment density and economic development, to explore the influence curve and inflection point of Shanghai consumer goods industry on economic development and explore the development potential of Shanghai consumer goods industry. This paper will compare the development path of the Tokyo consumer goods industry and provide theoretical support for the practice of the Shanghai consumer goods industry.
3. Research Design
Research on the threshold effect of economic growth is relatively well established. Xie applies a panel threshold model to analyze the threshold effects of new energy consumption transformation on economic growth with three threshold variables [
29]. Lei found that human capital’s educational attainment can only positively affect the economy when the economy is developed to a certain level [
30]. Cepni O finds that inequality can only change positively for economic growth with the level of economic development when the ratio of human capital to physical capital reaches a certain level [
31]. Thus, it is clear that the threshold model is a common and effective research method used by scholars in the literature on economic growth.
Survey data from the Chinese census show that China’s mobile population’s educational attainment has increased year on year with the spread of nine-year compulsory education. Therefore, along with the accelerated urbanization process in China, the proportion of the urban population with high human capital is gradually increasing, which makes the concentration of population and labor capital bring about the concentration of intellectual capital, and further brings about a positive contribution to industrial development and urban economic growth. Neoclassical economic growth models suggest that labor flows to regions with high marginal output can achieve regional economic convergence, but some empirical results suggest the opposite [
32]. Barro and Sala-i-Martin extend economic growth theory by considering the human capital carried by the population as part of the physical capital, integrating endogenous economic growth dispersion with economic convergence. Based on this theory, this study will construct and expand the new endogenous growth model of the economy under the Barro-type to carry out an empirical analysis with the following formula and calculation process.
The basic expression for the production function is:
The term Y denotes gross output, K denotes physical capital, A denotes technological progress, L denotes labor input, and AL denotes effective labor.
where
n is the rate of population growth and
m is the rate of population mobility. The human capital carried by the mobile population is introduced into the Solow–Swan model to obtain the physical capital accumulation equation:
where
is the contribution of human capital carried by the outflow population to physical capital accumulation, which in turn gives us the equation for effective physical capital accumulation per capita as:
Define the population mobility function: assume
Bringing Equation (5) into Equation (4) yields a model of economic growth with a population mobility function:
On this basis, Barro and Sala-i-Martin obtained a model of economic growth with a population mobility function.
In order to consider the differences brought about by the division of population density to different degrees, this paper, based on Barro-type economic growth equation and drawing on Brulhart and Sbergami’s methodology [
33], focuses on the threshold effect of employment density of consumer goods industries in Shanghai and Tokyo on urban regional economic development. Because the employment density and population density of the Shanghai and Tokyo consumer goods industry has different characteristics in different years, the employment density and population density of the two cities’ consumer goods industry may not be a simple linear relationship with economic development. In this paper, population density is selected as the threshold variable to obtain the nonlinear panel threshold model of the impact of employment density of consumer goods industry on economic development, as follows:
Step 1. Combined with the Barro-type economic growth equation, a nonlinear panel threshold model is established, and the threshold effect value is obtained.
where,
a11,
a12, and threshold γ are the parameters to be estimated, and the OLS method is used for estimation (Hansen, 199):
The sum of squares of residual:
The threshold estimation is obtained:
Step 2. Set up assumptions and statistics for the panel threshold model
Panel threshold model has ; original hypothesis and alternative hypothesis.
Further test the number of statistics:
Step 3. Discuss and analyze the model results
When the P value of the statistic is less than 0.1, the original assumption H0 is rejected, indicating that the model (7) has a threshold effect.
Besides, I() in the model is an indicator function. If the condition in brackets is satisfied, the value is 1; if the condition in brackets is not satisfied, the value is 0; and γ is the threshold parameter to be estimated. In this paper, the setting form of a panel threshold data model under a single threshold is considered, and the number of threshold parameters and the number of indicator functions increases simultaneously under multiple thresholds. In the formula, git represents the economic development level of a city at time t, which is measured by the GDP of each consumer goods industry; EDit indicates the employment density of consumer goods industries in cities; pdit represents the population density of the city; xit and θ are the control variable vector and the corresponding coefficient vector, respectively. This paper selects the number of enterprises in each consumer goods industry Numit as the control variable; εit represents a random interference term. In addition, a0 represents the drift, and a1i represents the coefficient of the explanatory variable.
Through the threshold treatment of the threshold model, this study further clarifies two aspects: the first is to rely on traditional production factors such as labor for manufacturing. The second is how to rely on employment intensity to cross development barriers and promote sustainable economic growth. Besides, the gap between the two types of manufacturing development models is explored through a comparison between developing countries represented by China and developed countries represented by Japan. In this way, it provides an empirical basis and a realization path for China and other developing countries to reconstruct labor production factors and deconstruct the connotation of Barro-type economic growth.
The following is the description of the relevant variable index selection and data sources:
(1) Economic development level git. Gross domestic product (GDP) is a comprehensive assessment of regional economic development and a core indicator of regional economic development. In general, a higher GDP represents a higher regional economic level. This paper selects the nominal GDP of Shanghai and Tokyo from 2007 to 2016 to describe their economic development level, and the GDP deflator based on 2006 is deflated to ensure the vertical comparability of observation data. The original data came from Shanghai Statistical Yearbook and Tokyo Statistical Yearbook.
(2) Employment density EDit. Employment density is an appropriate indicator reflecting the agglomeration of manufacturing production activities in various administrative units, reflecting the total number and distribution of labor factors in the industrial sector. Higher employment density represents the greater attraction and production scale of the industry in the region, and it also depicts the degree of industrial agglomeration to a certain extent. In this paper, the number of employees in the Shanghai and Tokyo consumer goods industry is divided by land area as the employment density of each consumer goods industry. The calculation method is operable, and the difficulty of calculation and analysis is moderate. The above two indicators are derived from the concept of Shanghai Statistical Yearbook and Tokyo Statistical Yearbook.
(3) Population density pdit. Population density mainly measures the agglomeration of economic activities, which macroscopically reflects the urban scale and population concentration. Higher population density represents higher potential labor and human resources, indirectly portraying the economic development potential of metropolitan areas. In this paper, Ciccone and Hall’s (1996) calculation methods are used to determine that population density is equal to the total regional population divided by land area. The two original indicators are also from Shanghai Statistical Yearbook and Tokyo Statistical Yearbook.
(4) Number of enterprises Numit. Due to the existence of the scale effect, the number of enterprises will have a certain impact on the economic contribution of the industry. Therefore, this paper selects the number of enterprises in each consumer goods industry as the control variable.
(5) Consumer goods industry. The consumer goods industry includes durable consumer goods and non-durable consumer goods in two industrial markets. According to the level of meeting people’s needs, the consumer goods industry has basic consumption (such as basic expenditure on clothing, food, housing, and use), developmental consumption (such as expenditure on sports and cultural goods for the development of physical strength and intelligence, and expenditure on leisure and entertainment such as communication, catering tourism, and media films), and enjoyment consumption (such as expenditure on advanced nutrients, gorgeous clothing, and art treasures). In general, the consumer goods industry includes the food processing industry, cosmetics and cleaning supplies industry, clothing industry, packaging and printing industry, interior decoration industry, process tourism, small electronic processing industry, and pharmaceutical manufacturing industry.
The original data analysis of the variables in this paper is as follows:
It can be seen from
Figure 2, that from the data of Shanghai and Tokyo, there is still much room for the population size of Shanghai to increase. In 2016, the total population of Shanghai was 24.197 million, and Tokyo was 13.6362 million; the proportion is 1.75%, 10.74%, respectively. Therefore, although Shanghai has a large population, its proportion in the whole country is low, which is obviously difficult to meet the standards of the international metropolis circle. In addition, it can be seen from
Figure 3 that in 2016, the population density of Shanghai was 38,000 people/km
2, and that of Tokyo was 0.6 million people/km
2. Compared with Tokyo, Shanghai has less population density. Shanghai’s population density has been in a steady state since 2012, maintained at about 0.4 million people/km
2; Compared with Tokyo, the land share of Shanghai is in second place, but the population density is small. In 2016, the population density of Tokyo was 1.58 times that of Shanghai.
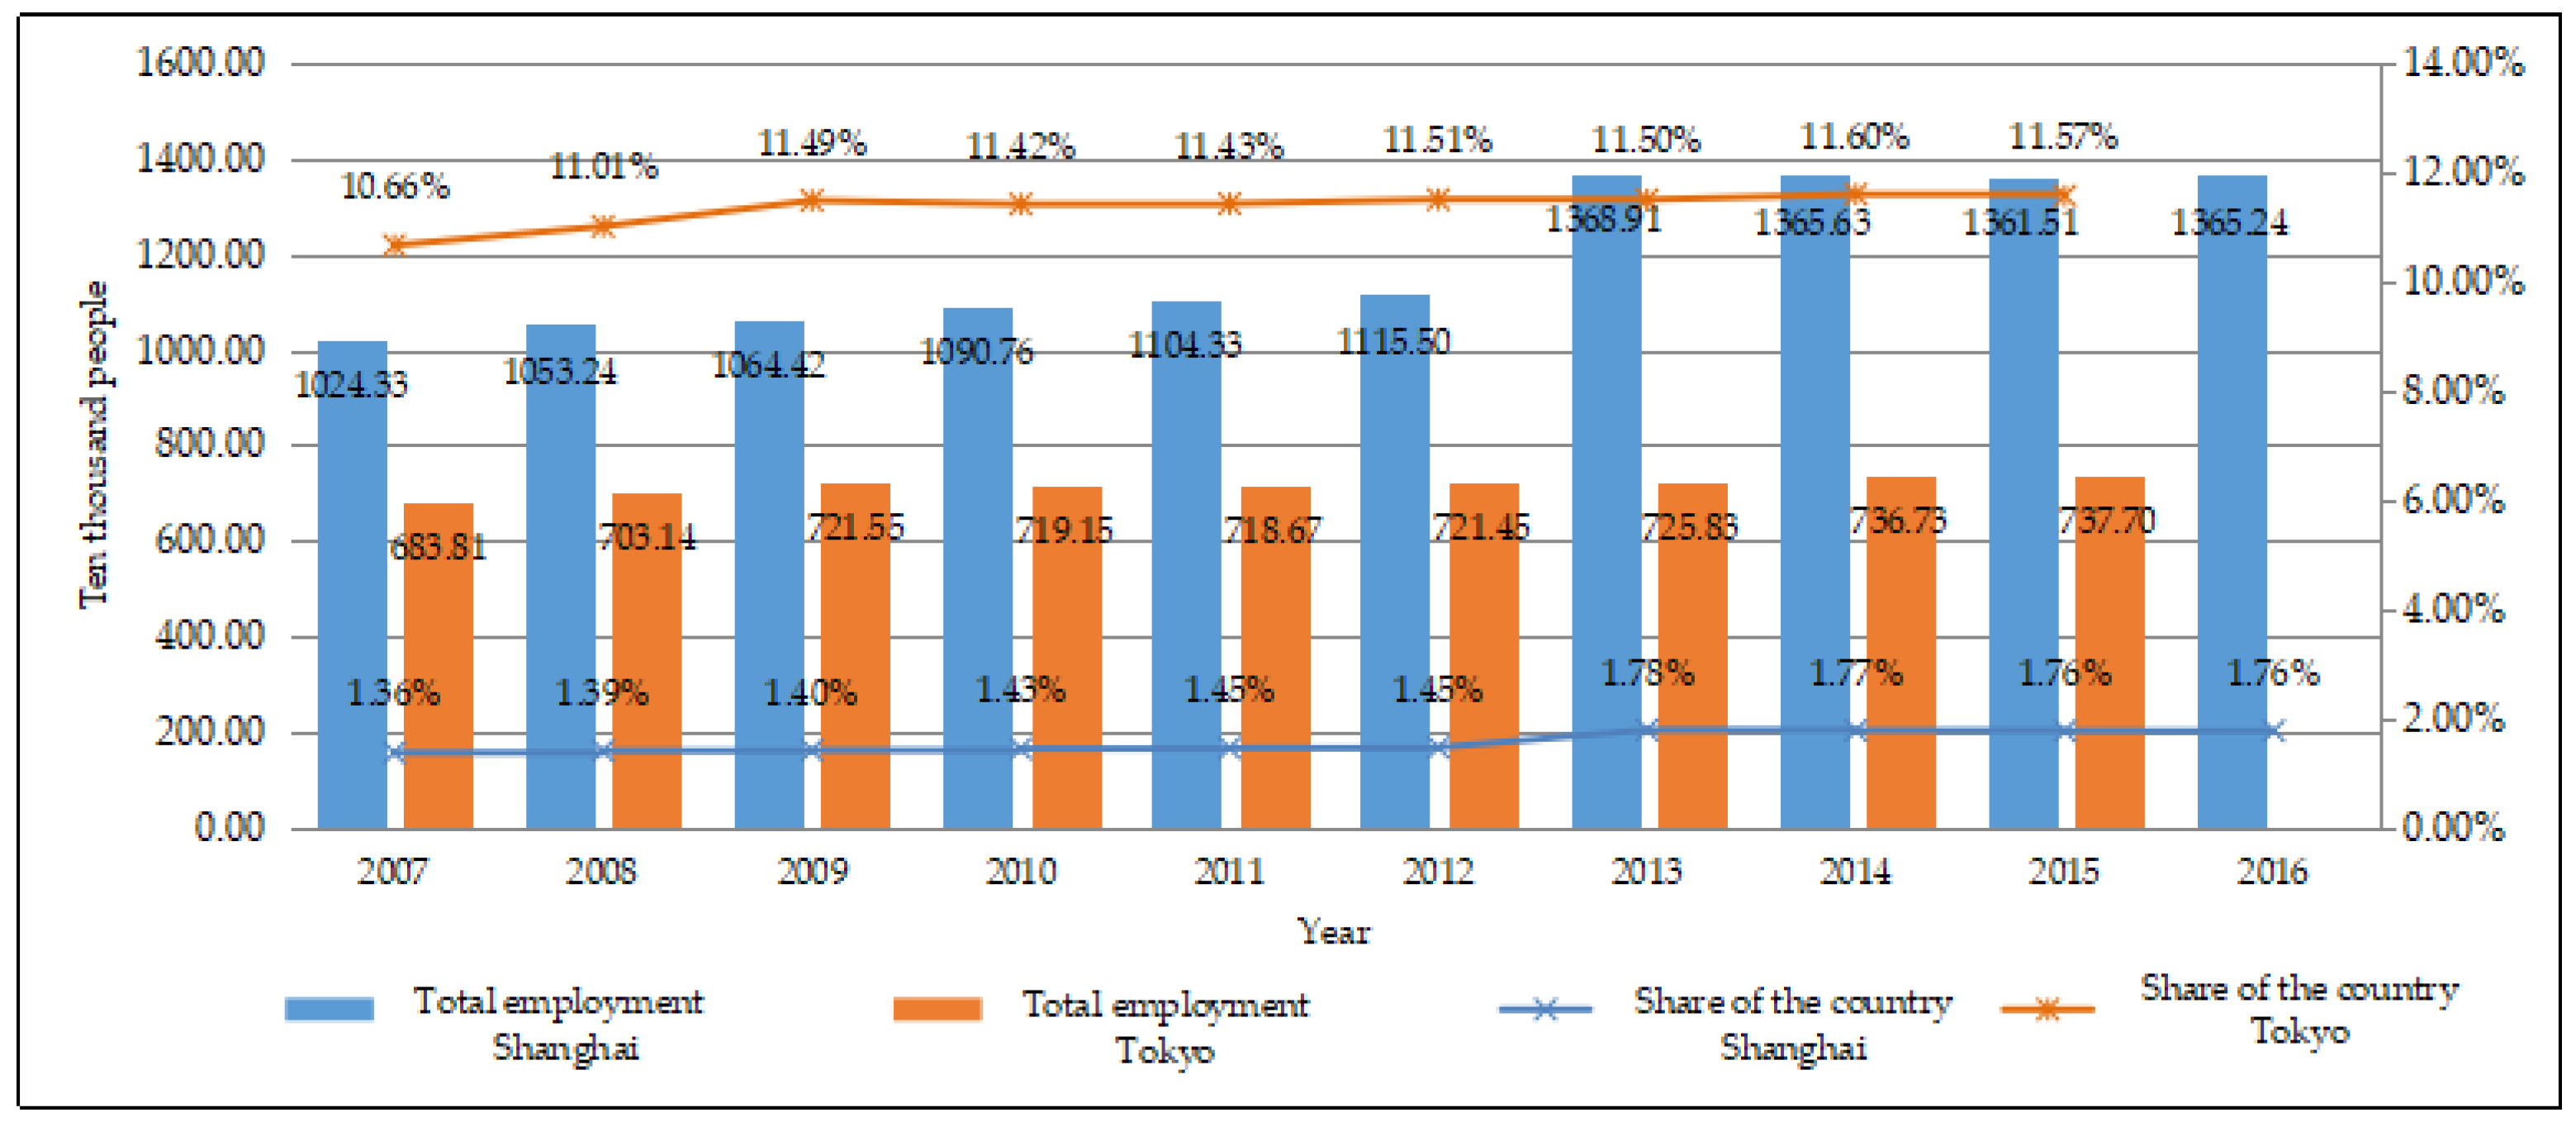
Figure 4 shows that the employment rate in Shanghai is obviously different from that in Tokyo. In 2016, the total employment in Shanghai was 13.6524 million, and that in Tokyo was 7.377 million. Its proportion in the country was 1.76% and 11.57%. Therefore, the total employment population in Shanghai is the largest, but it accounts for the lowest proportion of the country. In addition, according to
Figure 5, in 2016, the employment density in Shanghai was 0.22 million people/km
2, and that in Tokyo was 0.34 million people/km
2. Compared with Tokyo, Shanghai’s employment density is smaller. The employment density of Shanghai is 0.65 times that of Tokyo. Although the employment density of Shanghai is increasing year by year and the total employment is greater than that of Tokyo, there is still room for further improvement in the employment density of Shanghai.
5. Research Conclusions and Policy Recommendations
5.1. Research Conclusions
This paper analyzed the impact of employment density of the consumer goods industry in Shanghai and Tokyo on economic development and specifically examined which categories of consumer goods industry have considerable development space and the greatest impact on economic development. By means of comparative analysis, the industrial structure characteristics of Tokyo’s high-quality consumer goods industry were fully used for reference to further cultivate Shanghai’s characteristic industries. Based on the focus on the population threshold, this study analyzed the mechanism of the Shanghai consumer goods industry on urban economic development in detail:
Firstly, according to the above analysis results, there is a threshold effect between the Tokyo consumer goods industry and urban economic growth, while the economic contribution curve of the Shanghai consumer goods industry has not reached the inflection point. Most of Tokyo’s consumer goods industry is on the role of economic development after the threshold from positive to negative, indicating that Tokyo’s consumer goods industry has reached the inflection point of industrial development. Combined with the proportion of consumer goods industry in Tokyo’s GDP can be seen; although the economic contribution of the consumer goods industry is reduced, in terms of its absolute value, it still dominated in many industries. However, most of Shanghai’s consumer goods industry shows a negative effect after the threshold, indicating that the development of Shanghai’s consumer goods industry has been weak in the past decade, and has not played its industrial advantages to drive positive economic growth. However, since the negative coefficient becomes smaller after the threshold value and shows a trend of positive effect transformation, Shanghai should still stimulate the economic vitality of the consumer goods industry and vigorously develop the consumer goods industry combined with the development experience of Tokyo. Under the background of the continuous increase of population density in Shanghai, we should give full play to the effect of “consumption” as one of the three carriages to stimulate economic growth and promote the healthy and stable growth of the urban economy.
Second, combined with the above ranking of the development potential of consumer goods industry, Shanghai consumer goods industry in accordance with the order from large to small: food processing industry, cosmetics industry, clothing industry, packaging, and printing industry, indoor decoration industry, small electronic processing industry, pharmaceutical manufacturing industry, and process tourism. Comparing the development status of various industries in Tokyo, it can be found that there is still a big gap between the Shanghai consumer goods industry and Tokyo. Therefore, Shanghai should give priority to the development of the food processing industry, cosmetics and cleaning supplies industry, clothing industry, and other industries in the first and second echelon on the basis of vigorously developing the consumer goods industry and promote the overall economic contribution ability of the consumer goods industry after forming the characteristics of the consumer goods industry in Shanghai.
5.2. Policy Recommendations
Through the comparative analysis of the above international data, combined with the new concept of “new manufacturing”, this study suggests that the transformation and upgrading of Shanghai consumer goods industry should be based on the following two theories. These two theories are the industry chain, the value chain, and the innovation chain three chain merger theory, service industry, and manufacturing industry integration theory. According to the above theory, Shanghai should extend the traditional consumer goods industry to the upstream and downstream ends of the industrial chain, and it should combine the R & D design of upstream products with the downstream market and brand to forge the core competitiveness of the industry, to realize the new positioning of Shanghai consumer goods industry in health, beauty, and intelligence. Shanghai should integrate scientific research and technical service industry into the upstream R & D design of consumer goods industry chain to improve industrial innovation and product added value; Increase the financial and technical support for information transmission, software and information technology services in the field of consumer goods industry, and it should provide strong information integration development of the whole industrial chain for the development of consumer goods industry. In the downstream of the consumer goods industry chain to develop wholesale and retail, auxiliary industry chain downstream marketing, shaping well-known brands. Shanghai should connect the upstream and downstream of the industrial chain through the combination of industrial chain, value chain, and innovation chain to promote the intelligent development of consumer goods industry. At the same time, the pharmaceutical manufacturing industry, arts and crafts, tourism supplies manufacturing industry in consumer goods industry can be integrated with medical services and entertainment services in service-oriented production, respectively, to create a medical science and technology achievements incubator park and a cultural and creative park and promote the high-level and high-quality integrated development of the industry. Finally, through industrial chain innovation and industrial integration, the integration and development of Shanghai’s traditional consumer goods industry and producer services (scientific research and technical services and information transmission, software and information technology services) and service-oriented manufacturing (entertainment services and medical services) are promoted. Relying on the completion of the landmark industrial park, Shanghai’s economic development is provided with impetus.
5.3. Research Limitations and Perspectives
This study examines the consumer goods industry in Shanghai, China, and Tokyo, Japan, and empirically analyses industry data from 2007 to 2016. Through comparison, this study identifies gaps and problems between Shanghai and Tokyo and makes some suggestions for the future development of Shanghai, but the following limitations remain. On the one hand, although Shanghai has taken reference from Tokyo’s development experience in Japan in the process of internationalization, there are still specific differences between China and Japan, especially in terms of the level of industrialization between regions. China’s manufacturing industry has always had a huge domestic market, and in the process of urbanization, there will be a surplus of labor and difficulties in employment for university students for a longer time. Therefore, the consumer goods industry’s threshold values in Tokyo, Japan, are more of a reference for Shanghai, which should still benchmark the experience of more international metropolises, such as New York, USA, in its industrial transformation. To promote economic development faster and better: on the other hand, due to limited access to data, this study only provides statistical analysis up to 2016, but with increased uncertainty in the environment, there is an urgent need to analyze developments in the last five years for comparison and trend forecasting. In summary, the authors believe that future research could focus on comparative studies of other cosmopolitan cities in order to develop more applicable conclusions. Furthermore, the research needs to track and analyze each city’s industrial development in recent years to portray the development pattern of the industry from a long-term perspective and provide suggestions for the transformation and upgrading of the industry and the economic development of the city.


