
Experimental and Numerical Investigations for Dual−Cavity Tip Aerodynamic Performance in the Linear Turbine Cascade
1
School of Energy Science and Engineering, Harbin Institute of Technology, Harbin 150001, China
2
ACEE Commercial Aircraft Engine Co., Ltd., Shanghai 200241, China
*
Author to whom correspondence should be addressed.
Aerospace 2023, 10(2), 193; https://doi.org/10.3390/aerospace10020193
Submission received: 17 January 2023
/
Revised: 13 February 2023
/
Accepted: 14 February 2023
/
Published: 17 February 2023
(This article belongs to the Section Aeronautics)
Abstract
:Experimental and numerical studies of a linear high-loaded turbine cascade with a dual−cavity tip structure are presented in this paper. The experimental conditions contained an increase in the outlet Mach number from 0.42 to 0.92, a change in the incidence angle from −15° to 15° and an increase in the relative clearance size from 0.36% to 1.4%. The ability of the dual−cavity tip to control leakage losses and vortices is assessed using the total pressure coefficient and the Q-criterion. This research indicates that the leakage vortex interacts strongly with the passage vortex, and the change in working conditions affects the balance between the two vortices and thus the flow field structure. The experimental and numerical results prove that the dual−cavity tip can reduce losses in all operating conditions, with the best control effect reduced by 0.025 in a large clearance size condition. In addition, the leakage control effect of the blade tip structure is more influenced by the incoming flow angle and clearance size than the Mach number.
1. Introduction
Corner region loss is of great importance in the turbine design process. The clearance leakage flow caused by the relative movement between the rotor and the casing wall forms a leakage vortex under the driving pressure between the suction and pressure surfaces. The mixing effect between the leakage flow and the main flow not only increases the energy losses, but also changes the load distribution in the blade tip region and reduces the work capacity [1]. A high-loaded turbine blade also means the increased pressure difference, which inevitably leads to more leakage flow and more losses. To control this, blade tip cavities, winglet structures and a range of blade tip geometry optimization methods have been developed.
The cavity tip structure with suction and pressure surface squealers is an important way to control the tip leakage flow. Nicole [2] demonstrated that the cavity structure can reduce the tip leakage flow velocity by comparing the flat tip through an experimental study of a turbine blade at high speed; he found a significant backflow inside the cavity, with the airflow flowing into the clearance and then continually striking the bottom of the cavity, hence why the cavity structure is effective in reducing leakage. Li [3] carried out numerical calculations for transonic conditions and found that the cavity structure reduces the flow velocity in the tip region, with most of the leakage flow coming from the leading edge of the blade. He compared three different cavity depths with and without relative casing motion and found that the cavity depth had little effect at transonic regions. Zeng [4] investigated the flow mechanism of the transonic turbine cavity tip leakage using the numerical simulation, finding that the vortex structure inside the cavity plays a sealing role to obviously reduce the leakage flow, but the growth in the width of the pressure-side squealer is not conducive to controlling the leakage vortex; Li [5] numerically investigated the effect of the cavity depth and clearance size on turbine aerodynamic and heat transfer performance in a staged environment and found that the total pressure loss first decreased and then increased while increasing the cavity depth. Park [6] first did experimental and numerical studies on the multi-cavity structure by arranging the rib inside the tip cavity parallel to the pitch direction; Masoud [7] investigated the effect of single and dual−cavity tip structures on leakage flow through numerical simulation with and without inlet guide vanes respectively; he found that the vortex structure formed inside the cavity could significantly reduce the flow area of the leakage and the sensitivity of the flow parameters to changes in clearance.
The winglet tip is another important way to control the tip leakage by changing the distribution of the pressure load in the suction and pressure surfaces. By experimentally exploring the suction-side and pressure-side winglets, Dey [8] found that the suction-side winglets can change the location of the tip leakage vortex while the pressure-side winglet can reduce the leakage flow rate to reduce energy losses; through a numerical study of three different winglet shapes in a GE-E3 turbine stage environment, Jiang [9], found that the design combing a winglet with a squealer can greatly improve the aerodynamic thermodynamic efficiency, where the arrangement of the suction side was superior to the pressure side.
Zhang [10] investigated a new winglet-shroud geometry and derived the conclusions that the winglet-shroud design is able to minimize aerodynamic losses due to the common winglet structure when a linkage exists in the middle streamwise position of the winglet. Zhou [11] also designed a multi-parameter control-based tip geometry modeling method based on the winglet structure and obtained a new tip geometry structure with maximum efficiency using a multi-island genetic algorithm.
Chen [12] investigated the aerodynamic performance of three different cavity tip configurations through wind tunnel experiments, including inline squealer, cavity winglet tip and dual−cavity combined winglet tip configurations. Finally, it was found that the dual−cavity combined winglet tip had the best aerodynamic performance, optimizing the aerodynamic performance by 4% compared to the inline squealer structure, while the cavity winglet tip carried out an optimization of 1%.
However, turbine engines are subject to various changes in incidence angle, clearance size and working Mach number during take-off, cruise and landing. This indicates that the pressure gradient driving the leakage, the flow direction and the mainstream environment are constantly changing. In this research, the dual−cavity combined winglet configuration is formed by adding a cavity splitting rib to an original tip structure containing the cavity and pressure side winglet. The cavity-splitting rib divides the tip cavity into two parts, blocking the tip leakage flow and guiding the flow direction at the same time. According to Denton’s theory, a proper leakage flow direction can effectively reduce the mixing loss between the leakage flow and the main flow. However, optimization of aerodynamic performance in a single state is not enough. It’s worth to know whether the tip geometry can still provide best control performance over a wider operating range.
A series of experiments were carried out with the outlet isentropic Mach number varying from 0.42 to 0.92, incidence flow angle transitioning from −15° to 15° and clearance size in the range of 0.36–1.4%. In addition, experimental and numerical results under several operating conditions are incorporated to observe the loss development and vortex structure changes for the optimized geometric configuration in different mainstream states, thus analyzing the adaptability of the dual−cavity structure to these operating conditions.
There are two primary purposes of this study: the first is to understand the role played by the dual−cavity tip structure in controlling the tip leakage flow and to learn the mechanism to mitigate the leakage loss; the second is to analyze the adaptability of the tip geometry to different mainstream operating conditions and to provide corresponding technical support to improve the aerodynamic performance after the operating conditions are changed. The remainder of the article is organized as follows: Section 2 first elucidates the experimental methods used in this study, including the test rig, blade parameters, measurement techniques and the experimental error analysis; then the second part of Section 2 provides an overview of the numerical methods, including the fluid domain, boundary conditions, grid convergence index and the calibration of the experimental results; Section 3 lists three different operating conditions and analyzes the loss development as well as vortex structure for different outlet Mach number, incidence angle and clearance size conditions. Subsequently, a comprehensive comparison of the flat tip and dual−cavity tip for all operating conditions is finished to obtain the real effect of the dual−cavity tip geometry on leakage flow control. Finally, Section 4 gives the conclusion.
2. Experimental and Numerical Methods
2.1. Experimental Method
2.1.1. Experimental Facility
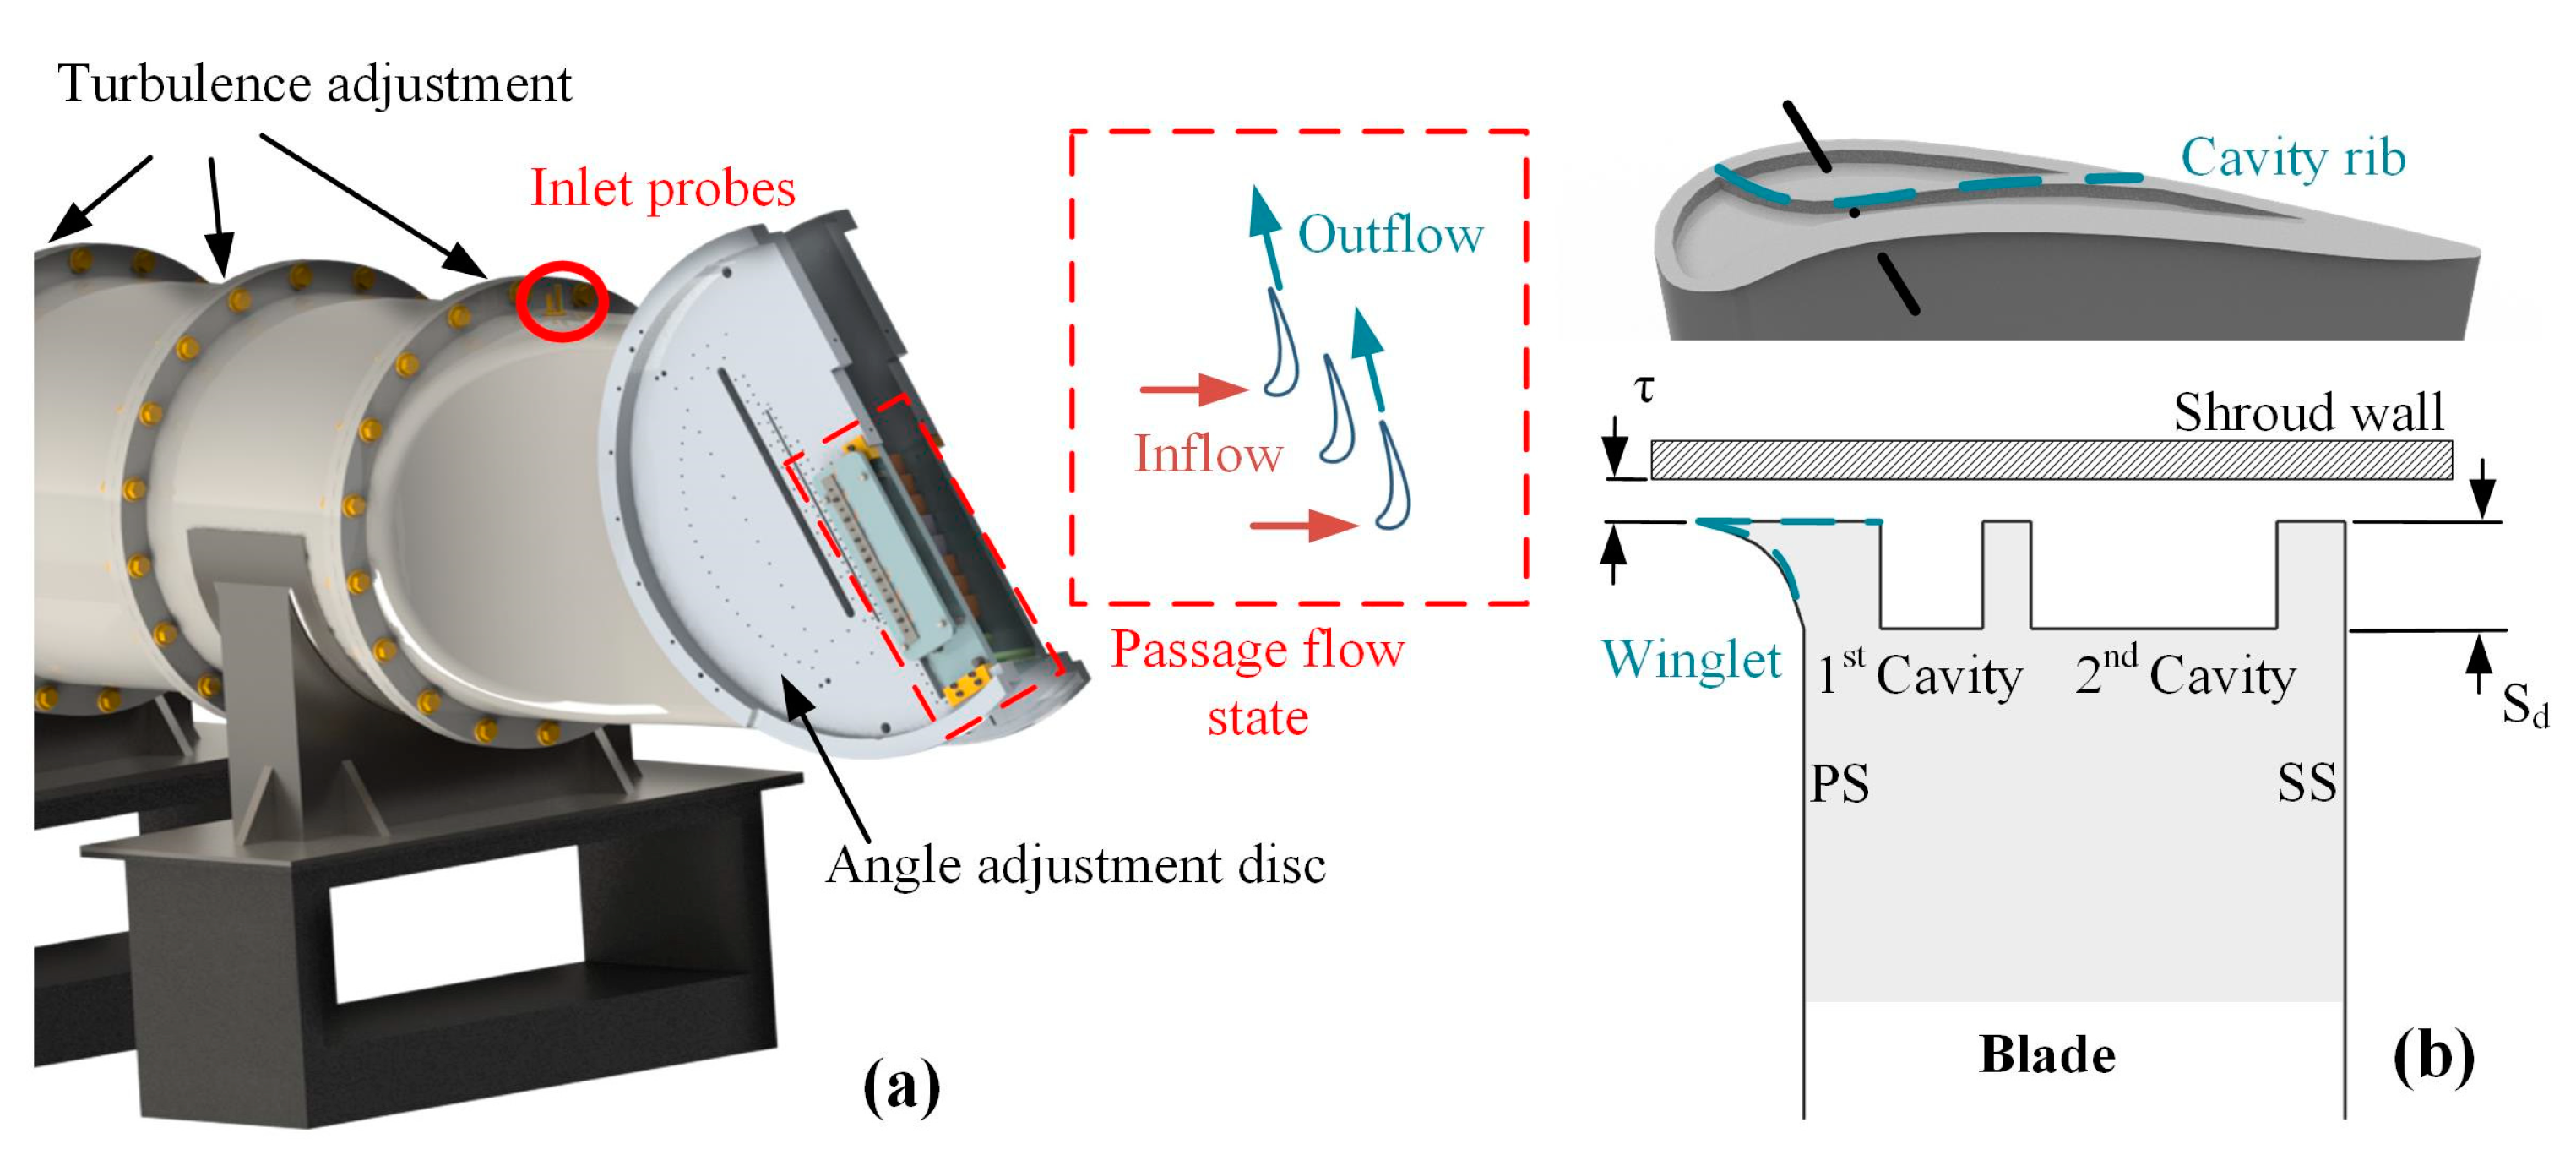
This study is conducted for a linear rotor cascade, where the blade is obtained by conformally mapping the blade tip profile of a second-stage turbine rotor. The experimental work was carried out on the transonic wind tunnel at Harbin Institute of Technology. Figure 1 indicates the wind tunnel and the configuration of the blade tip. As shown in the right part of Figure 1a, the turbulence in the wind tunnel is controlled using a mesh grille at the flange. Probes are arranged at the front of the angle adjustment disc to measure the inlet total temperature and total pressure of the blade passage. The incidence angle can be changed by turning the angle adjustment disc. The flow state of the airflow is given on the right side of Figure 1a. A schematic diagram of the dual-cavity tip is shown in Figure 1b. The cavity tip consists of a winglet on the pressure side and a squealer on the suction side; a cavity rib is arranged inside the cavity to form a dual−cavity structure.
The molded design of the turbine blades is based on the wind tunnel exit dimensions. As listed in Table 1, the spanwise of the passage is 100 mm, the blade chord C is 50 mm and the cascade pitch P is 43.23 mm. With an incidence angle of zero degrees and an outlet Mach number of 0.92, the data collection taking clearance sizes τ of 0.36, 0.8, 1.1 and 1.4 mm are carried out during the experiment and which are 0.36% to 1.4% of relative height, and the cavity depth Sd is 1.7 mm. The incidence angle and the exit Mach number is controlled by adjusting the angle disc and the total inlet pressure, respectively. The change in the outlet Mach number specifies a zero-degree incidence angle and the clearance size of 0.36 mm, while the variation in the angle fixes the clearance size of 0.36 mm and the outlet Mach number of 0.92.
2.1.2. Measurement Techniques
The measurements involved in aerodynamic experiments include the aerodynamic characteristics and the pressure distribution on the blade profile. The exit measurement plane is 0.4 times the axial chord length downstream from the trailing edge of the blade, and the pressure measure arrangement evenly covers two pitches in order to calculate the outlet isentropic Mach number of the cascade together with the obtained inlet total pressure. The outlet isentropic Mach number can be derived from Equation (1), where is the inlet total pressure, is the exit pressure and is the heat capacity ratio.
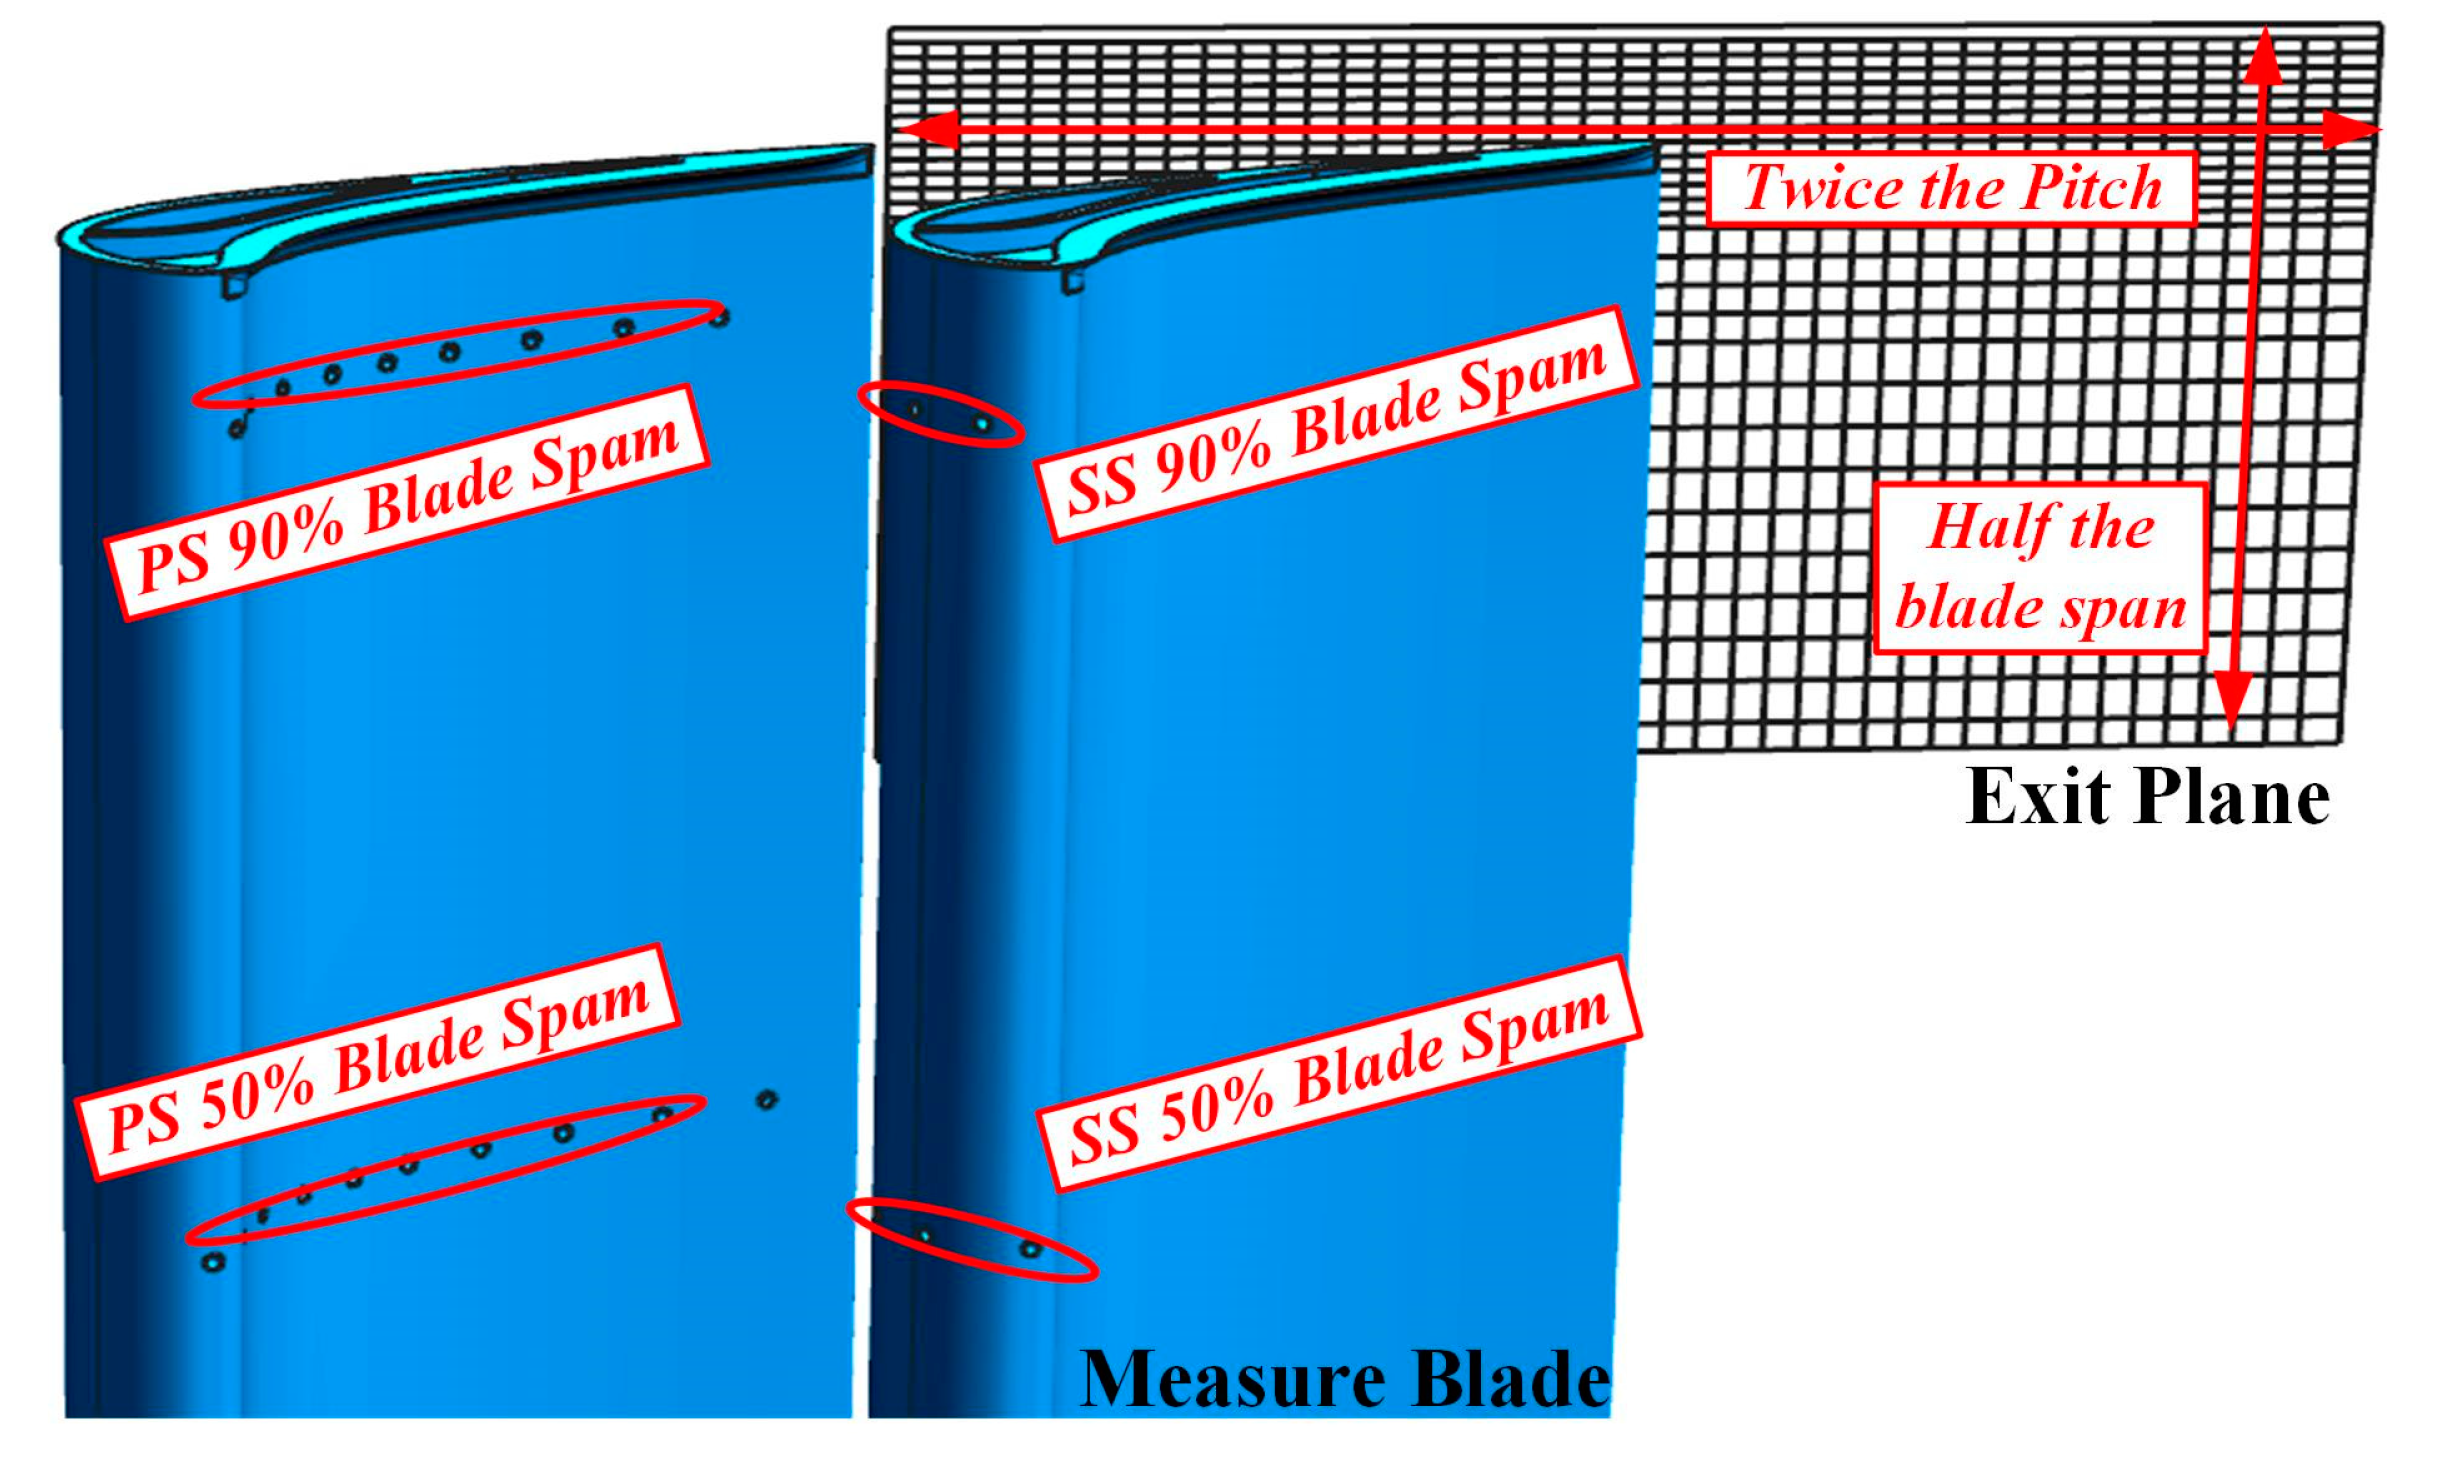
A five-hole probe [13] is used in the exit plane to sweep the pitch direction and the blade span direction. The sweeping path of the five-hole probe is shown in Figure 2. Due to the limitation of the probe diameter, the measurement points cannot be arranged within 1 mm near the shroud (casing) wall. In the spanwise direction, each measurement point is arranged every 3 mm in the sparse area, every 2 mm in the denser area and every 1 mm in the densest area near the casing. A five-hole probe sweeping region covers half the blade height and two pitches in the pitch-wise direction, for a total of 27 × 38 = 1026 measurement points. The dense area of the five-hole probe can provide complete coverage of the tip leakage vortex.
In addition to the aerodynamic parameter measurements in the outlet surface, pressure distribution along the blade is also taken into account. To ensure that the experimental results have the periodicity in the pitch-wise, the cascade was composed of eight blades with seven full passages. Two center blades were used for profile pressure measurement; the suction and pressure surface measurements were performed separately. Pressure points at 90% and 50% of the blade height were interspersed on each blade. Considering the thickness of the blade, there are no measure points on the trailing edge. The collected pressure data is used to obtain the surface isentropic Mach number, which can evaluate the blade load distribution.
After a three-coordinate measurement, the test blade had a form tolerance of ±1 mm and an angular installation error of ±1°. During the test, the pressure scanner PSI9216 has been used for data acquisition, which has a pressure measurement range of 15 PSI with an error of ±0.05% of full scale. The five-hole probe has been calibrated within the pitch and yaw angles of ±30°, and the calibrated five-hole probe could meet the angular measurement accuracy of ±1°. In addition to this, temperature data acquisition is carried out through a K-type thermocouple, which has a measurement accuracy of ±1 degree Celsius.
2.2. Numerical Method
2.2.1. Mesh Discretization
The flow fields for analysis in this research are solved using ANSYS CFX v14.0. Referring to the previous studies on the tip leakage flow problems of Zhang [10] and Maral [14], Menter’s SST turbulence model [15] has been used to approximate the turbulent viscosity in the present study. The fluid mesh has a first layer grid width of 2 × 10⁻⁶ m and the Y plus value is 0.02~2 on the blade. All walls including the blade, casing and hub are provided with 10 boundary layers with an expansion ratio of 1.5. The setting of the wall boundary layer is kept unchanged during the verification work of the mesh number.
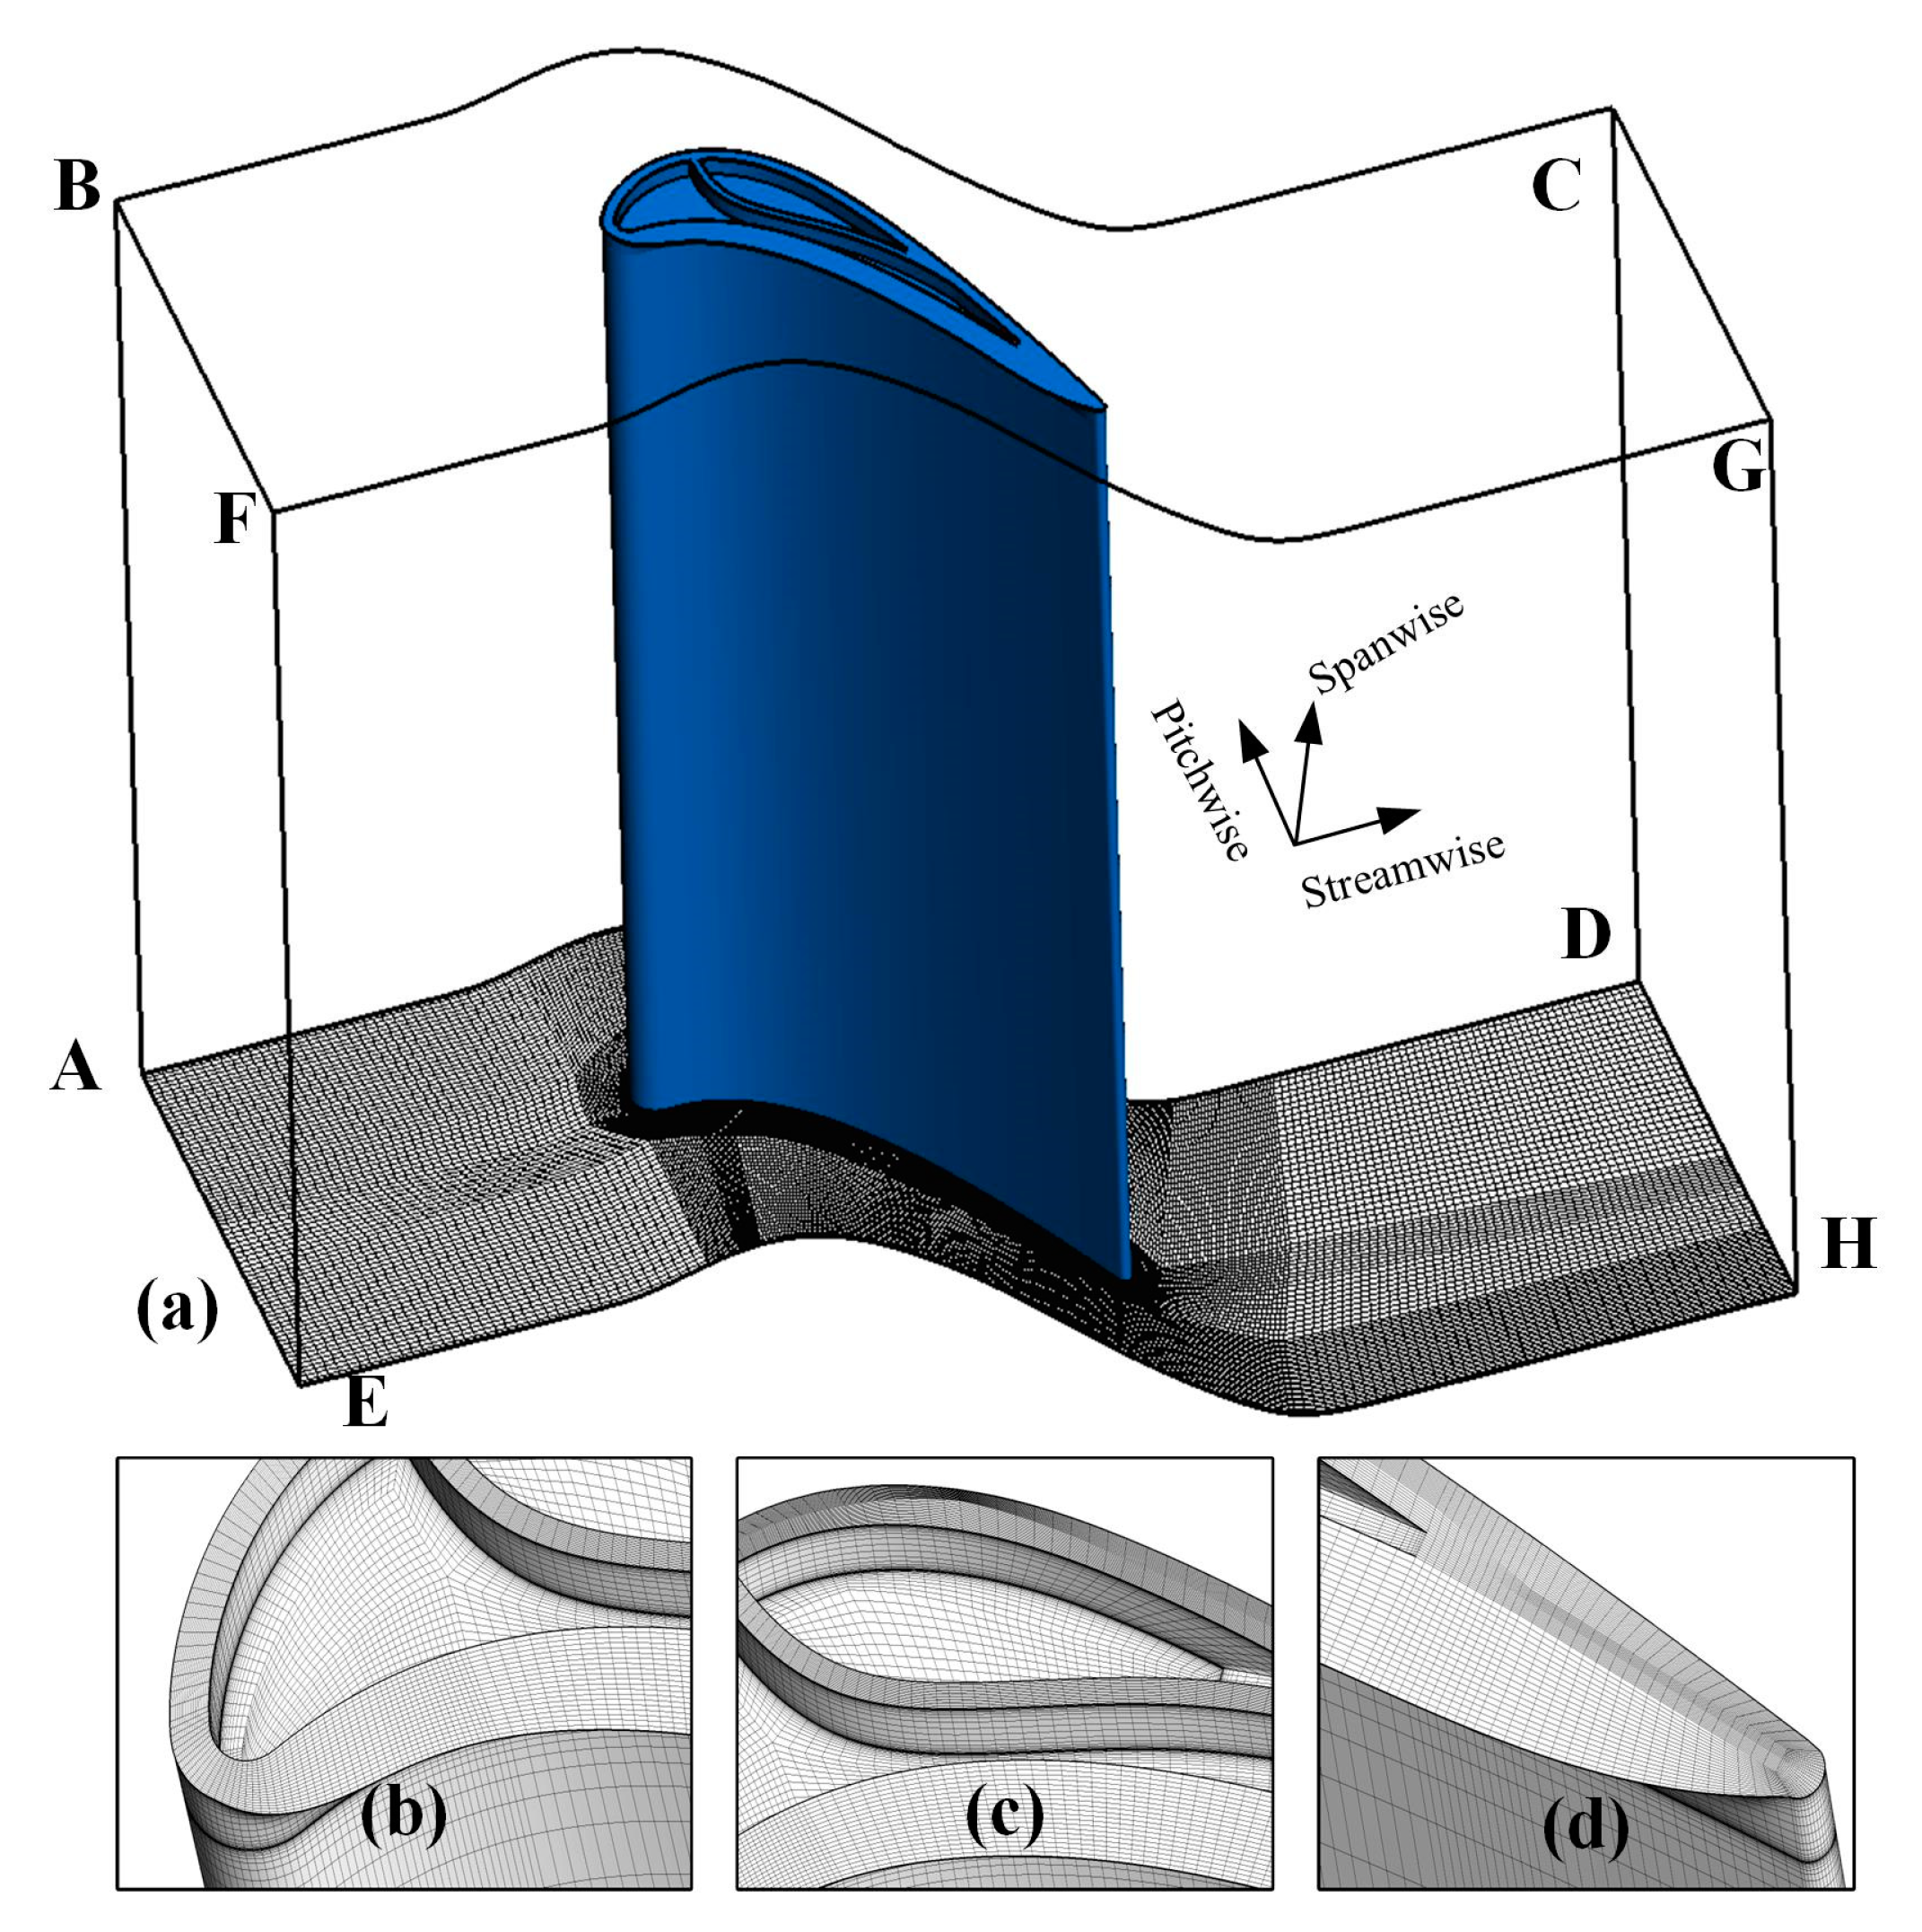
A single flow passage is taken for numerical calculation under the premise that the experimental results are pitch-wise periodic. Figure 3a gives the fluid computational domain. The inlet face ABFE is 1.5 times the chord length from the leading edge of the blade, the outlet face DCGH is twice the chord length from the trailing edge of the blade; face ABCD and face EFGH are periodic intersection faces. The computational boundary conditions are given according to the experimentally collected data: inlet surface gives the total pressure of 172 kPa, total temperature of 320 K and the velocity direction, while the outlet surface gives the static pressure of 101 kPa. The numerically calculated inlet turbulence intensity is assumed to be 5%. During the calculations, the blade is set up as a fixed no-slip wall, and likewise with the casing (face BCGF) and hub (face ADHE).
The structure mesh used for the numerical simulation is shown in Figure 3. Figure 3b–d represent the front, middle and rear mesh parts of the blade tip, respectively. The boundary layers are arranged on the wall surface of the casing, hub, blade and cavity walls. The computational mesh in the main passage is first created as a rough definition between a 2D blade-to-blade (B2B) surface then stacked spanwise to produce a 3D mesh. Figure 3a shows the mesh in the hub wall ADHE. In this B2B surface, the O4H grid structure has been adopted; main passages are arranged with the H-grid; the O-grid is used around the blade to increase the grid quality and form a boundary layer. Much more grid nodes are arranged in the clearance, inside the cavity and in the blade weak region to reflect the flow field details. Finally, convergence solving results are obtained with the residual of the continuity equation dropping below 10−7 and that of the momentum equation in all three directions that drops below 10−6.
2.2.2. CFD Validation
The verification of the mesh is performed using the grid convergence index (GCI) [16] and the mass flow-averaged total pressure coefficient in the exit measure plane is taken as the evaluation indicator, which can be calculated using the equation , where is the inlet total pressure, is the local total pressure and is the outlet pressure. A sequence of computational meshes consisting of 6.4 × 10⁶, 3.4 × 10⁶ and 1.6 × 10⁶ were used to represent three different global sizes. The detailed discretization errors are shown in Table 2. According to the values of the evaluation indexes at the three grid scales, the GCI values are all less than 1%, indicating that the grid discretization meets the requirements of numerical calculation. However, the relative error varies widely and e32 is less than 1%, so the mesh number 3.4 × 10⁶ is selected for the numerical calculation.
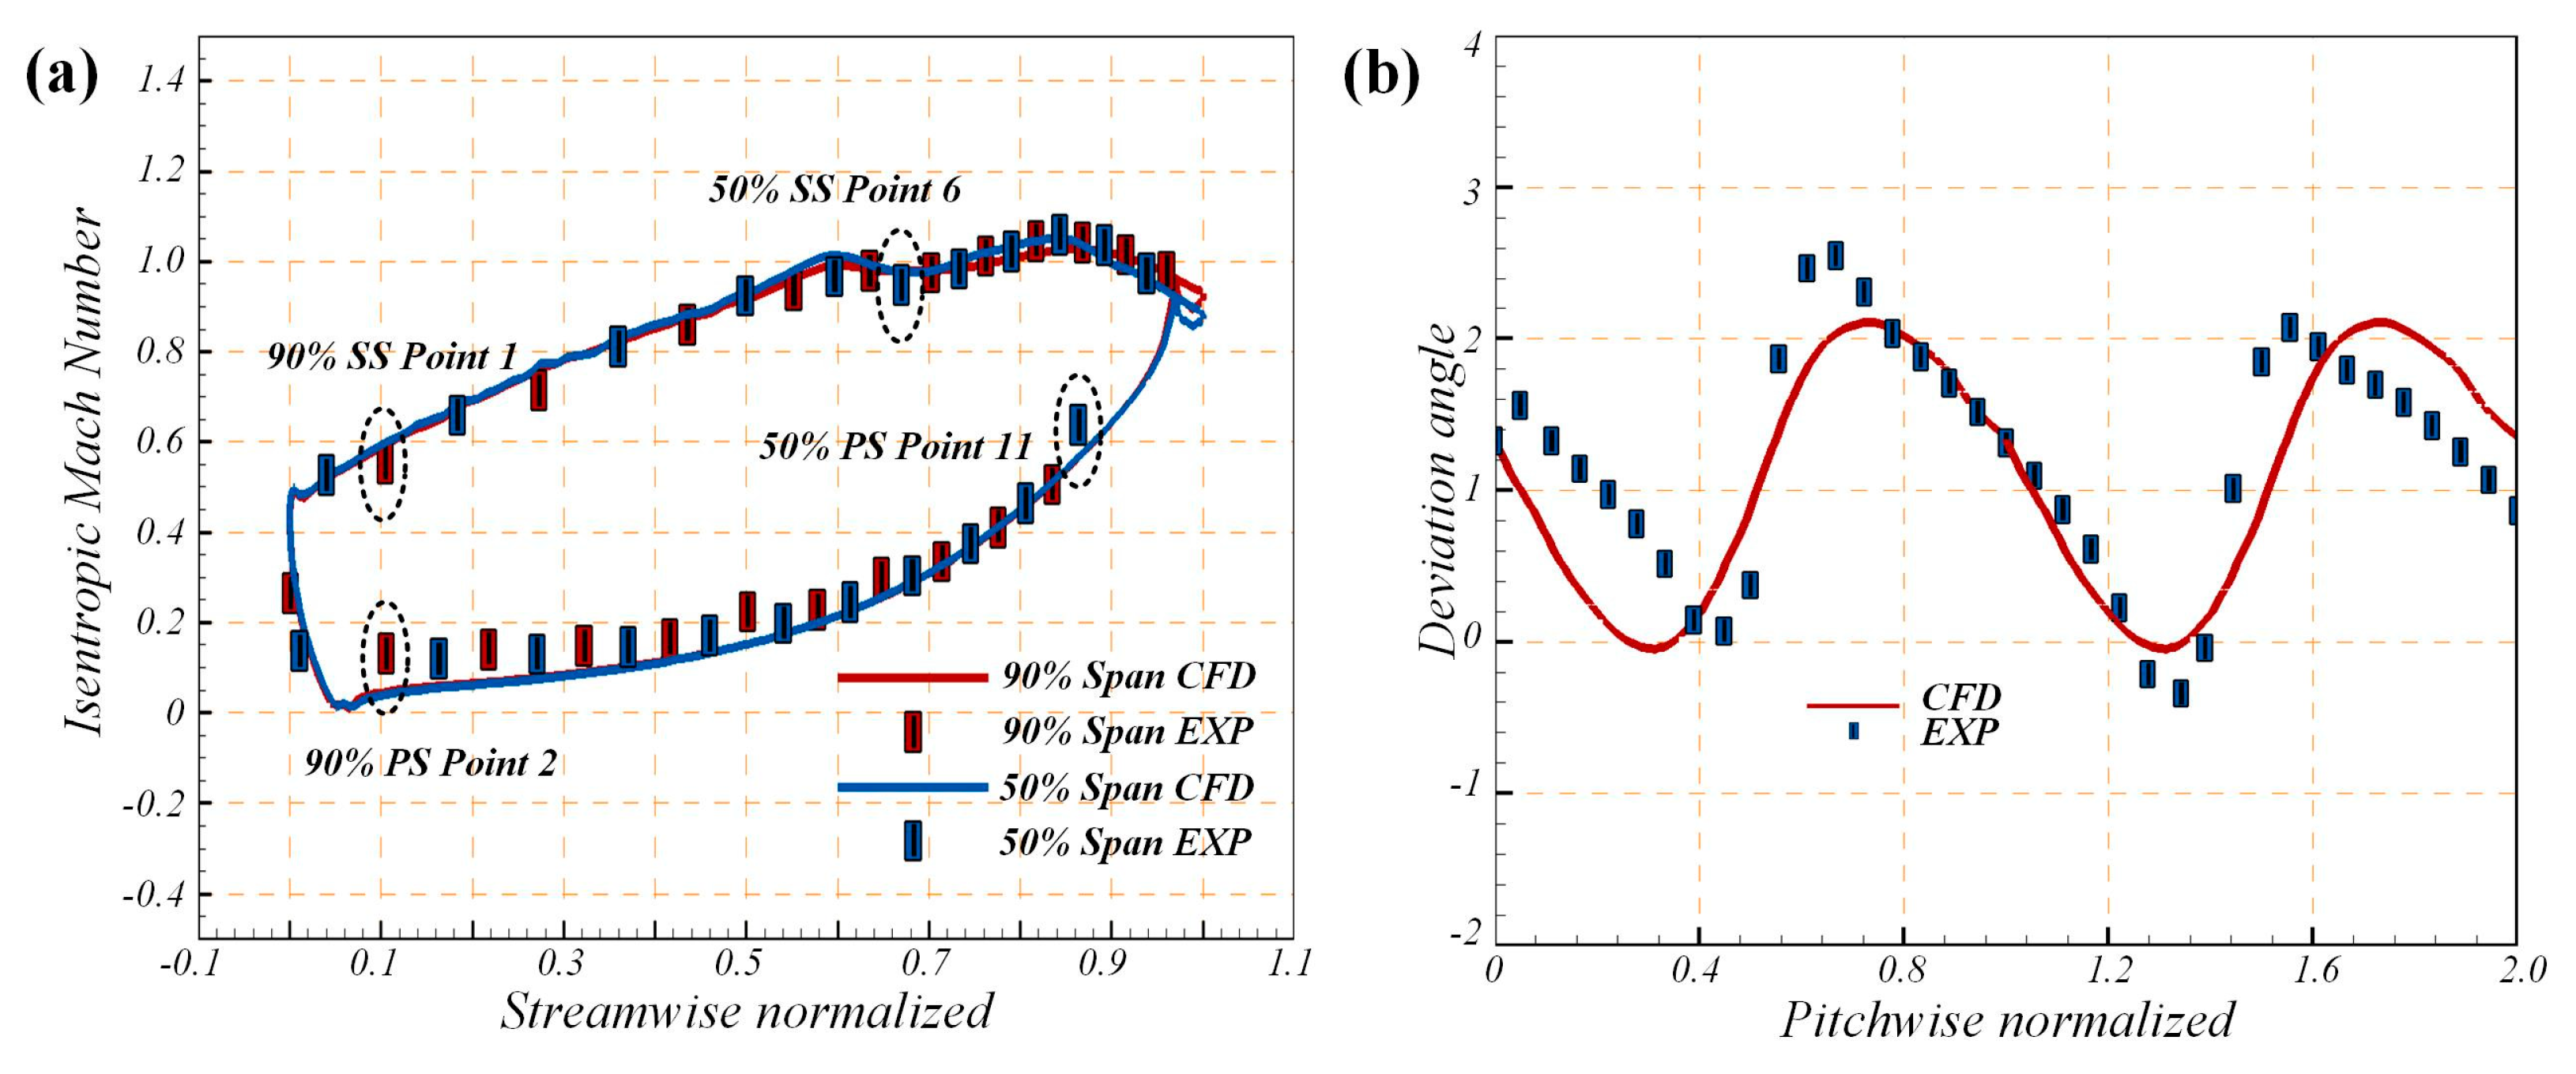
Numerical calibrations in Figure 4 are used to verify the agreement with the experimental results for the dual−cavity tip at an outlet isentropic Mach number of 0.92, a clearance size of 0.36 mm and an incidence of zero degree. Figure 4a shows the comparison results of the isentropic Mach number on the blade surface at a 50%− and 90%−spanwise position. The maximum deviation of the suction surface at 50% spanwise appears at point 6 (EXP: 0.956, CFD: 0.977) with a relative error of 2.2%. The local transonic has been generated before this point, so this error may be caused by an incomplete identification of the separation. The maximum deviation of the pressure surface at 50% spanwise appears at point 11 (EXP: 0.636, CFD: 0.573) with a relative error of 9.9%, which is due to the large curvature of the leading and trailing edges of the pressure surface and the difficulty in accurately grasping the axial position of the measure point in the pressure surface. In addition, the maximum deviation of the suction surface at 90% spanwise occurs at point 1 (EXP: 0.552, CFD: 0.595) with a relative error of 7.8%, and the maximum deviation of the pressure surface at 90% spanwise occurs at point 2 (EXP: 0.128, CFD: 0.067) with a relative error of 47.6%; this may be caused by errors in the setting angle and incidence angle changing the stagnation point position. Figure 4b shows the pitch−wise distribution of the deviation angle at the midspan position, which is the difference between the flow angle and the blade exit angle. The distribution of the deviation angle demonstrates the periodicity of the experimental results, but the numerical results differ significantly from the experiments before 0.4 times and after 1.6 times the pitch−wise. This is because the five−hole probe used in this study has a small probe head diameter and the inevitable vibration of the five-hole probe in a high-speed flow field affects the angular measurement of the probe.
3. Results and Discussion
In order to investigate the effect of the dual−cavity tip configuration on the leakage controlling, experimental and numerical results are analyzed for all working conditions. This section first analyzes the total pressure loss and vortex development process for different outlet isentropic Mach numbers, incidence angles and clearance sizes, and then analyzes the adaptability of the dual−cavity structure by comparing the dual−cavity tip configuration with the flat tip configuration. To allow analysis of the vortex structure, the Q-criterion [17] for vortex identification is introduced, and the Q value can be calculated using Equation (2), where Ω is the angular velocity tensor and S is the strain rate tensor. A larger Q represents a stronger rotational effect in the flow field.
3.1. Influence of Exit Mach Number on Tip Leakage Flow
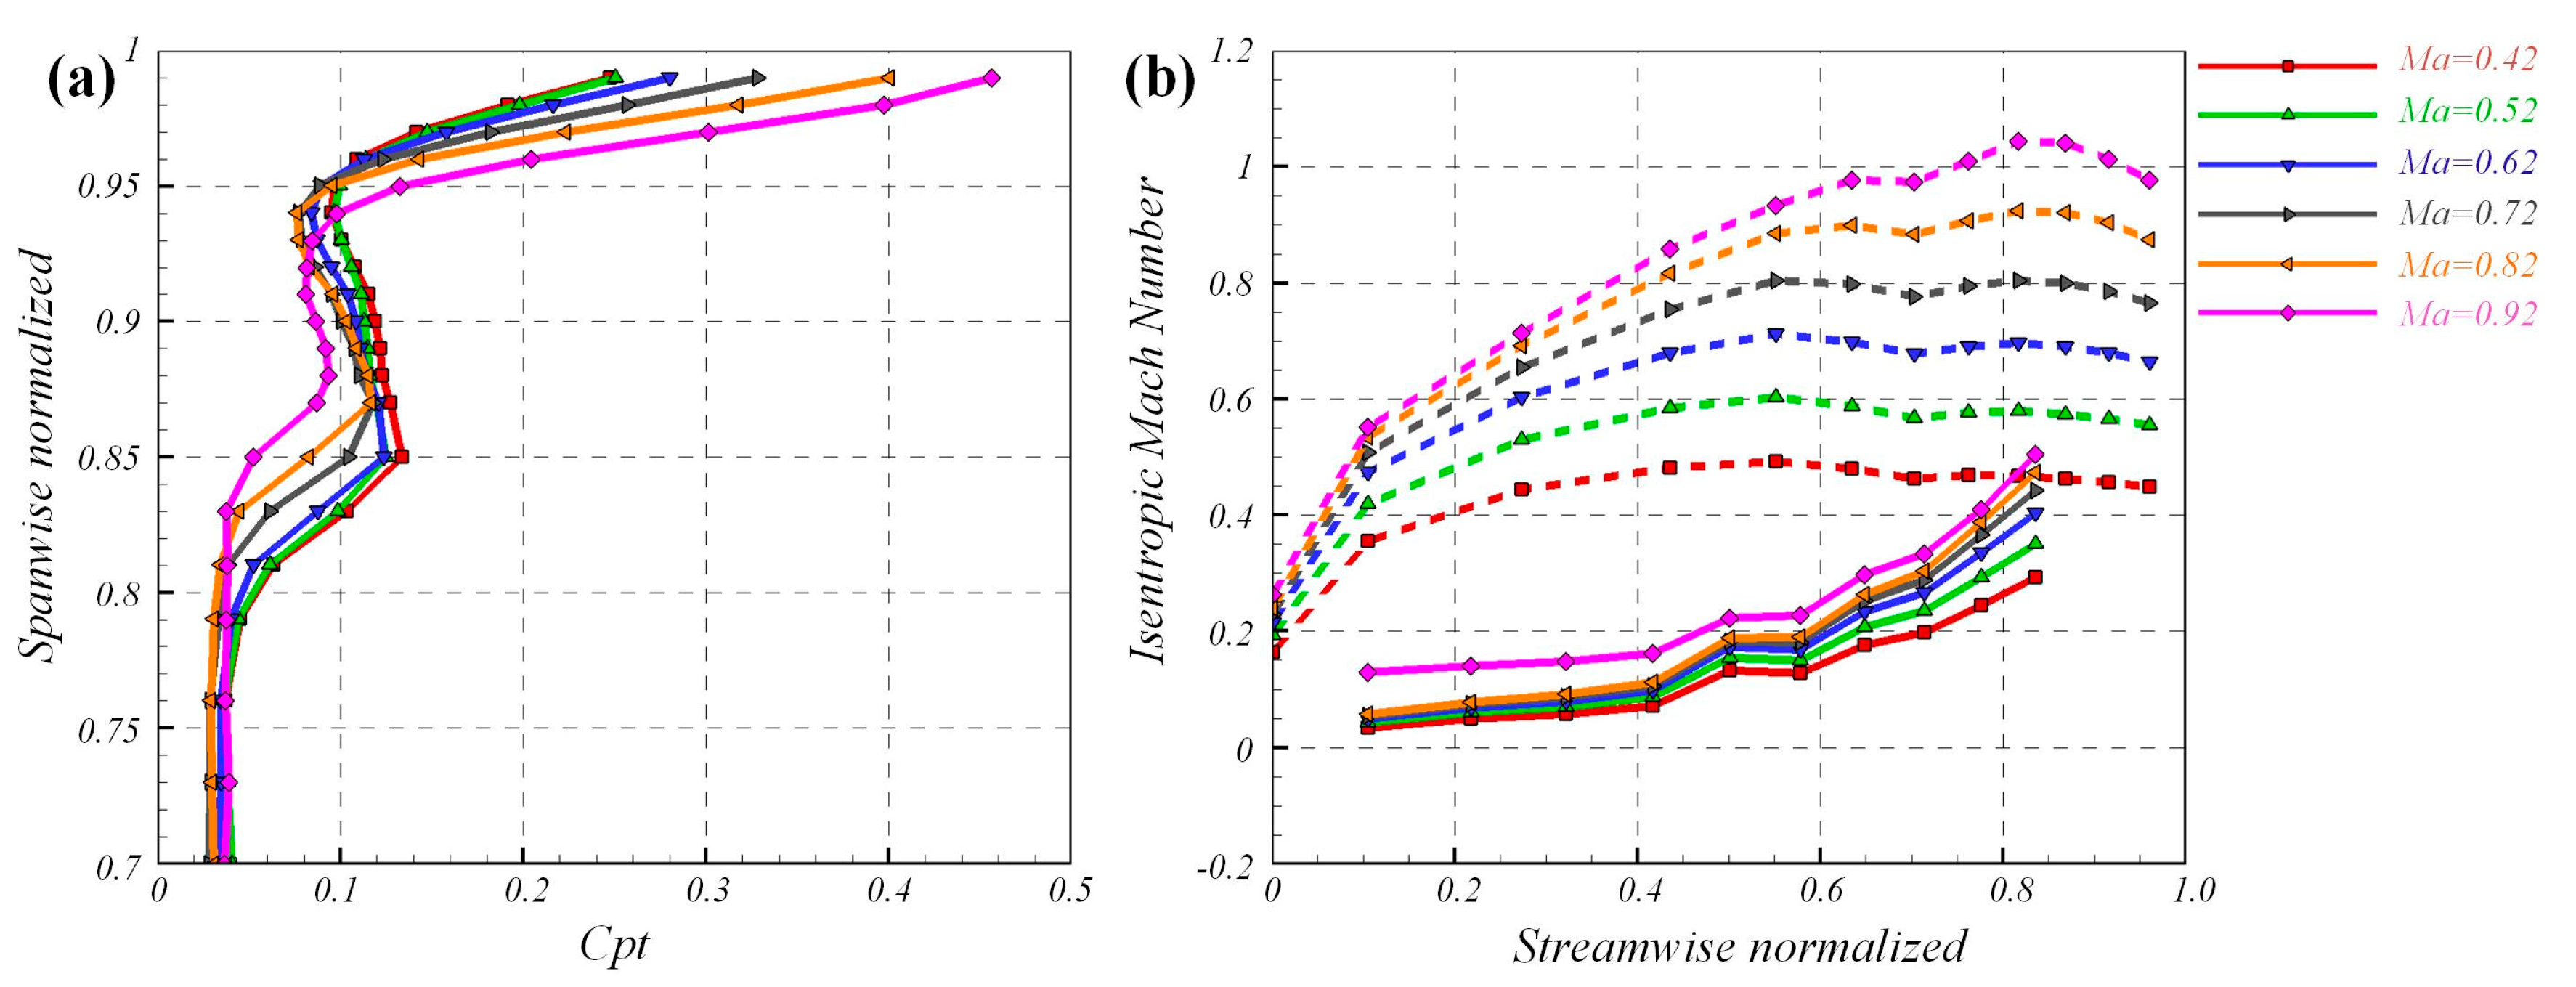
The experimental data were collected by varying the outlet isentropic Mach number under the premise of a zero degree of incidence angle and 0.36 mm clearance size, from 0.42 to 0.92. Figure 5 shows the experimental results of these working conditions. Figure 5a is the spanwise distribution of the pitch-wise averaged total pressure coefficient. The experimental acquisition starts from the midspan, and only the region near the shroud (casing) (spanwise: 0.7–1) is shown in the figure due to the small variation in the coefficient in the mainstream. The high loss region near the wall (spanwise: 0.95–1) is caused by the viscous effect, and this part is also the influence region of the leakage vortex; the influence region of the passage vortex (spanwise: 0.8–0.95) occupies a larger blade height but a smaller loss. The influence area of the leakage vortex tends to expand with the increase in the outlet isentropic Mach number, while the influence area of the passage vortex has the opposite trend. The distribution of the isentropic Mach number on the blade surface at a 90% blade span in Figure 5b shows the difference in the blade loading. The dashed line represents the suction surface, and the solid line represents the pressure surface. As the exit Mach number increases, the blade load shows an increasing trend, especially after 0.5 times the axial chord length, and the increase in Mach Number also leads to the enhancement of the tip leakage flow.
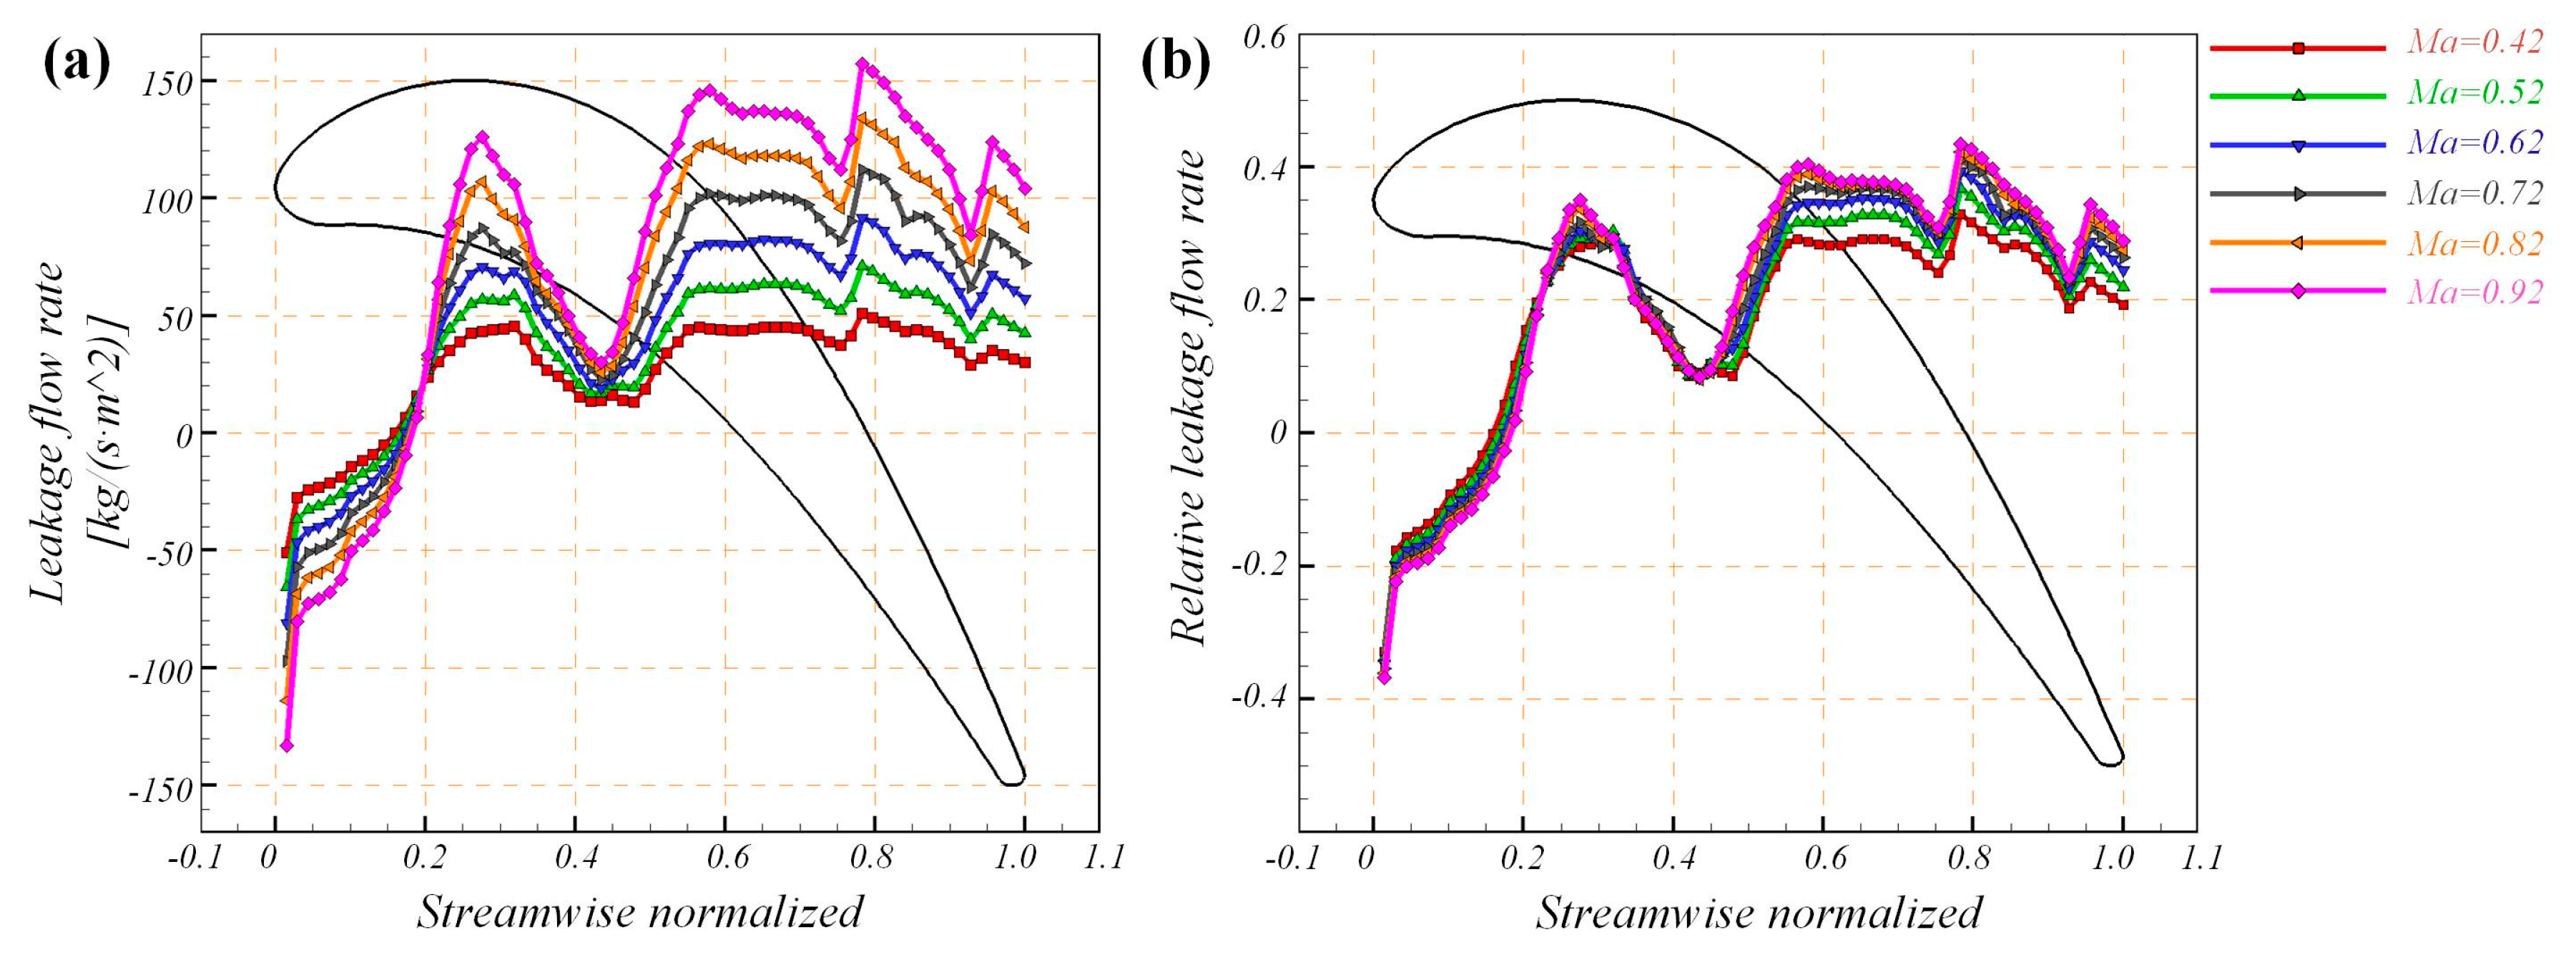
The increase in the outlet isentropic Mach number increases the pressure difference between the suction and pressure surfaces, which intensifies the leakage flow. Figure 6a shows the numerical results of the leakage flow rate distribution along the suction surface. The leakage flow is defined as the flow perpendicular to the suction surface vector, where the value less than zero represents flowing inside the tip cavity and greater than zero represents flowing out of clearance. In the zero incidence and clearance size 0.36 mm condition, the gas flows into the cavity at the position of the suction front edge and starts to flow out from the cavity at about 0.2 times the axial chord length position. As the outlet isentropic Mach number continues to increase, the variation in the leakage flow rate increases, but the overall trend remains the same. At 0.2 to 0.6 times the axial chord, the leakage flow rate decreases rapidly and then increases due to the cavity rib preventing leakage flow processes. Figure 6b shows the variation in the leakage flow rate relative to the passage flow rate. Denton [1] believes that the difference in velocity and direction between the leakage flow and the main flow is an important cause of leakage losses, similar to the jet mixing process. As the Mach number increases, both the main flow rate and the leakage flow rate increase, which results in little change in the relative value of the leakage flow, especially 0 to 0.5 times the streamwise position, where the relative leakage values are almost the same for all working Mach numbers.
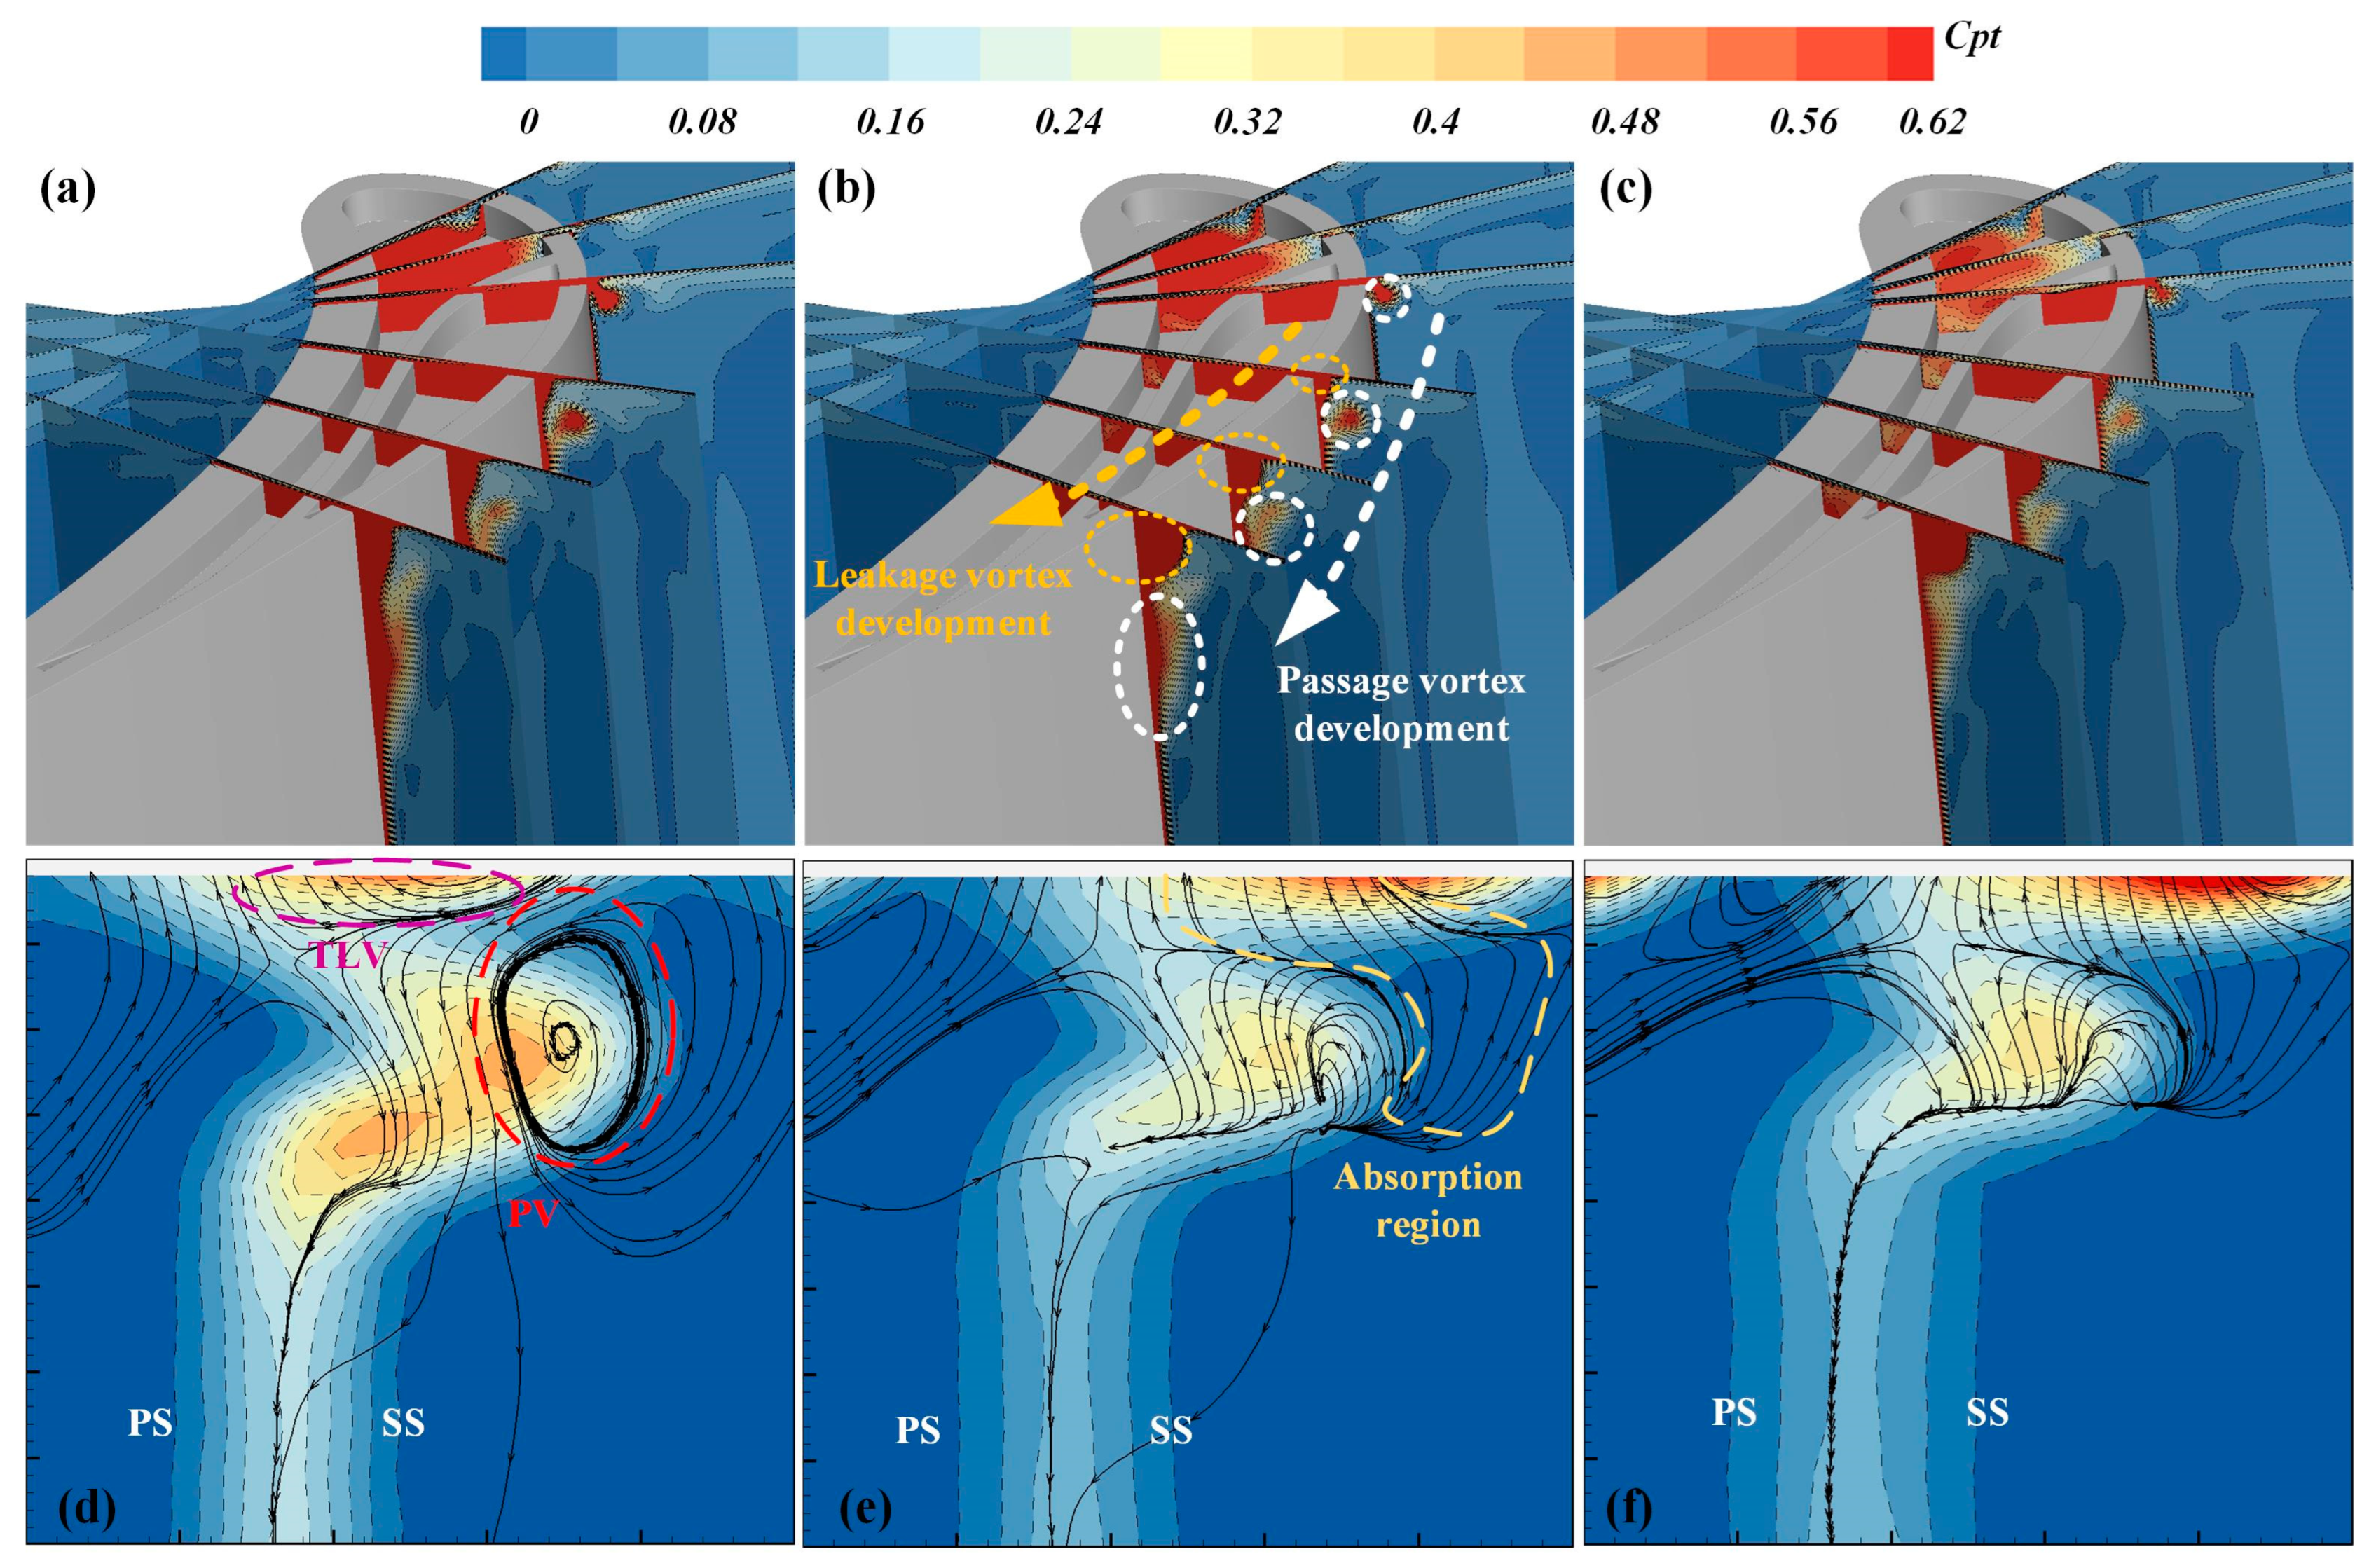
The experimental results show that with the increase in the Mach number, the leakage vortex loss gradually increases while the passage vortex loss decreases. Figure 7 shows the numerical results of the total pressure coefficient distribution at different slices in the streamwise direction and the experimental results at the outlet measure surface. The experimental results also show the secondary flow streamlines; the secondary flow differs from the mainstream flow velocity direction, which can be used to demonstrate the structure of the tip leakage vortices (TLV) and passage vortices (PV). The numerically calculated development process is shown in Figure 7a–c: the passage vortex is generated near the shroud and develops along the blade in a spanwise direction, which eventually forms a high loss region attached to the blade surface; the leakage vortex is generated in the middle of the chord length after the airflow out of the clearance and receives the wall shear stress to form a high loss region in the shroud corner area. With the increase in the Mach number, the passage vortex intensity decreases and moves to the corner area, while the leakage vortex develops and grows. Figure 7d–f show the results of the five-hole probe data in the measure surface. In the same trend as the numerical calculation results, the increase in the Mach number is accompanied by the weakening of the passage vortex and the strengthening of the leakage vortex; the secondary flow streamlines are marked in Figure 7d with the region of the tip leakage vortex and passage vortex. When the Mach number is 0.42, the passage vortex has a completed rotating structure, but as the Mach number increases, the leakage vortex shows a tendency to absorb the low energy fluid around, and the development of the passage vortex is affected. The experimental and numerical results show that the passage vortex moves to the tip along the blade span with the increase in the Mach Number, and the weakened strength is the reason for receiving the leakage flow absorption; the development process of a gradually strong leakage vortex is also the process of the gradual destruction of the passage vortex.
3.2. Influence of Incidence Angle on Tip Leakage Flow
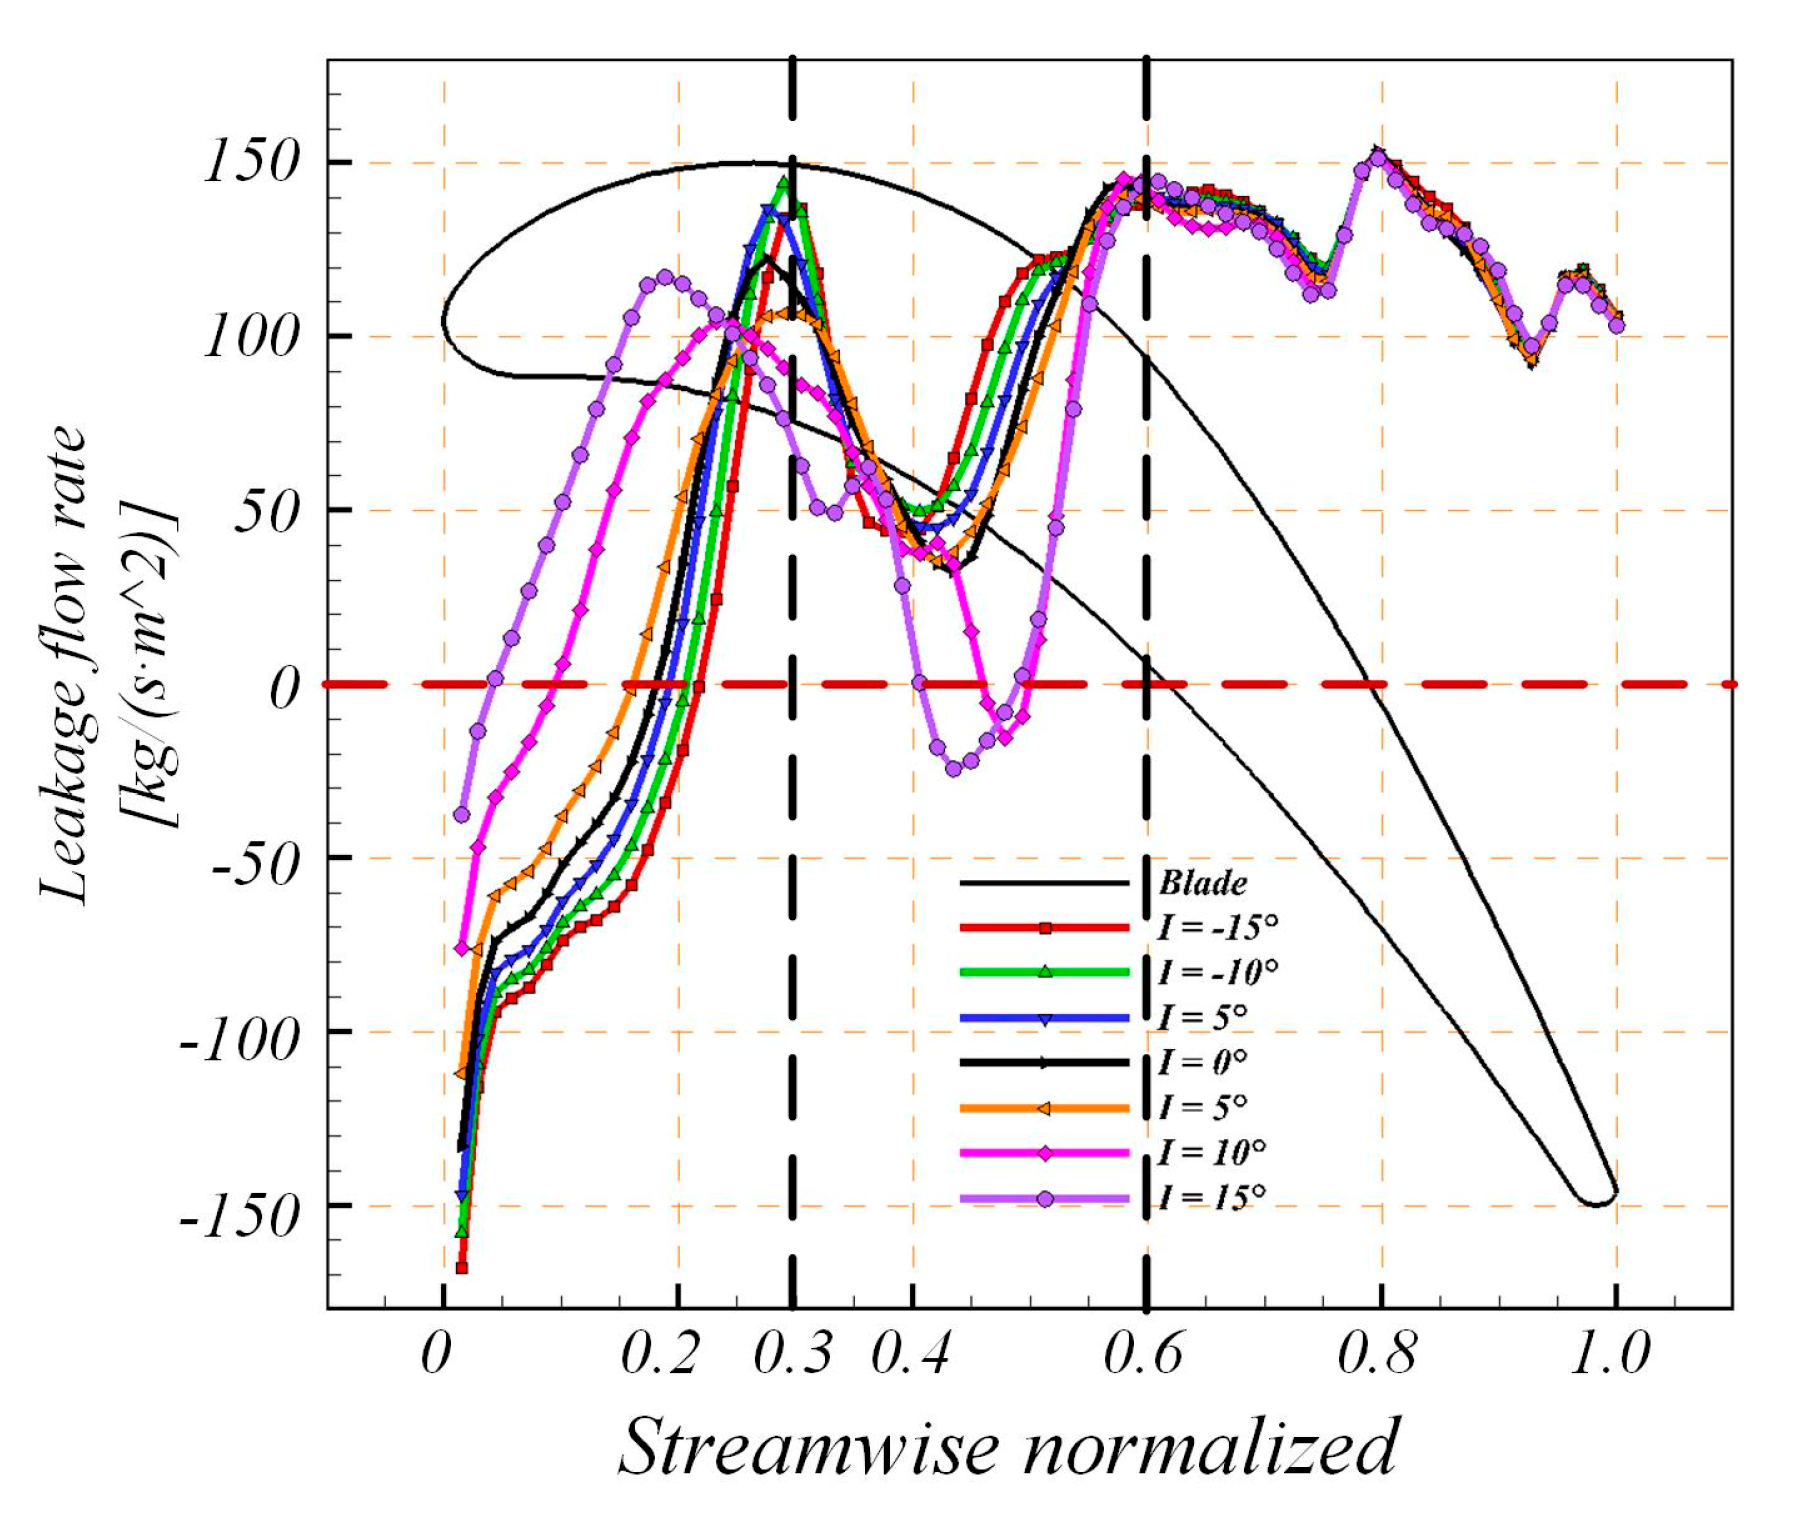
Figure 8 gives the leakage flow rate distribution under different incidence conditions. The red dashed line divided the inflow and the outflow of the tip cavity. The black dashed line divides the leakage flow distribution into three streamwise positions with different changing trends:
In the range of 0–0.3 times the streamwise position, the tip leakage flow changes from the inflow state to the outflow state, and the incidence angle changes the starting position of flowing out from the cavity; it is about 0.2 times the streamwise position at −15° incidence, and the position is greatly advanced when it comes to 15°. In this region, the leakage flow increases continuously as the incidence angle moves to a positive value.
In the middle of the blade passage (within the range of 0.3–0.6 times streamwise), the cavity rib serves to reduce the leakage flow rate. In all incidence conditions, the leakage flow rate decreases and then rapidly rises. It is worth noting that when the incoming flow keeps moving to the positive incidence angles, especially at 10° and 15° conditions, it even flows inside the cavity; this indicates a significant barrier for the leakage flow processing.
In addition, it has been found that the leakage flow at the end of the blade passage (0.6–1 times position) was almost unchanged, which indicates that the influence of the inlet incoming flow direction on the leakage flow cannot cover the whole flow path.
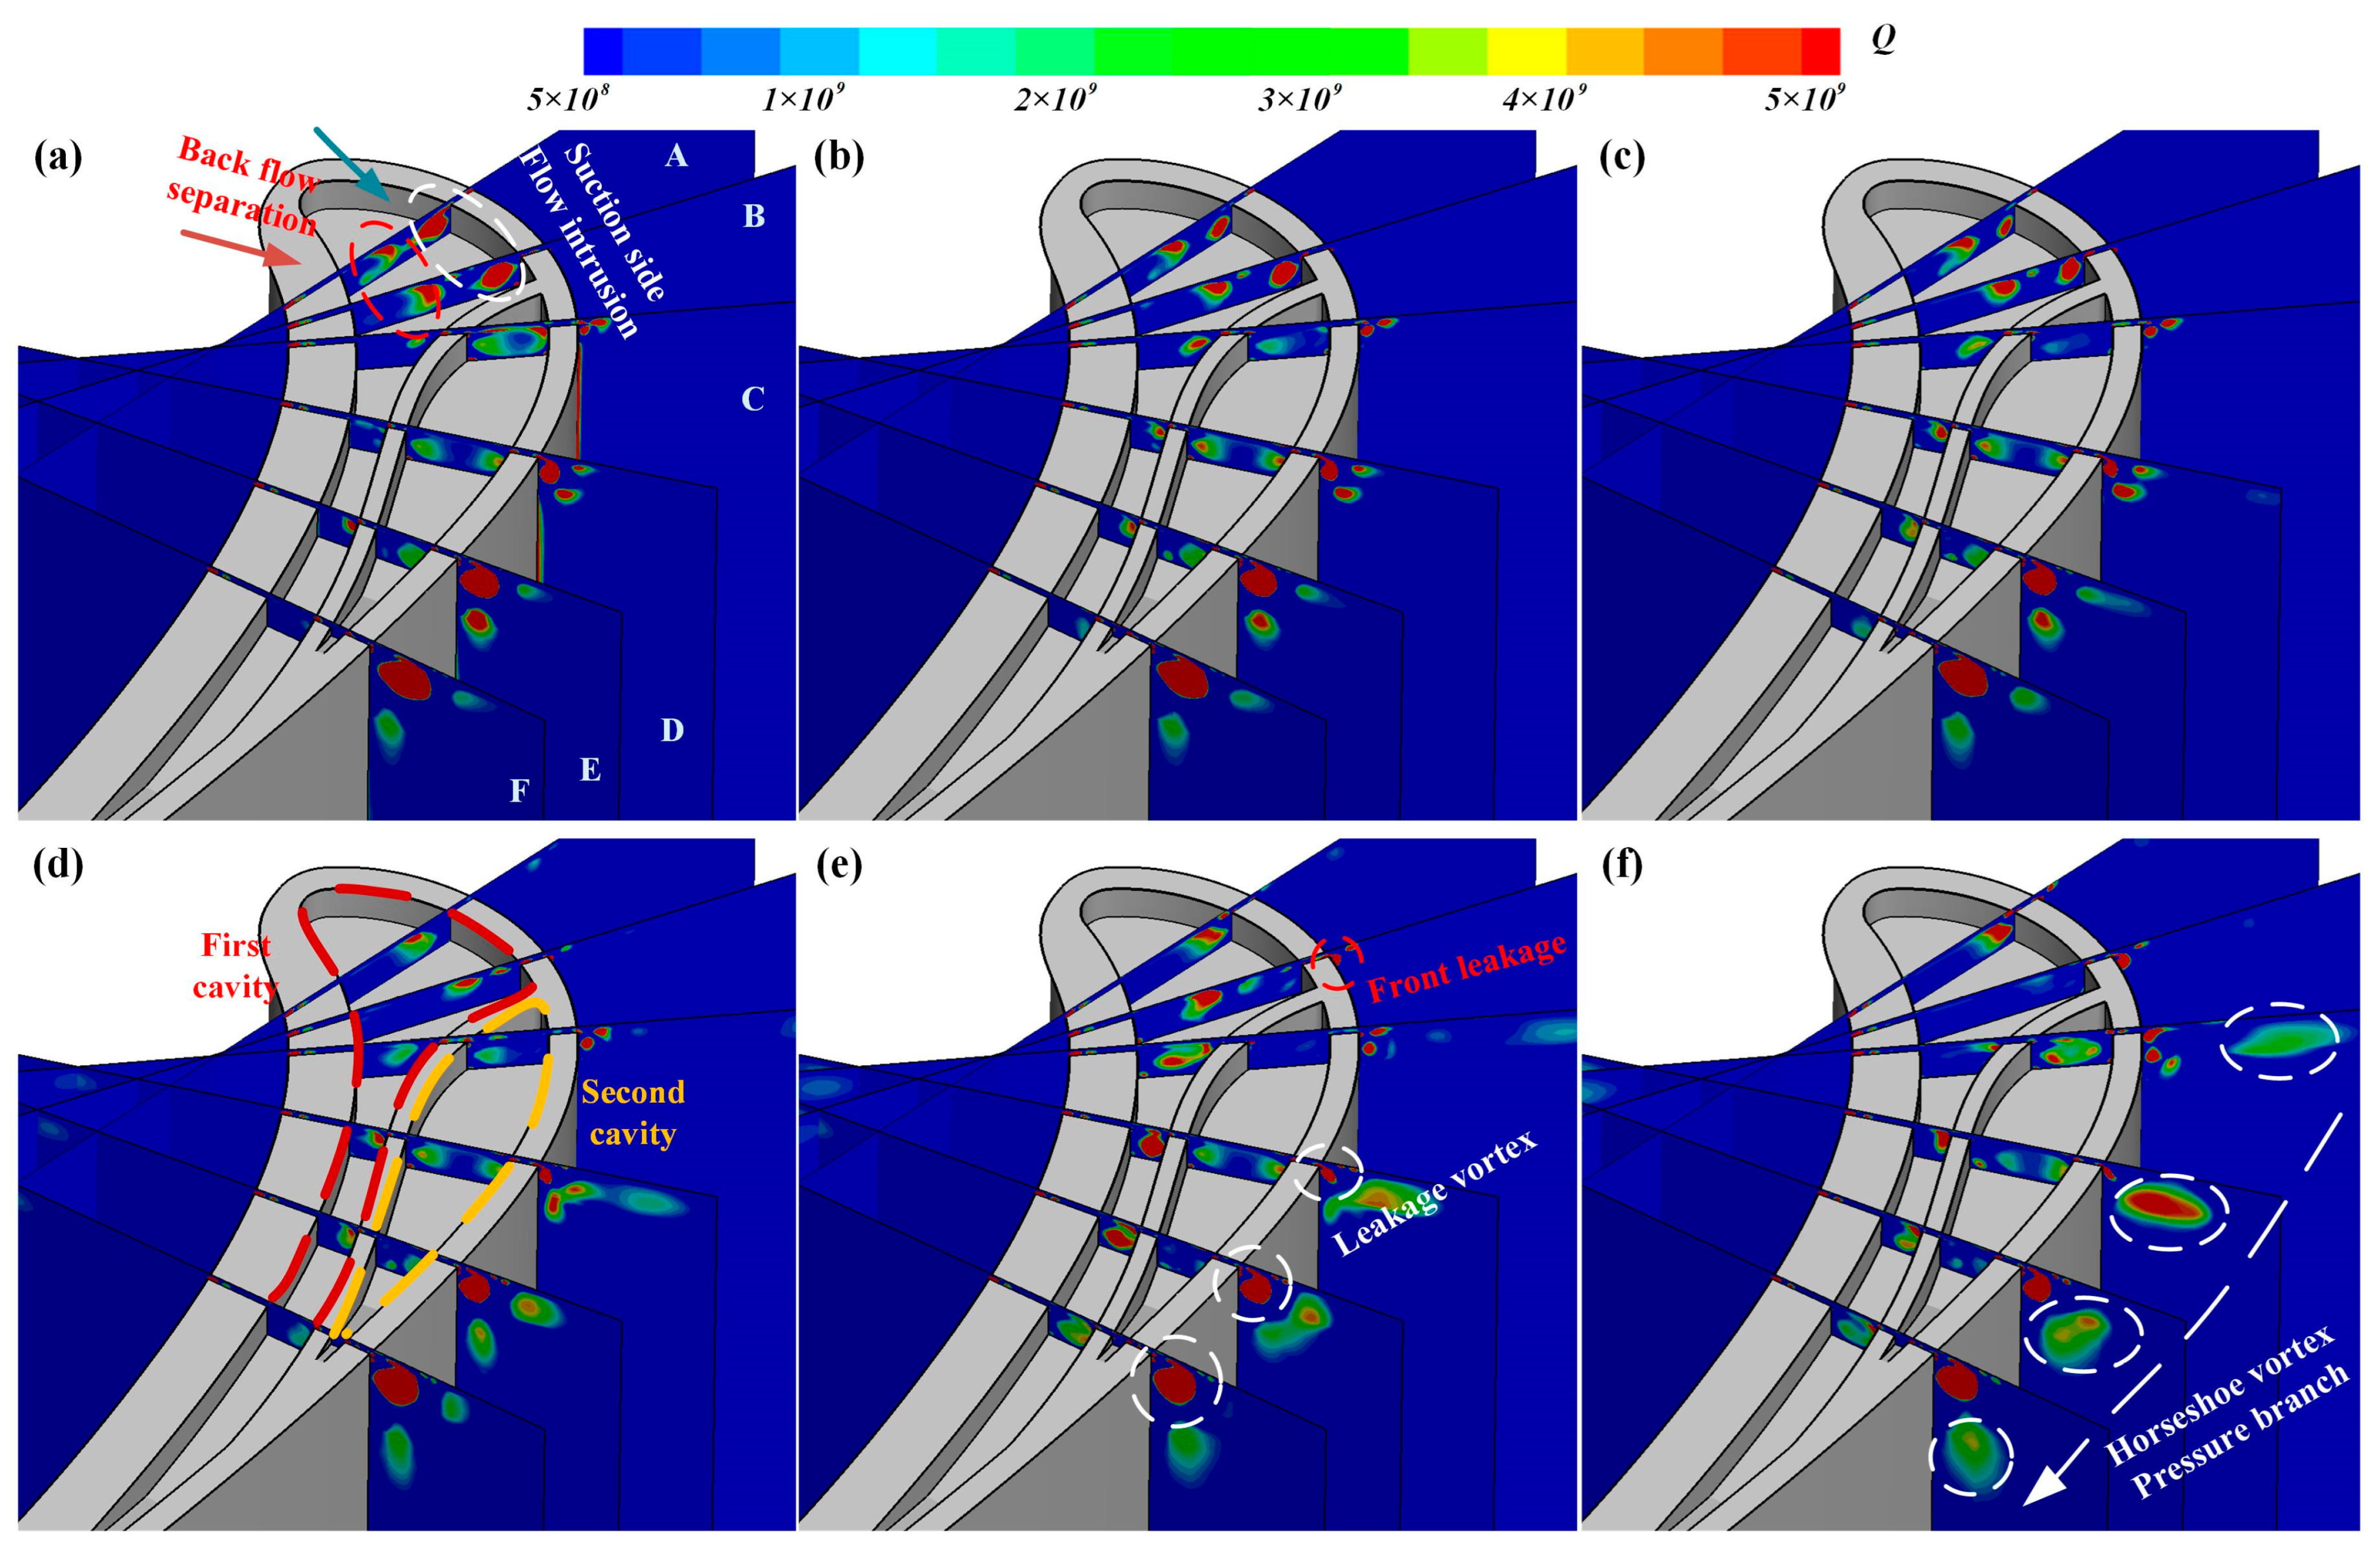
As the incidence changes from negative to positive, the leakage flow rate maintains a similar trend before the 5°; a larger difference is shown in Figure 8 for the 10° and 15° conditions, which occurs before the 0.6 times streamwise position especially. Figure 9 shows the distribution of the Q-criterion for six streamwise slices (A–F in Figure 9a) at different incidence conditions, with those slices perpendicular to the streamline to accurately demonstrate the scale and structure of the vortex. Figure 9a–c show the numerical results for the negative incidence conditions, which are −15°, −10° and −5°, respectively. In the negative incidence angle state, there are two vortex structures inside the cavity on slice A and slice B, the backflow separation formed by the gas flowing from the pressure surface and the intrusion flow from the suction surface. These two parts meet at the front of the tip cavity and impede the leakage flow from the leading edge. As the incoming flow moves towards the positive angle (Figure 9d–f), the inside cavity vortex formed by the suction surface intrusion gradually disappears and finally goes missing. Without the obstructing effect of the intrusion flow from the suction surface, the leakage flow at the front part of the blade tip increases, especially at 10° and 15°, where slice B and slice C already form small leakage vortices. As can be seen from the Q-criterion at each condition, the leakage flow inside the cavity is influenced by the cavity rib at slice C, D, E and F. Backflow is generated inside both the first cavity and the second cavity in these slices, which causes a reduction in the leakage flow rate at the middle streamwise position (the first and second cavities are marked in Figure 9d). It is worth noting that as the inlet flow moves toward the positive incidence condition, the pressure branch of the horseshoe vortex inside the passage grows and gradually affects the development of the leakage vortex. In 10° and 15 ° flow conditions, slice B has already formed a small leakage vortex, but as the horseshoe vortex pressure branch impacts on the suction surface and has a strong energy, it causes the air to flow back into the clearance area in Figure 8 and the small leakage vortex is shrunk on slice C. When the pressure branch of the horseshoe vortex becomes the passage vortex and gradually moves along the blade span, the fluid leaking from the middle of the blade forms a new leakage vortex and rapidly grows. This can be obtained by comparing the vortex size of slice D at different incidence angles. This is also the reason why the leakage flow rate is negative in the middle section for the two positive angle conditions in Figure 8.
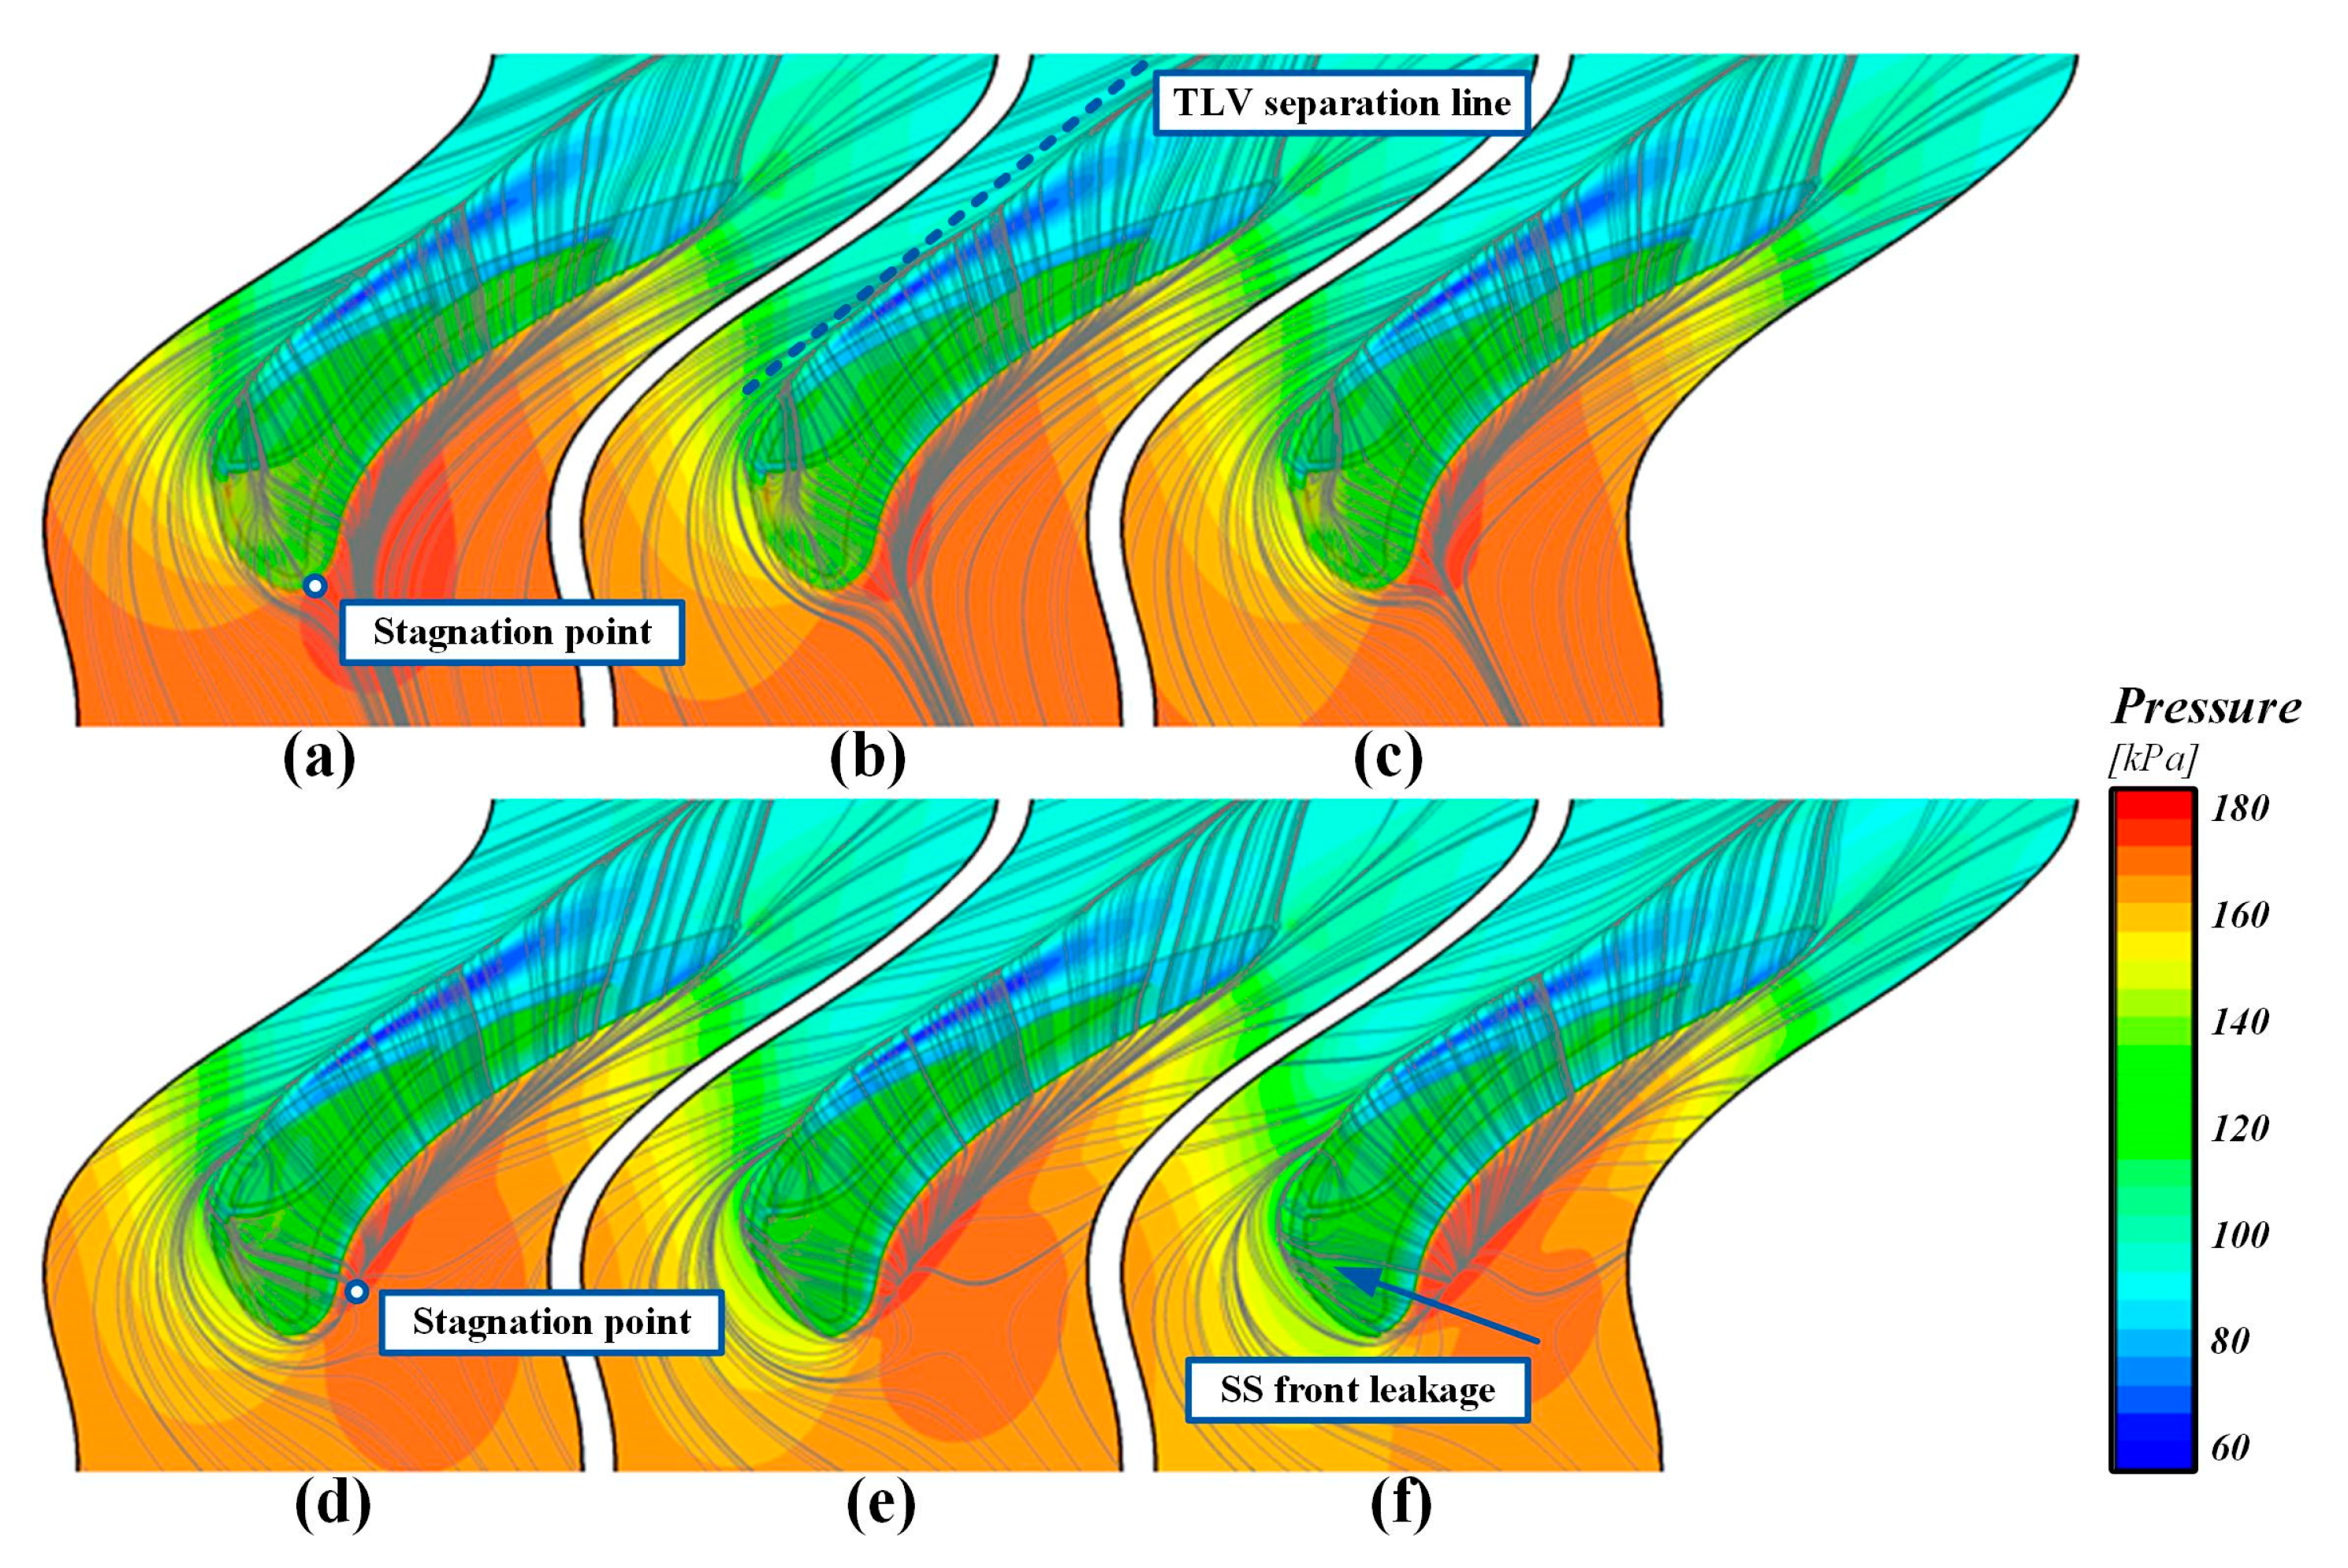
Figure 10 illustrates the pressure and streamline distribution in the middle of the clearance. During the incidence angle change from negative to positive, the stagnation point of the airflow keeps moving towards the pressure surface. The stagnation region at the leading edge of the blade also moves downstream along the pressure surface. The separation lines of the tip leakage vortex are marked in Figure 10b. In the negative angle state, the fluids entering the clearance from the leading edge of the suction surface are blocked by the cavity split rib, and they cross the first cavity into the second cavity before exiting from the middle and rear of the suction surface. The positive incidence state produces a flow that leaks from the front edge of the suction surface (SS). However, the fluid leaking from the front edge of the suction surface does not move away from the blade; it follows the horseshoe vortex suction branch and turns back, finally impacting the blade.
3.3. Influence of Clearance Size on Tip Leakage Flow
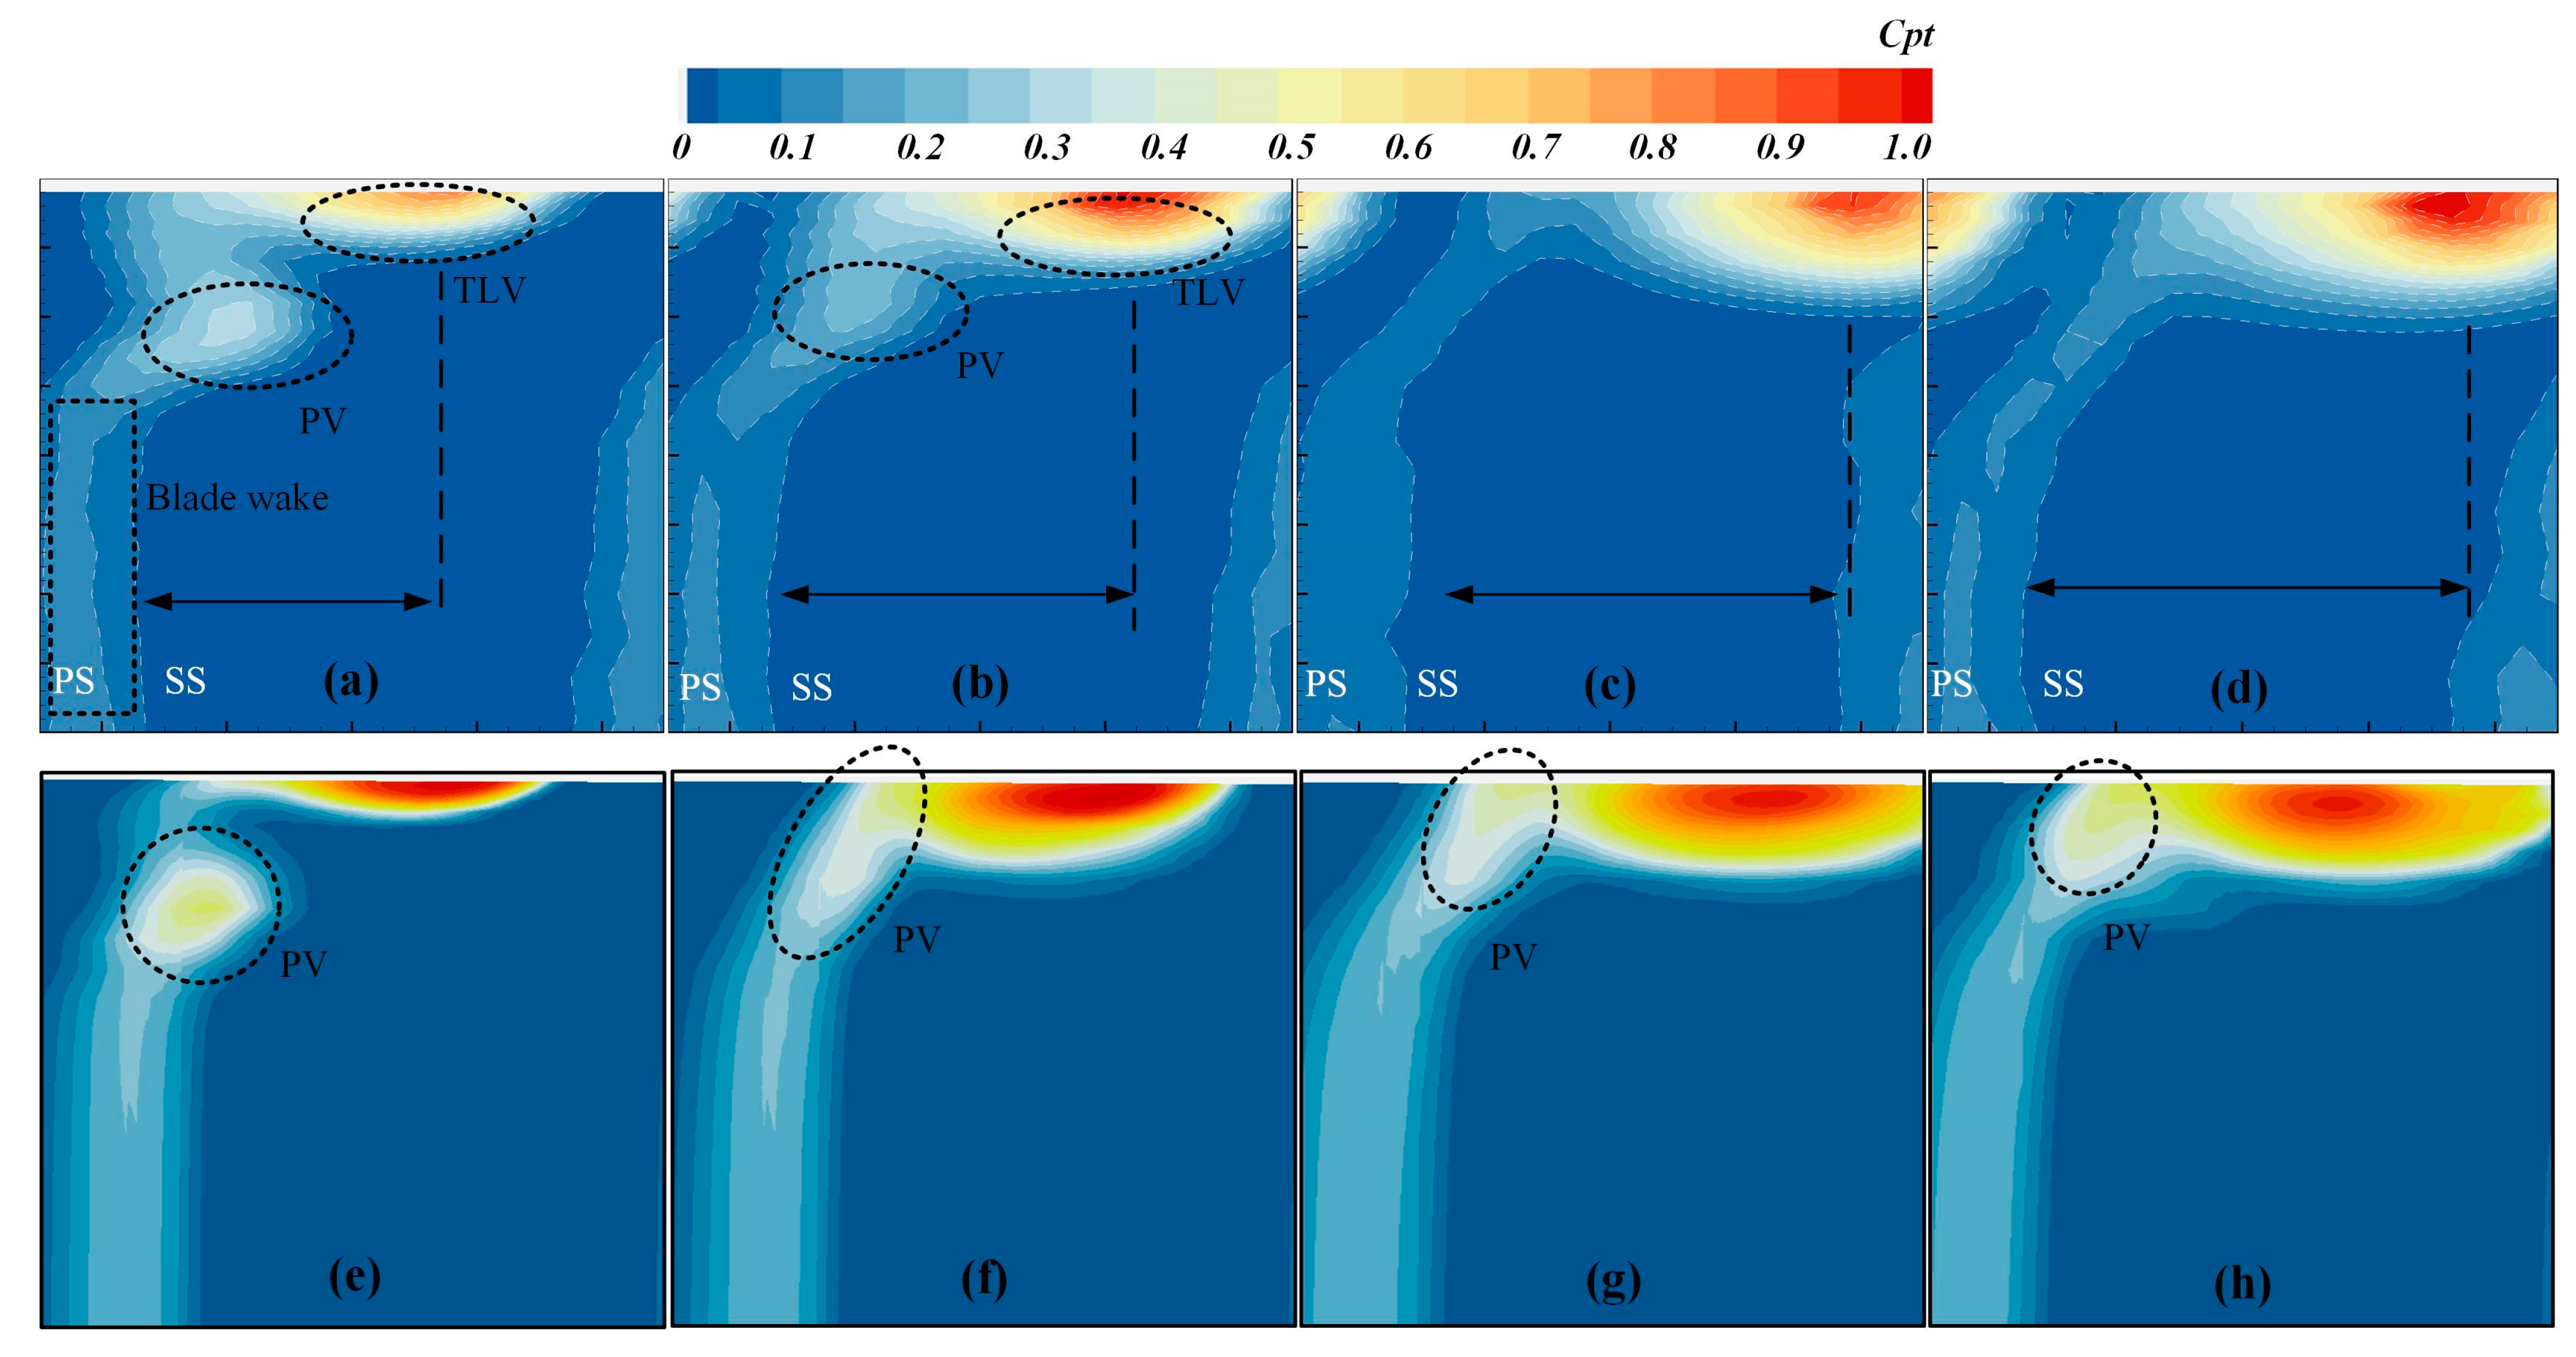
The experimental investigation with different clearance sizes has been conducted at an outlet isentropic Mach number of 0.92 and an incidence angle of zero degrees. These four different clearance sizes of 0.36 mm, 0.8 mm, 1.1 mm and 1.4 mm correspond to blade spans ranging from 0.36% to 1.4%, respectively. Figure 11a–d show the distribution of the total pressure coefficient collected via the five-hole probe on the measurement surface. The increasing of the clearance size improves the through-flow area, which provides a good condition for the generation and development of the leakage vortex. Under 0.36 mm clearance sizes condition, there is a fully developed passage vortex structure in the flow field; when the clearance size increases to 0.8 mm, the passage vortex has moved towards the tip via the absorption of the leakage flow, causing the enhancement of the leakage vortices and the weakening of the passage vortices; when the gap size is 1.1 mm and 1.4 mm, there is no passage vortex structure in the measurement surface, and the leakage flow losses become very large. As the clearance size increases, the leakage vortex continues to absorb surrounding low-energy fluids and to develop and grow; at the same time, the vortex core of it continues to move along the shroud wall in the direction away from the blade wake. This all stems from the greater energy carried by the leaking fluid and the stronger shearing action against the shroud wall. Figure 11e–h show the CFD simulation results of these four clearance sizes. The numerical calculation has the same vortex structure and scale as the experimental results. As the clearance size increases, the absorption effect of the leakage vortex on the passage vortex tends to become obvious.
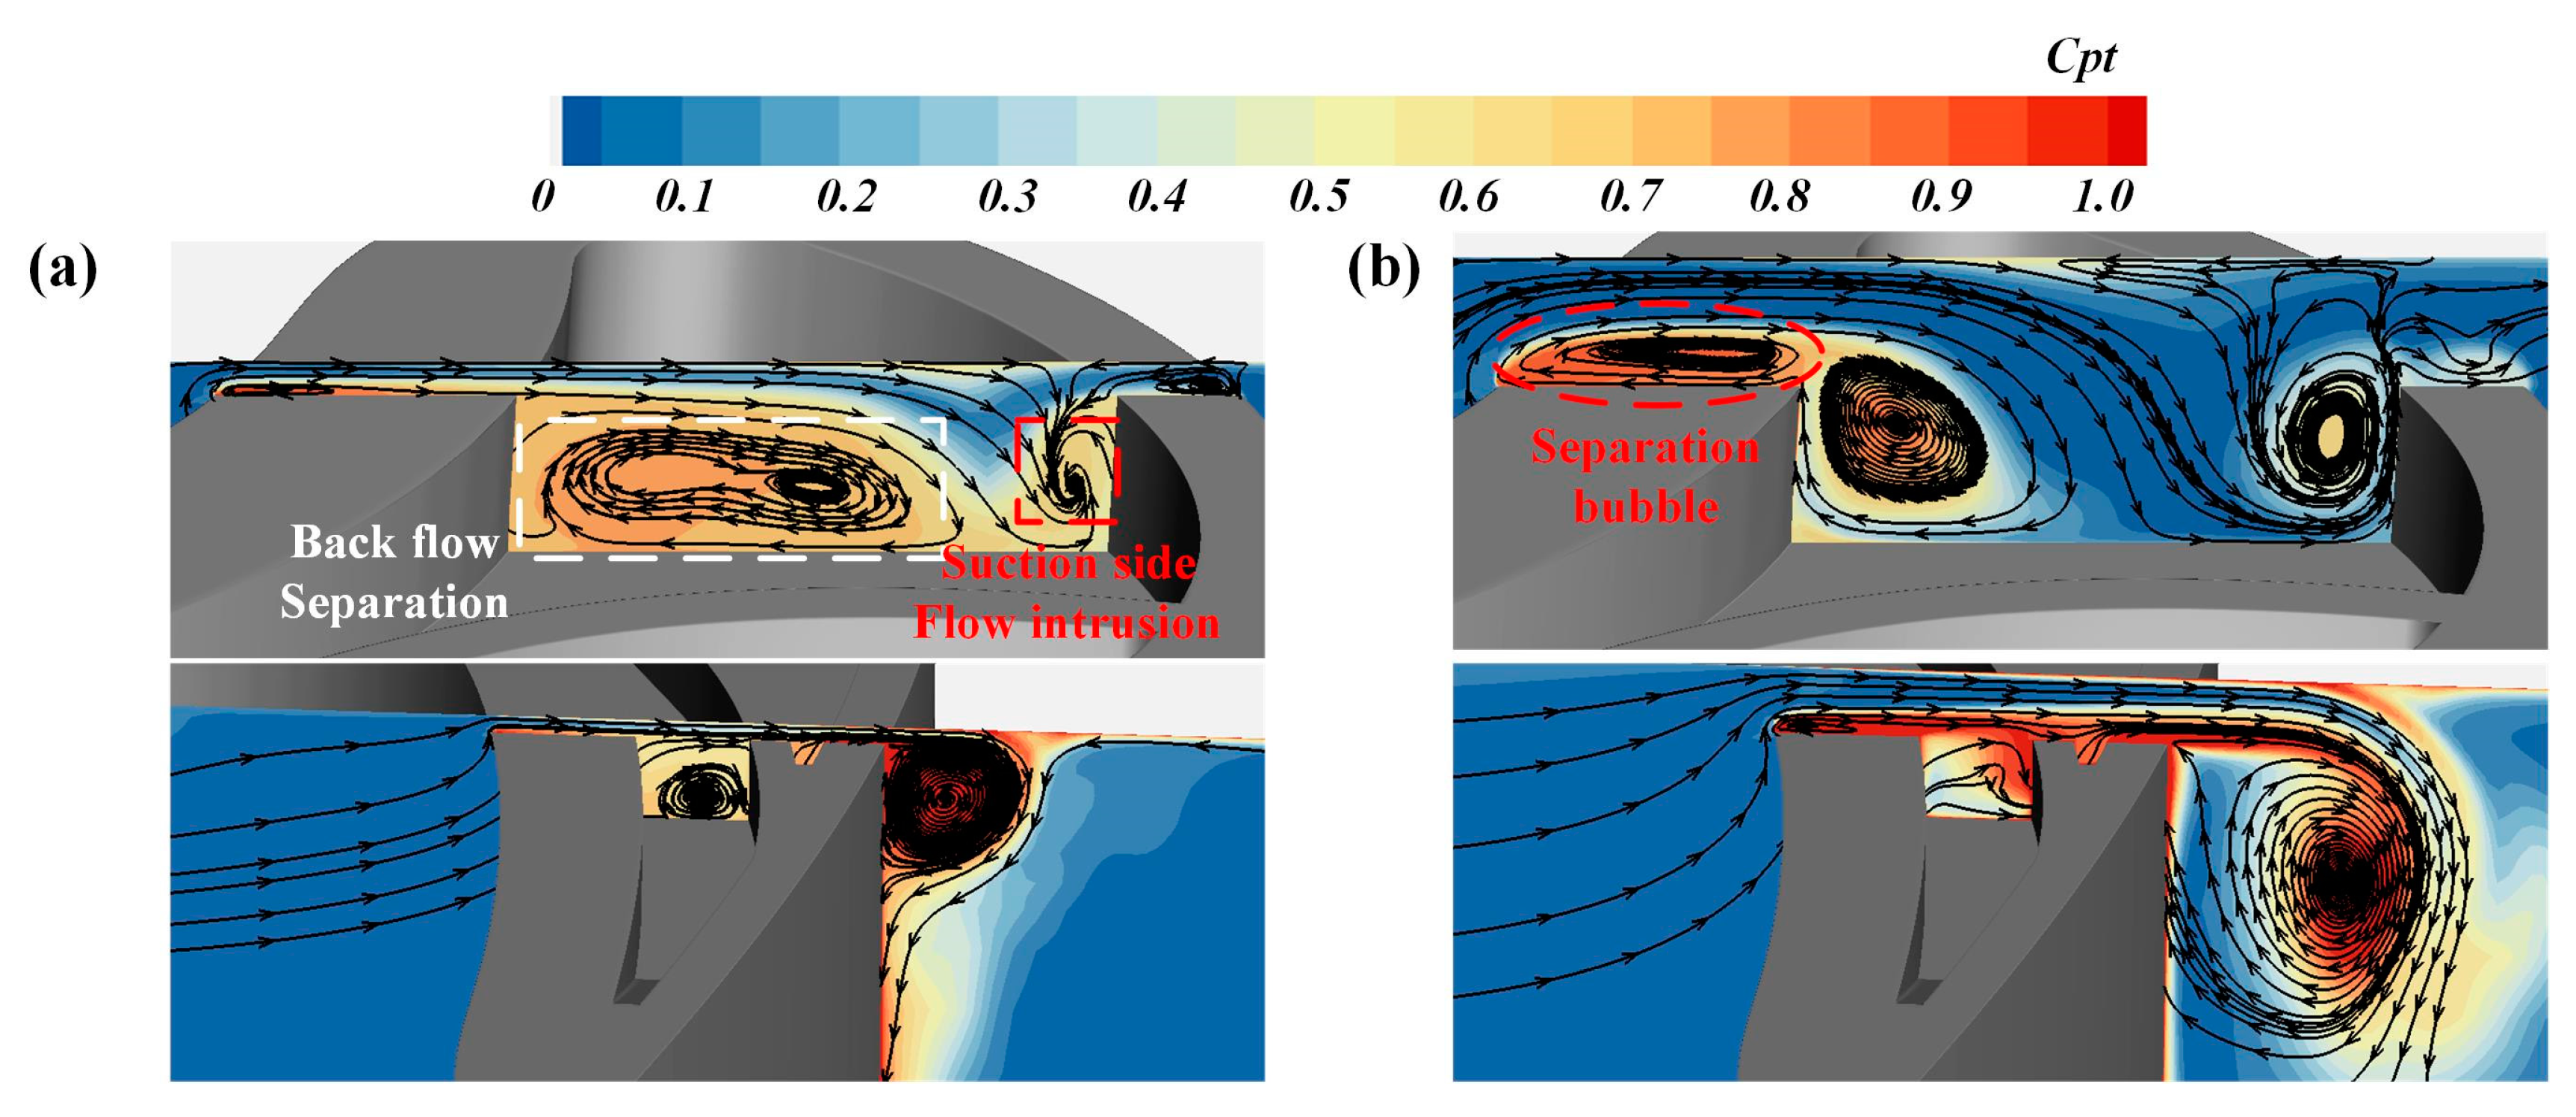
More detailed than the experimental results, the numerical results can reflect the whole domain flow states for the dual−cavity tip. Figure 12 shows the two-dimensional flow trajectory distribution at two different flow streamwise slices (corresponding to the front and back of the tip cavity) for the small clearance size (0.36 mm) and large clearance size (1.4 mm), with the total pressure coefficient in the background.
In the front position: gas flows inside the cavity from both the suction and pressure sides under the small clearance size, and the cavity interior presents a larger backflow separation region and suction intrusion region; under the large clearance state, the enhanced intrusion flow at the suction surface makes the backflow separation region significantly weakened. Two vortices inside the cavity moving along the squealer wall. According to the flow trajectory analysis, a part of the vortex formed by the suction surface intrusion flow is used to prevent the incoming flow from the pressure surface, but some of it flows out from the suction surface due to the large clearance size.
At the second streamwise location, the increase in the clearance size brings an increase in the leakage vortex. The gas outflow from the suction side is continuously sucked by the formed leakage vortex, resulting in large viscous dissipation losses. A vortex structure is still evident in the small clearance conditions inside the cavity because the clearance size limitation causes a portion of the fluid to remain inside the cavity and to develop along the split rib and the suction side squealer.
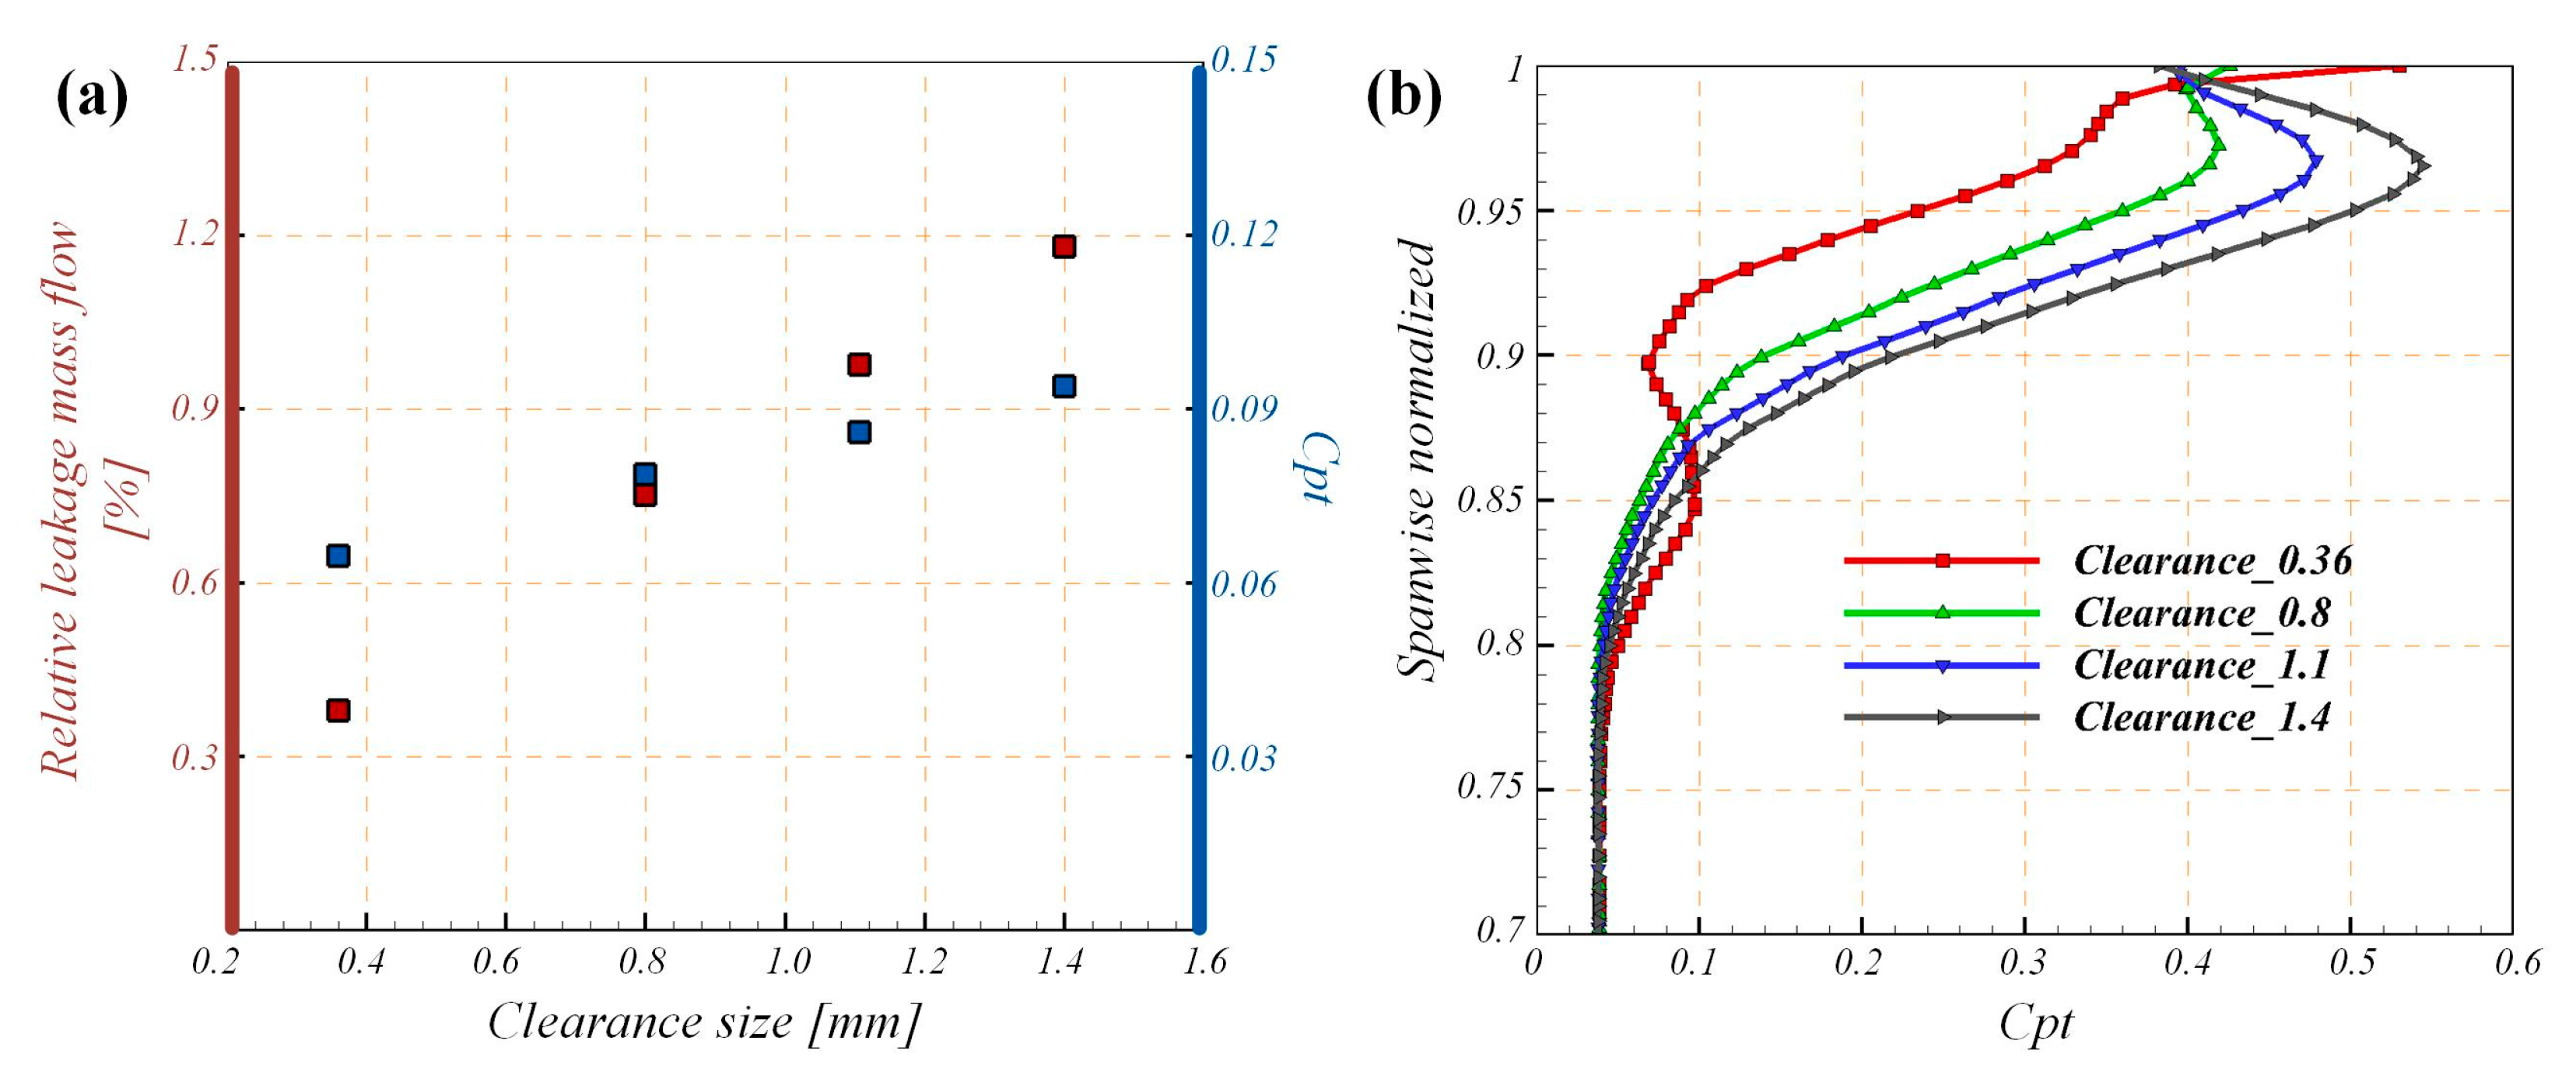
The increase in leakage loss is closely related to the proportion of the leakage flow to the main flow. Figure 13a shows the mass ratio of the leakage flow relative to the mainstream and the mass flow averaged value of the total pressure coefficient at the outlet measure surface for different clearance sizes. When the clearance size changes from 0.36 mm to 1.4 mm, the relative leakage flow rate increases from 0.38% to 1.18%, and the total pressure coefficient increases from 0.064 to 0.094. Both the relative leakage flow rate and the total pressure coefficient increase while the clearance size increases. The range of variation in the total pressure coefficient is less than in the leakage flow rate. In fact, an increase in the gap size does not have a significant effect on the mainstream flow rate but can significantly increase the leakage flow. Therefore, the relative leakage flow rate is positively correlated with the gap size. Further, an increase in the relative leakage flow represents an increase in leakage jet energy, both in terms of increased mixing losses with the main stream, which will result in an increase in the total pressure loss coefficient. Figure 13b shows the distribution of the pitch-wise averaged value of the total pressure coefficient in the spanwise direction, and only the 0.36 mm clearance size condition can clearly distinguish the leakage vortex and passage vortex region for the four sizes. The increase in the clearance size brings an increase in the loss in the leakage vortex region, but it is noted that a part of the loss in the passage vortex region is higher in the 0.36 mm condition than in the other three conditions (0.8–0.85 times blade spanwise). This is because this part of the fluid is not absorbed by the leakage vortex.
3.4. Work Condition Adaptability Analysis for the Dual−Cavity Tip
By analyzing the flow field of the dual−cavity tip structure under different operating conditions, it is possible to understand how the leakage flow varies under different Mach numbers, incidence angle and clearance size conditions. However, can the dual−cavity blade tip structure obtained based on the optimization under the design operating conditions show better control in all environments? In this section, a comparison of the dual−cavity tip structure with the flat tip structure under various operating conditions is used to explain the adaptability to the operating conditions.
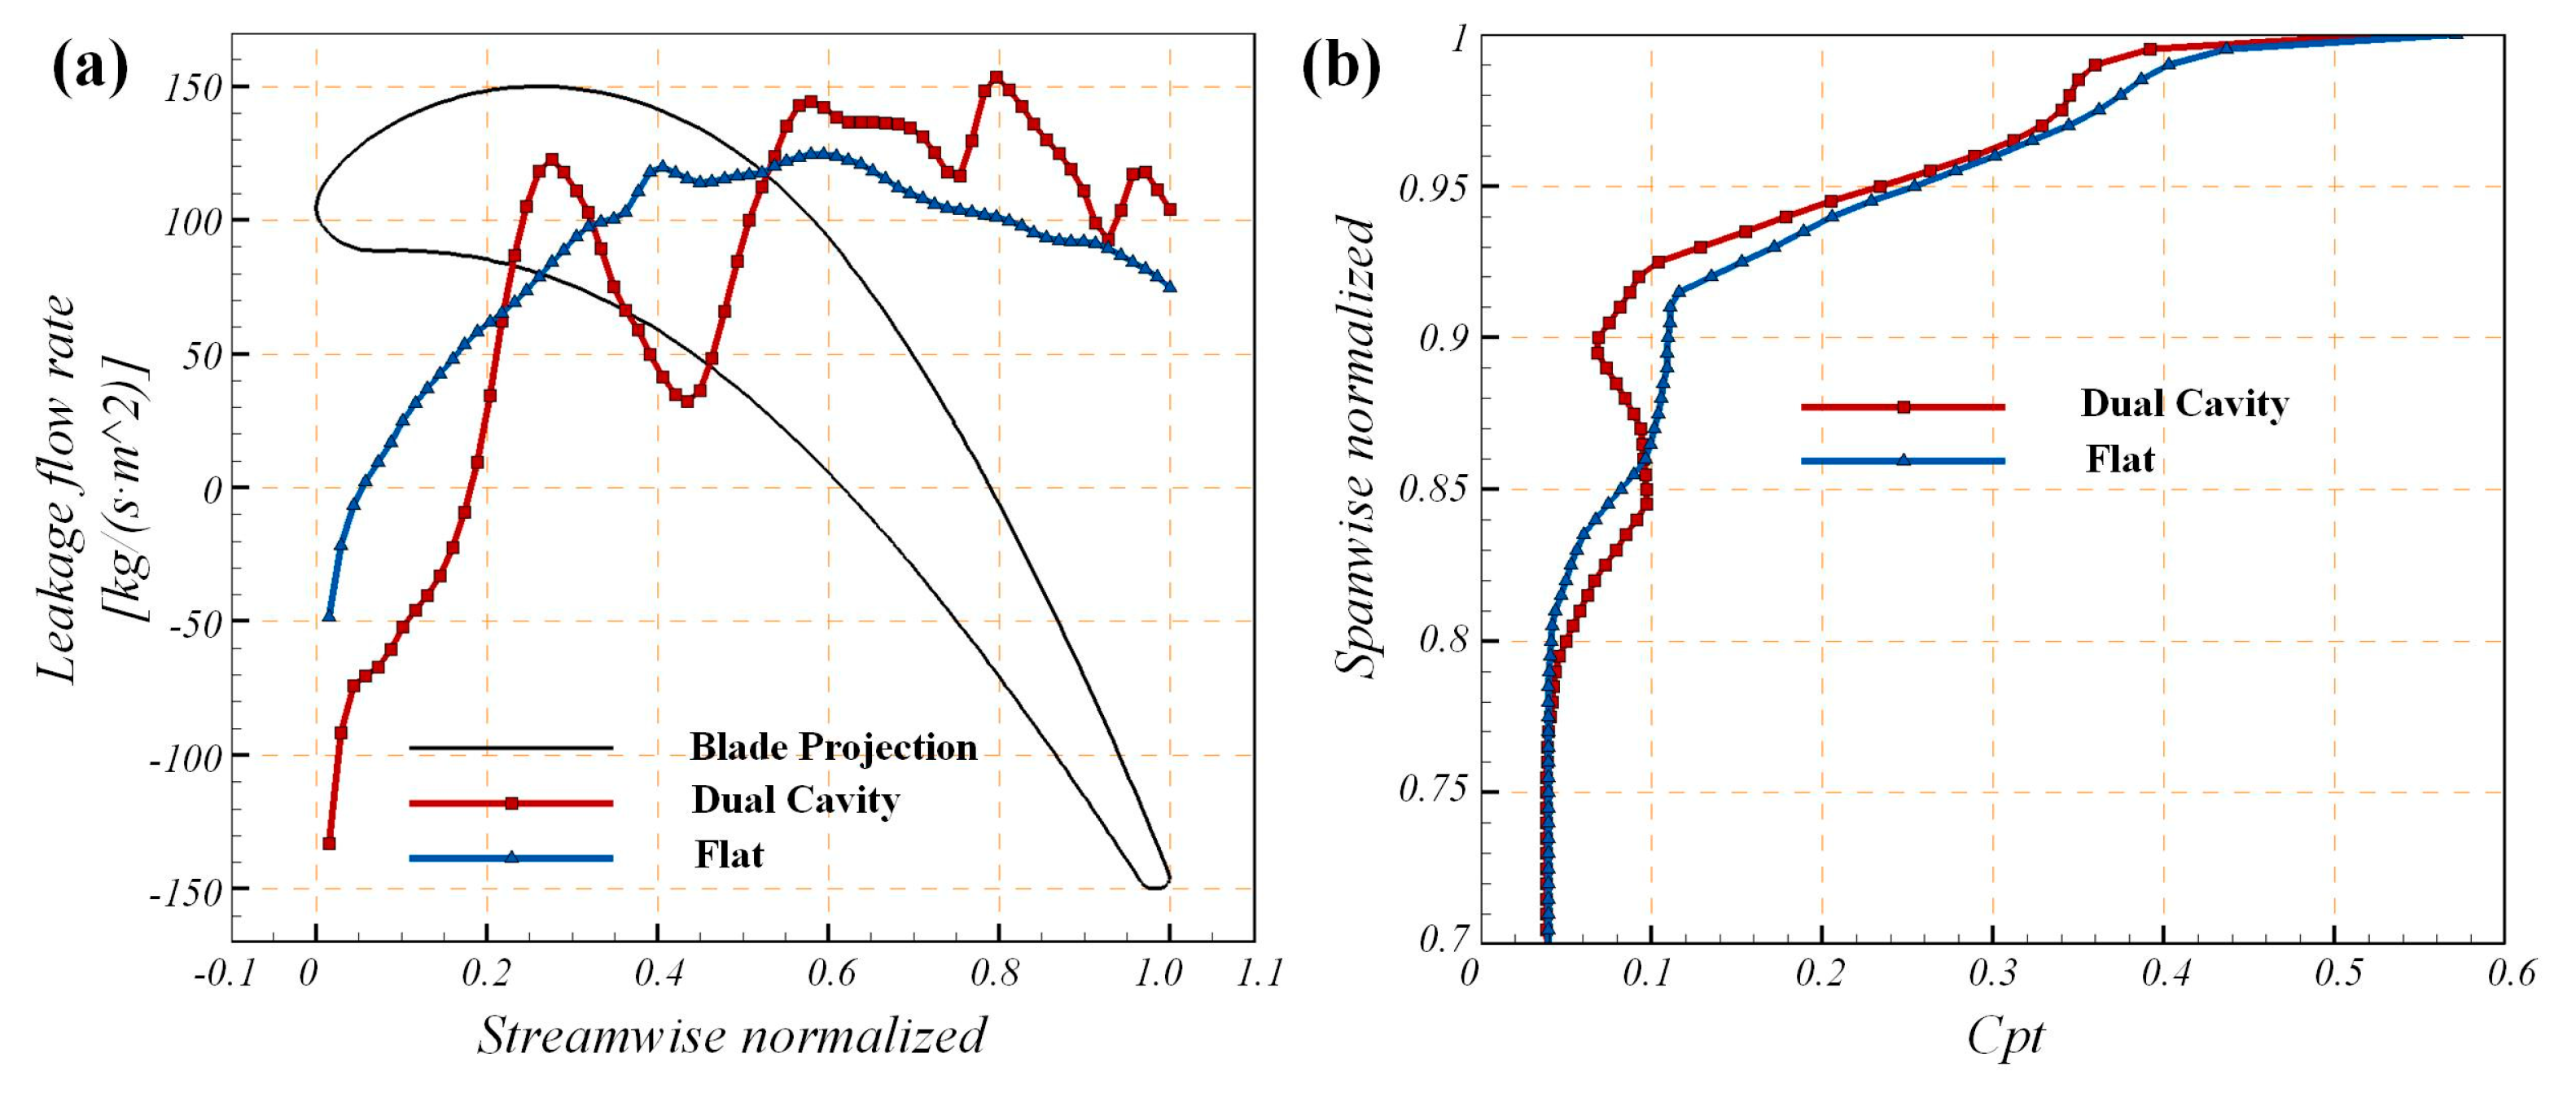
Figure 14 shows the leakage flow distribution and total pressure coefficient distribution for the incidence angle of zero degrees, outlet Mach number of 0.92 and clearance size of 0.36 mm. The dual−cavity tip structure is shown in the red line and the flat tip structure is shown in the blue line. Figure 14a shows the leakage flow rate distribution at the suction surface; it can be seen that the leakage flow of the flat tip structure is more regular, with an overall increasing trend and less fluctuation, with the dual−cavity tip structure at 0–0.2 and 0.3–0.5 times the streamwise position of less leakage flow. However, the dual−cavity tip leakage flow is greater near the trailing edge. This is because most of the inside fluid flowing along the cavity rib finally flows out from the trailing edge. Figure 14b shows the spanwise distribution of the total pressure coefficient for these two configurations. The dual−cavity tip structure clearly has a smaller leakage vortex structure, but greater losses in the 0.8–0.85 spanwise position, which is the passage vortex region. This indicates that the dual−cavity structure controls the leakage flow not only by reducing the leakage flow but also by changing the leakage position of the suction surface to change the leakage vortex trend.
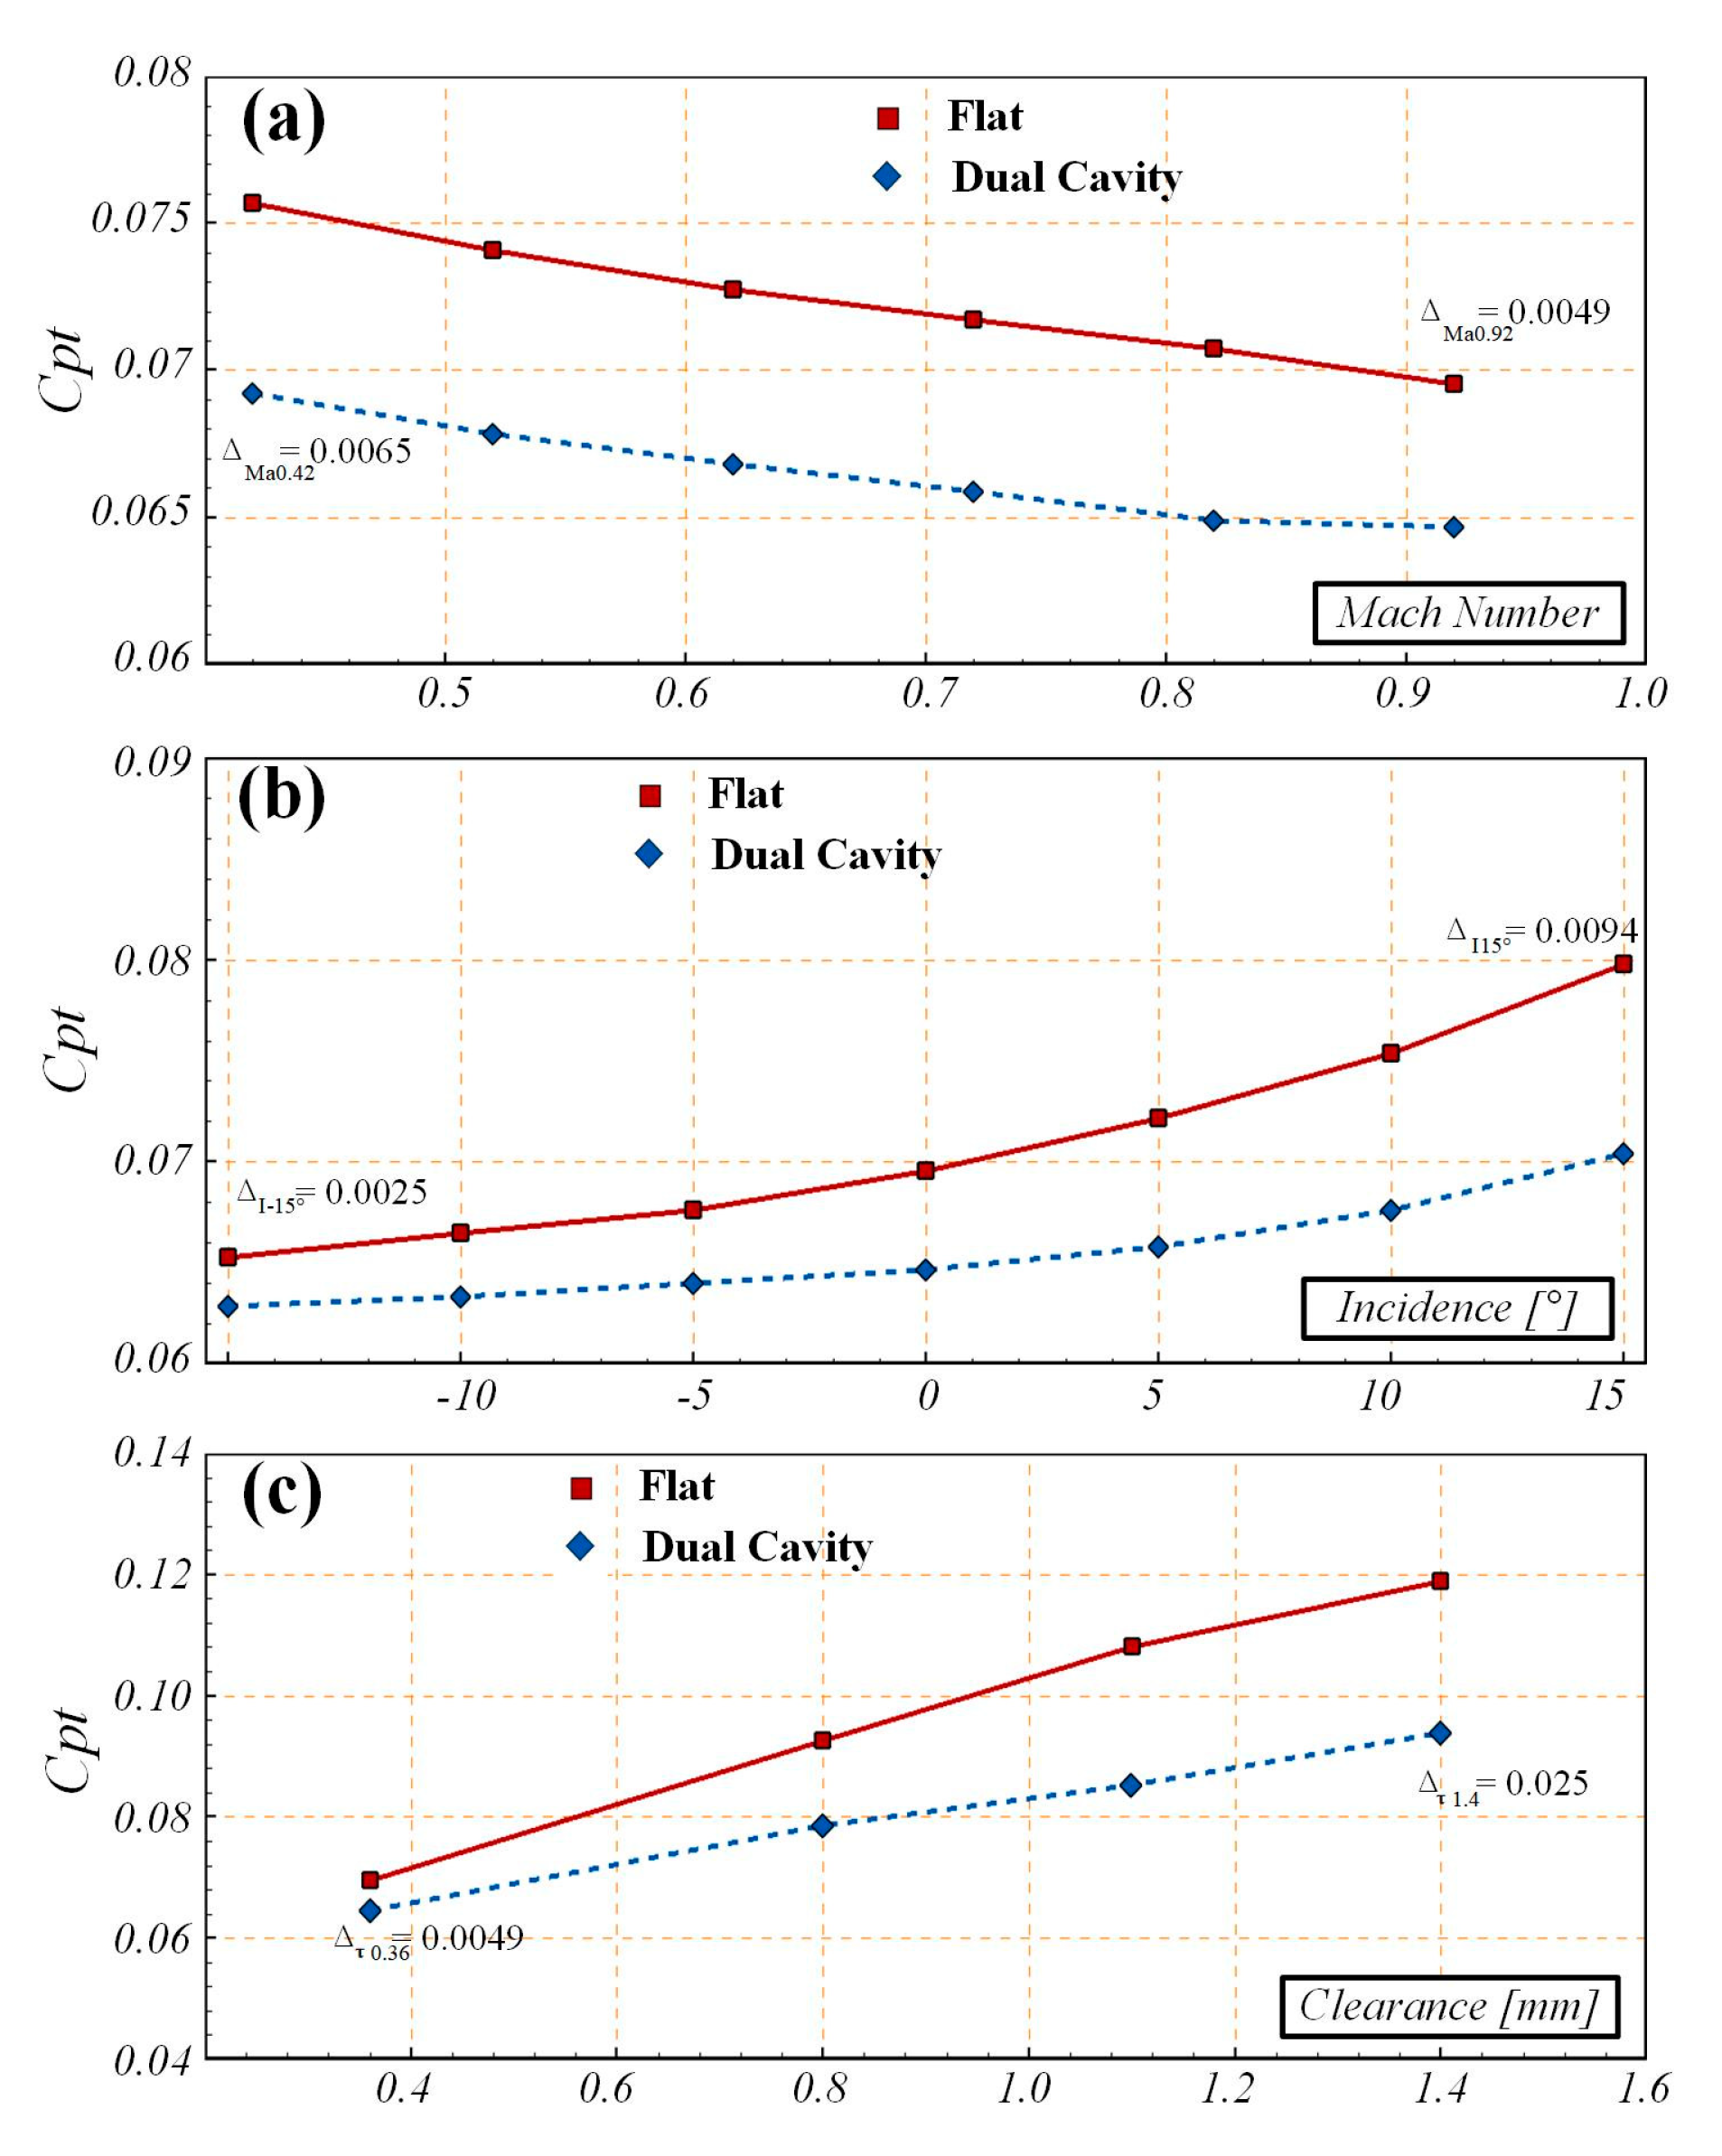
Figure 15 shows the comparison of the total pressure coefficients between the flat-tip and the dual−cavity tip for varying Mach numbers, incidence angles and clearance sizes. The total pressure coefficient decreases continuously for both structures as the Mach number increases from 0.42 to 0.92. The dual-cavity structure can reduce the losses effectively at all Mach numbers with similar results. As the incidence angle changes from −15° to 15°, the total pressure loss shows an overall increasing trend, but the change is not significant for the negative conditions. The dual-cavity blade tip structure can also optimize the aerodynamic performance at all angles, and the optimization effect is more obvious for the positive states. With the increase in the clearance size, the total pressure coefficient shows an increasing trend, and the larger the clearance, the more obvious the control effect. The maximum optimization effect in the process of the Mach number change is 0.0065 at Ma = 0.42, and the minimum optimization effect is 0.0049 at Ma = 0.92; the maximum optimization effect in the process of angle change is 0.0094 at incidence = 15°, and the minimum optimization effect is 0.0025 at incidence = −15°; the maximum effect under the clearance size change is 0.025 at τ = 1.4 mm, and the minimum optimization effect is 0.0049 at τ = 0.36 mm.
Numerical calculations prove that the dual−cavity blade tip structure is well adapted to the control effect of the blade tip leakage flow. The change in the test conditions did not only change the flow state in the tip region, but also covered the low and high loss conditions of the cascades. It is effective in improving aerodynamic performance at different flow velocities, airflow angles and clearance sizes. This indicates that it can be excellently adapted to each operating condition of the aeroengine.
4. Conclusions
In this work, experimental and numerical studies have been conducted to investigate the aerodynamic performance of a dual−cavity blade tip configuration under different operating conditions. Variations in Mach number, incidence angle and clearance size are considered and presented under normal operating conditions of the turbine engine. The analysis of various parameters including the vortex structure, loss development and pressure distribution lead to the following conclusions:
- The increase in Mach number alters the pressure gradient at the tip location and intensifies the leakage flow. The increasing leakage flow causes the leakage vortex to absorb more of the surrounding low-energy fluid, resulting in the suppression of passage vortex development.
- The passage vortex is weak at the negative incidence angle, but it grows as the incoming flow moves toward the positive angles. At 15°incidence, the passage vortex starts to inhibit the development of the leakage vortex. This phenomenon occurs mainly when the pressure surface branch of the horseshoe vortex strikes the suction surface.
- The growth in the clearance size leads to the increase in the total leakage flow and total loss; the leakage flow will roll and suck the passage vortex structure as well when the gap is larger.
It can be seen the interaction between the leakage vortex and passage vortex is the most important reason for the generation and development of losses in the turbine blade tip area. A strong leakage vortex can inhibit the development of the passage vortex and vice versa. Therefore, when we optimize and design, we should consider both factors simultaneously.
As far as the dual−cavity blade tip configuration is concerned, it can be seen that:
- The dual−cavity tip structure hinders the development of the leakage vortices by changing the position of the leakage flow from the suction surface.
- The dual−cavity blade tip structure is adaptable and effective in reducing losses under all operating conditions in the current study. The maximum optimization effect in the process of the Mach number change is 0.0065 at Ma = 0.42, and the minimum optimization effect is 0.0049 at Ma = 0.92; the maximum optimization effect in the process of angle change is 0.0094 at incidence = 15°, and the minimum optimization effect is 0.0025 at incidence = −15°; the maximum effect under the clearance size change is 0.025 at τ = 1.4 mm, and the minimum optimization effect is 0.0049 at τ = 0.36 mm;
- Comparing three influencing factors, the control effect of the dual−cavity tip configuration is most influenced by the clearance size, followed by the incoming flow angle, and least affected by the Mach number variation. The underlying mechanism is that the Mach number variation is much less relative to the main vortex system structure, while the variation in both the clearance size and incidence angle more closely correlated to the vortex generation and development mechanism inside the cavity.
Author Contributions
Conceptualization, Y.C. and L.C.; methodology, L.C.; software, Y.C.; validation, Y.C., L.C. and D.J.; formal analysis, Y.C.; resources, D.J.; data curation, Y.C.; writing—original draft preparation, Y.C. and Y.L.; writing—review and editing, Y.L.; visualization, Y.C. and Y.L.; supervision, S.W.; project administration, S.W.; funding acquisition, D.J. All authors have read and agreed to the published version of the manuscript.
Funding
This research was funded by ACEE Commercial Aircraft Engine Co., Ltd. and the author was funded by China Scholarship Council (CSC): No. 202106120166.
Institutional Review Board Statement
Not applicable.
Informed Consent Statement
Informed consent was obtained from all subjects involved in the study.
Data Availability Statement
The dataset will be made available upon request.
Acknowledgments
This work was supported by ACEE Commercial Aircraft Engine Co., Ltd. The experiments were conducted at the Engine Aerodynamics Research Center (EARC) of Harbin Institute of Technology.
Conflicts of Interest
The authors declare no conflict of interest.
References
- Denton, J.D. The 1993 IGTI Scholar Lecture: Loss Mechanisms in Turbomachines. J. Turbomach. 1993, 115, 621–656. [Google Scholar] [CrossRef]
- Key, N.L.; Arts, T. Comparison of Turbine Tip Leakage Flow for Flat Tip and Squealer Tip Geometries at High-Speed Conditions. J. Turbomach. 2006, 128, 213–220. [Google Scholar] [CrossRef]
- Li, W.; Jiang, H.; Zhang, Q.; Woo Lee, S. Squealer Tip Leakage Flow Characteristics in Transonic Condition. J. Eng. Gas Turbines Power 2014, 136, 042601. [Google Scholar] [CrossRef]
- Zeng, F.; Zhang, W.; Wang, Y.; Cao, X.; Zou, Z. Effects of Squealer Geometry of Turbine Blade Tip on the Tip-Leakage Flow and Loss. J. Therm. Sci. 2021, 30, 1376–1387. [Google Scholar] [CrossRef]
- Li, C.; Xiang, J.; Song, L.; Li, J. An aerothermal analysis of the effects of tip gap height and cavity depth of a gas turbine blade. Int. J. Therm. Sci. 2020, 158, 106521. [Google Scholar] [CrossRef]
- Park, J.S.; Lee, S.H.; Kwak, J.S.; Lee, W.S.; Chung, J.T. Measurement of Blade Tip Heat Transfer and Leakage Flow in a Turbine Cascade With a Multi-Cavity Squealer Tip. In ASME 2013 Turbine Blade Tip Symposium; American Society of Mechanical Engineers: New York, NY, USA, 2013. [Google Scholar]
- Kharati-Koopaee, M.; Moallemi, H. Effect of blade tip grooving on the performance of an axial fan at different tip clearances in the absence and presence of inlet guide vanes. Proc. Inst. Mech. Eng. Part A J. Power Energy 2019, 234, 72–84. [Google Scholar] [CrossRef]
- Dey, D.; Camci, C. Aerodynamic Tip Desensitization of an Axial Turbine Rotor Using Tip Platform Extensions. In ASME Turbo Expo 2001: Power for Land, Sea, and Air; American Society of Mechanical Engineers: New York, NY, USA, 2001. [Google Scholar]
- Jiang, S.; Li, Z.; Li, J. Effects of the squealer winglet structures on the heat transfer characteristics and aerodynamic performance of turbine blade tip. Int. J. Heat Mass Transf. 2019, 139, 860–872. [Google Scholar] [CrossRef]
- Zhang, M.; Liu, Y.; Zhang, T.; Zhang, M.; He, Y. Aerodynamic Optimization of a Winglet-Shroud Tip Geometry for a Linear Turbine Cascade. J. Turbomach. 2017, 139, 101011. [Google Scholar] [CrossRef]
- Zhou, Z.; Chen, S.; Wang, S. Aerodynamic Optimization of Winglet-Cavity Tip in an Axial High Pressure Turbine Stage. Int. J. Turbo Jet-Engines 2020, 37, 399–411. [Google Scholar] [CrossRef]
- Chen, Y.; Jiang, D.; Du, Z.; Wang, S. Experimental and Numerical Investigation of High Load Turbine Blade Tip Cavity Structures. J. Turbomach. 2023, 145, 061008. [Google Scholar] [CrossRef]
- Treaster, A.L.; Yocum, A.M. The Calibration and Application of Five-Hole Probes; Pennsylvania State Univ University Park Applied Research Lab: University Park, PA, USA, 1978. [Google Scholar]
- Maral, H.; Alpman, E.; Kavurmacıoğlu, L.; Camci, C. A genetic algorithm based aerothermal optimization of tip carving for an axial turbine blade. Int. J. Heat Mass Transf. 2019, 143, 118419. [Google Scholar] [CrossRef]
- Menter, F.R. Two-equation eddy-viscosity turbulence models for engineering applications. AIAA J. 1994, 32, 1598–1605. [Google Scholar] [CrossRef] [Green Version]
- Celik, I.B.; Ghia, U.; Roache, P.J.; Freitas, C.J. Procedure for Estimation and Reporting of Uncertainty Due to Discretization in CFD Applications. J. Fluids Eng. 2008, 130, 078001. [Google Scholar] [CrossRef] [Green Version]
- Hunt, J.C.R.; Wray, A.A.; Moin, P. Eddies, Streams, and Convergence Zones in Turbulent Flows. Center for Turbulence Research, Proceedings of the Summer Program 1988, Report CTR-S88 ; Center for Turbulence Research: Stanford, CA, USA, 1988. [Google Scholar]
Figure 1.
Experimental facility. (a) cascade configuration, (b) blade tip shape.

Figure 2.
Measurement points distribution.

Figure 3.
Fluid computational domain. (a) computational domain, (b) front part, (c) middle part, (d) rear part.
Figure 3.
Fluid computational domain. (a) computational domain, (b) front part, (c) middle part, (d) rear part.

Figure 4.
Comparison of experimental and numerical results. (a) Blade surface isentropic Mach number distribution, (b) pitch−wise deviation angle distribution.
Figure 4.
Comparison of experimental and numerical results. (a) Blade surface isentropic Mach number distribution, (b) pitch−wise deviation angle distribution.

Figure 5.
Experimental results at different outlet isentropic Mach numbers. (a) Spanwise total pressure coefficient distribution, (b) streamwise isentropic Mach number distribution (the dashed line represents the suction surface and the solid line represents the pressure surface).
Figure 5.
Experimental results at different outlet isentropic Mach numbers. (a) Spanwise total pressure coefficient distribution, (b) streamwise isentropic Mach number distribution (the dashed line represents the suction surface and the solid line represents the pressure surface).

Figure 6.
Computed leakage flow rate distribution along the suction surface in different outlet isentropic Mach Number conditions. (a) Leakage flow rate value, (b) leakage flow rate over the passage flow rate.
Figure 6.
Computed leakage flow rate distribution along the suction surface in different outlet isentropic Mach Number conditions. (a) Leakage flow rate value, (b) leakage flow rate over the passage flow rate.

Figure 7.
Total pressure coefficient distribution. (a) Streamwise slices at Mach number 0.42, CFD, (b) streamwise slices at Mach number 0.72, CFD, (c) streamwise slices at Mach number 0.92, CFD, (d) measure surface at Mach number 0.42, EXP, (e) measure surface at Mach number 0.72, EXP, (f) measure surface at Mach number 0.92, EXP.

Figure 8.
Computed leakage flow rate distribution along the suction surface in different incidence angle conditions.
Figure 8.
Computed leakage flow rate distribution along the suction surface in different incidence angle conditions.

Figure 9.
Computed Q-criterion distribution in different incidence angles. (a) Incidence angle −15°, (b) incidence angle −10°, (c) incidence angle −5°, (d) incidence angle 5°, (e) incidence angle 10°, (f) incidence angle 15°.
Figure 9.
Computed Q-criterion distribution in different incidence angles. (a) Incidence angle −15°, (b) incidence angle −10°, (c) incidence angle −5°, (d) incidence angle 5°, (e) incidence angle 10°, (f) incidence angle 15°.

Figure 10.
Computed pressure and streamline distribution. (a) Incidence angle −15°, (b) incidence angle −10°, (c) incidence angle −5°, (d) incidence angle 5°, (e) incidence angle 10°, (f) incidence angle 15°.
Figure 10.
Computed pressure and streamline distribution. (a) Incidence angle −15°, (b) incidence angle −10°, (c) incidence angle −5°, (d) incidence angle 5°, (e) incidence angle 10°, (f) incidence angle 15°.

Figure 11.
Experimental total pressure coefficient distribution. (a) EXP, clearance size 0.36 mm, (b) EXP, clearance size 0.8 mm, (c) EXP, clearance size 1.1 mm, (d) EXP, clearance size 1.4 mm, (e) CFD, clearance size 0.36 mm, (f) CFD, clearance size 0.8 mm, (g) CFD, clearance size 1.1 mm, (h) CFD, clearance size 1.4 mm.

Figure 12.
Computed two-dimensional streamline distribution at different streamwise sections. (a) Clearance size 0.36 mm, (b) clearance size 1.4 mm.
Figure 12.
Computed two-dimensional streamline distribution at different streamwise sections. (a) Clearance size 0.36 mm, (b) clearance size 1.4 mm.

Figure 13.
Dual−cavity tip CFD results. (a) Relative leakage mass flow and Cpt variation along clearance sizes and (b) pitch-wise averaged Cpt along spanwise position.
Figure 13.
Dual−cavity tip CFD results. (a) Relative leakage mass flow and Cpt variation along clearance sizes and (b) pitch-wise averaged Cpt along spanwise position.

Figure 14.
Comparison of the flat tip and the dual−cavity tip. (a) Leakage flow rate distribution and (b) total pressure coefficient distribution in CFD results.
Figure 14.
Comparison of the flat tip and the dual−cavity tip. (a) Leakage flow rate distribution and (b) total pressure coefficient distribution in CFD results.

Figure 15.
Computed total pressure coefficient comparison between flat and dual−cavity tips. (a) Mach number variation, (b) incidence variation, (c) clearance variation.
Figure 15.
Computed total pressure coefficient comparison between flat and dual−cavity tips. (a) Mach number variation, (b) incidence variation, (c) clearance variation.


Table 1.
Blade parameters and test conditions.
| Parameters | Units | Values |
|---|---|---|
| Chord, C | [mm] | 50 |
| Axial chord, Cax | [mm] | 33.88 |
| Pitch, P | [mm] | 43.23 |
| Blade span, H | [mm] | 100 |
| Clearance size, τ | [mm] | 0.36 0.8 1.1 1.4 |
| Cavity depth, Sd | [mm] | 1.7 |
| Inlet blade angle | [degree] | 50.59° |
| Outlet blade angle | [degree] | 20.8° |
| Outlet Mach Number | 0.42–0.92 | |
| Incidence angle, i | [degree] | ±15° |
Table 2.
Mesh discretization error.
| Parameters | Index | Values |
|---|---|---|
| Coarsening factors r | r21 | 1.30 |
| r32 | 1.30 | |
| Evaluation indicator ϕ | ϕ1 | 0.0612 |
| ϕ2 | 0.0640 | |
| ϕ3 | 0.0645 | |
| Relative error e | e21 | 4.58% |
| e32 | 0.78% | |
| GCI | GCI21 | 0.231% |
| GCI32 | 0.039% |
Disclaimer/Publisher’s Note: The statements, opinions and data contained in all publications are solely those of the individual author(s) and contributor(s) and not of MDPI and/or the editor(s). MDPI and/or the editor(s) disclaim responsibility for any injury to people or property resulting from any ideas, methods, instructions or products referred to in the content. |
© 2023 by the authors. Licensee MDPI, Basel, Switzerland. This article is an open access article distributed under the terms and conditions of the Creative Commons Attribution (CC BY) license (https://creativecommons.org/licenses/by/4.0/).
Share and Cite
MDPI and ACS Style
Chen, Y.; Cai, L.; Jiang, D.; Li, Y.; Wang, S. Experimental and Numerical Investigations for Dual−Cavity Tip Aerodynamic Performance in the Linear Turbine Cascade. Aerospace 2023, 10, 193. https://doi.org/10.3390/aerospace10020193
AMA Style
Chen Y, Cai L, Jiang D, Li Y, Wang S. Experimental and Numerical Investigations for Dual−Cavity Tip Aerodynamic Performance in the Linear Turbine Cascade. Aerospace. 2023; 10(2):193. https://doi.org/10.3390/aerospace10020193
Chicago/Turabian StyleChen, Yingjie, Le Cai, Dengyu Jiang, Yiyi Li, and Songtao Wang. 2023. "Experimental and Numerical Investigations for Dual−Cavity Tip Aerodynamic Performance in the Linear Turbine Cascade" Aerospace 10, no. 2: 193. https://doi.org/10.3390/aerospace10020193
Note that from the first issue of 2016, this journal uses article numbers instead of page numbers. See further details here.