Article

Vertical Distribution and Chemical Fractionation of Heavy Metals in Dated Sediment Cores from the Saronikos Gulf, Greece

by
Eleni Prifti
1,2,
Helen Kaberi
1,*,
Vasiliki Paraskevopoulou
2,
Panagiotis Michalopoulos
1,
Christina Zeri
1,
Stylianos Iliakis
1,
Manos Dassenakis
2 and
Michael Scoullos
2
1
Institute of Oceanography, Hellenic Centre for Marine Research (HCMR), 19013 Anavyssos, Greece
2
Laboratory of Environmental Chemistry, Department of Chemistry, National and Kapodistrian University of Athens, 15784 Athens, Greece
*
Author to whom correspondence should be addressed.
J. Mar. Sci. Eng. 2022, 10(3), 376; https://doi.org/10.3390/jmse10030376
Submission received: 19 February 2022 / Revised: 2 March 2022 / Accepted: 3 March 2022 / Published: 6 March 2022

Abstract

:
The Saronikos Gulf is under a lot of anthropogenic pressure, such as the urban expansion of the metropolitan area of Athens, the port of Piraeus and marinas, industrial activities, and tourism. Heavy metal pollution has been a major environmental problem in the area for many decades. Sedimentary cores have proven to be an invaluable indicator of heavy metal pollution, as they can reveal not only the current metal inputs but also the evolution of pollution over time, and with the appropriate geochemical analyses, they can provide information on the potential toxicity of metals. In this study, the temporal evolution and the chemical speciation of eleven elements were examined in sediment cores from Elefsis Bay and the Inner Saronikos Gulf, with an emphasis on the emerging environmental hazards (V and Ag). The results showed extensive pollution of the sediments by Ni, Cr, Cu, Zn, As, Mo, Cd, and Pb from the 1910s and 1960s in Eastern and Western Elefsis Bay, respectively. A significant decrease of the sediment enrichment in V, Ni, Cr, Cu, Zn, As, Cd, Pb, and Ag since 2000 was observed in the part of the Inner Saronikos Gulf that is mainly influenced by the WWTP of Athens. However, a toxicity assessment using the metal contents of the surface sediments showed that most of the trace elements studied still pose a moderate to high risk of toxicity to benthic ecosystems. The present study highlighted the urgent need for focused research and the management of trace element inputs, particularly Ag in the Inner Saronikos Gulf, where severe sediment modification was evident.

1. Introduction

Sediments have been preferentially used to assess the metal pollution degree of marine environments, since they have the advantage of recording environmental events and provide useful temporal and spatial information [1,2]. It is also well-understood that the speciation/phase distribution of metals in sediments is required to complement the total metal concentrations and assess the potential release of metals into the sediment–water interface, bioavailability, and possible toxicity [3,4,5]. The main forms of metals in sediments are soluble and exchangeable: those adsorbed into amorphous materials (Fe/Mn oxides), those bound to organic matter and sulfides, and those incorporated into mineral lattices. The speciation of elements also gives an indication of the origin of metals, i.e., natural processes or anthropogenic activities, clarifying the chemical conditions through which metals can be remobilized and also provide useful information for the environmental management of heavily polluted areas [6,7].
For this reason, over the last thirty years, many techniques and methods have been introduced to assess the speciation of metals in sediments via sequential metal extractions with reagents that extract the different chemical fractions. The most commonly used procedure is the modified BCR protocol and accompanying Certified Reference Material (IRMM—Institute for Reference Materials and Measurements of the European Commission) [8].
The use of sediment cores to determine background metal concentrations and quantify metal pollution is common and widely accepted [9]. Dating of the sediment cores can provide a time scale of the contamination history, helping to attribute inputs of contaminants to specific periods of anthropogenic interventions. It also reveals the major sedimentary changes that can occur due to the removal, deposition, or mixing of sediments that can be associated with human activities and/or natural processes [10,11,12].
Saronikos Gulf is the sea border of the metropolitan area of Athens and its coastal suburbs. The present study focuses on two sub-areas: the Inner Saronikos Gulf and Elefsis Bay (Figure 1). The two major sources of pollution of the inner gulf are the Wastewater Treatment Plant (WWTP) on the Island of Psyttalia, which treats the wastewater of ≈5 million inhabitants, and the Port of Piraeus, one of the largest ports in the Mediterranean region, with intense navigation and shipping activities [13,14,15]. In previous decades, Kifissos River was also a source of pollution of the Inner Saronikos Gulf, passing through a heavily industrialized area (western part of Athens). The river was also used as a conduit for industrial effluents, sewage, and urban runoff [16]. Elefsis Bay, on the other hand, is one of the most polluted marine areas of Greece, as, for many years, a large amount of industrial waste (from oil refineries, shipyards, chemical plants, food, metal/cement industries, etc.) and sewage has been discharged into the bay, mostly without any prior treatment [17,18,19]. The pollution of Elefsis Bay has been studied since the late 1970s [20,21], and while recovery trends have been observed [19,22], the deterioration of the marine environment was so great that, for example, within twenty years (1960–1980), about 70% of the benthic species had become extinct or their abundance had been dramatically reduced [19]. Recent studies, however, have shown a significant recovery of the ecosystem, classifying both the inner gulf and the western basin as in good status sensu WFD (Water Framework Directive, 2000/60/EC) [13,15].
Among the contaminants of concern, V and Ag have a high priority, as they are related to industrial and urban pollution sources, but they have not been sufficiently studied, at least in the Saronikos Gulf. The determination of the total V content and its chemical fractionation in the sediments is of high importance, since V has been characterized as a reemerging environmental and human health hazard of global interest [23]. The overall knowledge about V geochemistry and toxicity is limited, and the need for more studies on this metal has been pointed out by many scientists [24,25]. The increased use of heavy petroleum products with a high V content and the rising demands in high-grade steel and in V redox–flow batteries are factors that are projected to increase the annual global fluxes of V [23,26] and, consequently, the exposure of humans and other organisms to V.
Silver is a metal of great environmental concern due to its high bioavailability, toxicity, and very high bioaccumulation rate [27,28] that has been characterized as one of the emerging pollutants. Silver is widely used as an antimicrobial agent in several medical fields, such as biomedicine, pharmaceutical, food industry, and healthcare, but also in a wide range of industrial and consumer applications, including fiber coating, detergents, and hydrogels and plastics, to prevent bacterial and fungal growth [29]. Given its wide use in pharmaceuticals, silver is also considered a contaminant of the wide list called Pharmaceuticals and Personal Care Products (PPCPs), which has recently caused great concern for its effects on ecosystems [30]. Due to its antimicrobial properties, its increasing use has also caused great concern and controversy regarding the rise of antibiotic-resistant bacteria [31] and has been identified as a priority pollutant for the marine environment [32]. The bioaccumulation factor of Ag was found to reach up to 56 in the estuarine clam Macoma balthica [27]. The high bioaccumulation of Ag in estuarine and marine environments may be the result of the chemically favored neutral chloro-complex AgCl°, which is highly bioavailable [33,34]. The emerging environmental concern on the effects of Ag is attributed to the increased use of Ag nanoparticles (AgNPs) in nanotechnology applications. Increasing scientific evidence reveals the adverse effects of nanoparticles (mostly AgNPs) at the biomolecular, cellular, subcellular, organ, systemic, whole-organism, and ecosystem levels, a hazard that warrants rigorous attention to safety assessments [35].
The aim of the present study is to assess the degree of metal pollution of Elefsis Bay and the Inner Saronikos Gulf through time with the chemical analysis of sediment cores and to investigate the risk that the metals pose to the ecosystem. Particular emphasis will be placed on the two emerging pollutants that have not been studied in detail before, namely V and Ag. Unfortunately, on 10 September 2017, a small tanker sank in the Inner Saronikos Gulf, off the coast of Salamis Island and west of Psyttalia Island, causing a leak of 2500 tons of crude oil, which makes the results of this study even more valuable for the assessment of the long-term ecological impact of the oil spill, as they can be used to record the geochemical status of the sediments before the accident.

2. Materials and Methods
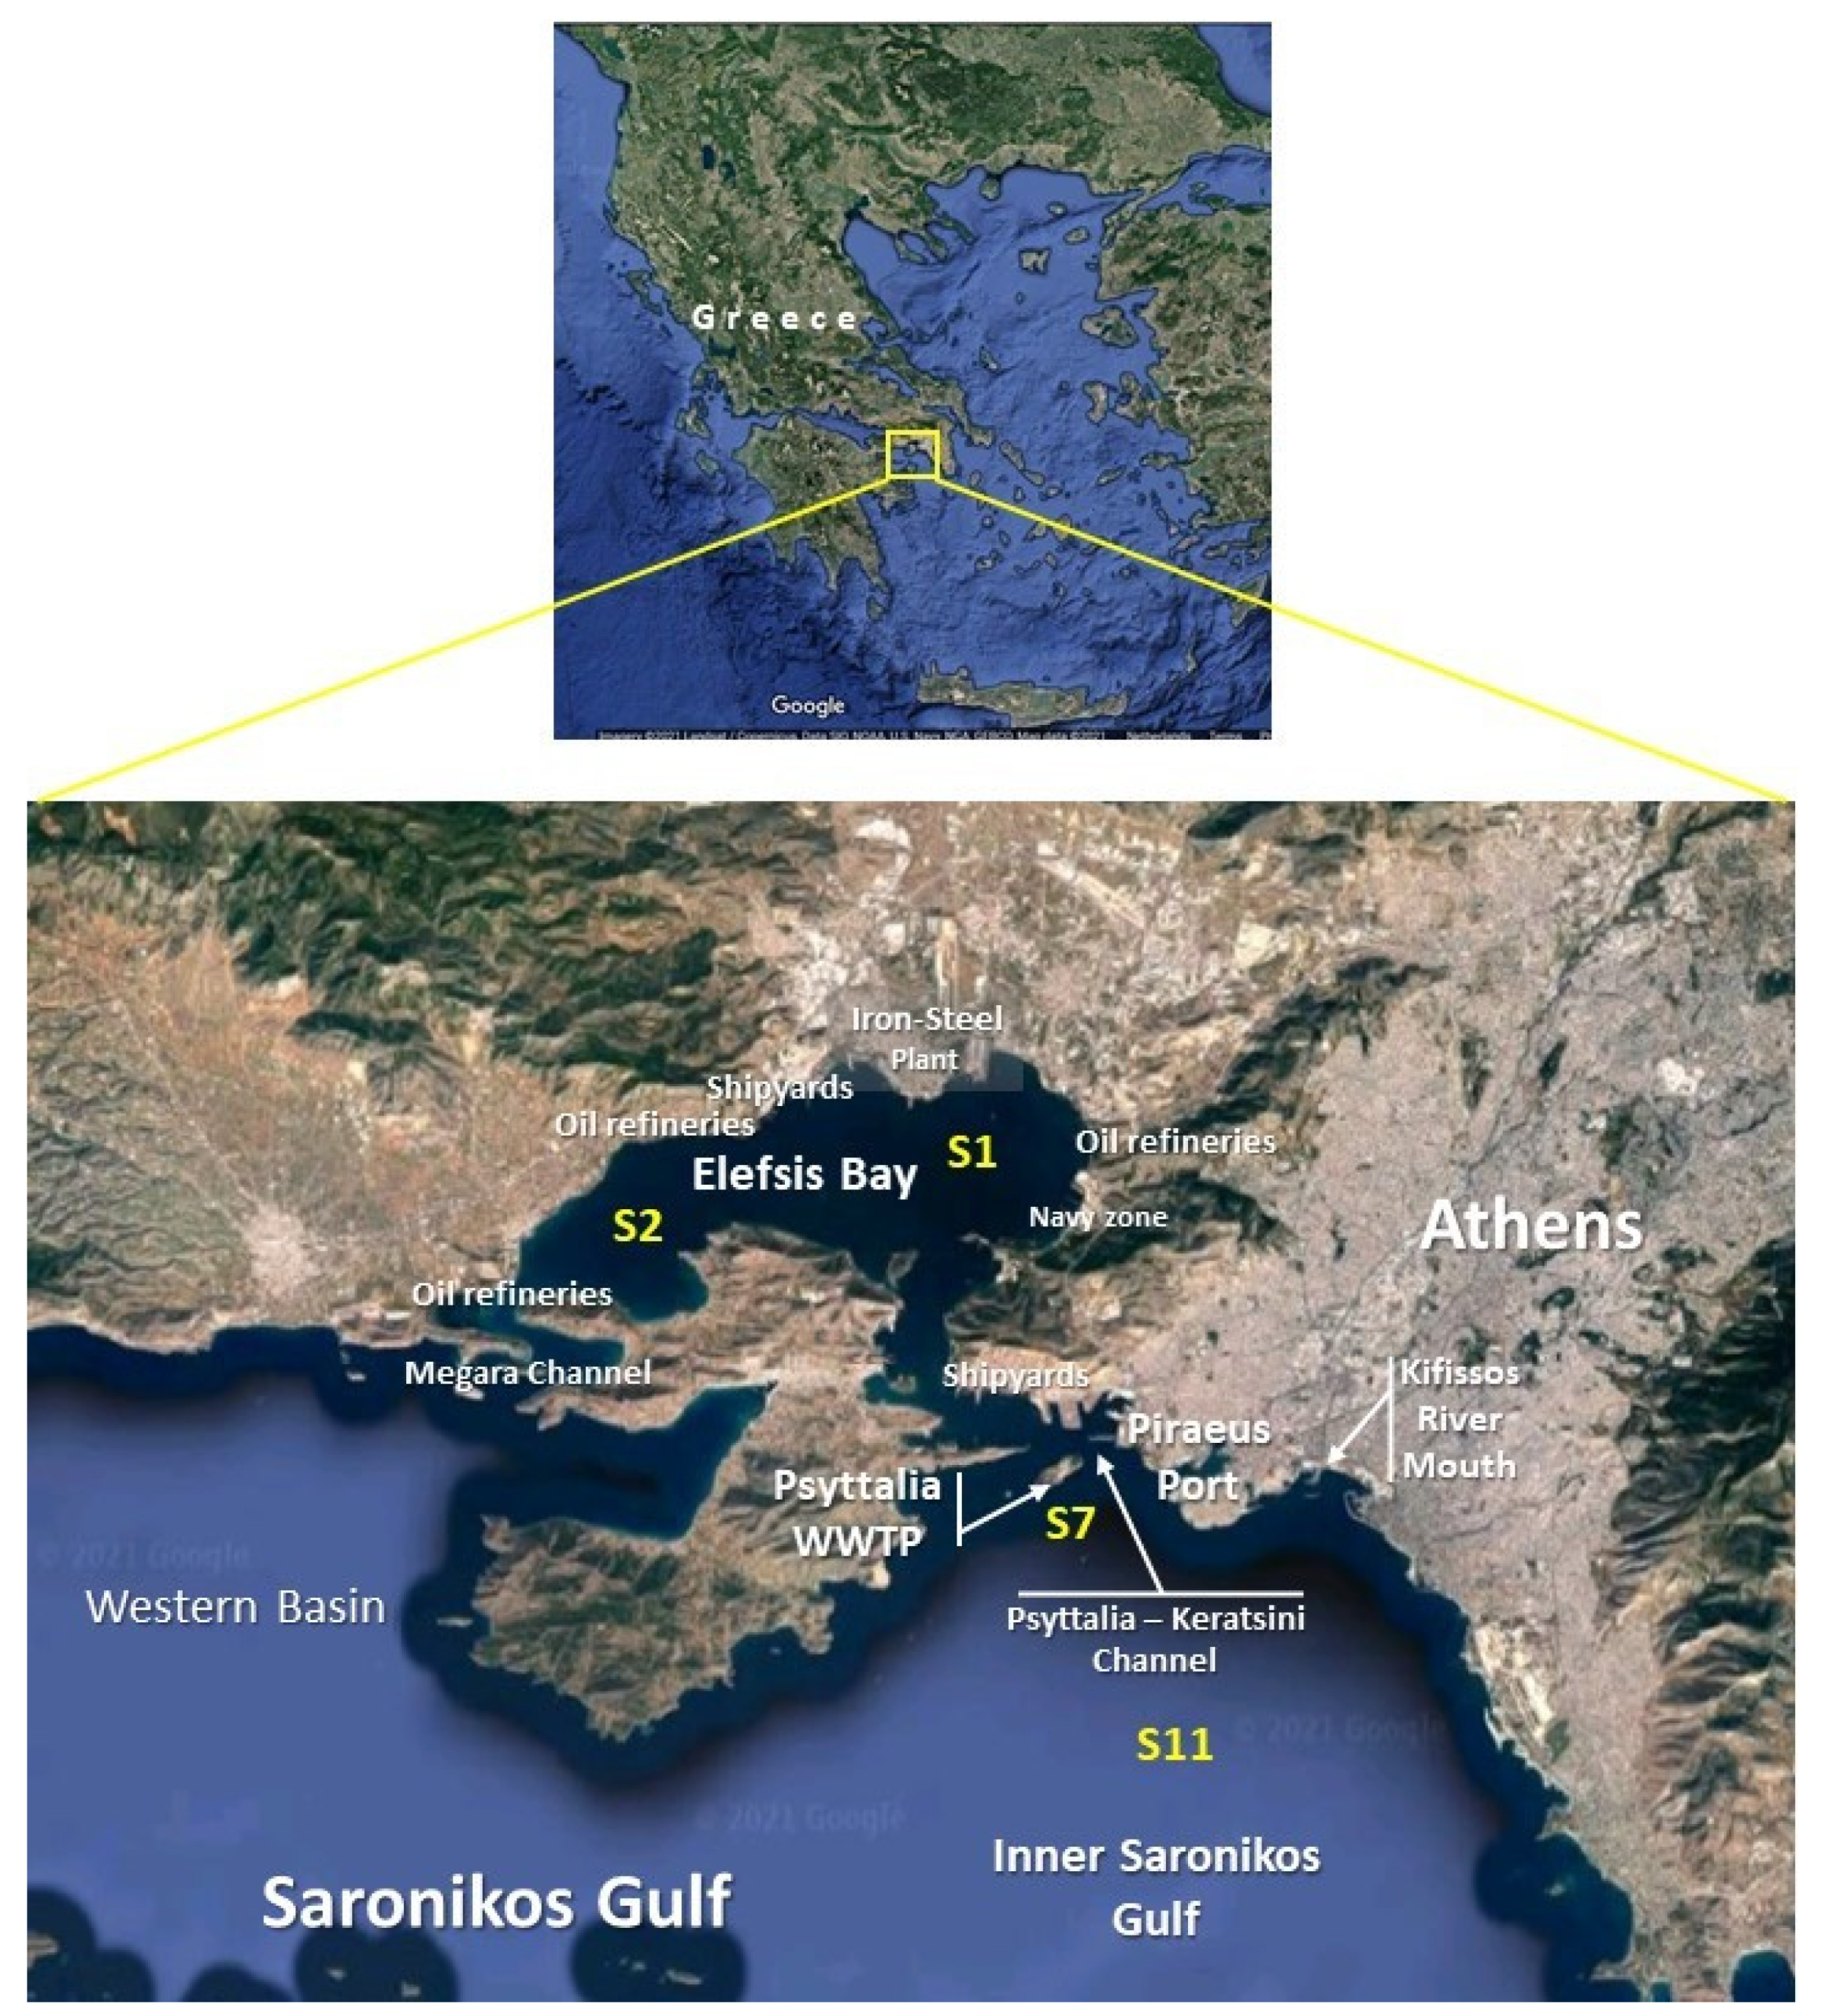
2.1. Study Area

Saronikos Gulf consists of an area of 2600 km2, and its maximum depth is approximately 450 m. The present study focuses on the northern part of the gulf, which consists of the Inner Saronikos Gulf and Elefsis Bay (Figure 1). In Inner Saronikos, the depth ranges from 30 to 90 m. The water circulation of the Saronikos Gulf shows robust seasonal flow structures that are strongly modified by local winds [36]. The two main contemporary sources of pollution of the Inner Saronikos Gulf are: (a) the Wastewater Treatment Plant (WWTP) of Athens on Psyttalia Island that services the city of Athens (≈5 million inhabitants), discharges an average of 730,000 m3 wastewater per day at a 65-m water depth south of the island, and is the second-largest treatment plant in Europe and (b) the Port of Piraeus, which is one of the largest ports in the Mediterranean region, with intense navigation and shipping activities [13,14,15]. Until 1994, the sewage from Athens was discharged untreated into the gulf north of Psyttalia Island. Between 1994 and 2004, the sewage was primarily treated, while, from 2004 onwards, the secondary sewage treatment has been in operation [15]. In previous decades, Kifissos River was also considered a pollution source of the Inner Saronikos Gulf, as it flows through the western part of Athens, which has hosted major industrial facilities since the early 1920s, with the culmination of industrial activity between the 1950s and 1970s. The river has also been used as a conduit for domestic and industrial effluents, sewage, and urban runoff [16].
Elefsis Bay, the semi-enclosed, shallow, and elongated basin, is formed between the Attica coast and the Island of Salamis. It is connected to the Saronikos Gulf by two narrow and shallow channels: (a) the Psyttalia–Keratsini channel on the east, with an approximately 1200-m width and 12-m depth, and (b) the Megara channel on the west that has a width of 750 m and 8-m depth (Figure 1). Elefsis Bay has a surface area of 67 km2 and a volume of 1.3 billion m3. The average depth of Elefsis Bay is less than 18 m, while the maximum depth of 33 m is observed in the western part. The water circulation is mainly affected by the temperature difference between the water in Elefsis Bay and the Saronikos Gulf [37], while the water renewal time is estimated at 2 to 3 months [38]. During the summer period, Elefsis Bay is characterized by a limited mixing of the water column due to the absence of strong winds and temperature stratification (between July and September). Elefsis Bay is one of the most polluted marine areas in Greece, as, for many years, a large amount of industrial waste (from oil refineries, shipyards, chemical plants, food, metal/cement industries, etc.) and urban sewages was discharged into the bay, mostly without any prior treatment [17,18,19]. The eastern part of Elefsis Bay, where the city of Elefsis is located, is characterized by the existence of heavy industry, while the western part of the gulf is industrialized to a lesser extent. The high organic material and nutrients inputs that come from industrial and municipal wastewater and shipping activities in combination with the absence of strong currents and the shallowness of the bay lead to eutrophication events, resulting in intermittent anoxic conditions in the western part of the bay at depths greater than 20 m. Furthermore, the high concentrations of heavy metals, nutrients, and organic matter have dramatically affected living organisms [19].

2.2. Field Sampling

Four short sediment cores (Supplementary Materials Table S1) from Saronikos and Elefsis Bay were collected during two sampling cruises in February and September of 2012 onboard the R/V AEGAEO. The months were chosen as standard winter and summer sampling periods to evaluate seasonal variations of metal concentrations in pore water (results not included in the present paper). The stations are shown on the map of Figure 1. Station S1, in the eastern part of Elefsis Bay at a depth of 19 m, was chosen to represent the water body that has been mostly affected by the eastern, heavily industrialized coast since the beginning of the 20th century. Station S2 is located in the western part of Elefsis Bay, where the industrialization of the coastal zone started in the second half of the 20th century. This part of the bay is deeper (30-m max depth), resulting in seasonal anoxic events during the summer. Station S7 is located in the northern part of the Inner Saronikos Gulf, close to the Keratsini channel, through which the waters from Elefsis Bay enter the gulf, and south of the Island of Psyttalia near the outfall of the WWTP-treated wastewater pipeline at a depth of 71 m. This station was chosen to represent the area directly affected by the effluents of the WWTP since the beginning of its operation in 1994, as well as the continuously increasing maritime traffic of Piraeus Port. Station S11 is located in the eastern part of the Inner Saronikos Gulf, 7 km south of Piraeus Port and 6 km southwest of the Kifissos River mouth at a depth of 82 m. This station is selected to represent the central part of the Inner Saronikos Gulf.

2.3. Collection of Samples and Pre-Treatment

The short sediment cores were recovered using a multi-corer. They were sliced onboard in 1-cm-thick layers, and the samples were placed in air-sealed plastic containers, set in a portable cooler, and transferred to the laboratory, where they were stored in the freezer at −16 °C until further analysis.
In the laboratory, the frozen samples were freeze-dried to prevent any change of the chemical structure due to the temperature increase. The dried samples were homogenized by grounding in a mechanical agate mortar and kept in a desiccator to remain dry. The moisture content was calculated from the weight loss after heating a pre-weighted sample to 100 °C and cooling to room temperature. All the metal concentrations are reported on dry weight basis.
During all analytical steps, Milli-Q water was used for solution preparation, extraction, and rinsing. All reagents used for the sequential extraction protocol were of analytical reagent grade. All plastic containers and glassware were soaked in 10% nitric acid overnight and rinsed with water before use.

2.4. Analytical Procedures

For the total dissolution of the bulk sediment samples and the residual fraction of the sequential extraction protocol, a microwave-assisted acid digestion method was applied [39]. To determine the accuracy of the digestion procedure, the certified reference materials IAEA-433, IAEA-458, and PACS-2 were digested using the same protocol.
Metal concentrations in the final solutions were determined using an ICP-MS Thermo X series II. The simultaneous determination of the thirteen metal concentrations (V, Cr, Mn, Fe, Co, Ni, Cu, Zn, As, Mo, Ag, Cd, and Pb) required a manual optimization of the instrument, as well as an effective interference reduction. The Collision/reaction Cell Technology (CCT) mode was applied in order to diminish the polyatomic spectral interferences [40,41,42,43]. The porosity of the sediment samples was calculated based on the water content and the average sediment density, and the TOC content was determined according to the Walkley–Black method, as modified by Gaudette et al. [44] for marine sediments and the Al content by Atomic Absorption Spectroscopy (equipment model: Shimadzu/AA-7000). For the calculation of the recent sedimentation rates, the downcore total 210Pb activity was determined through the activity of its alpha-emitting granddaughter 210Po, assuming secular equilibrium with 210Pb. For the total dissolution of the dried sediments, the analytical method described by Sanchez-Cabeza et al. [45] was applied. The sedimentation rates were calculated using the Constant Rate of Supply model (CRS) [46].
Chemical fractionation of eleven metals in the sediment samples was carried out using the optimized three-step BCR extraction protocol [47]. The only modification of the protocol used in this study was the use of 0.5 g of dry sediment instead of 1 g of wet sample, adjusting the volumes of the reagents proportionally. This small modification has been adopted in many other studies [8,48,49] and aims for a more homogeneous and representative sediment sample. Along with the samples, the certified reference material BCR-701 was analyzed to determine the recovery of the method. Certified concentrations of six elements (Cd, Cr, Cu, Ni, Pb, and Zn), for each step are reported for this CRM.
The three-step BCR protocol could not be applied for Ag and As in the present study due to analytical challenges that could not be overcome with the available techniques.

2.5. Pollution Indices

Since the late 1960s, various indices and factors have been used in the literature as indicators to assess the sediments’ environmental status and to reveal ecological trends [9,50,51]. The choice of the factors or indices to be used in each study is dictated by the feasibility of using background concentrations and element normalization. Birch [9] discussed in detail the classification of 20 different indicators that are widely found in the literature as tools to determine the background concentrations and the enrichment of the sediments in metals. The same author reviewed the 19 methodologies used to date in the literature to assess the sediment quality [52].
In this study, the Enrichment Factors (EFs), as first described by Kemp et al. [53], were chosen to estimate the metal enrichment of the sediments based on the measured background concentrations of the metals. Normalization to Al was also used to reduce the confounding introduced by the variable grain size of the sediments [9].
The Enrichment Factor (EF) for each metal (Me) was calculated based on the formula
EF = ( M e A l ) s a m p l e ( M e A l ) b a c k g r o u n d
The background concentrations of the metals were obtained from the preindustrial sediment layers, as defined by the calculated sedimentations rates. Based on the EF, the modifications of sediments can be classified as minor (EFs 1–3), moderate (EFs 3–5), severe (EFs 5–10), and very severe (EFs > 10) [54].
The Sediment Quality Guidelines (SQGs) for surface sediments, as proposed by McDonald et al. [55], were used to evaluate the risks posed by contaminants to ecosystem health. According to these SQGs, two concentrations were defined: the Threshold Effect Level (TEL) and the Probable Effects Level (PEL) concentrations. The TEL represents the concentration above what the sediment-associated contaminant is considered significantly hazardous to aquatic organisms. The PEL defines the lower limit of the contaminant concentrations that are usually or always associated with adverse biological effects. Within the TEL–PEL range, the sediment-associated contaminants are considered to represent significant and immediate hazards to aquatic organisms (Table 1).
Since the SQGs have been established to assess the toxicity of the surface sediments, the average metal concentration of the 0 to 1-cm depth layer of the sediment cores is discussed, as this sediment layer is more likely to be resuspended [56]. Unfortunately, TEL and PEL concentrations have not yet been established for Fe, Mn, V, Co, and Mo; thus, the SQG criteria cannot be applied to assess the pollution status for these metals.
The Risk Assessment Code (RAC) is a common method for assessing heavy metal mobility and their potential health risks based on the total concentration of the metals and their chemical speciation [57,58,59]. RAC is commonly used to assess the risks connected to the presence of the bioavailable fractions of the metals in the sediments, meaning the soluble metal species and the metals bound to carbonates. These metals can easily equilibrate with the aqueous phase when the pH and redox conditions are favorable and, thus, can easily be available to aquatic plants and animals in various depths of the sediments. Therefore, RAC is applied to the total length of the sediment core and not only to the surface sediments as SQGs. This risk assessment indicator is widely used when a chemical fractionation analysis is performed. The classification of the risks based on the RAC is given in Table 1.

2.6. Quality Control

To ensure the accuracy of the sequential extraction protocol, the CRM BCR-701 was analyzed with every group of samples. In total, six replicates of BCR-701 were digested. The recovery varied across the steps between 80 and 123% for Cu, 84 and 137% for Zn, 89 and 127% for Ni, 86 and 121% for Cr, 80 and 127% for Cd, and 88 and 127% for Pb. For Cu and Zn, the recoveries at step 2 were slightly lower than 100%, while they were higher at step 3 for Cu, Zn, Ni, and Cr. Such recovery ranges are quite common in this sequential extraction protocol [49,60] as the protocol subjects of various sources of uncertainty [61].
BCR-701 is certified only for the concentrations of six of the metals analyzed (Cu, Zn, Ni, Cr, Cd, and Pb). However, in this study, we used the sequential extraction protocol to determine the chemical fractionation of five more metals (V, Mn, Fe, Co, and Mo) for which the quality of the analysis was ensured by comparing our results with concentrations measured by other researchers. The information needed was extracted from the GeoReM database [62]. The recovery for each step and each metal is given in Table S2 of the Supplementary Materials.
In order to test the accuracy of the determination of the total metal content, three CRM (IAEA-433, IAEA-458, and PACS-2) were analyzed with each batch of sediment samples. The detailed results are also given in Supplementary Materials Table S3.

3. Results

3.1. Sediment Properties

The vertical distributions of porosity, total organic carbon, and Al at the four sampling stations are shown in Figure 2. The sediments at Stations S1, S2, and S7 had similar porosities, while the porosities at Station S11 were significantly lower. In all cores, the porosity was higher close to the surface and lower at the deeper layers of the cores, a common phenomenon if we consider that the weight of the overlying sediment contributes to the better packing of the sediment particles and the reduction of the pore size [63].
The total organic carbon concentration (TOC) was, on average, higher at Station S2 (0.962–3.942%), similar between Stations S1 and S7 (0.700–2.740% and 1.877–2.643%, respectively), and significantly lower at Station S11 (0.416–0.807%).
The Al concentrations reached the highest values at the S1 and S2 stations, while, in the Inner Saronikos Gulf, they were generally lower, reaching the lowest values at Station S11. The aluminum content was determined as a proxy to the grain size of the sediments, as previously used by other authors for comparability reasons [13]. Thus, the vertical profiles of Al suggest that the sediments of the Inner Saronikos Gulf, especially at Station S11, are coarser than those of Elefsis Bay. It is noteworthy that the Al content at Station S2 decreases from a 15-cm depth upwards, whereas the TOC, an indication of pollutant loads, increases significantly.
According to the sedimentation rates (Table 2), it is estimated that the preindustrial (before 1900s in this study area) sediment layers lie below 13 cm, 29 cm, 70 cm, and 9 cm deep at Stations S1, S2, S7, and S11, respectively. The vertical profiles of the total 210Pb activity are shown in the Supplementary Materials (Figure S1), while the calculated sedimentation rates in the study area are shown in Table 2, along with previously published rates for comparison.

3.2. Total Metal Concentrations Normalized to Al

The vertical distribution of the total concentrations of the thirteen metals analyzed at the four different sampling stations are given in the Supplementary Materials (Figure S2), while the vertical distributions of the metal’s concentrations normalized to Al are shown in Figure 3, revealing notable differences between Station S7 and Stations S11, S1, and S2.
The total metal concentrations of V, Cr, Co, Cu, Zn, As, Ag, and Cd at Stations S1 and S2 showed similar variations and vertical distribution patterns. The Cu, Zn, Cd, Pb, and Mo concentrations increased sharply in the upper 15-cm sediment layer at both S1 and S2 stations. This increase, however, was suppressed when the metal concentrations were normalized to Al, except for Mo and Zn, to a lesser extent. Likewise, the total metal concentrations at Station S11, although generally lower than those at all the other stations, did not differ significantly when normalized to Al due to the coarse character of the sediments.
As the preindustrial sediments in the S2 and S7 cores were not actually sampled, due to the short length of these cores, the bottom layers of S1 and S11 were used in the estimation of the background metal concentrations for Elefsis Bay (S1 and S2) and the Inner Saronikos Gulf (S7 and S11), respectively. Table 3 shows the metal concentrations that were used as background values in this study compared to the background concentrations given by Karageorgis et al. [13].

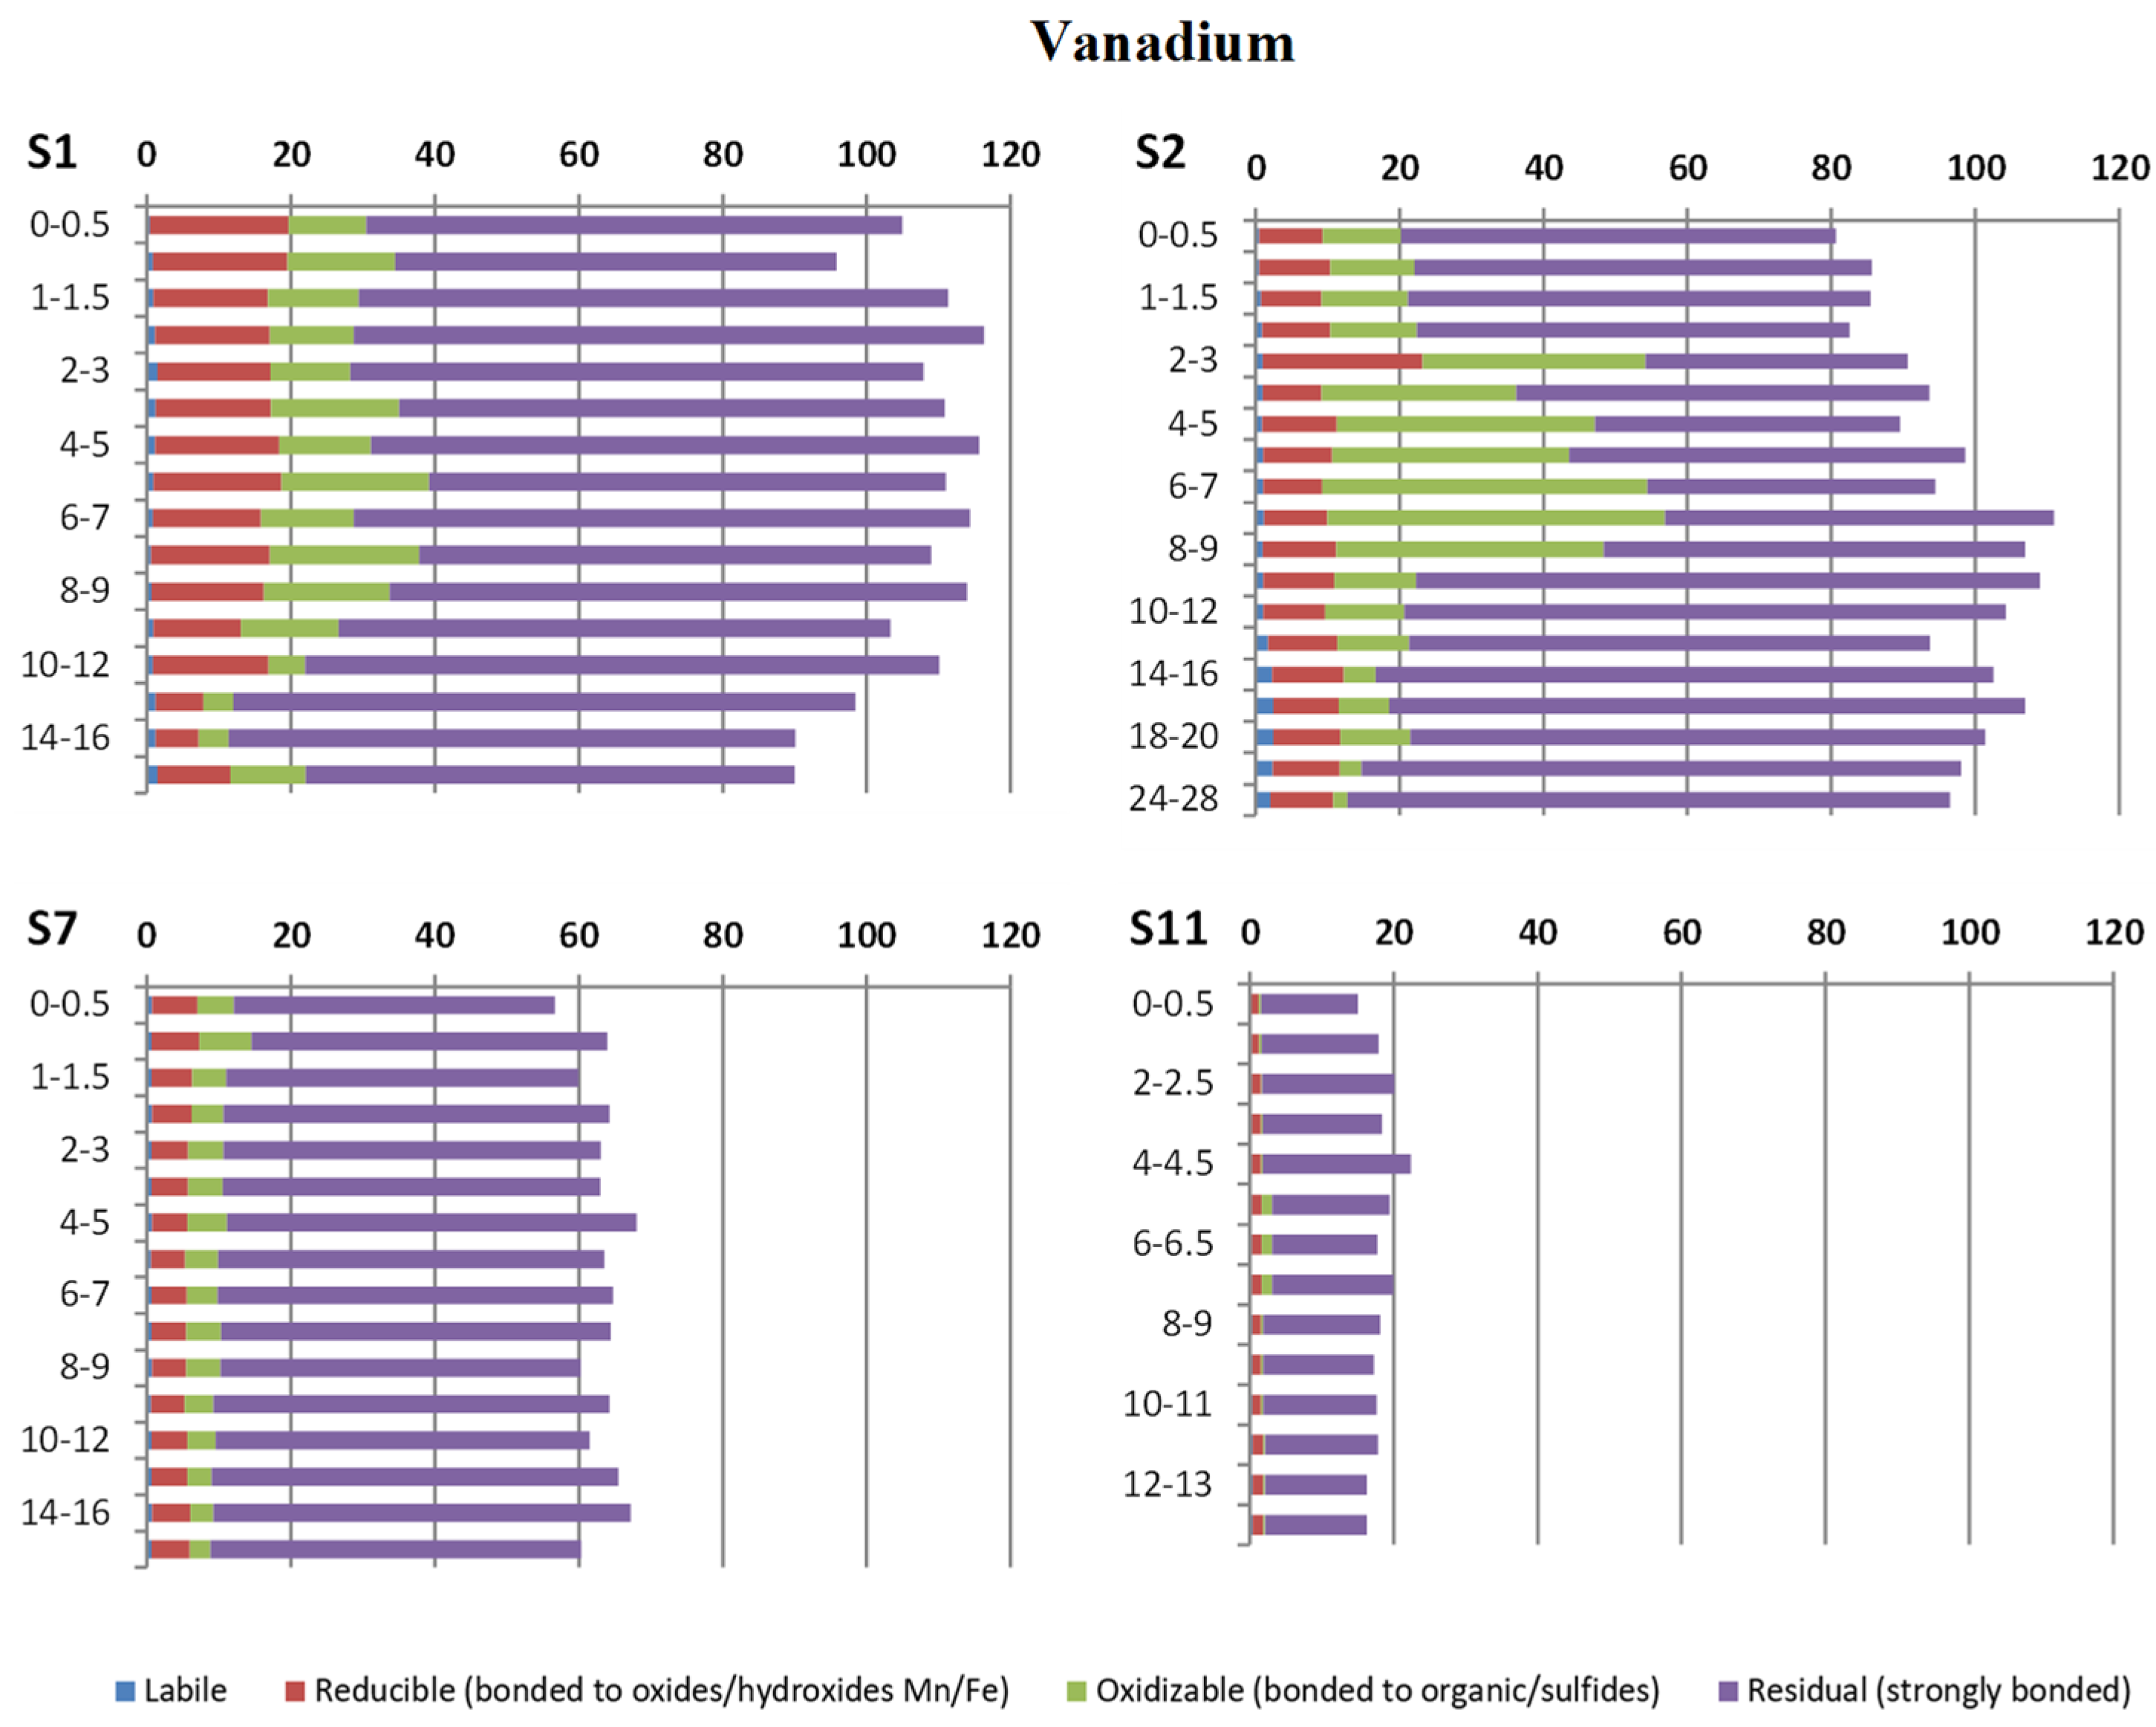
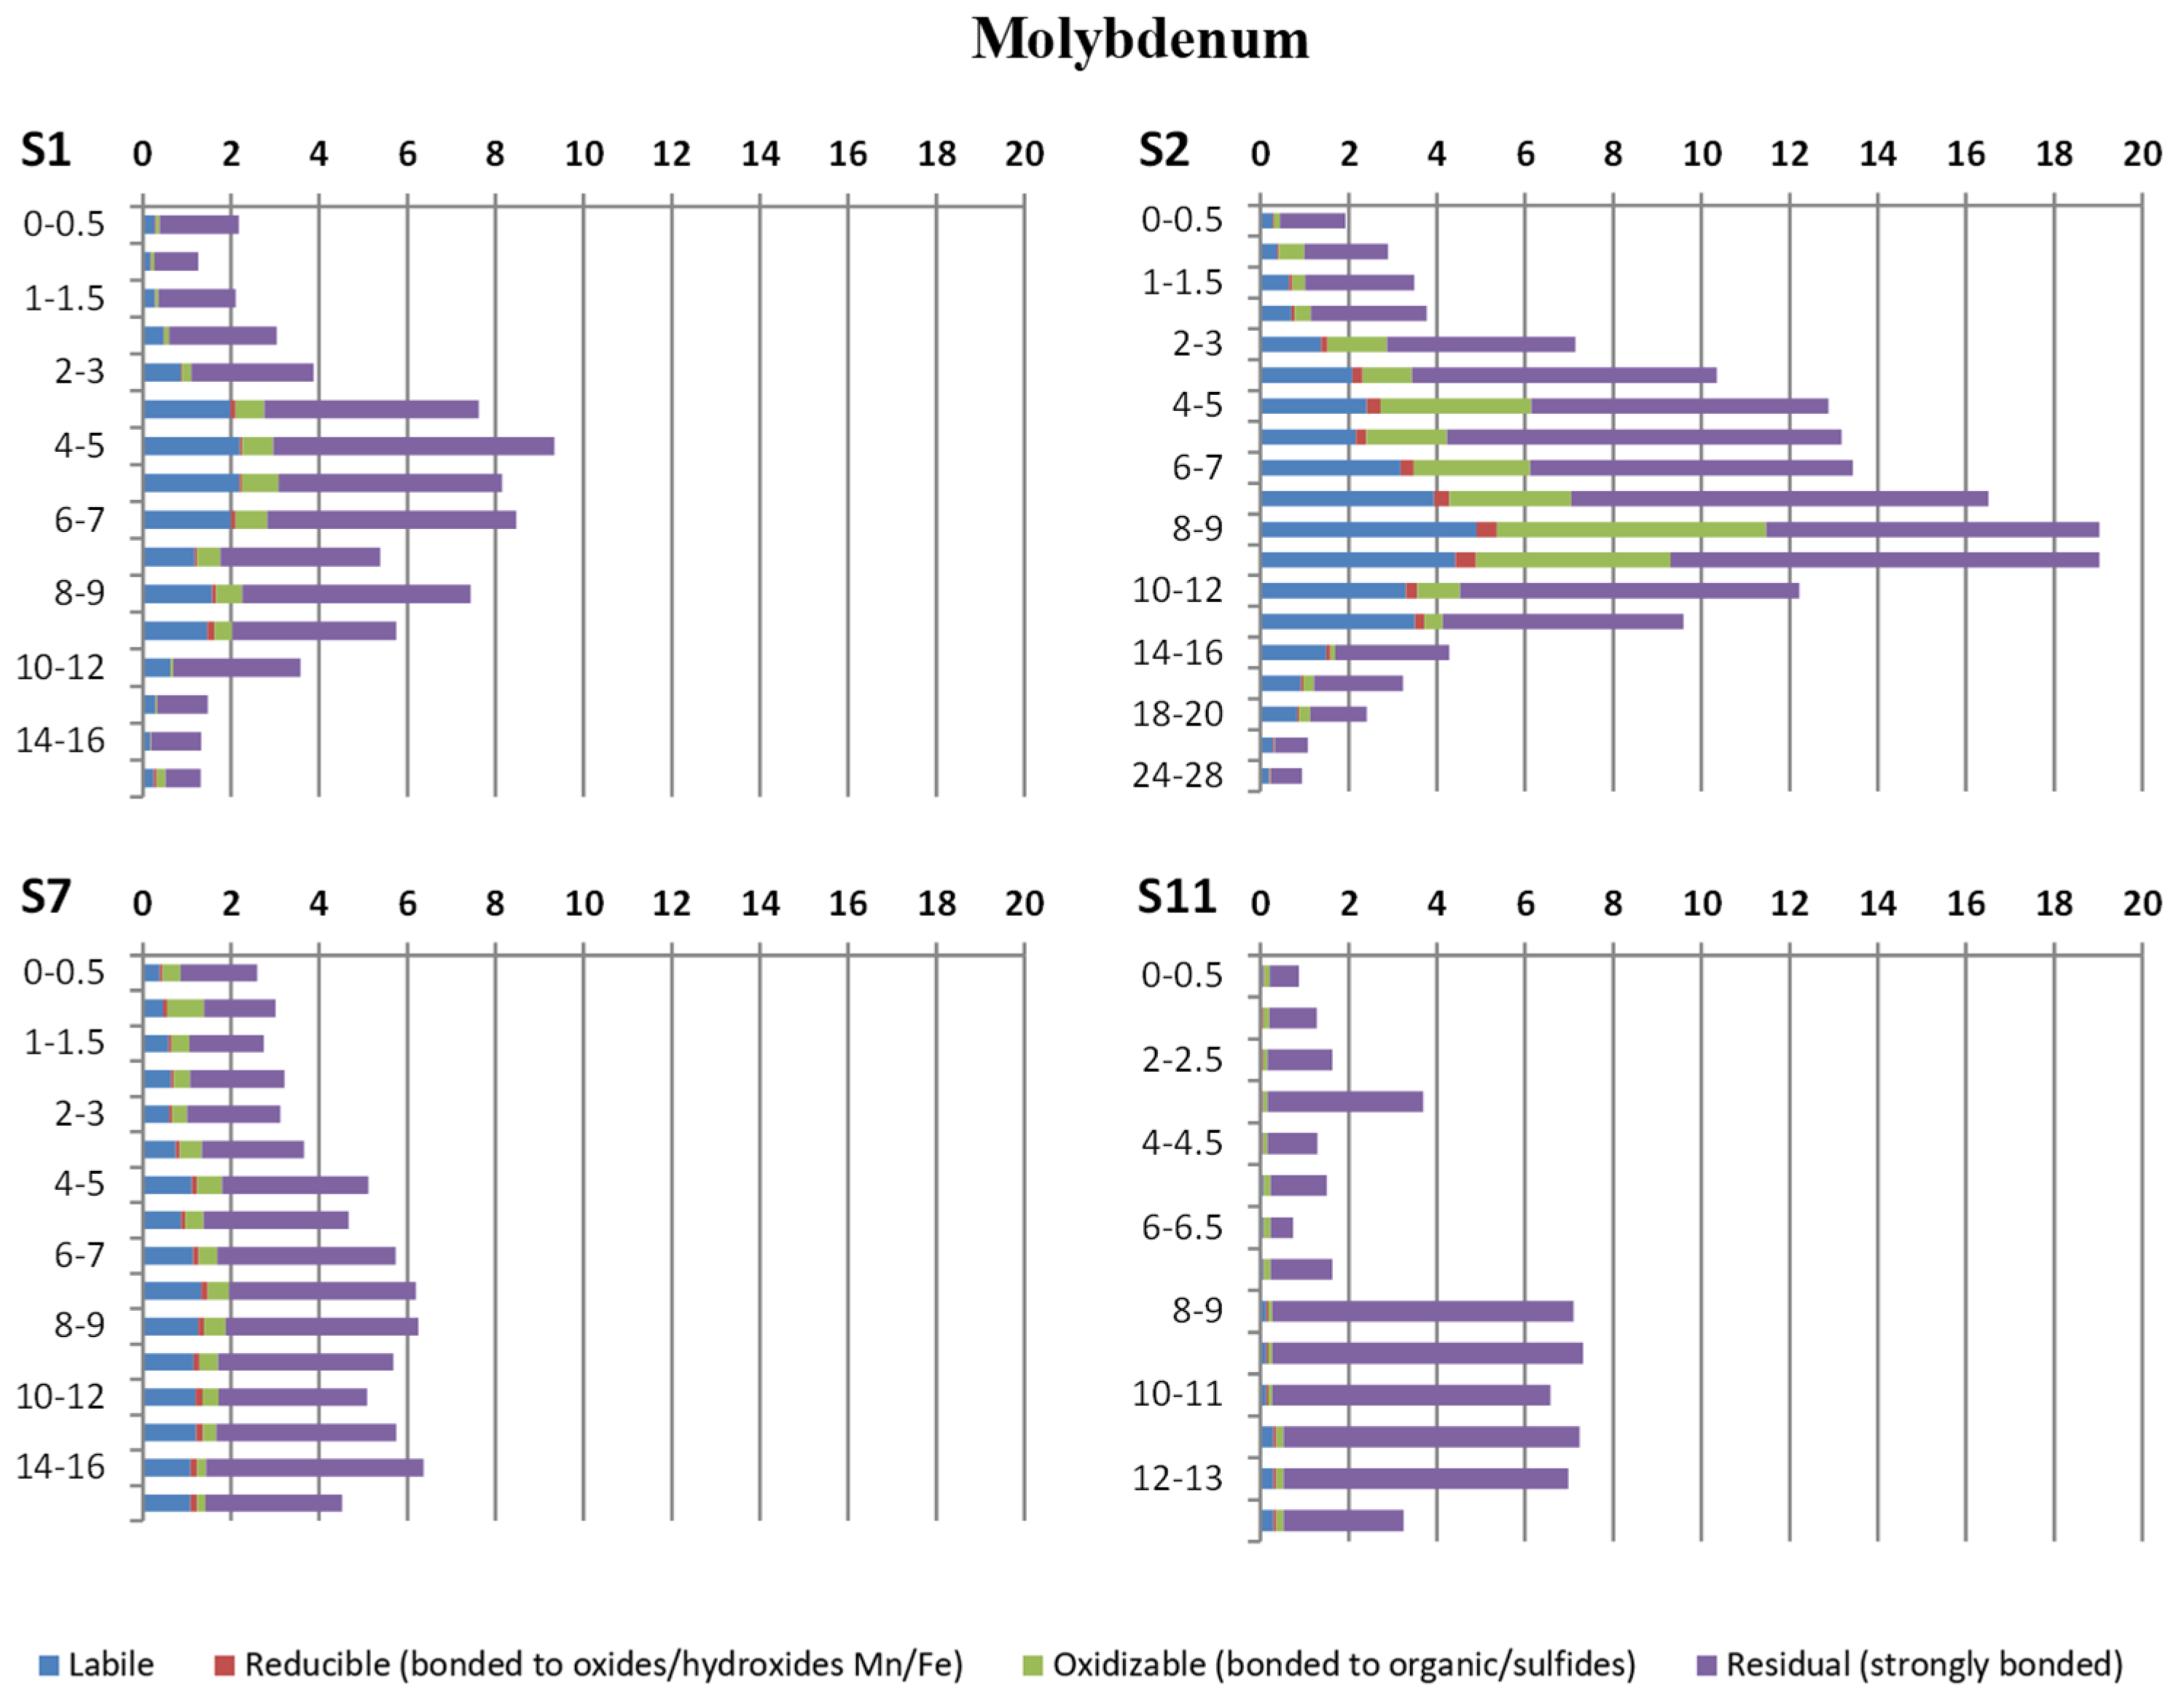
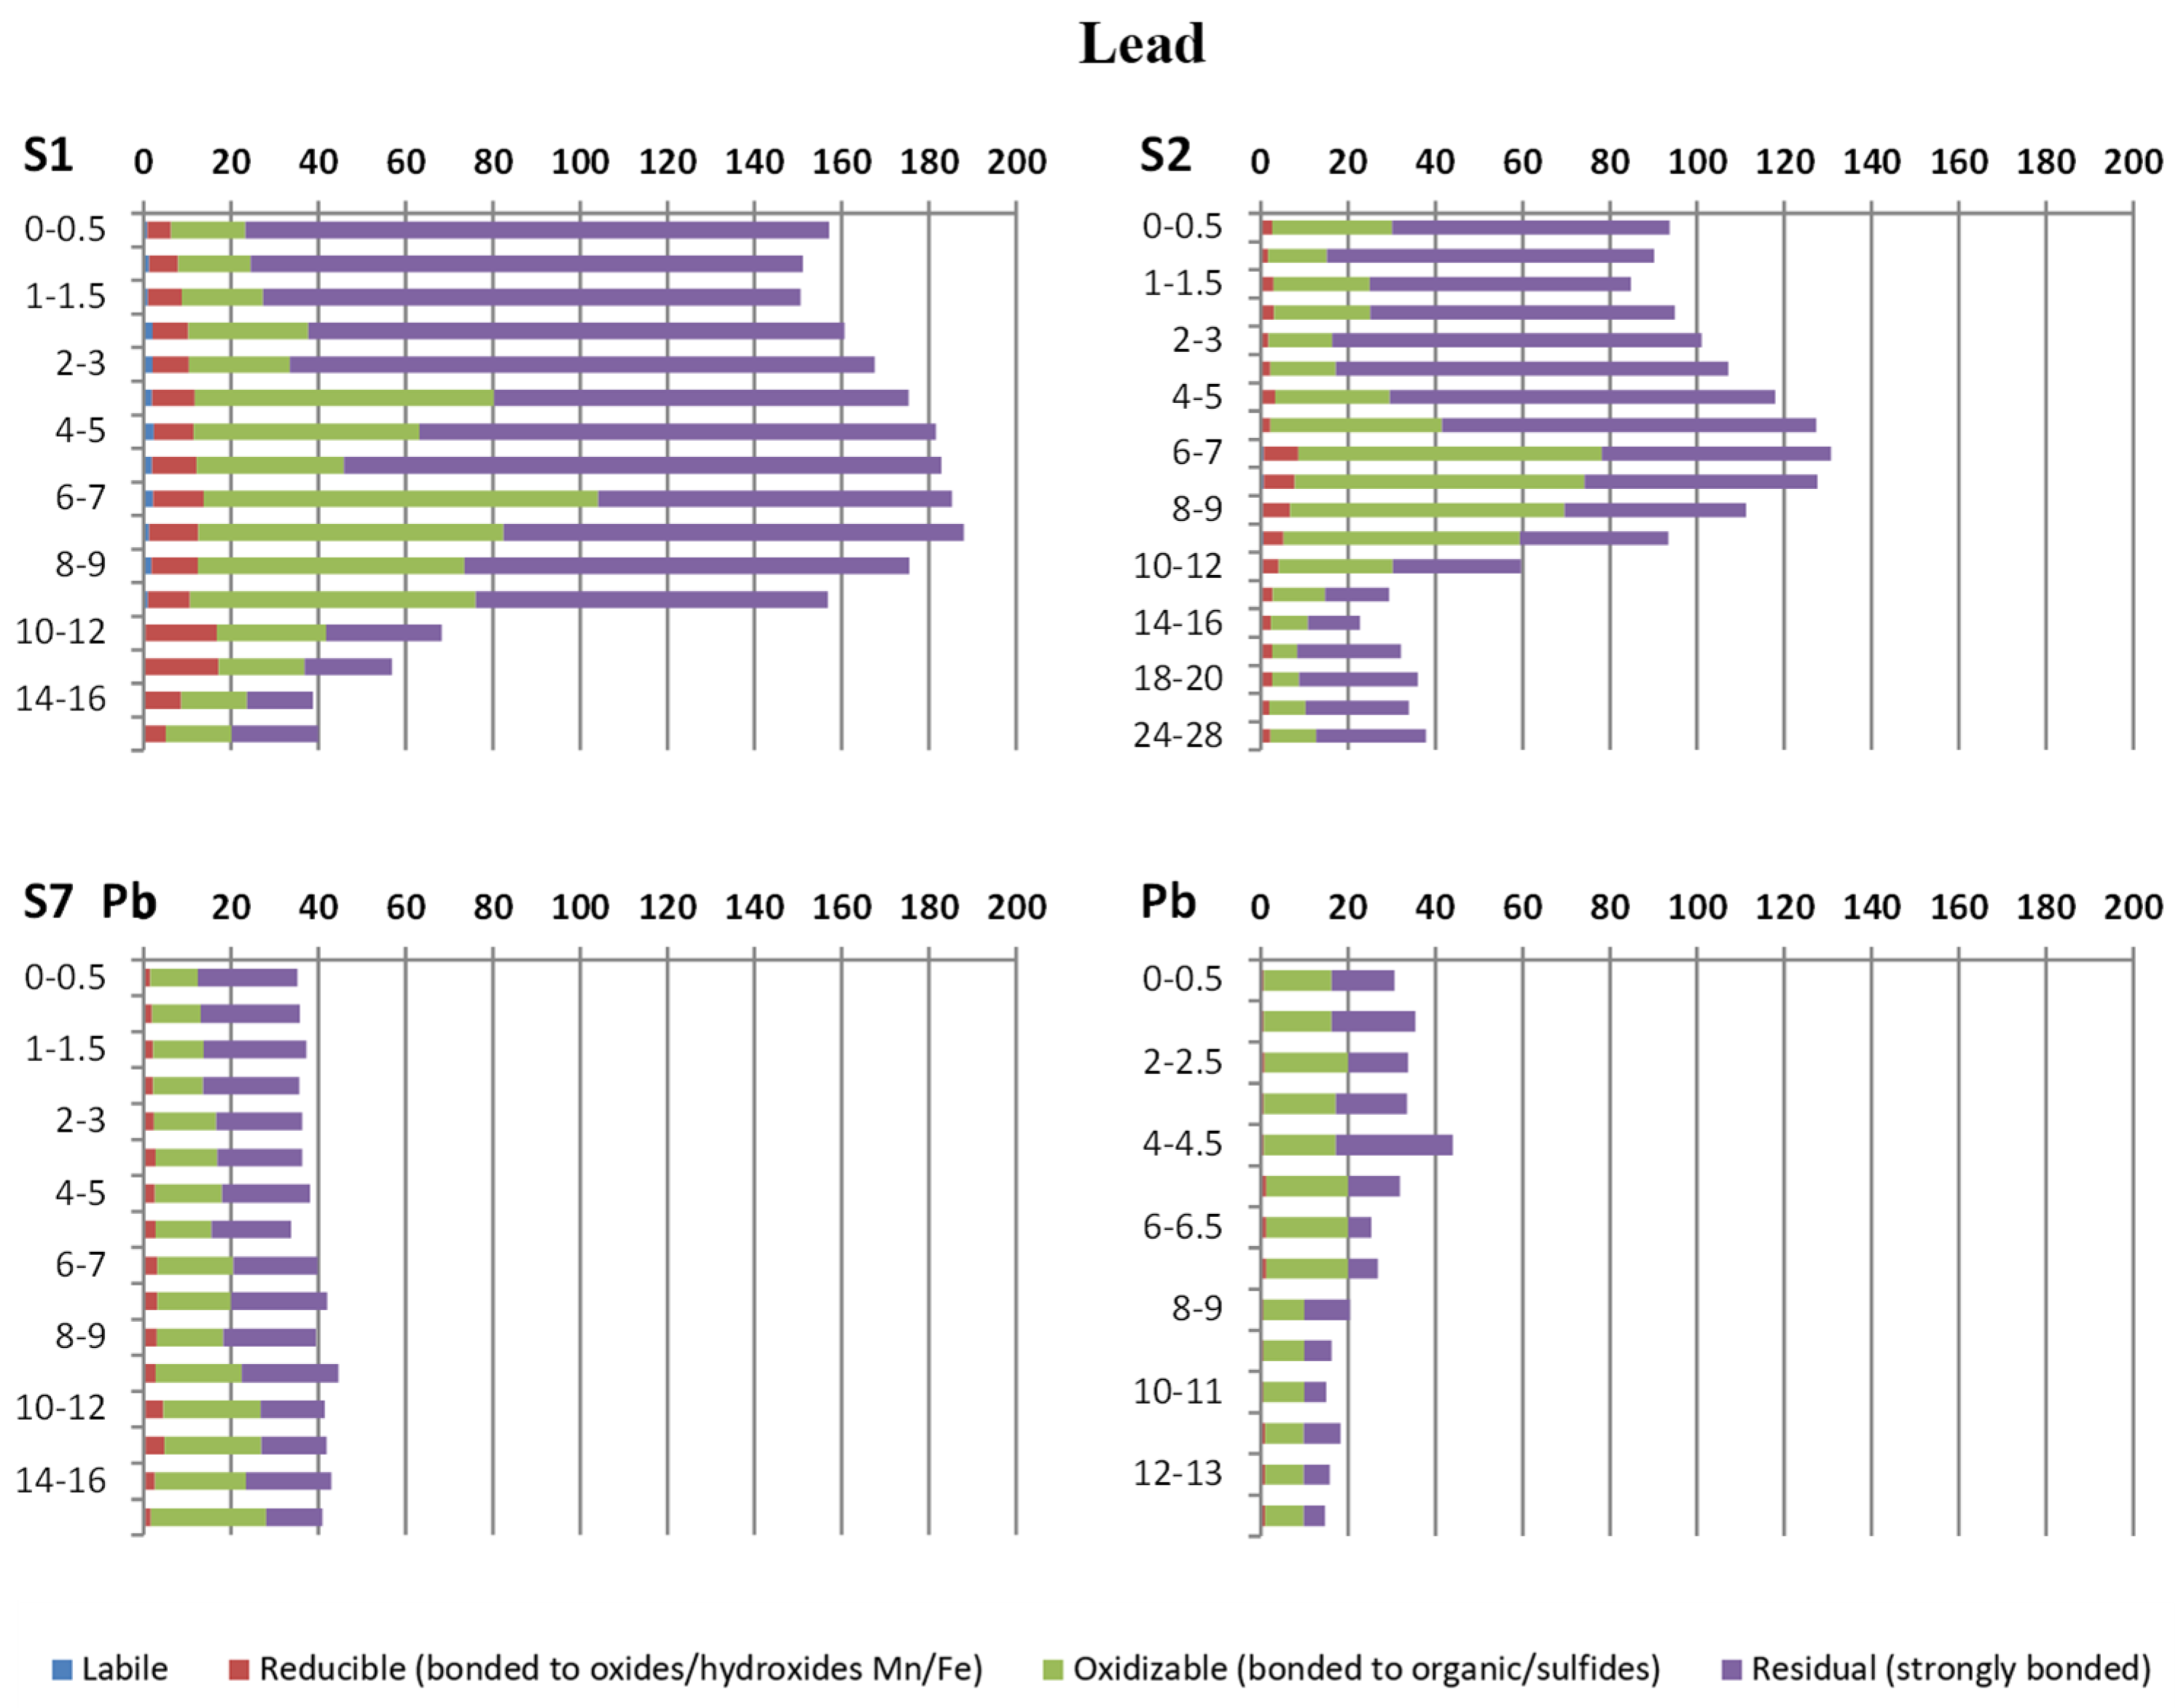
3.3. Chemical Fractionation of Metals

The vertical distributions of the selected metal (V, Cu, Zn, Mo, Cd, and Pb) fractions are presented in mg/kg (Figure 4, Figure 5, Figure 6, Figure 7, Figure 8 and Figure 9) and not in percentage shares, as usually done in the literature. This choice was made to help visual comparisons among the four stations. The vertical distributions of Fe, Mn, Co, Ni, and Cr in mg/kg, along with the percentage share of each fraction for all the metals and stations, are given in the Supplementary Materials (Figures S3–S7 and Table S4). In general, V, Cr, Cu, Fe, Ni, and Pb presented negligible labile fractions throughout the cores at all stations. At Station S11, the residual fraction of all metals, except Pb, prevailed.
Vanadium presented elevated concentrations in the reducible (bound to Fe/Mn hydroxides) and oxidizable (bound to organic substances) fractions at depths down to 10 cm at Stations S1 and S2. Especially at Station S2, the oxidizable fraction was pronounced between 2 and 9 cm. At Stations S7 and S11, the residual fraction of V prevailed.
Copper appeared equally distributed in the reducible and oxidizable fractions at the upper 2 cm of core S1, with the reducible fraction being replaced by the residual below 3 cm. The three bioavailable fractions in total reached 89.8 mg/kg in the surface layer (0 to 1 cm). At Station S2, approximately one-third of the Cu content was bound on organic substances (oxidizable) in the upper 9 cm, showing a sharp decrease below this depth. The residual fraction of Cu prevailed throughout core S2. At Station S7, the distribution between the oxidizable and the residual fractions was almost stable downcore.
Zinc was almost exclusively in bioavailable fractions at Station S1, with a dominating reducible fraction in the upper 10 cm. At Station S2, the sum of the bioavailable fractions increased from the surface down to 8 cm deep, where it reached its maximum, revealing that, in this sediment horizon, the residual fraction of Zn was less than 10% of the total metal concentration. At Station S7, the labile and the reducible fractions of Zn were quite homogenously distributed throughout the core, and the oxidizable fraction dominated below the depth of 7 cm.
The chemical fractionation of Mo was dominated by the labile and the residual fractions. The labile fraction was quite consistently present throughout the S7 core, while, at Stations S1 and S2, it was more prominent between 3 and 12 cm deep. The oxidizable Mo fraction appeared mainly at Station S2 between 2 and 10 cm deep.
The fractionation of Cd in the two stations of Elefsis Bay (S1 and S2) was remarkably similar, characterized by a high labile fraction and a dominant reducible fraction. At Station S7, approximately half of the total content was bioavailable and almost equally distributed between the first three fractions and the remaining half residual.
Finally, in the case of Pb, similarly to other metals, a small percentage of the reducible fraction was found at Station S1. In all four cores, a significant amount of Pb was found in the oxidizable fraction. At Stations S1 and S2, the residual phase prevailed, with pronounced oxidizable contents at approximately 3 to 10 cm deep. At Station S7, Pb was almost equally distributed between the oxidizable and reducible phases, and at Station S11, unlike any other metal, the oxidizable Pb fraction prevailed.

3.4. Pollution and Risk Assessment

The EFs were plotted against time, assuming that the sedimentation rate in each station was constant. This assumption of a minimal depositional variability has been accepted previously by other researchers [13,65,66] who studied the evolution of metal pollution in relation to the industrial history of the area due to the intense urbanization of the surrounding land and the lack of major rivers.
Τhe vertical distribution of the EFs of Cu, Zn, As, Mo, Cd, and Pb vs. time (Figure 10) has shown a significant increase since the early 1910s in the eastern part of Elefsis Bay (S1), while in the western part (S2), the enrichment of the sediments started in the second half of the 20th century. The same evolution in time was also shared by the organic material (TOC). The metal enrichment in the Inner Saronikos Gulf is significantly higher in sediments affected by the WWTP on Psyttalia Island and Piraeus Port (S7). It is noteworthy, however, that enrichment has been declining since the 2000s. The sediments at Station S11 seem to be less affected, supporting the argument that the metal pollution of the seafloor sediments of the Inner Saronikos Gulf is rather a local issue that does not affect the greater area of the gulf.
According to the SQGs (Table 4), the Cr, Ni, Cu, and Pb concentrations in the western basin of Elefsis Bay (S2) and Ni and Pb in the eastern (S1) exceeded the PEL level, whereas in the vicinity of the WWTP (S7), Cr, Ni, Cu, Ag, and Pb were found well above PEL. At the S11 station, Ni, As, Ag, and Pb were measured above TEL and below the PEL level, while Cr, Cu, Zn, and Cd were found below TEL.
According to the RAC, most metals pose no or a low toxicity risk. Zn was found to pose a medium risk at Station S7, and Mo was also categorized as a medium risk both at Elefsis Bay (S1 and S2) and the S7 station. The only metal that was found to pose a high toxicity risk was Cd at the two stations of Elefsis Bay. Table 5 presents the classification of toxicity risk according to the RAC and SQGs indices for all metals and all stations.
Since the study of the chemical fractionation of Ag and As was not possible in this work due to analytical limitations, there was no indication of the bioavailable fraction of these two metals in the sediments; thus, the RAC indicant could not be applied for them. In addition, as previously mentioned, PEL and TEL concentrations for Fe, Mn, V, Co, and Mo have not yet been established, and therefore, there are no standard SQGs for these metals.

4. Discussion

4.1. Elefsis Bay

The sedimentation rates in Elefsis Bay indicated a different supply of sedimentary materials between the eastern and western basins while in line with previously published estimations [13,64,65]. The dating of sediment cores using the assumption of constant sedimentation was found to be consistent with known anthropogenic activities in the area, such as the beginning of industrialization in the early 1910s on the east coast (S1) and in the 1950s on the west coast (S2). In the western basin, dredging of sediments that took place in the late 1960s (personal communication with the Municipality of Elefsis) is marked in the 10–15-cm-deep layer of the core by an abrupt increase of porosity and decrease of Al content. The characteristics of the sediments after the 1970s were changed quantitatively and qualitatively due to the industrialization of the area and the intensive urbanization, which changed the inflow of suspended matter. This change, however, did not mask the significant increase of TOC and pollutants, as it coincided in time with the intensification of the polluting activities on the coast. The remarkable enrichment in TOC since the beginning of the 20th century in the eastern part (S1) and the four-fold increase at a 5-cm depth in the western basin (S2) correspond not only to the evolution of the industrial activity but also the intense urbanization of the coast [12,64]. This is also observed for many of the trace metals. A major cement production plant started operating on the eastern coast in 1902 [67], and a gradual establishment of many other types of industries, listed in the introduction, continued throughout the 20th century. The maximum industrial activity (1950–1990) in the entire Elefsis area can explain the main features of the metal fractionation in sediments (Figure 4, Figure 5, Figure 6, Figure 7, Figure 8 and Figure 9), as well as the time distribution of the EFs (Figure 10).
The much higher oxidizable fraction of V at Station S2, between 2 and 9 cm deep (Figure 4), is attributed to the proximity of the two major oil refineries operating on the coast, as V originating from oil refineries is mostly bound on organic substances [68]. The maximum EFs of V at Stations S1 and S2 (1.4 and 1.7, respectively), dated in the 1980s, show minor modifications of the sediments. Similarly, minor modifications are also attested by the EFs of Cr, Ni, and Co in Elefsis Bay (Figure 10). Previous studies have shown that this area is naturally enriched in Cr, Ni, and Co because of the widespread occurrence of basic and ultrabasic rocks [69,70,71]. Thus, the local geology is also a controlling factor of the distribution of these three metals, making the fractionation analysis crucial in order to distinguish the anthropogenic inputs of Cr, Ni, and Co. The bioavailable fractions of these metals were found to be higher in the eastern basin (S1), indicating the higher anthropogenic impact there. The high residual Ni in Western Elefsis Bay (S2) implies that this part of the bay is naturally more enriched in Ni compared to the eastern part. However, the Ni EFs that were calculated based on the bottom layer of Station S1, which was used as the background for the whole of Elefsis Bay, could have been overestimated. Karageorgis et al. [13] measured a higher background concentration for Ni in Western Elefsis Bay (Table 3).
The maximum EFs for Cu, Zn, Cd, and Pb during the 1980s (7.8, 6.9, 6.0, and 5.0, respectively) (Figure 10) revealed severe modifications of Elefsis Bay sediments attributed to the operation of the cement production plant [68], as concluded also by Karageorgis et al. [13]. However, after about 1990, it became apparent that the environmental situation in Elefsis Bay was slowly improving, as the metal enrichment of sediments gradually decreased. This observation is consistent with previous studies [13,19,22]. The only metal that did not show a clear decreasing trend was Cu, as observed also in previous studies [37,72,73], while it still poses a significant environmental risk in the area. The chemical fractionation of Cu revealed that, although the total concentrations were similar between the two stations, the reducible fraction in the eastern station (S1) was increased in the upper 4 cm of the core, which was not apparent in the western station, where Cu was found only in the oxidizable and residual fractions. Similar results were seen for Zn, with the reducible fraction prevailing in the upper 10 cm of the core in the eastern basin (S1). This difference reveals the different sources of Cu and Zn between the two parts of the bay, which could be revealed only through the determination of the total metal concentrations. As far as Cd is concerned, the sum of the three bioavailable Cd fractions (labile, reducible, and oxidizable) reached 90% of the total metal content in both stations, revealing the anthropogenic origin of Cd inputs in the whole basin.
Interestingly, Pb enrichment seemed to increase during the last decade. Given the fact that Pb inputs are strongly related to atmospheric fine particles [74], this could be the fingerprint of the radical deterioration of air quality due to extended residential biomass burning, particularly wood, for heating purposes as a result of the economic recession in Greece since 2008 [75,76,77].
The maximum Mo EFs in S2 and S1 (17 and 7.0, respectively) in the 1980s showed a very severe modification of the sediments. Mo is strongly related with shipyard activities, especially military, due to its extended use to create high-strength steel alloys, as well as with oil refineries, due to its use as a catalyst [78]. Thus, coastal anthropogenic activities, especially in the western part of the bay, seem to be responsible for the significant Mo enrichment of the sediments. However, Mo is also a redox-sensitive element (RSE). Various authors have pointed out that contradictory and inconsistent conclusions from RSE distributions in sediments can result from the lack of known mechanisms of accumulation and/or remobilization of RSEs [79,80,81]. Under oxic conditions, Mo remains soluble in pore water (mainly as a molybdate, MoO42−) while it precipitates (or adsorbs) under anoxic conditions. As Mo removal from pore water is strongly associated with the balance between Fe and sulfate reduction [82], sedimentary Mo has been widely used as an important proxy for past redox conditions [80,81]. In the case of Elefsis Bay, seasonal anoxic and hypoxic phenomena are recurring, when the organic matter inputs are high and the overall condition of the ecosystem has been categorized as “bad”, according to the Eutrophication Index (E.I.) [22]. These phenomena of anoxic conditions were more intense between the 1960s and 1980s due to the sharp increase of organic matter (Figure 10) in the western part of the bay (S2). Although the anthropogenic inputs of Mo were probably higher in the eastern basin (S1), Mo most likely escaped precipitation due to the toxic conditions that prevailed there.
At both stations, the As content of the sediments has increased since the beginning of the 20th century, reaching its maximum in the 1980s, while it has decreased afterwards, reaching the background level in the surface layer. The maximum EFs of As at the S1 and S2 stations (2.4 and 2.9, respectively) classify the modification of the sediments as minor. This implies that As inputs in Elefsis Bay are not related to the industrial activities on the coast, but mainly, they originated from As-based pesticides, herbicides, and insecticides that were widely used during the 20th century, with maximum use in the 1980s before the prohibition of their use due to the high toxicity of As and its compounds [82,83].
The total Ag concentrations showed a minor modification of the seafloor sediments in the eastern basin (EFmax = 2.2) and a moderate modification in the western part of the bay (EFmax = 4.8). Silver is a geologically rare element, and thus, natural sources are virtually absent in coastal and estuarine waters [34]. Therefore, the enrichment seen in the sediments is clearly related to the anthropogenic activities.
Comparing the results from the two risk assessment indices (Table 5), it becomes obvious that, according to RAC, Cd is the only metal that poses a high toxicity risk at both stations of Elefsis Bay, but according to the SQGs, Ni poses a high risk at both stations, while Pb poses a high toxicity risk only at Station S1, and Cr and Cu pose a high toxicity risk only at Station S2. These opposing results indicate the complexity and challenges faced when studying the potential toxicity risk of metals in sediments and the environment in general. The review of Birch [52] discussed that each of the 19 established pollution indicators can provide partial information on the potential metal toxicity, and thus, they have certain limitations when applied. The use of both RAC and SQG and the combination of these indicators with EFs make it more effective to assess the potential environmental risks in terms of both the total concentration and bioavailability.

4.2. Inner Saronikos Gulf

The results from the two stations in the Inner Saronikos Gulf showed that the anthropogenic impact is much higher at Station S7, which is closer to the major pollution sources. The relatively high sedimentation rate calculated in this core (Table 2), along with its short length (18 cm), proved to be a limitation of this study, since the deepest sediment layer of the core dates from 1985 at the earliest, depriving it of the possibility of making a record of the oldest anthropogenic activities in the area. Nevertheless, the deepest sediment of the core is dated 9 years before the WWTP became operational in 1994. A similar sedimentation rate was also found by Iliakis [64]. The relatively sharp increase in Al, dating to the late 1990s (from 7 to 2 cm in depth—Figure 2), is related to the inflow of fine suspended materials of primarily treated wastewater from the WWTP [84]. Subsequently, from the 2000s, the sedimented material became coarser (decrease of Al) as the secondary treatment of wastewater came into operation [15]. Sedimentary organic matter also followed a steady increase until the early 2000s, associated with semi-treated wastewater, with a stable content since then (Figure 10) due to the continuous inflows of urban wastewater and intense maritime traffic in the area.
The time-dependent distribution of EFs of Cr, Co, Ni, Cu, Zn, As, Cd, and Pb at Station S7 revealed elevated inputs between 1980 and 2000, which decreased after 2000 until the 2010s (Figure 10). This substantial reduction of EFs in the first decade of the 21st century could be a result of the implementation of environmental policies. However, the reducing trend of the metal enrichment is reversed after 2010, although not associated with increased metal concentrations in the same sediment layer (Figure S7). It could be observed that this increase of the EFs resulted from the combination of two factors: the stable metal inputs and the decrease of the Al content of the sedimented material during the past decade (Figure 2). Nevertheless, the metal EFs showed that the surface sediments are minorly modified due to Co and Ni (EF 2.0 and 2.1, respectively), moderately modified due to Cr and As (4.9 and 3.1, respectively), severely modified due to Cd and Pb (5.5 and 9.6, respectively), and very severely modified due to Cu and Zn (11.5 and 13.1, respectively). Karageorgis et al. [13] also characterized the surface sediments south of Psyttalia Island as severely polluted, while no reducing trend was observed.
Station S11 seems to have been affected in the past by intense marine transport to either Piraeus Port or the Kifissos River estuary to the northeast. The vertical distribution of TOC and the time-dependent distribution of Cr, Co, Ni, Cu, Zn, Cd, and Pb EFs evidenced the pollution footprint of the period between the 1950s and the early 1970s (Figure 10), when Kifissos River could have acted as a prominent pollution source. The distribution of the chemical fractions revealed that all the metals, except Pb, were strongly bound to aluminosilicates (residual fraction). Pb was found to be mostly bound to organic substances (oxidizable fraction), suggesting that Pb inputs in the area originated mostly from urban pollution (Figure 4, Figure 5, Figure 6, Figure 7, Figure 8 and Figure 9).
The total V concentrations were almost three-fold higher at Station S7, compared to S11, with a low variability downcore at both stations, ranging between 57.0 and 68.0 mg/kg at S7 and below 20 mg/kg at S11 (Figure S2). Kalogeropoulos et al. [68] postulated a near two-fold enrichment in anthropogenic V in the 1990s in the Inner Saronikos Gulf by estimating an average background V concentration at 30 mg/kg. In this study, the estimated background V content was 16.2 mg/kg (Table 3). The time-dependent distribution of the V EFs revealed the highest levels from the 1980s until the 2000s, like all the other metals, whereas, at Station S11, the EFs ranged around 1 throughout the core (Figure 10). The bioavailable fractions (reducible and oxidizable) of V at Station S7 presented an insignificant increasing trend over the years, while, at Station S11, only the labile forms of V were slightly increased the mid-century (1930–1960). Nevertheless, the residual fraction prevailed in both cores. This unexpectedly high residual fraction of a metal of anthropogenic mainly origin has also been reported for As by Angelidis and Grimanis [85], who argued that the high residual As fraction in the same area could be attributed to the solid waste discharges of the fertilizers plant in the vicinity of Piraeus Port in Drapetsona (Figure 1), which, according to Kalogeropoulos et al. [68], released solid wastes rich in trace metals such as Ag, As, and V. The reduction of V EFs after the 2000s is attributed not only to the better treatment of the wastewater in the WWTP but also to the permanent shutdown (in 1999) of the fertilizer production plant in Drapetsona that was assumed as one of the main V sources in the area [68]. Vanadium, however, is a pollutant that needs more attention in the coming years. Moreover, since V can be used also as an indicator for the monitoring of oil pollution [86], the results of this work will be valuable for the long-term environmental impact assessment of the oil spill accident that took place in 2017 in this area.
A remarkably high enrichment in Ag was measured for the Station S7 sediments, where the maximum EF (10.1), revealing very severe modification of the sediments, was measured after 2000. The time-dependent distribution of the Ag EFs showed a dramatic increase of the Ag inputs between 1980 and 2000 that was followed by a decade of decreasing trend, which, however, was reversed after 2010. Compared to the Ag background concentration in the Inner Saronikos Gulf (0.41 mg/kg), the Ag concentration in the 2000s was more than 12 times higher (5.10 mg/kg). Furthermore, according to the SQGs (Table 5), the surface sediments at Station S7 pose a high toxicity risk to marine organisms. These high concentrations of Ag at Station S7 could be attributed to three possible sources: (a) rich in Ag solid discharges of the fertilizer plant in Drapetsona, (b) urban and industrial (mainly pharmaceutical) wastes not properly treated in the WWTP, and (c) the possible use of AgNPs in the WWTP itself. AgNPs have gained major attention in the field of wastewater remediation strategies, as their antibacterial properties and enhanced adsorption capacities make them valuable alternatives in removing contaminants from wastewater bodies [87]. On the other hand, Hu [88] argued that the accumulation of Ag in activated sludge could have a detrimental effect on the anaerobic digestion of wastewater treatment if the total Ag concentration in wastes reaches the threshold levels (0.1 mg/L). These results make the need for the knowledge of Ag distribution between the different chemical fractions even more urgent, as the bioavailability and toxicity of Ag are highly determined by the chemical bonding of Ag to the sediment [89]. The toxicity of various forms of Ag and AgNPs is mainly attributed to the release of Ag(I) ion, which can be bound to various molecules of the sediment, such as clay minerals, Fe (hydro)oxides, and organic matter [90]. Given that Ag is an emerging pollutant of great environmental concern, which is strongly related to medical and personal care products, and that the pharmaceutical industry activities in the greater area of Athens are intense [91], this study highlights that the environmental management regarding Ag in Saronikos Gulf should be a priority in the coming years.
At Station S11, Ag concentrations were also elevated in the upper 10 cm of the core. The time-dependent distribution of the EFs showed that the Ag inputs started in the 1960s, with a dramatic increase between the 1980s and 1990s, which are highly toxic to marine organisms.
According to the RAC (Table 5), Mn, Zn, and Mo pose medium toxicity risks at Station S7, while, at Station S11, the same indicators showed that there was no potential toxicity risk from the metals studied, as the labile fraction of all the metals was negligible. According to the SQGs (Table 5), at Station S7, Cr, Ni, Cu, Ag, and Pb pose a high toxicity risk while Zn, As, and Cd pose a medium risk to marine organisms. Based on the same criteria, the Ni, As, Ag, and Pb concentrations in the surface sediments of Station S11 pose a medium risk for toxicity to marine organisms.

5. Conclusions

The results of this study revealed the different sources of metal pollution in the Saronikos Gulf. As expected, stations closer to the main sources were impacted the most. The impact was found greater at the two stations in Elefsis Bay and the station near the WWTP of Athens on the Island of Psyttalia, in line with studies that showed that severe metal pollution in the Saronikos Gulf is rather a local phenomenon.
Although, the overall metal pollution in the Elefsis Bay seafloor sediments, seen through the evolution of EFs, was found to be following a decreasing trend since the 1990s, metals such as Cd, Pb, Ni, Cr, and Cu still pose a high toxicity risk to marine organisms. In the eastern part of the bay, a high toxicity risk is posed due to Ni and Pb concentrations while, in the western basin, due to high concentrations of Cr, Ni, and Cu. In the case of Cd, the total concentrations of the surface sediments are not considered hazardous to aquatic organisms. However, the bioavailable fractions of Cd reached 90% of the total metal content, with the labile fraction reaching 44%, classifying Cd as a high toxicity risk for the benthic environment of Elefsis Bay.
The northern part of the Inner Saronikos Gulf, near Piraeus Port and the WWTP of Athens, was found to have a high degree of metal pollution during the 1980s and 1990s, which resulted in severe modification of the sediments due to Cd and Pb concentrations and very severe modifications due to Cu and Zn. The EFs were found to be declining between 2000 and 2010, but for most metals, these trends seemed to be reversed after 2010. Continuous monitoring is needed in order to determine if this increasing trend was due to increased metal inputs or changes in the sediment characteristics.
Although the metal pollution was found to be greater near pollution sources, the results clearly showed that even the central part of the Inner Saronikos Gulf had a noticeable enrichment in Cu, Ag, Cd, and Pb. The time-dependent distribution of the EFs of these metals showed the effect of intense industrial activity on the banks of the Kifissos River between the 1950s and 1970s. Ni, As, Ag, and Pb in the surface sediments were found to be of medium toxicity risk to marine organisms.
This study also highlighted the urgent need of the management of Ag, especially in the Inner Saronikos Gulf, where Ag sediment enrichment was found to be remarkably high. Given the fact that Ag is not included in the metals that are traditionally monitored and that it is an emerging pollutant strongly associated with wastewater treatment, immediate attention should be given to identify and control the sources of Ag contamination in the area. Moreover, as the high toxicity of Ag and AgNPs is evidenced, special attention should be given to the study of Ag chemical fractionation, bioavailability, and bioaccumulation in order to assess the ecological impact of Ag in the marine environment.

Supplementary Materials

The following supporting information can be downloaded at https://www.mdpi.com/article/10.3390/jmse10030376/s1: Figure S1: Total activity of 210Pb (dpm/g) of the sediments from Elefsis Bay (S1 and S2) and the Inner Saronikos Gulf (S7 and S11). Figure S2: Vertical distribution of the metal concentrations (mg/kg) at the S1, S2, S7, and S11 sampling stations. Figure S3: Chemical fractionation of Mn in sediments from the S1, S2, S7, and S11 stations. Horizontal axis: concentration (mg/kg). Vertical axis: core depth (cm). Figure S4: Chemical fractionation of Fe in sediments from the S1, S2, S7, and S11 stations. Horizontal axis: concentration (% w/w). Vertical axis: core depth (cm). Figure S5: Chemical fractionation of Co in sediments from the S1, S2, S7, and S11 stations. Horizontal axis: concentration (mg/kg). Vertical axis: core depth (cm). Figure S6: Chemical fractionation of Cr in sediments from the S1, S2, S7, and S11 stations. Horizontal axis: concentration (mg/kg). Vertical axis: core depth (cm). Figure S7: Chemical fractionation of Ni in sediments from the S1, S2, S7, and S11 stations. Horizontal axis: concentration (mg/kg). Vertical axis: core depth (cm). Table S1: Location of the sampling stations, water depths, and lengths of the cores. Table S2: Certified and analyzed concentrations of the reference materials BCR-701 and their recoveries (all the concentrations are expressed in mg/kg). Table S3: Certified and analyzed metal concentrations (mg/kg) of digested Certified Reference Materials (CRMs) analyzed with CCT ICP-MS and their % recoveries. Table S4: Percentage shares of chemical fractions (F1: labile, F2: oxidizable, F3: reducible, and F4: residual).

Author Contributions

Conceptualization, H.K. and M.S.; methodology, E.P., H.K., V.P. and S.I.; formal analysis, E.P. and S.I.; investigation, E.P.; resources, E.P.; data curation, E.P. and V.P.; writing—original draft preparation, E.P.; writing—review and editing, H.K., M.D., P.M., C.Z. and M.S.; supervision, H.K.; and funding acquisition, H.K. All authors have read and agreed to the published version of the manuscript.

Funding

This research was funded partly by the EU-FP6 PERSEUS Project (EC Grant agreement no. 287600) and the MERMAID project (ERANET 12SEAS-12-C1).

Institutional Review Board Statement

Not applicable.

Informed Consent Statement

Not applicable.

Data Availability Statement

The data presented in this study are available upon request from the corresponding author. The data are not publicly available as they constitute part of a PhD thesis pending public support.

Acknowledgments

We would like to thank the crew of the R/V AEGAEO and the colleagues who helped in the sampling and the analysis of the samples.

Conflicts of Interest

The authors declare no conflict of interest.

References

  1. Rodriguez, J.G.; Tueros, I.; Borja, A.; Belzunce, M.J.; Franco, J.; Solaun, O.; Valencia, V.; Zuazo, A. Maximum likelihood mixture estimation to determine metal background values in estuarine and coastal sediments within the European Water Framework Directive. Sci. Total Environ. 2006, 370, 278–293. [Google Scholar] [CrossRef] [PubMed]
  2. Belin, S.; Sany, T.; Hashim, R.; Rejid, M.; Salleh, A.; Safari, O. A review of strategies to monitor water and sediment quality for a sustainability assessment of marine environment. Environ. Sci. Pollut. Res. 2014, 21, 813–833. [Google Scholar]
  3. Gleyzes, C.; Tellier, S.; Astruc, M. Fractionation studies of trace elements in contaminated soils and sediments: A review of sequential extraction procedures. TrAC Trends Anal. Chem. 2002, 21, 451–467. [Google Scholar] [CrossRef]
  4. Eggleton, J.; Thomas, K.V. A review of factors affecting the release and bioavailability of contaminants during sediment disturbance events. Environ. Int. 2004, 30, 973–980. [Google Scholar] [CrossRef]
  5. Hooda, P.S. Assessing bioavailability of soil trace elements. In Trace Elements in Soil; Hooda, P.S., Ed.; John Willey and Sons, Inc.: West Sussex, UK, 2010; pp. 229–265. [Google Scholar]
  6. Liu, H.; Li, L.; Yin, C.; Shan, B. Fraction distribution and risk assessment of heavy metals in sediments of Moushui Lake. J. Environ. Sci. 2008, 20, 390–397. [Google Scholar] [CrossRef]
  7. Sundaray, S.K.; Panda, U.C.; Nayak, B.B.; Bhatta, D. Multivariate statistical techniques for the evaluation of spatial and temporal variations in water quality of the Mahanadi River–estuarine system (India)—A case study. Environ. Geochem. Health 2006, 28, 317–330. [Google Scholar] [CrossRef]
  8. Sutherland, R.A. BCR®-701: A review of 10-years of sequential extraction analyses. Anal. Chim. Acta 2010, 680, 10–20. [Google Scholar] [CrossRef]
  9. Birch, G. Determination of sediment metal background concentrations and enrichment in marine environments—A critical review. Sci. Total Environ. 2017, 580, 813–831. [Google Scholar] [CrossRef]
  10. Anderson, R.F.; Schill, R.L.; Hesslein, R.H. Determining sediment accumulation and mixing rates using 210Pb and 137Cs and other tracers. Can. J. Fish. Aq. Sci. 1987, 44, 231–250. [Google Scholar] [CrossRef]
  11. Miralles, J.; Radakovitch, O.; Aloisi, J.-C. 210Pb sedimentation rates from the Northwestern Mediterranean margin. Mar. Geol. 2005, 216, 155–167. [Google Scholar] [CrossRef]
  12. Panagiotoulias, I.; Botsou, F.; Kaberi, H.; Karageorgis, A.P.; Scoullos, M. Can we document if regulation and Best Available Techniques (BAT) have any positive impact on the marine environment? A case based on a steel mill in Greece. Environ. Monit. Assess. 2017, 189, 598. [Google Scholar] [CrossRef] [PubMed]
  13. Karageorgis, A.; Botsou, F.; Kaberi, H.; Iliakis, S. Geochemistry of major and trace elements in surface sediments of the Saronikos Gulf (Greece): Assessment of contamination between 1999 and 2018. Sci. Total Environ. 2020, 717, 137046. [Google Scholar] [CrossRef] [PubMed]
  14. Zeri, C.; Kontoyiannis, H.; Giannakourou, A. Distribution, fluxes and bacterial consumption of total organic carbon in a populated Mediterranean Gulf. Cont. Shelf Res. 2009, 29, 886–895. [Google Scholar] [CrossRef]
  15. Pavlidou, A.; Simboura, N.; Pagou, K.; Assimakopoulou, G.; Gerakaris, V.; Hatzianestis, I.; Panayotidis, P.; Pantazi, M.; Papadopoulou, N.; Reizopoulou, S.; et al. Using a holistic ecosystem-integrated approach to assess the environmental status of Saronikos Gulf, Eastern Mediterranean. Ecol. Indic. 2019, 96 Pt 1, 336–350. [Google Scholar] [CrossRef]
  16. Panagiotopoulos, I.; Kapsimalis, V.; Hatzianestis, I.; Kanellopoulos, T.D.; Kyriakidou, C. Environmental status of the metropolitan river (Kifissos) of Athens, Greece. Environ. Earth Sci. 2010, 61, 983–993. [Google Scholar] [CrossRef]
  17. Voutsinou-Taliadouri, F. Metal pollution in the Saronikos Gulf. Mar. Poll. Bull. 1981, 12, 163–168. [Google Scholar] [CrossRef]
  18. Zacharias, I.; Fakiris, E. Application of Landsat imagery, to verify near shore water circulation of Saronikos gulf, as resulted from numerical modelling. Appl. Numer. Anal. Comput. Math. 2005, 2, 281–290. [Google Scholar] [CrossRef]
  19. Scoullos, M.; Dassenakis, M.; Paraskevopoulou, V.; Botsou, F.; Sakellari, A.; Karavoltsos, S.; Mantzara, V.; Zeri, C.; Krasakopoulou, E.; Zervoudaki, T. Trace metals in seawater and sediments of the Gulf of Elefsis: 1977–2015. Sust. Medit. 2015, 71, 15–18. [Google Scholar]
  20. Scoullos, M.; Oldfield, F.; Thompson, R. Magnetic monitoring of particulate pollution in the Gulf of Elefsis. Mar. Pollut. Bull. 1979, 10, 287–291. [Google Scholar] [CrossRef]
  21. Scoullos, M.J. Trace metals in the sea water of a polluted bay near Athens. Mutat. Res. 1981, 85, 247. [Google Scholar] [CrossRef]
  22. Pavlidou., A.; Pagou, K.; Assimakopoulou, G.; Rousselaki, E. Evolution over the last 30 years of the trophic conditions in the Gulf of Elefsis. Sust. Medit. 2015, 71, 20–22. [Google Scholar]
  23. Watt, J.A.J.; Burke, I.T.; Edwards, R.A.; Malcolm, H.M.; Mayes, W.M.; Olszewska, J.P.; Pan, G.; Graham, M.C.; Heal, K.V.; Rose, N.L.; et al. Vanadium: A Re-Emerging Environmental Hazard. Environ. Sci. Technol. 2018, 52, 11973–11974. [Google Scholar] [CrossRef] [PubMed] [Green Version]
  24. Shaheen, S.M.; Alessi, D.; Tack, F.M.G.; Ok, Y.S.; Kim, K.-H.; Gustafsson, J.P.; Sparks, D.L.; Rinklebe, J. Redox chemistry of vanadium in soils and sediments: Interactions with colloidal materials, mobilization, speciation, and relevant environmental implications- A review. Adv. Colloid Interface Sci. 2019, 265, 1–13. [Google Scholar] [CrossRef] [PubMed]
  25. Gustafsson, P. Vanadium geochemistry in the biogeosphere–speciation, solid-solution interactions, and ecotoxicity. Appl. Geochem. 2019, 102, 1–25. [Google Scholar] [CrossRef]
  26. Schlesinger, W.H.; Klein, E.M.; Vengosh, A. Global biogeochemical cycle of vanadium. Proc. Natl. Acad. Sci. USA 2017, 114, E11092–E11100. [Google Scholar] [CrossRef] [Green Version]
  27. Croteau, M.-N.; Misra, S.K.; Luoma, S.N.; Valsami-Jones, E. Silver Bioaccumulation Dynamics in a Freshwater Invertebrate after Aqueous and Dietary Exposures to Nanosized and Ionic Ag. Environ. Sci. Technol. 2011, 45, 6600–6607. [Google Scholar] [CrossRef]
  28. Lopez-Serrano, A.; Munoz-Olivas, R.; Sanz-Landaluze, J.; Olasagasti, M.; Rainieri, S.; Camara, C. Comparison of bioconcentration of ionic silver and silver nanoparticles in zebrafish eleuthero embryos. Environ. Pollut. 2014, 191, 207–214. [Google Scholar] [CrossRef]
  29. Zhao, J.; Wang, X.; Hoang, S.A.; Bolan, N.S.; Kirkham, M.; Liu, J.; Xia, X.; Li, Y. Silver nanoparticles in aquatic sediments: Occurrence, chemical transformations, toxicity, and analytical methods. J. Hazard. Mater. 2021, 418, 126368. [Google Scholar] [CrossRef]
  30. United Nations Environment Programme. Pharmaceuticals and Personal Care Products in the Environment: An Emerging Issue. Global Programme of Action for the Protection of the Marine Environment from Land-Based Activities. 2017. Available online: https://wedocs.unep.org/20.500.11822/28743 (accessed on 18 February 2022).
  31. Boholm, M.; Arvidsson, R. Controversy over antibacterial silver: Implications for environmental and sustainability assessments. J. Clean. Prod. 2014, 68, 135–143. [Google Scholar] [CrossRef]
  32. Alvarez, M.T.; Hanke, G. Potential Chemical Contaminants in the Marine Environment: An Overview of Main Contaminant Lists; EUR 28925 EN; Publications Office of the European Union: Luxembourg, 2017; ISBN 978-92-79-77045-6. [Google Scholar] [CrossRef]
  33. Luoma, S.N.; Ho, Y.B.; Bryan, G.W. Fate, bioavailability and toxicity of silver in estuarine environments. Mar. Poll. Bull. 1995, 31, 44–54. [Google Scholar] [CrossRef]
  34. Sanudo-Wilhelmy, S.A.; Flegal, A.R. Anthropogenic silver in the Southern California Bight: A new tracer of sewage in coastal waters. Environ. Sci. Technol. 1992, 26, 2147–2151. [Google Scholar] [CrossRef]
  35. Nel, A.E.; Parak, W.J.; Chan, W.C.W.; Xia, T.; Hersam, M.C.; Brinker, J.; Zink, J.I.; Pinkerton, K.E.; Baer, D.R.; Weiss, P.S. Where Are We Heading in Nanotechnology Environmental Health and Safety and Materials Characterization? ACS Nano 2015, 9, 5627–5630. [Google Scholar] [CrossRef] [PubMed]
  36. Kontoyiannis, H. Observations on the circulation of the Saronikos Gulf: A Mediterranean embayment sea border of Athens, Greece. J. Geophys. Res. Earth Surf. 2010, 115, C06029. [Google Scholar] [CrossRef] [Green Version]
  37. Pantazidou, M.; Kapniaris, S.; Katsiri, A.; Christidis, A. Pollutant trends and hazard ranking in Elefsis Bay, Greece. Desalination 2007, 210, 69–82. [Google Scholar] [CrossRef]
  38. Mavrakis, A.; Theoharatos, G.; Asimakopoulos, D.N.; Christides, A. Distribution of trace metals in the sediments of Elefsis Gulf. Mediterr. Mar. Sci. 2004, 5, 151. [Google Scholar] [CrossRef] [Green Version]
  39. Diegor, W.; Longerich, H.; Abrajano, T.; Horn, I. Applicability of a high pressure digestion technique to the analysis of sediment and soil samples by inductively coupled plasma-mass spectrometry. Anal. Chim. Acta 2001, 431, 195–207. [Google Scholar] [CrossRef]
  40. Rowan, J.T.; Houk, R.S. Attenuation of Polyatomic Ion Interferences in Inductively Coupled Plasma Mass Spectrometry by Gas-Phase Collisions. Appl. Spectrosc. 1989, 43, 976–980. [Google Scholar] [CrossRef]
  41. Tanner, S.D.; Baranov, V.I.; Bandura, D.R. Reaction cells and collision cells for ICP-MS: A tutorial review. Spectrochim. Acta Part B At. Spectrosc. 2002, 57, 1361–1452. [Google Scholar] [CrossRef]
  42. Robert, T. Practical Guide to ICP-MS, 2nd ed.; CRC Press Taylor & Francis Group: Boca Raton, FL, USA, 2008. [Google Scholar]
  43. Kadar, A.; Noël, L.; Chekri, R.; Vastel, C.; Millour, S.; Guerin, T. Optimisation of ICP-MS collision/reaction cell conditions for the determination of elements likely to be interfered (V, Cr, Fe, Co, Ni, As and Se) in foodstuffs. Talanta 2011, 85, 2605–2613. [Google Scholar] [CrossRef]
  44. Gaudette, H.E.; Flight, W.R.; Toner, L.; Folger, D.W. An inexpensive titration method for the determination of organic carbon in recent sediments. J. Sediment. Petrol. 1974, 144, 249–253. [Google Scholar]
  45. Sanchez-Cabeza, J.-A.; Masque, P.; Ani-Ragolta, I. 210Pb and210Po analysis in sediments and soils by microwave acid digestion. J. Radioanal. Nucl. Chem. Artic. 1998, 227, 19–22. [Google Scholar] [CrossRef]
  46. Sanchez-Cabeza, J.A.; Ruiz-Fernández, A.C. 210Pb sediment radiochronology: An integrated formulation and classification of dating models. Geochim. Cosmochim. Acta 2012, 82, 183–200. [Google Scholar] [CrossRef]
  47. Muntau, H.; López-Sánchez, J.; Quevauviller, P. The Certification of the Extractable Contents (Mass Fractions) of Cd, Cr, CU, Ni, Pb and Zn in Freshwater Sediment Following a Sequential Extraction Procedure—BCR-701; European Commission, Directorate-General for Research and Innovation, Publications Office: Maastricht, The Netherlands, 2001. [Google Scholar]
  48. Wang, S.; Jia, Y.; Wang, S.; Wang, X.; Wang, H.; Zhao, Z.; Liu, B. Fractionation of heavy metals in shallow marine sediments from Jinzhou Bay, China. J. Environ. Sci. 2010, 22, 23–31. [Google Scholar] [CrossRef]
  49. Davutluoglu, O.I.; Seckin, G.; Ersu, C.B.; Yilmaz, T.; Sari, B. Heavy metal content and distribution in surface sediments of the Seyhan River, Turkey. J. Environ. Manag. 2011, 92, 2250–2259. [Google Scholar] [CrossRef]
  50. Muller, G. Index of geoaccumulation in sediments of the Rhine River. Geojournal 1969, 2, 108–118. [Google Scholar]
  51. Perin, G.; Craboledda, L.; Lucchese, M.; Cirillo, R.; Dotta, L.; Zanette, M.L.; Orio, A.A. Heavy metal speciation in the sediments of Northern Adriatic Sea—A new approach for environmental toxicity determination. Heavy Met. Environ. 1985, 2, 454–456. [Google Scholar]
  52. Birch, G.F. A review of chemical-based sediment quality assessment methodologies for the marine environment. Mar. Pollut. Bull. 2018, 133, 218–232. [Google Scholar] [CrossRef]
  53. Kemp, A.L.W.; Thomas, R.L.; Dell, C.I.; Jaquet, J.-M. Cultural Impact on the Geochemistry of Sediments in Lake Erie. J. Fish. Res. Board Can. 1976, 33, 440–462. [Google Scholar] [CrossRef]
  54. Birch, G.F.; Olmos, M.A. Sediment-bound heavy metals as indicators of human influence and biological risk in coastal water bodies. ICES J. Mar. Sci. 2008, 65, 1407–1413. [Google Scholar] [CrossRef]
  55. MacDonald, D.D. Approach to the Assessment of Sediment Quality in Florida Coastal Waters; Florida Department of Environmental Protection, Office of Water Policy: Tallahassee, FL, USA, 1994. [Google Scholar]
  56. Roberts, A.D. Causes and ecological effects of resuspended contaminated sediments (RCS) in marine environments. Environ. Int. 2012, 40, 230–243. [Google Scholar] [CrossRef]
  57. Zhang, G.; Bai, J.; Xiao, R.; Zhao, Q.; Jia, J.; Cui, B.; Liu, X. Heavy metal fractions and ecological risk assessment in sediments from urban, rural and reclamation-affected rivers of the Pearl River Estuary, China. Chemosphere 2017, 184, 278–288. [Google Scholar] [CrossRef] [PubMed]
  58. Gusiatin, Z.M.; Kulikowska, D. The usability of the IR, RAC and MRI indices of heavy metal distribution to assess the environmental quality of sewage sludge composts. Waste Manag. 2014, 34, 1227–1236. [Google Scholar] [CrossRef] [PubMed]
  59. Liang, G.; Zhang, B.; Lin, M.; Wu, S.; Hou, H.; Zhang, J.; Qian, G.; Huang, X.; Zhou, J. Evaluation of heavy metal mobilization in creek sediment: Influence of RAC values and ambient environmental factors. Sci. Total Environ. 2017, 607–608, 1339–1347. [Google Scholar] [CrossRef] [PubMed]
  60. Cuong, D.T.; Obbard, J.P. Metal speciation in coastal marine sediments from Singapore using a modified BCR-sequential extraction procedure. Appl. Geochem. 2006, 21, 1335–1346. [Google Scholar] [CrossRef]
  61. Sahuquillo, A.; López-Sánchez, J.F.; Rubio, R.; Rauret, G.; Thomas, R.P.; Davidson, C.; Ure, A.M. Use of a certified reference material for extractable trace metals to assess sources of uncertainty in the BCR three-stage sequential extraction procedure. Anal. Chim. Acta 1999, 382, 317–327. [Google Scholar] [CrossRef]
  62. Jochum, K.P.; Nohl, U.; Herwig, K.; Lammel, E.; Stoll, B.; Hofmann, A.W. GeoReM: A New Geochemical Database for Reference Materials and Isotopic Standards. Geostand. Geoanal. Res. 2005, 29, 333–338. [Google Scholar] [CrossRef]
  63. Wetzel, A. Interrelationships between porosity and other geotechnical properties of slowly deposited, fine-grained marine surface sediments. Mar. Geol. 1990, 92, 105–113. [Google Scholar] [CrossRef]
  64. Iliakis, S. Determination of Metals in Marine Sediments with Spectrophotometric Methods in Association with Sedimentation Rates, in Order to Estimate the Pollution Impact. Bachelor’s Thesis, National Technological University of Athens, Athens, Greece, 2011. [Google Scholar]
  65. Eleftheriou, G.; Tsabaris, C.; Papageorgiou, D.K.; Patiris, D.L.; Androulakaki, E.G.; Pappa, F.K. Radiometric dating of sediment cores from aquatic environments of north-east Mediterranean. J. Radioanal. Nucl. Chem. Artic. 2018, 316, 655–671. [Google Scholar] [CrossRef]
  66. Karageorgis, A.P.; Katsanevakis, S.; Kaberi, H. Use of Enrichment Factors for the Assessment of Heavy Metal Contamination in the Sediments of Koumoundourou Lake, Greece. Water Air Soil Pollut. 2009, 204, 243–258. [Google Scholar] [CrossRef]
  67. Bermudez, G.; Moreno, M.; Invernizzi, R.; Plá, R.; Pignata, M.L. Heavy metal pollution in topsoils near a cement plant: The role of organic matter and distance to the source to predict total and HCl-extracted heavy metal concentrations. Chemosphere 2010, 78, 375–381. [Google Scholar] [CrossRef]
  68. Kalogeropoulos, N.; Scoullos, M.; Vassilaki, M.; Grimanis, A. Vanadium in particles and sediments of the Saronikos Gulf, Greece. Sci. Total Environ. 1989, 79, 241–252. [Google Scholar] [CrossRef]
  69. Kelepertzis, E.; Galanos, E.; Mitsis, I. Origin, mineral speciation and geochemical baseline mapping of Ni and Cr in agricultural top soils of Thiva valley (Central Greece). J. Geochem. Explor. 2013, 125, 56–68. [Google Scholar] [CrossRef]
  70. Kanellopoulos, C.; Argyraki, A. Soil baseline geochemistry and plant response in areas of complex geology. Application to NW Euboea, Greece. Geochemistry 2013, 73, 519–532. [Google Scholar] [CrossRef]
  71. Argyraki, A.; Kelepertzis, E. Urban soil geochemistry in Athens, Greece: The importance of local geology in controlling the distribution of potentially harmful trace elements. Sci. Total Environ. 2014, 482–483, 366–377. [Google Scholar] [CrossRef] [PubMed]
  72. Paraskevopoulou, V.; Zeri, C.; Kaberi, H.; Chalkiadaki, O.; Krasakopoulou, E.; Dassenakis, M.; Scoullos, M. Trace metal variability, background levels and pollution status assessment in line with the water framework and Marine Strategy Framework EU Directives in the waters of a heavily impacted Mediterranean Gulf. Mar. Poll. Bull. 2014, 87, 323–337. [Google Scholar] [CrossRef] [PubMed]
  73. Tzempelikou, E.; Zeri, C.; Iliakis, S.; Paraskevopoulou, V. Cd, Co, Cu, Ni, Pb, Zn in coastal and transitional waters of Greece and assessment of background concentrations: Results from 6 years implementation of the Water Framework Directive. Sci. Total Environ. 2021, 774, 145177. [Google Scholar] [CrossRef]
  74. Scoullos, M. Lead in coastal sediments: The case of Elefsis gulf. Sci. Total Environ. 1986, 49, 199–219. [Google Scholar] [CrossRef]
  75. Fourtziou, L.; Liakakou, E.; Stavroulas, I.; Theodosi, C.; Zarmpas, P.; Psiloglou, B.; Sciare, J.; Maggos, T.; Bairachtari, K.; Bougiatioti, A.; et al. Multi-tracer approach to characterize domestic wood burning in Athens (Greece) during wintertime. Atmos. Environ. 2017, 148, 89–101. [Google Scholar] [CrossRef]
  76. Gratsea, M.; Liakakou, E.; Mihalopoulos, N.; Adamopoulos, A.; Tsilibari, E.; Gerasopoulos, E. The combined effect of reduced fossil fuel consumption and increasing biomass combustion on Athens’ air quality, as inferred from long term CO measurements. Sci. Total Environ. 2017, 592, 115–123. [Google Scholar] [CrossRef]
  77. Zyrichidou, I.; Balis, D.; Koukouli, M.E.; Drosoglou, T.; Bais, A.; Gratsea, M.; Gerasopoulos, E.; Liora, N.; Poupkou, A.; Giannaros, C.; et al. Adverse results of the economic crisis: A study on the emergence of enhanced formaldehyde (HCHO) levels seen from satellites over Greek urban sites. Atmos. Res. 2019, 224, 42–51. [Google Scholar] [CrossRef]
  78. Morford, J.L.; Martin, W.R.; François, R.; Carney, C.M. A model for uranium, rhenium, and molybdenum diagenesis in marine sediments based on results from coastal locations. Geochim. Cosmochim. Acta 2009, 73, 2938–2960. [Google Scholar] [CrossRef] [Green Version]
  79. Smedley, P.L.; Kinniburgh, D.G. Molybdenum in natural waters: A review of occurrence, distributions and controls. Appl. Geochem. 2017, 84, 387–432. [Google Scholar] [CrossRef] [Green Version]
  80. Sulu-Gambari, F.; Roepert, A.; Jilbert, T.; Hagens, M.; Meysman, F.J.; Slomp, C.P. Molybdenum dynamics in sediments of a seasonally-hypoxic coastal marine basin. Chem. Geol. 2017, 466, 627–640. [Google Scholar] [CrossRef] [Green Version]
  81. O’Connor, A.E.; Luek, J.L.; McIntosh, H.; Beck, A.J. Geochemistry of redox-sensitive trace elements in a shallow subterranean estuary. Mar. Chem. 2015, 172, 70–81. [Google Scholar] [CrossRef]
  82. Hughes, M.F.; Beck, B.D.; Chen, Y.; Lewis, A.S.; Thomas, D.J. Arsenic Exposure and Toxicology: A Historical Perspective. Toxicol. Sci. 2011, 123, 305–332. [Google Scholar] [CrossRef] [Green Version]
  83. Bencko, V.; Foong, F.Y.L. The history of arsenical pesticides and health risks related to the use of Agent Blue. Ann. Agric. Environ. Med. 2017, 24, 312–316. [Google Scholar] [CrossRef]
  84. Poté, J.; Haller, L.; Loizeau, J.; Garcia Bravo, A.; Sastre, V.; Wildi, W. Effects of a sewage treatment plant outlet pipe extension on the distribution of contaminants in the sediments of the Bay of Vidy, Lake Geneva, Switzerland. Bioresour. Technol. 2008, 99, 7122–7131. [Google Scholar] [CrossRef]
  85. Angelidis, M.; Grimanis, A.P. Arsenic geochemistry in sediments near the Athens Sewage Outfall. Mar. Pollut. Bull. 1987, 18, 297–298. [Google Scholar] [CrossRef]
  86. Santos-Echeandía, J.; Prego, R.; Cobelo-García, A. Influence of the heavy fuel spill from the Prestige tanker wreckage in the overlying seawater column levels of copper, nickel and vanadium (NE Atlantic Ocean). J. Mar. Syst. 2008, 72, 350–357. [Google Scholar] [CrossRef]
  87. Ganguly, K.; Dutta, S.D.; Patel, D.K.; Ki-Taek, L. Chapter 18—Silver nanoparticles for wastewater treatment. In Micro and Nano Technologies. Aquananotechnology; Abd-Elsalam, K.A., Zahid, M., Eds.; Elsevier: Amsterdam, The Netherlands, 2021; pp. 385–401. ISBN 9780128211410. [Google Scholar]
  88. Hu, Z. Impact of Silver Nanoparticles on Wastewater Treatment; IWA Publishing: London, UK, 2010; ISBN 9781843393993. [Google Scholar]
  89. Du, J.; Tang, J.; Xu, S.; Ge, J.; Dong, Y.; Li, H.; Jin, M. A review on silver nanoparticles-induced ecotoxicity and the underlying toxicity mechanisms. Regul. Toxicol. Pharmacol. 2018, 98, 231–239. [Google Scholar] [CrossRef]
  90. Kyziol-Komosinska, J.; Dzieniszewska, A.; Franus, W.; Rzepa, G. Behavior of Ag species in presence of aquatic sediment minerals—In context of aquatic environmental safety. J. Contam. Hydrol. 2020, 232, 103606. [Google Scholar] [CrossRef] [PubMed]
  91. Hellenic Association of Pharmaceutical Companies (SFEE). The Greek Pharmaceutical Market: Facts and Figures 2020. 2021. Available online: https://online.fliphtml5.com/piqy/fujm/#p=1 (accessed on 18 February 2022). (In Greek).
Figure 1. Sampling stations in the Inner Saronikos Gulf and Elefsis Bay.
Jmse 10 00376 g001
Figure 2. Porosity, Total Organic Carbon (TOC, %), and Al (%) concentrations in sediment cores from Stations S1, S2, S7, and S11. Vertical axis represents depth (cm).
Jmse 10 00376 g002
Figure 3. Vertical distribution of metal/Al ratios at the S1, S2, S7, and S11 sampling stations.
Jmse 10 00376 g003
Figure 4. Chemical fractionation of V in sediments from the S1, S2, S7, and S11 stations. Horizontal axis: concentration (mg/kg). Vertical axis: core depth (cm).
Jmse 10 00376 g004
Figure 5. Chemical fractionation of Cu in sediments from the S1, S2, S7, and S11 stations. Horizontal axis: concentration (mg/kg). Vertical axis: core depth (cm).
Jmse 10 00376 g005
Figure 6. Chemical fractionation of Zn in sediments from the S1, S2, S7, and S11 stations. Horizontal axis: concentration (mg/kg). Vertical axis: core depth (cm).
Jmse 10 00376 g006
Figure 7. Chemical fractionation of Mo in sediments from the S1, S2, S7, and S11 stations. Horizontal axis: concentration (mg/kg). Vertical axis: core depth (cm).
Jmse 10 00376 g007
Figure 8. Chemical fractionation of Cd in sediments from the S1, S2, S7, and S11 stations. Horizontal axis: concentration (mg/kg). Vertical axis: core depth (cm).
Jmse 10 00376 g008
Figure 9. Chemical fractionation of Pb in sediments from the S1, S2, S7, and S11 stations. Horizontal axis: concentration (mg/kg). Vertical axis: core depth (cm).
Jmse 10 00376 g009
Figure 10. Time-dependent distribution of the enrichment factors of metals and TOC% at the S1, S2, S7, and S11 stations.
Jmse 10 00376 g010
Table 1. Classification according to the Sediment Quality Guidelines (SQGs) proposed by MacDonald et al. 1994 (left) and Risk Assessment Code (RAC) classification (right).
Metal ConcentrationToxicity RiskLabile Fraction (%)Toxicity Risk
Conc. < TELLow toxicity riskLabile Fraction < 1%No risk
1% < Labile Fraction < 10%Low risk
TEL < Conc. < PELMedium toxicity risk11% < Labile Fraction < 30%Medium risk
Conc. > PELHigh toxicity risk31% < Labile Fraction < 50%High risk
Labile Fraction > 50%Very high risk
Table 2. Sedimentation rates (cm/y) in Elefsis Bay and the Inner Saronikos Gulf.
Present StudyIliakis [64]Karageorgis et al. [13]Eleftheriou et al. [65]
Elefsis BayS10.110.13
S20.250.260.260.21
Inner SaronikosS70.62 0.9
S110.080.07
Table 3. Estimated background concentrations of metals at Elefsis Bay and the Inner Saronikos Gulf.
Present StudyKarageorgis et al. [13]
Elefsis BayInner SaronikosElefsis BayInner Saronikos
Al%7.451.465.641.81
V (mg/kg)90.016.27923
Cr (mg/kg)11542.1136107
Mn (mg/kg)520128379167
Fe%3.50.71
Co (mg/kg)12.35.02125
Ni (mg/kg)78.635.711536
Cu (mg/kg)259.00147
Zn (mg/kg)7020.05925
As (mg/kg)10.08.811925
Mo (mg/kg)1.33.2
Ag (mg/kg)0.70.41
Cd (mg/kg)0.1000.08
Pb (mg/kg)4015215
Table 4. TEL and PEL levels and average metal concentrations (mg·kg−1) in the surface sediments (0 to 1 cm in depth) of the Inner Saronikos and Elefsis Bay stations (n = 2 for each station).
Caverage 0 to 1 cmSQGs
S1S2S7S11TELPEL
Cr15618923846.252.3160
Ni81.715583.626.915.942.8
Cu10613511410.118.7108
Zn23925723634.5124271
As11.315.028.411.97.2441.6
Ag1.151.764.790.9900.7331.77
Cd0.2460.2470.4950.1180.4210.676
Pb15492.014133.130.2112
Table 5. Metal toxicity risk assessment of the Elefsis Bay and Inner Saronikos Gulf sediments based on the RAC and SQGs.
RAC Risk AssessmentSQGs Risk Assessment
Elefsis BayInner SaronikosElefsis BayInner Saronikos
S1S2S7S11S1S2S7S11
VNoNoNoNon.a.n.a.n.a.n.a.
CrNoNoNoNoHighHighHighLow
MnMediumMediumMediumNon.a.n.a.n.a.n.a.
FeNoNoNoNon.a.n.a.n.a.n.a.
CoLowLowLowNon.a.n.a.n.a.n.a.
NiNoNoLowNoHighHighHighMedium
CuNoNoNoNoHighHighHighLow
ZnLowLowMediumNoMediumHighMediumLow
Asn.a.n.a.n.a.n.a.MediumMediumMediumMedium
MoMediumMediumMediumNon.a.n.a.n.a.n.a.
Agn.a.n.a.n.a.n.a.MediumMediumHighMedium
CdHighHighLowNoLowLowMediumLow
PbNoNoNoNoHighMediumHighMedium
Publisher’s Note: MDPI stays neutral with regard to jurisdictional claims in published maps and institutional affiliations.

