Progress in Phase Calibration for Liquid Crystal Spatial Light Modulators


State Key Laboratory of Precision Measurement Technology and Instrument, Department of Precision Instruments, Tsinghua University, Beijing 100084, China
*
Author to whom correspondence should be addressed.
Appl. Sci. 2019, 9(10), 2012; https://doi.org/10.3390/app9102012
Submission received: 4 April 2019
/
Revised: 9 May 2019
/
Accepted: 10 May 2019
/
Published: 16 May 2019
(This article belongs to the Special Issue Liquid Crystal on Silicon Devices: Modeling and Advanced Spatial Light Modulation Applications)
Abstract
:Phase-only Spatial Light Modulator (SLM) is one of the most widely used devices for phase modulation. It has been successfully applied in the field with requirements of precision phase modulation such as holographic display, optical tweezers, lithography, etc. However, due to the limitations in the manufacturing process, the grayscale-phase response could be different for every single SLM device, even varying on sections of an SLM panel. A diverse array of calibration methods have been proposed and could be sorted into two categories: the interferometric phase calibration methods and the diffractive phase calibration methods. The principles of phase-only SLM are introduced. The main phase calibration methods are discussed and reviewed. The advantages of these methods are analyzed and compared. The potential methods for different applications are suggested.
1. Introduction
Liquid Crystal Spatial Light Modulator (LC-SLM) and Digital Micro-Mirror device (DMD) are two of the most successful SLMs. For phase manipulation, the LC-SLM has been widely used in many fields: holographic display [1,2,3], precision metering [4,5], optical tweezers [6,7], lithography [8], beam shaping [9,10], etc. In the listed fields, the accurate phase manipulation is essential, especially for deploying SLM as a programmable diffractive device. The shifted phase could be modulated by the addressed grayscale or pixel voltage for an electric-addressed SLM. Ideally, the transfer from the uploaded grayscale to the shifted phase of the light wave is the same as the look up table (LUT) shown in the startup manual of the SLM. However, in practice, due to the nonlinear optical response of liquid crystal as well as manufacturing defects, the grayscale-phase response could be different for every single SLM device, even varying on sections of an SLM panel.
The performance reduction of SLM is due to two kinds of static errors: the global grayscale-phase mismatch and spatial nonuniformity. The global grayscale-phase mismatch comes from the application of the unsuitable pre-set LUT of the SLM. The spatial nonuniformity of SLM’s active area (on the panel to modulate incident beam) comes from the nonuniform electric drive [11], the curvature of the backplane of the SLM [12], or the aberration induced by the thickness variations of the LC layer. Besides, the accuracy of the applied electric field transferred from the uploaded grayscale for the pixels could lead to errors. For different illuminating wavelengths, the response will be different. Along with the static errors, there could be fluctuations of the phase modulation caused by the dynamic errors, including the local heating caused by an incident laser beam and the changes of environmental condition, such as temperature or humidity. Besides, performance reduction could happen as the SLM is aging. Therefore, the phase modulation of the SLM will not be the same as the way it is designed, and phase modulation calibration is needed for improving the performance of the SLM involved system, especially the static calibration [13]. For instance, with spatially calibrated SLM, the control of the trapping intensities could increase in the holographic optical trapping system [11].
The key point of the SLM calibration process is to acquire the phase corresponding to the grayscale. The main task is to measure the modulated phase of the SLM efficiently and accurately. All of the phase calibration methods are aiming to transfer the indirectly detectable phase distributions to detectable intensities such as interference fringes that could be used for analysis. A diverse array of calibration methods have been proposed and could be sorted into two categories: the interferometric phase calibration method and the diffractive phase calibration method. Both these methods provide solutions for transforming the phase to intensities, which are also widely applied in the measurements of all kinds of phase objects, such as the quantitative phase imaging for biological sample characterization.
In this work, the LC-SLM and LCoS are investigated for instance to review the progress in the calibration methods. The interferometric methods are firstly discussed, which contain the self-referenced and out-referenced calibration methods. The diffractive methods are then described, which contain the diffraction pattern analysis method, optical elements generated method and polarization analyzed method. The advantages of these methods are analyzed and compared. The potential methods for different applications are suggested. The suggestions could be a reference for the calibrations of any SLM for its applications.
2. Basic Principle of Phase-Only SLM
The liquid crystal refers to a state of matter between the liquid and solid crystal. There are many phases of liquid crystal. The nematic and smectic C * ferroelectric phases of LCs are the most popular for SLMs. Currently, the ferroelectric LC-based SLM could reach binary phase modulation with a very rapid response, and the SLM based on it could lead to obvious zeroth order and conjugated images at the same time. For the multi-grayscale phase modulation, the nematic phases of LC are suitable with reasonable viscidity and response.
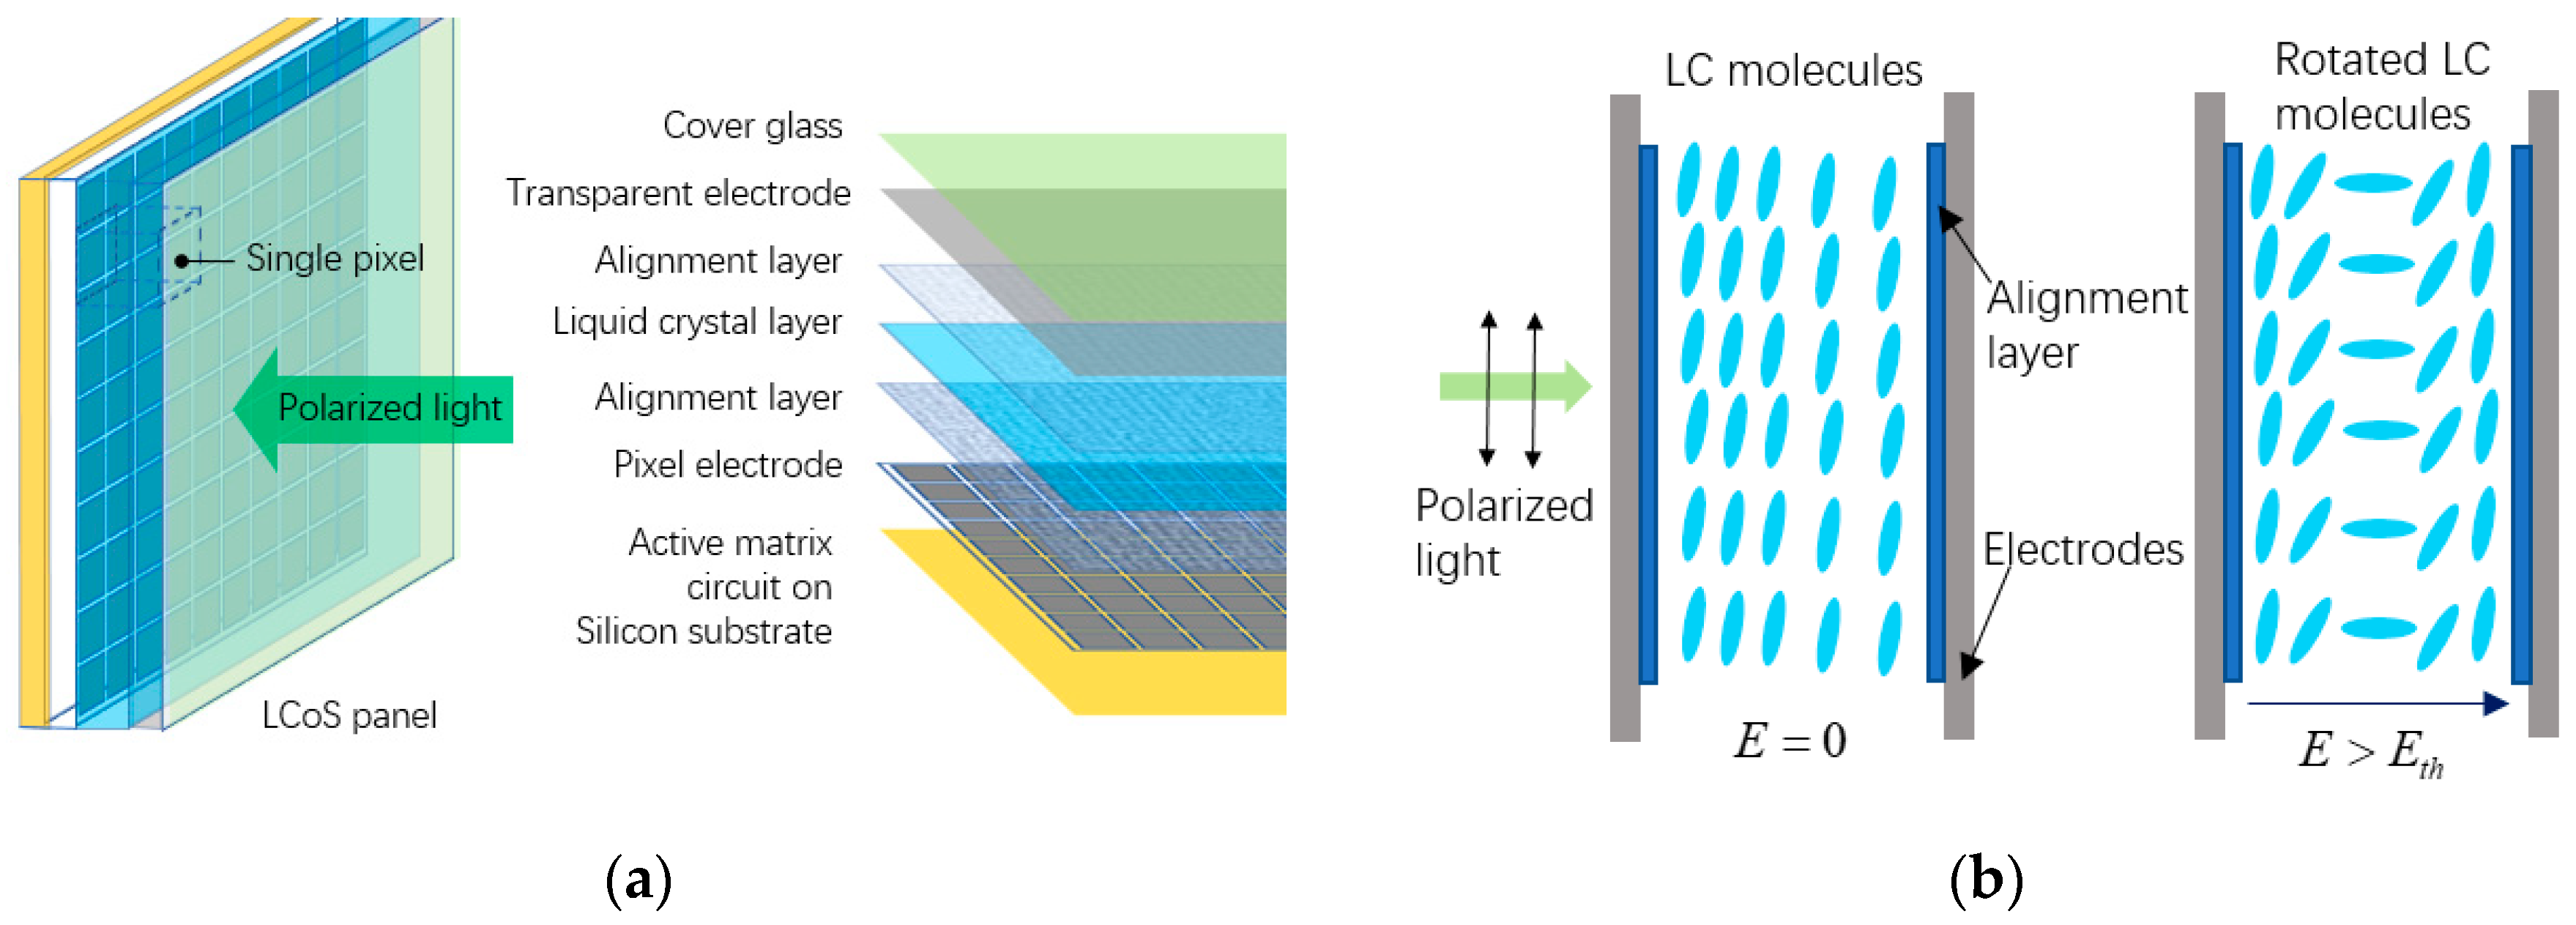
The SLM are like sandwiches with different layers. Taking the reflective LCoS for instance, the basic structure of reflective SLM can be shown in Figure 1a. As it is called Liquid Crystal on Silicon, the LC layer is arranged on the silicon substrate. Based on the semiconductor technology, the active matrix circuit is formed on the silicon substrate to control each pixel electrode by the applied electrical potential individually. The pixel electrode could be made by reflective aluminum with pixel circuity, which contains gate lines and buried transistors for a maximum fill factor [14,15]. Two alignment layers with rubbing direction could be used to initialize the orientation of the modulated LC molecules. The transparent electrode is deployed to work with the pixel electrode for generating the electric field across the LC cell. The birefringence could be modulated by the electric field, which is an electrically controlled birefringence (ECB) mode.
For optical applications, the director of the LC molecules plays an essential role in the birefringence. Before phase modulation, the incident light should be polarized for matching the director of LC. The zero-twisted nematic ECB mode is one of the most widely used phase modulation modes for LCoS. As shown in Figure 1b, the electric field could be generated by the electrodes. The alignment layers provide a pre-orientation of the small angle of 2° to prevent reverse tilt switching [16]. The LC molecules are homogeneously quasi-parallel (with 2°) aligned to the electrode panel when no electric field is applied. When the electric field is applied and the amplitude is larger than the threshold of the electric field amplitude [17], the LC molecules will tilt. The effective refractive index of the cell varies with the molecules polar angle related to the applied electric field. Thus, the phase retardation could be modulated by changing the applied electric field. Assuming complete polarization and no absorption, the Jones matrix of the LC cell could be:
The phase retardation could be:
where is the wavelength, is the thickness of the LC layer, is the effective refractive index varying with the applied electric field, and is the ordinary refractive index of the LC [18]. The ranges from to (extraordinary refractive index), which depends on the applied electric field. The birefringence of positive LC could be from 0.05 to 0.45 [19,20].
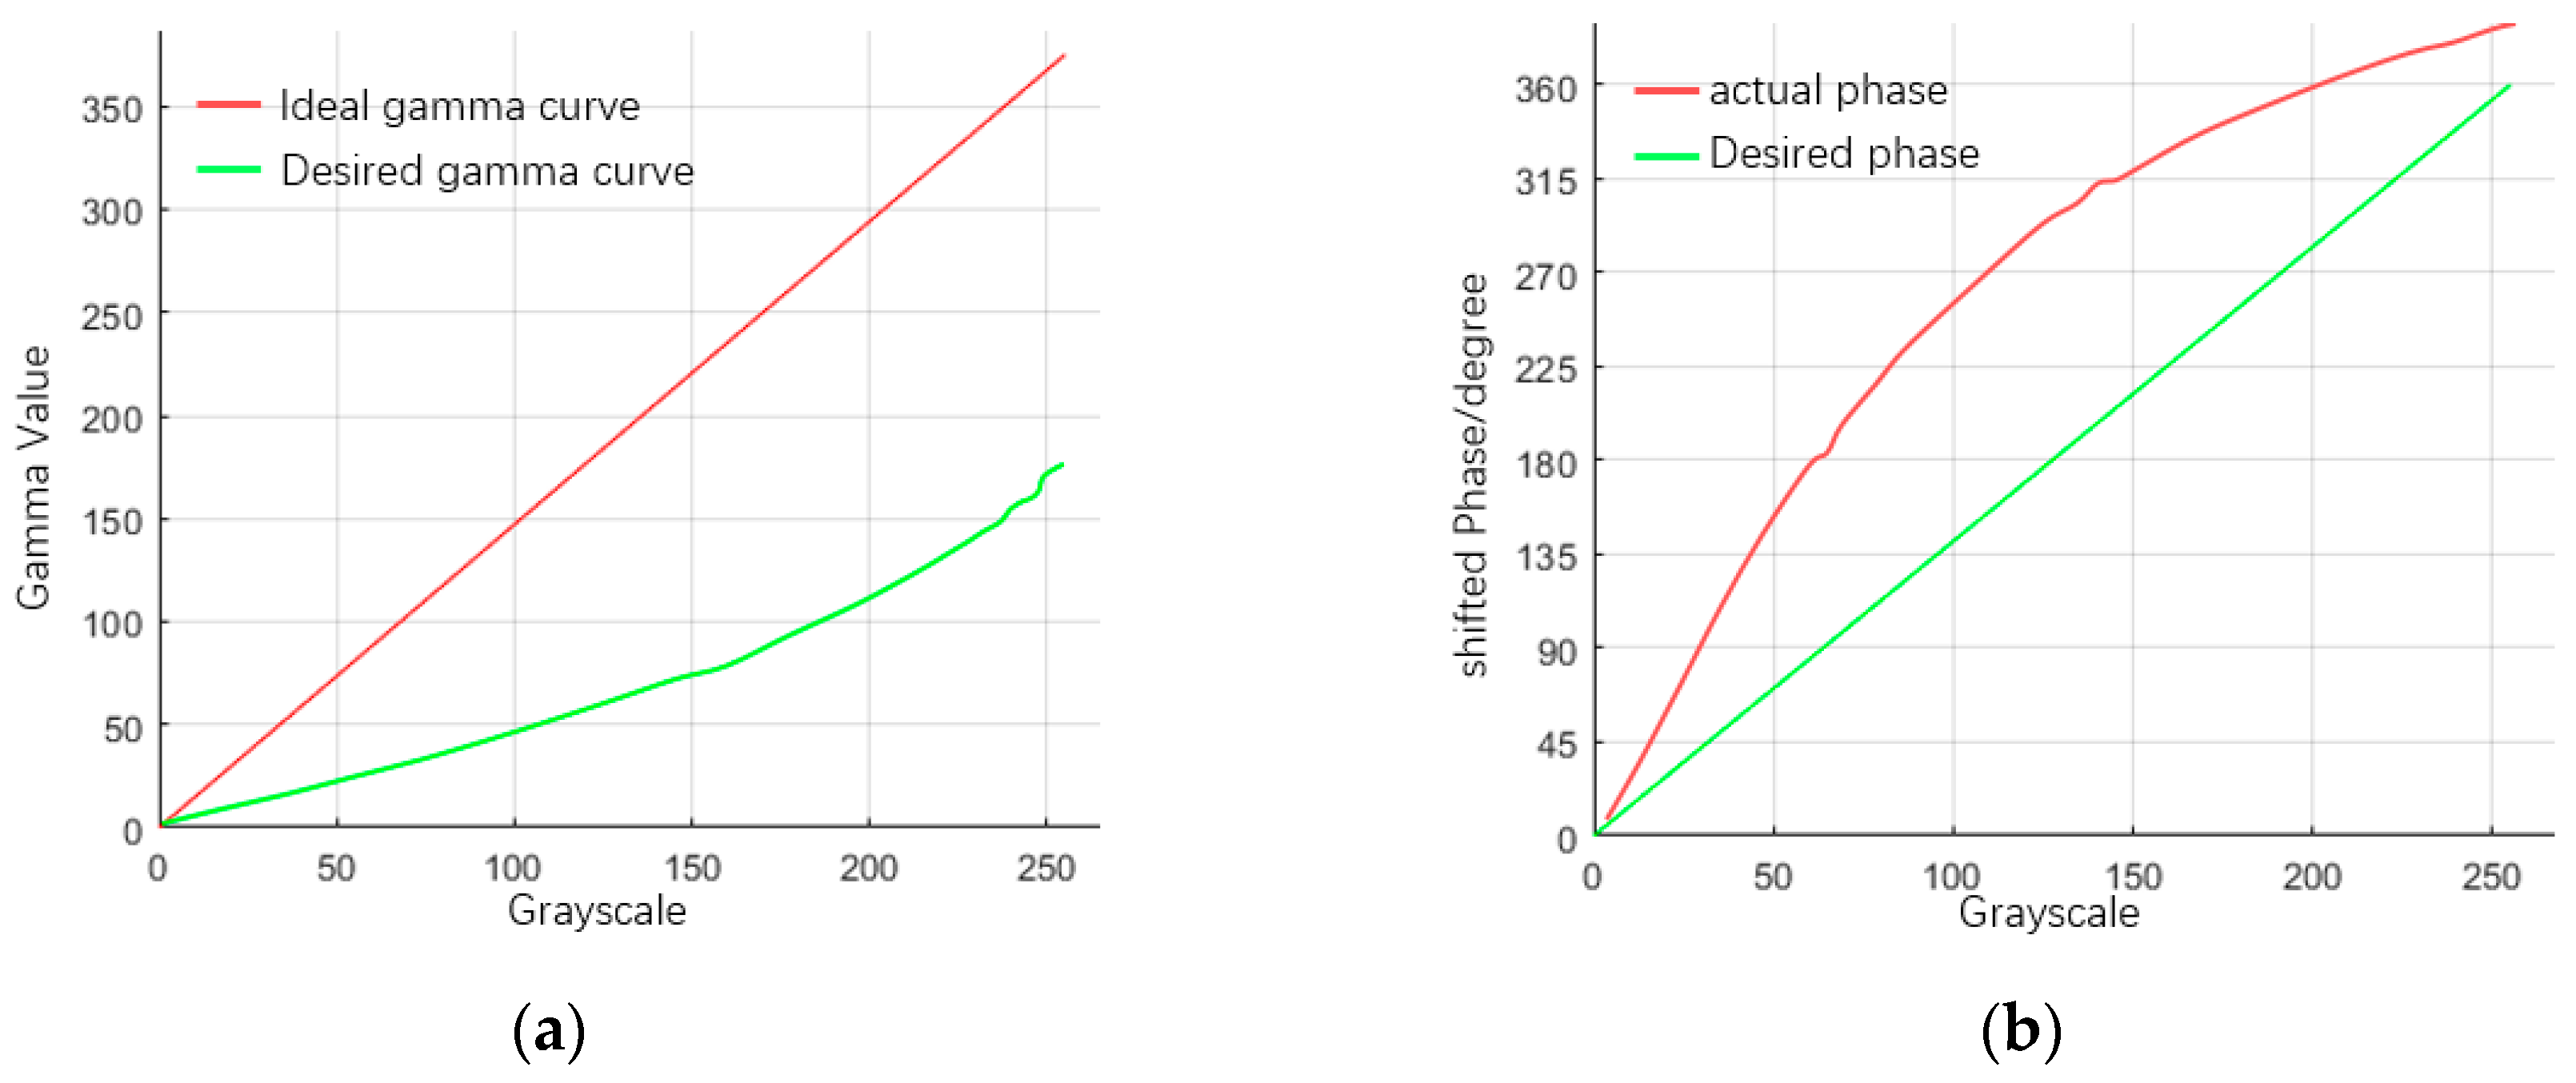
The pattern with the grayscale values uploaded on SLM could be transferred to the applied electric field on the pixel electrodes to control the phase modulation of each pixel. Ideally, the grayscale-phase relation set to the commercial phase-only SLM should be linear, and the gamma curve of the ideal SLM is shown as the red line in Figure 2a. In fact, with the aforementioned imperfectness, the shifted phase modulated by SLM without calibration is represented by the red lines in Figure 2b. For linear modulations of the phase described by green lines in Figure 2b, the desired gamma curve can be shown as the green curve in Figure 2a. In this case, a necessary calibration is desired.
For the phase modulation of SLM, there is a response time for the molecules in LC cells to be tilted to the orientation needed for modulation. The response could be analyzed from anchoring effects and cell gap effects. The anchoring effects refer to the anisotropic part of the interfacial free energy for the alignment layer [22]. The cell gap refers to the thickness of the LC layer. The response time is proportional to , where is related to the anchoring energy and is the cell gap [23]. Assuming strong anchoring effects, the reflective LCoS could respond four times faster than the transmissive LC-SLM for the same phase retardation. For the LCoS, it takes milliseconds to refresh a grayscale image.
The SLMs are pixelated digital devices consisting of millions of pixels (such as the resolution of 1920 × 1080). For each pixel, the pixel size and fill factor are two key parameters. For instance, the pixel size (pixel pitch) of commercial SLM could be so that the highest spatial frequency of the image displayed on the SLM is limited. A smaller pixel pitch leads to better resolution and larger diffraction angles. The fill factor influences the intensity of the zeroth order in the modulated diffracted beam [24]. The zeroth order could disturb the image as well as the calibration procedure so that the SLM with a high fill factor is preferred. Even when the fill factor is 100%, the zeroth order cannot be eliminated because of the crosstalk [25].
For high-precision applications of the SLM, the properly polarized incident beam with an illumination angle could lead to a reduction or increase of the phase modulation. Besides, illuminating anisotropic LC with a large angle could lead to multi-reflection on the surface of the layer of LC-SLM or LCoS, in which the condition of the unwanted additional phase related to the addressed grayscale could appear [26]. Hence, normal illumination with proper polarization is the most favorable for phase-only LC-SLM while uploading a grayscale image of complexity, such as the application of holographic display. Alternatively, the incident angle for application could be held as the same as the illumination angle for the calibration procedure if the phase distortion is tolerable. Along with the illumination angle, the power of the incident laser could cause local heating. The phase modulation characteristic could vary with incident power so that the calibration could be carried out under the same incident laser power as the application to minimize the local heating effects [11]. Besides, the threshold of the damage power of the SLM nowadays could be 2 W/cm2.
3. Interferometric Phase Calibration Method
The SLM phase calibration could be treated as a modulated phase detection process with a foregone changing grayscale pattern uploaded on SLM. Due to the extremely low detection rate of the electrical photo-electric detector compared to the frequency of the light, directly detecting the phase of the light is an impossible mission using an available detector which could record the intensity only. The interferometric technique could be utilized to record and reconstruct both the intensity and phase by mathematical methods. For instance, the interference fringes of two monochromatic plane waves with the same direction of polarization could be described as:
where and are the intensity distributions on the detection plane of two beams, is the phase difference between the two beams, and is the interference pattern distribution. Holding one beam and introducing a shifted phase to the other, the shifted phase difference of the two beams could lead to the displacement of interference fringes. For phase calibration of the SLM, the interference fringes could be generated by superposing the modulated beam from the SLM with a foregone reference beam. By changing the grayscale of the pattern uploaded on SLM, the modulated phase could be derived from the displacement of the fringes or other changes on the interferograms. In the interferometric methods, the reference beam could come from a certain zone or outside of SLM. The measured phase values are the relatively shifted phase introduced by changing the uploaded grayscale pattern on SLM, instead of the absolute phase of the modulated beam. For the interferometric calibration methods, the beams with approximately equal intensity are needed for good contrast on the interferograms.
3.1. Self-Referenced Method
The self-referenced method is one of the interferometric phase calibration methods which uses different parts of the SLM’s active area to realize interference patterns. In this method, the active area in SLM could be divided into two or more zones, to act as a referenced zone and measured phase-shifted zone, respectively. To generate the measured beam, a series of grayscale patterns are uploaded on the modulated zone and the wave passing through the region will be modulated with a shifted phase related to the addressed grayscale on the SLM pixels. Meanwhile, the addressed grayscale on the referenced zone remains unchanged or changed periodically to realize interference with the measured beam. The shifted phase could be derived from the displacement or deformation of the interference fringes.
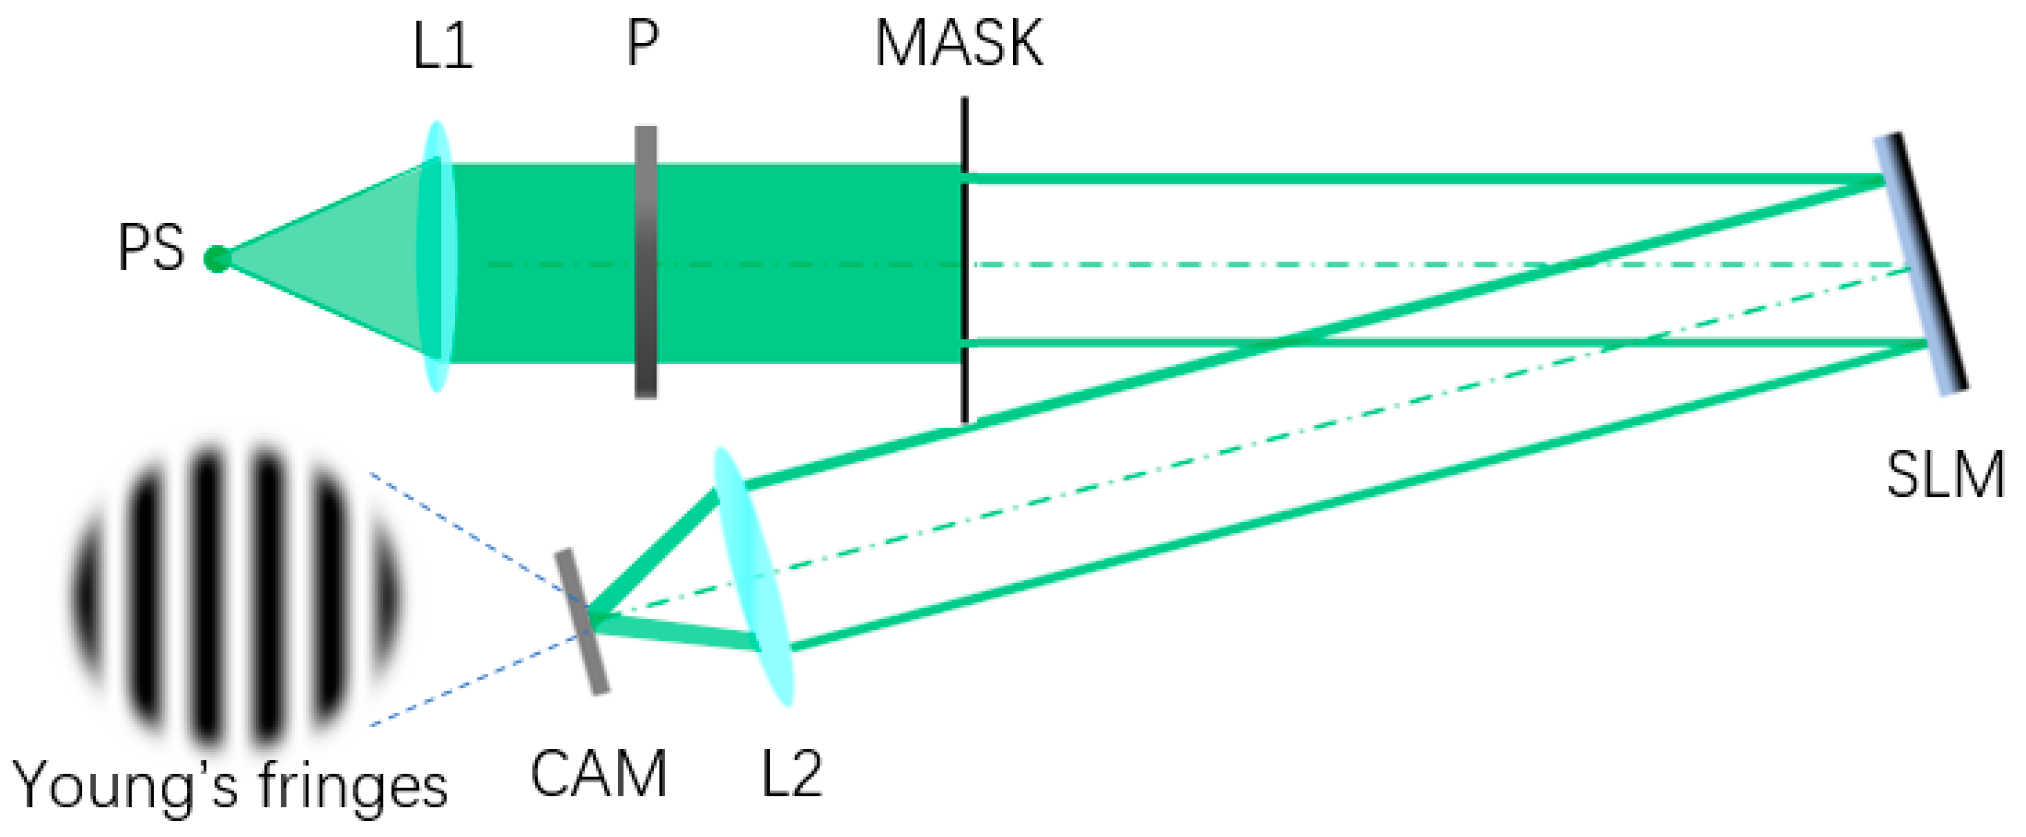
The earliest experimental arrangement for realizing interference is developed by Young, which inspires the calibration procedure naturally. Nowadays, the most popular phase modulation measurements experimental setup recommended by SLM suppliers in the manual book is based on the division of wavefronts as shown in Figure 3. The wavelength of the light source depends on the working wavelength range of the SLM. A camera is used for capturing the interference fringes. The measurement of the modulated phase could be carried out by remaining the grayscale of one half of the SLM a constant grayscale, while changing the grayscale of the other half of the SLM from 0 to 255 in grayscale gradually. The relatively shifted phase caused by changing the grayscale can be derived from Equation (3) and they could be one to one corresponding to the known grayscales for establishing the grayscale-phase relation. The measured grayscale-phase relation or LUT for the gamma curve could be sent to the driver of SLM by ports according to the manual for better performance of SLM. The setup for the phase measurement of transmissive LC-SLM is shown in reference [13].
In this method, the phase calibration is easy to align for the compact optical structure. However, only the global grayscale-phase relation could be derived. This is because the phase change of the half active area is represented by a beam with the width of a hole on the mask. In addition, the spatial nonuniformity of the SLM could not be characterized by using this method.
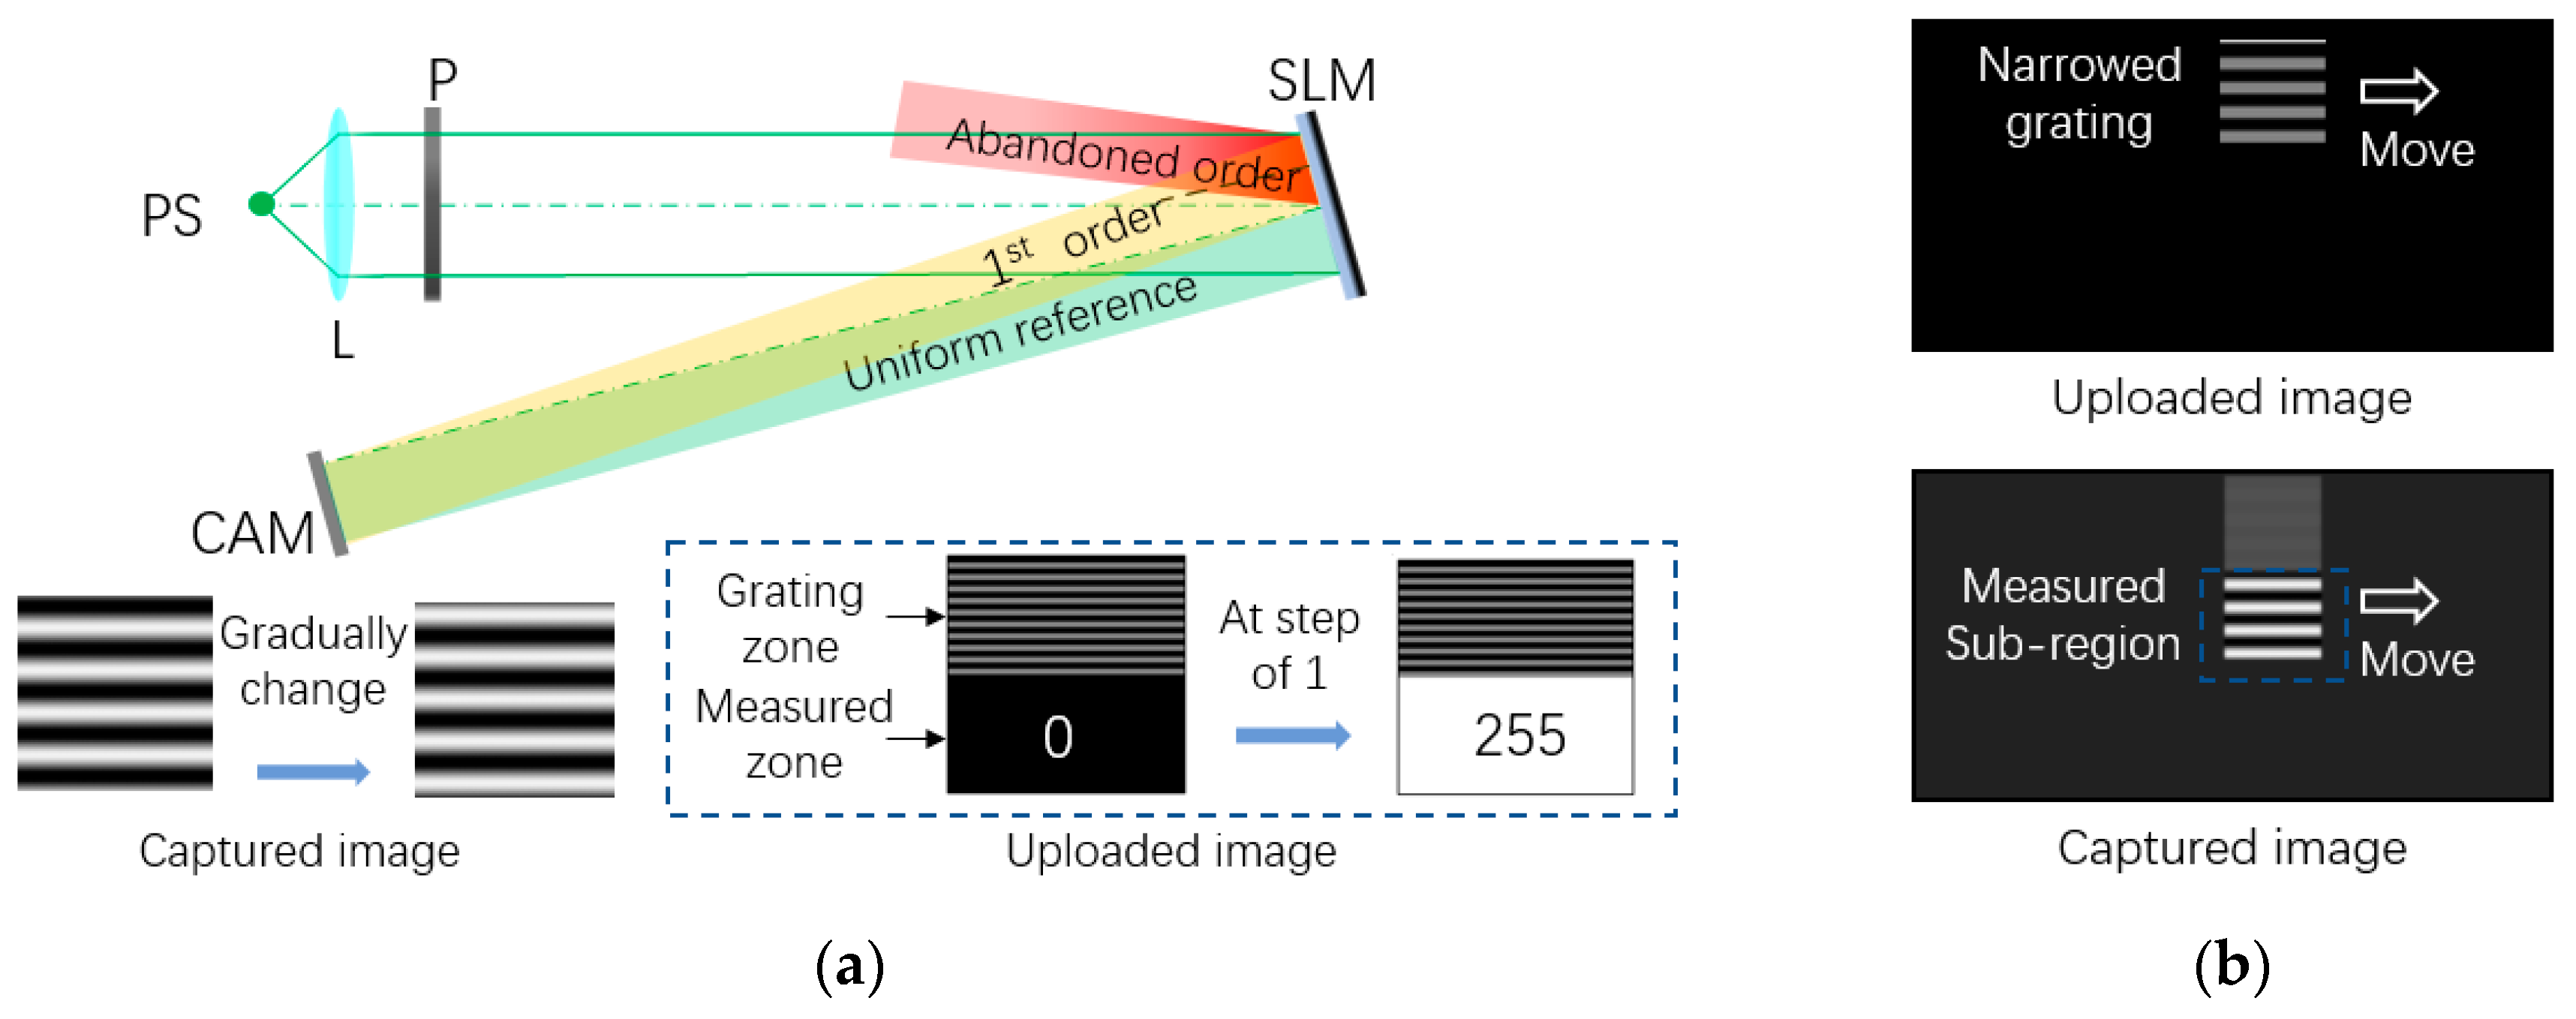
A good solution for spatial nonuniformity measurement has been proposed [21,27]. The configuration is shown in Figure 4a. Firstly, the global LUT is measured. The active area on SLM (PLUTO, Holoeye Photonics AG, Germany) is sorted into two zones, the uniform zone and the grating zone. The incident beam hit on both the uniform zone and grating zone. The uniform zone is the uploaded patterns in which the grayscales are uniformly distributed and changed from 0 to 255 at the step of 1. In addition, the grating zone is uploaded with patterns of columns of binary grayscales to form a phase grating. The period of the grating could be chosen according to the optical configuration. The reflected beam from the grating zone could be diffracted into the zeroth order and the first orders. One of the first orders beams interferes with the beam coming from the uniform zone to make the interference fringes. As shown in Figure 4a, the shifted phase of the uniform zone could be derived by the interference fringe’s displacement related to the changed grayscales.
The fringes move continuously, and the camera used for capturing the fringes is a discrete device, instead. The fringes’ displacements smaller than one-pixel size of the camera could be spotted by grayscales changes on the captured image. By using discrete Fourier transform [21], the fringes’ displacements could be derived from arguments of two peaks in the Fourier domain, which vary with the fringes’ positions or grayscales of interference on the captured image.
This method could be utilized for spatial nonuniformity measurement as well. Before the measurement, a rectangular array of a 128-pixel-diameter pupil mask is uploaded sequentially on SLM for matching the SLM and camera coordinates. During the spatial nonuniformity measurement, the SLM is uploaded with the pattern of a 128-pixel width-narrowed grating unit on a uniform grayscale background as shown in Figure 4b. The grating unit is composed of eight 16-pixel-period columns, and the first diffraction orders diffracted by the narrowed grating will cause interference with the beams coming from the uniform area. By changing the grayscale on the background uniform zone and analyzing the fringes’ displacements on the captured image, the shifted phase on the 128 × 128-pixel blocks of uniform background zones could be acquired. The spatial nonuniformity measurement could be carried out by moving the grating unit and testing the shifted phase in the different regions of SLM, and the grayscale-phase relation for sub-regions around the SLM panel (128 × 128 pixels for instance) could be built. To improve the spatial resolution, a smaller grating unit could be built and the spatial resolution of several pixels could be reached. For improving the performance of SLM with calibration, the grayscale image for uploading could be pre-modified by matrix operation for each sub-region [11].
The self-referenced phase calibration method could be simple and easy to apply, which makes it a suggested method in the manual of the SLM products. However, the reference beam comes from a certain active area of the SLM, which means that the measured phase irregular or distortion may come from the reference zones instead of the measured zones. In addition, it could lead to a misunderstanding on the phase measurement of the measured beam. For minimizing the phase distortion from the self-reference beam, a joint analysis of the interferograms for the same region on SLM could be carried out. Considering that the reference beam can be held still, so can the phase distortion induced by the reference beam, the compensate could be carried out.
3.2. Out-Referenced Method
The out-referenced interferometric method uses the reference wave coming from outside the SLM to realize the interference with the measured modulated beam. It is flexible to adjust the foregone reference wave to make a variety of setup transformations, such as the four-step phase-shifting alignment with piezo-mirror which could measure global LUT and the spatial uniformity [28,29]. Another method is using a reference mirror to compose a Twyman-Green interferometer calibration system [30,31]. With all kinds of interferometric setups, the phase nonuniformity of SLM can be measured precisely. Considerations regarding the avoidance of environmental turbulence should be made, such as air fluctuation.
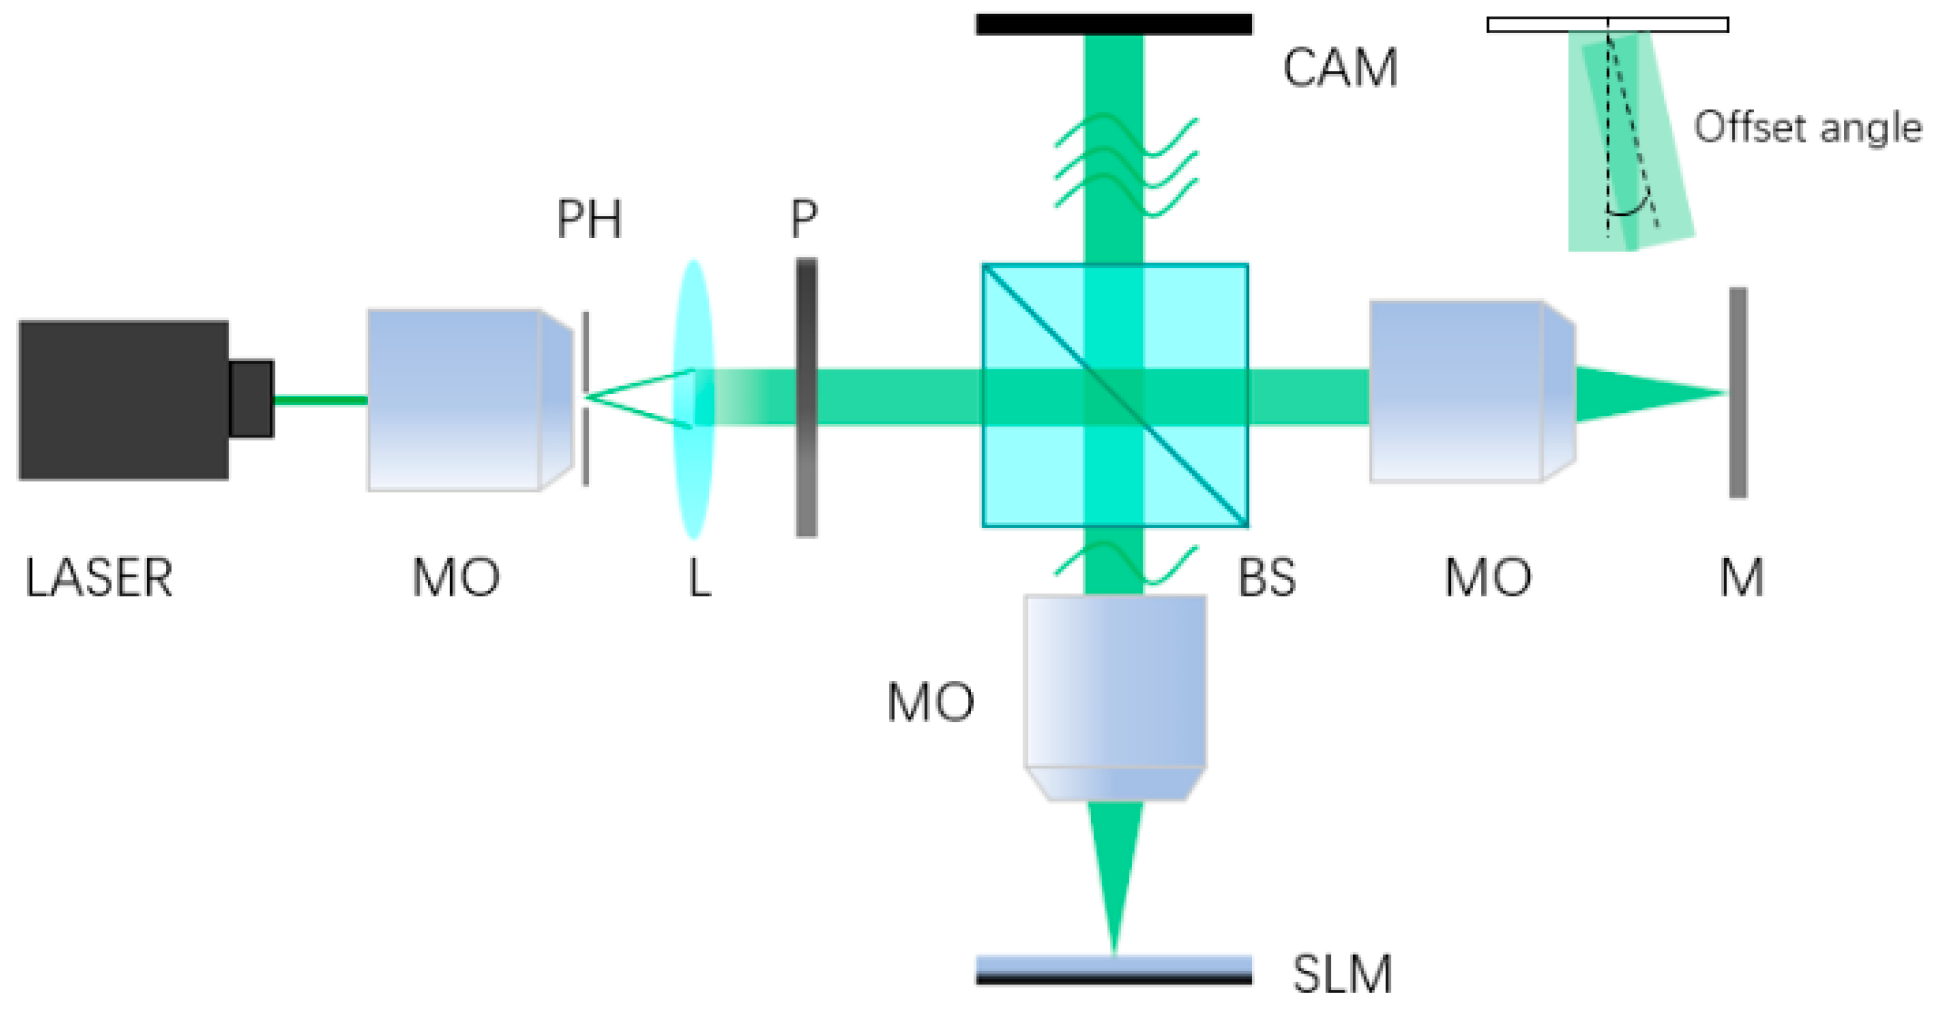
Digital holography technology plays a role in phase recording and reconstruction [32], and it is reasonable to draw lessons from it. One of the out-referenced SLM calibration methods inspired by digital holographic microscopy (DHM) is shown in Figure 5 [33]. The illumination wavelength is 532 nm, and the modulated wavefronts of SLM (Holoeye Pluto, resolution 1920 × 1080, pixel pitch 8 microns) are gathered and magnified by a microscope objective (×10, NA = 0.25). As one microscope objective is used for pixel magnification, the other microscope objective is used for compensation of the quadratic phase term [34]. A camera is used for capturing the hologram of the SLM. There is an offset angle between the reference beam and object beam so that the twin image can be filtered in the spectrum domain [35]. Theoretically, this DHM setup is able to reach the diffraction resolution of approximately 1.6 microns according to the Rayleigh criterion for coherent illumination [36]. Apparently, the single pixel sized phase calibration can be realized using this setup. However, the size of the SLM active area is usually larger than 10 mm × 20 mm, and the FOV(field of view) of the DHM setup is roughly smaller than 10 mm × 10 mm due to a limited space bandwidth [37]. Therefore, the displacements of CCD are needed for capturing the complete SLM active area.
The methods based on DHM [14] and phase shifting [29] are the two calibration methods able to reach single pixel spatial resolution. However, not all the proposed methods using sophisticated setups to realize the quantitative phase imaging could be used directly for phase calibration, such as Fourier Ptychography [38]. The active area of SLM is usually larger than the FOV of the accurate quantitative phase imaging system with a good horizontal resolution. In addition, there is also the limitation of illumination.
4. Diffractive Phase Calibration Method
The diffractive phase calibration method uses the SLM uploaded with virtual optical elements or coded grayscale patterns to transform the phase distribution into the spectrum or unique intensity features. There are also other methods based on the polarization technique. Compared to the interferometric methods, some of the diffractive calibration systems are more compact with less optical elements, and some distortion induced by the reference beam could be avoided. Besides, some diffractive calibration methods could be carried out without replacing the on-duty setup [39], which makes it suitable for satisfying extremely high-precision requirements.
4.1. Diffraction Pattern Analyzed Method
The diffraction pattern analyzed method is a kind of method using diffraction theory to connect the grayscale-related phase with the directly diffracted pattern changes in the far field. The uploaded grayscale pattern could be a coded image or refreshed simple moving units on a uniform background. The global grayscale-phase relation could be acquired from the diffraction pattern changes, and the spatial nonuniformity could be measured.
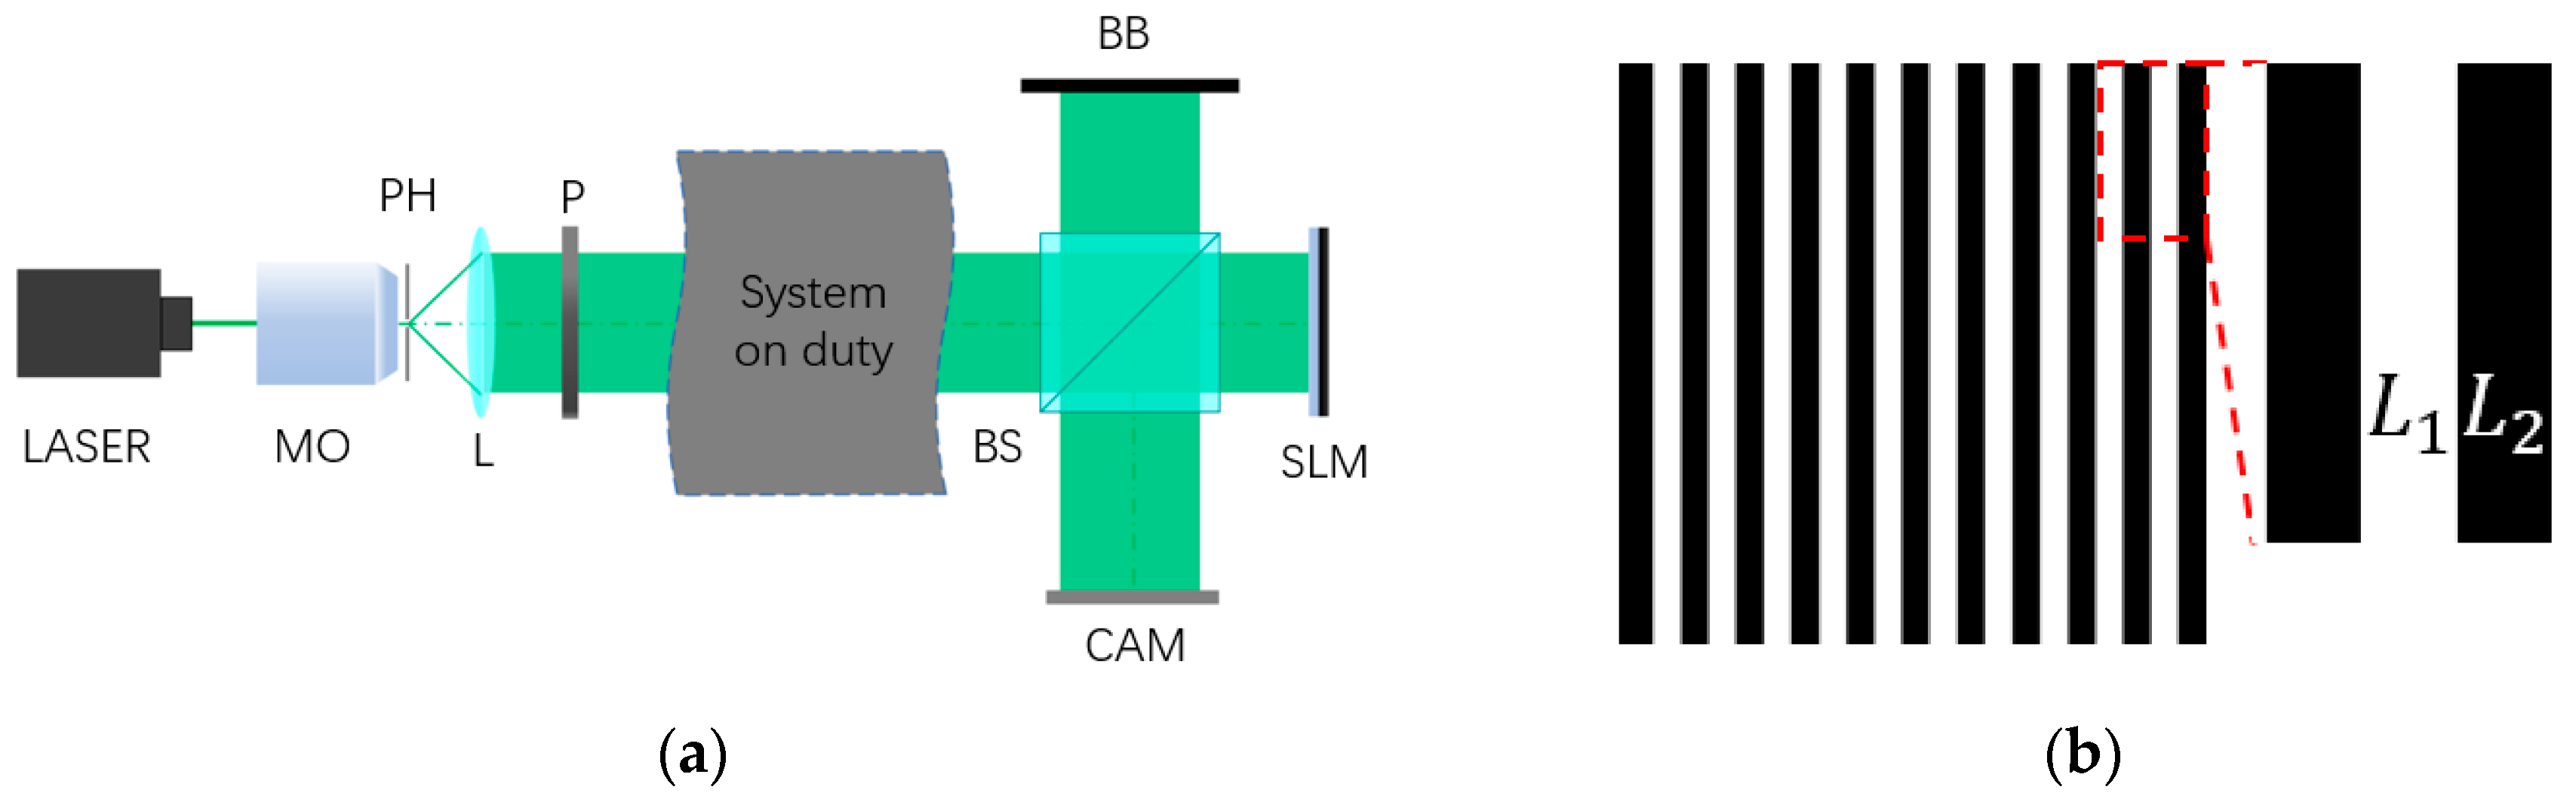
In an original diffraction analyzed method [40], an LC television panel removed from Epson projector (VPJ-700) is calibrated. As shown in Figure 6b, a Ronchi grating with two grayscales and at 50% duty ratio is designed and the grayscale-related phases of the grating are and respectively, so that the relative grayscale and phase are , . The grating period is , the width of the grating along the -direction is , and is an integer. In addition, the phase transmittance equation along the -direction can be described as:
The in Equation (4) is the rectangular function, and the is the comb function. With uniform monochromatic plane wave illumination, spectrum intensity distribution can be described as Fourier transform: . In addition, the spectrum pattern in the Fourier plane along the -axis () is:
The relation between the spectrum intensity distribution and the phase difference can be acquired by holding the uploaded with changing from 0 to 255 (8-bit) and measuring the intensity changes of the spectrum. A global grayscale-phase relation can be acquired, and this method can also be modified for spatially nonuniformity measurement.
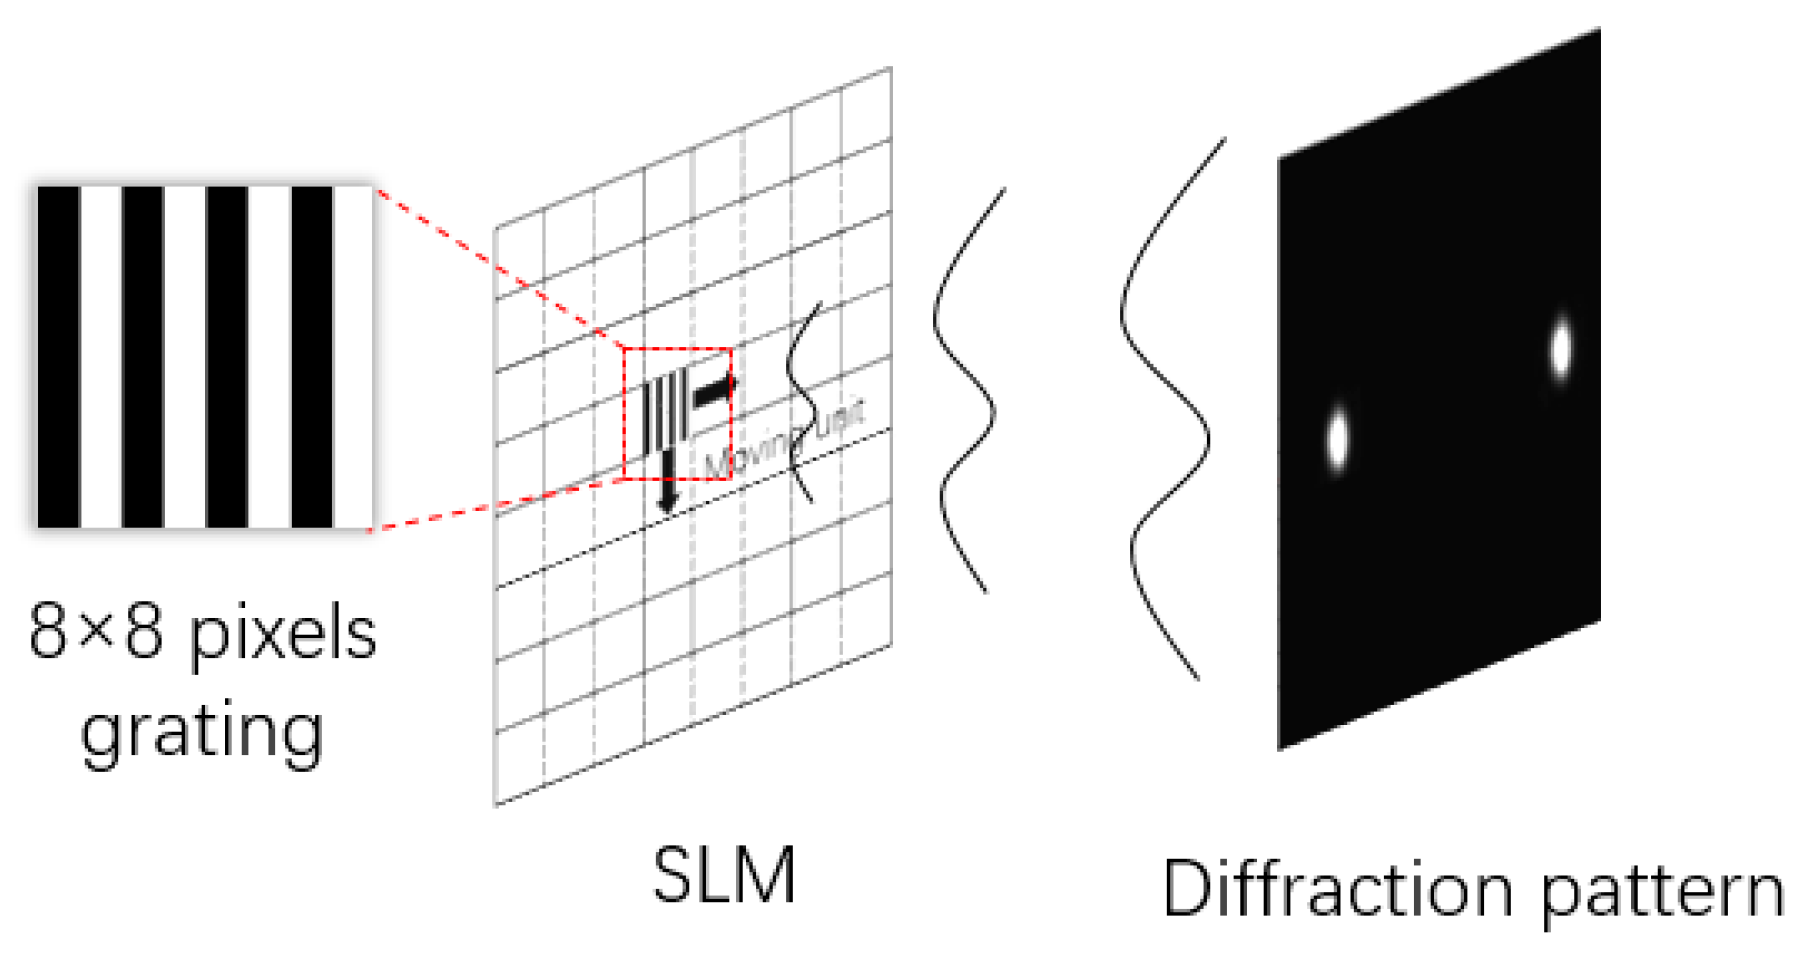
The calibration of SLM suffering from spatially-varying phase response could be realized [11]. The calibrated SLM is from BNS (HSPDM512 1064-PCIe, Boulder Nonlinear Systems). As shown in Figure 7, the pixels on the SLM are composed of 8 × 8-pixel subsections. Because of the small grating size compared to the diffraction distance, the captured image could be analyzed as Fraunhofer diffraction pattern [41]. Neglecting the coefficient, the Fraunhofer diffraction pattern could be treated as the spectrum of the grating. The grayscale-phase relation of the 8 × 8-pixel subsection can be measured according to Equation (5). Hence, the nonuniformity could be measured by moving the small grating inside the subsection.
The checkerboard pattern can also be diffracted for calibration based on the diffractive method [42]. A checkerboard phase pattern with binary phase distribution is uploaded and the far field Fraunhofer diffraction pattern is captured. The related phase could be measured by analyzing the intensity of first orders in the spectrum domain.
By using this kind of diffractive method based on spectrum or Fraunhofer diffraction analysis, the global grayscale-phase LUT and nonuniformity measurement could be carried out. However, a desired camera with a high sensitivity to intensity changes and high signal-to-noise ratio is needed, for the reason that the derived phase is related to the measured intensity directly. Some attempts using the phase retrieval algorithm to reconstruct the phase from the diffraction pattern have been presented [43,44].
4.2. Optical Elements Generated Method
The intensity distribution of the light traveling through the optical elements could be affected by the phase distribution inside the elements. In addition, SLM phase modulation could be measured by generating the virtual elements on the SLM. However, not all of the principles of phase optical elements could be referenced to calibration. The phase distribution of the elements should be binary for variable control.
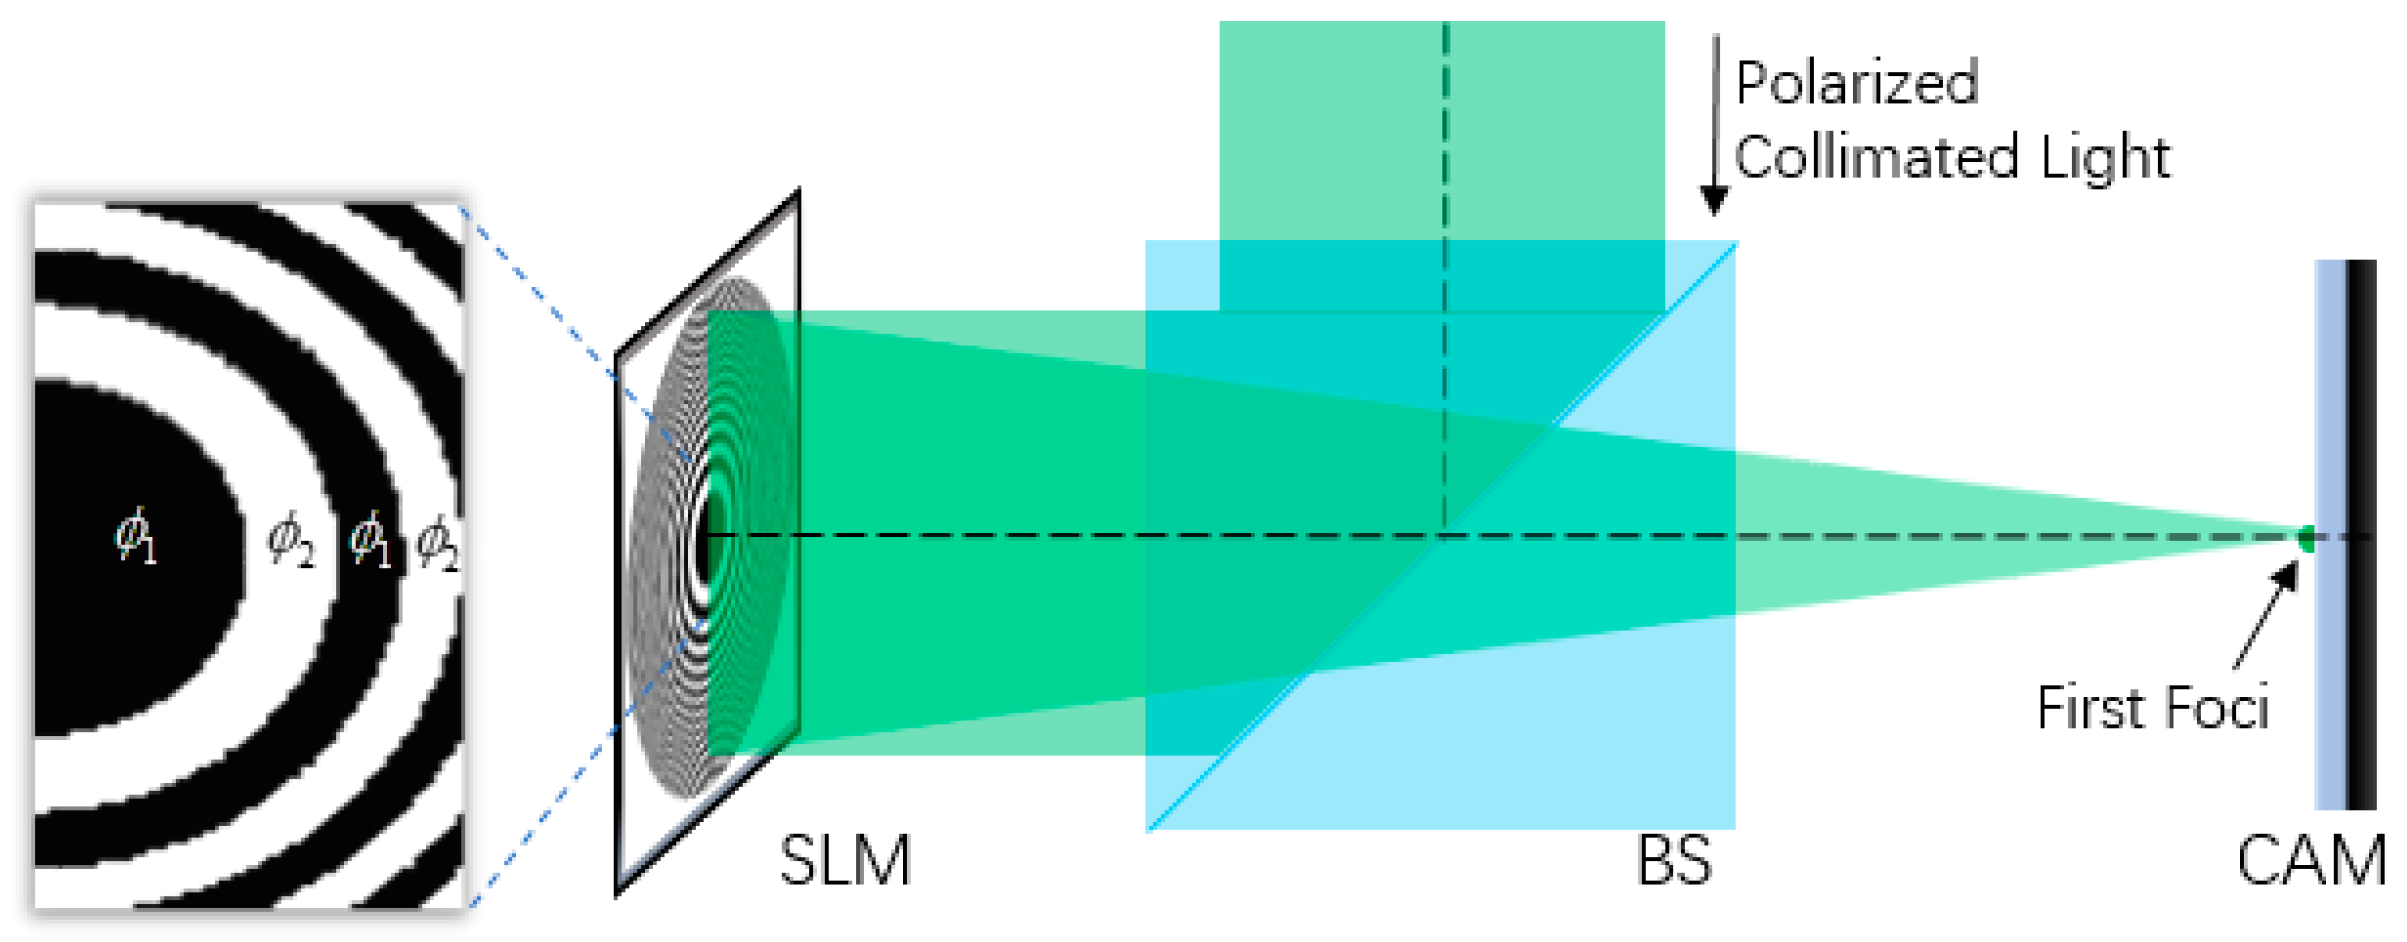
A simple and robust method for determining the calibration function with binary phase Fresnel lenses is proposed [45]. As shown in Figure 8, a Fresnel lens is designed with binary phase level distribution: and . The pattern of designed lens is uploaded on the SLM (PLUTO, Holoeye Photonics AG, Germany), which is illuminated by a collimated polarized light. The is the ratio of the irradiance of the first foci and the illumination intensity on the SLM. It can be described as: , and the maximum can be achieved while the . For the calibration procedure, the region can be set to 0 grayscale while the can be changed from 0 to 255. The shifted phase on regions is zero, and the shifted phase on regions changes from zero to the max. As the illumination intensity on the SLM is set to be constant, the irradiance change on the first foci is proportional with . By measuring the irradiance on the first foci while changing with the fixed , the grayscale-phase relation can be derived.
Using this kind of optical element feature-based calibration method means that a global grayscale-phase LUT could be acquired. Because of the limitation on optical element size for optical feature replication, the spatial nonuniformity measurement is limited.
4.3. Polarization Method
In addition to the radiometric diffraction methods, there are also polarization-based diffraction methods. With the help of the Mueller matrices imaging procedures, the spatial nonuniformity of SLM could be measured with a single pixel resolution (~11.5 μm) [46]. However, this method is very complicated. Another polarization-based system is simple and easy to align, but only the global grayscale-phase relation could be derived [47].
5. Discussion
Two categories of phase calibration methods for SLM are introduced. All of the calibration procedures promote the SLM performance on phase modulation. However, due to the different principles used in the methods, they are different in many ways.
As shown in Table 1, all the calibration methods for SLM could calibrate global LUT and measure spatial nonuniformity, except for the optical elements-generated method. For the spatial nonuniformity measurement of the self-referenced calibration method, the self-referenced beam from certain zones on SLM is supposed to be uniform in theory. But it may not be ideally uniform in practice. Therefore, the spatial nonuniformity measurement may be carried out with errors. As for the single pixel level phase measurement, the out-referenced interferometric method reaches the accuracy of single-pixel resolution with flexible setups. The single pixel measurement ability comes with more optical elements and a complicated setup configuration compared with other calibration methods. The setups of diffraction methods and self-referenced interferometric methods are compact and robust concerning the environmental disturbance. The most charming feature is that the calibration can be carried out without replacing the SLM. In addition, it is practical for optical alignments with high precision. The proposed polarization methods are like a lever with complexity and spatial resolution on both sides. The method which is able to measure the pixel level spatial nonuniformity comes with a complicated data-processing procedure. The simple one could only realize the global measurement.
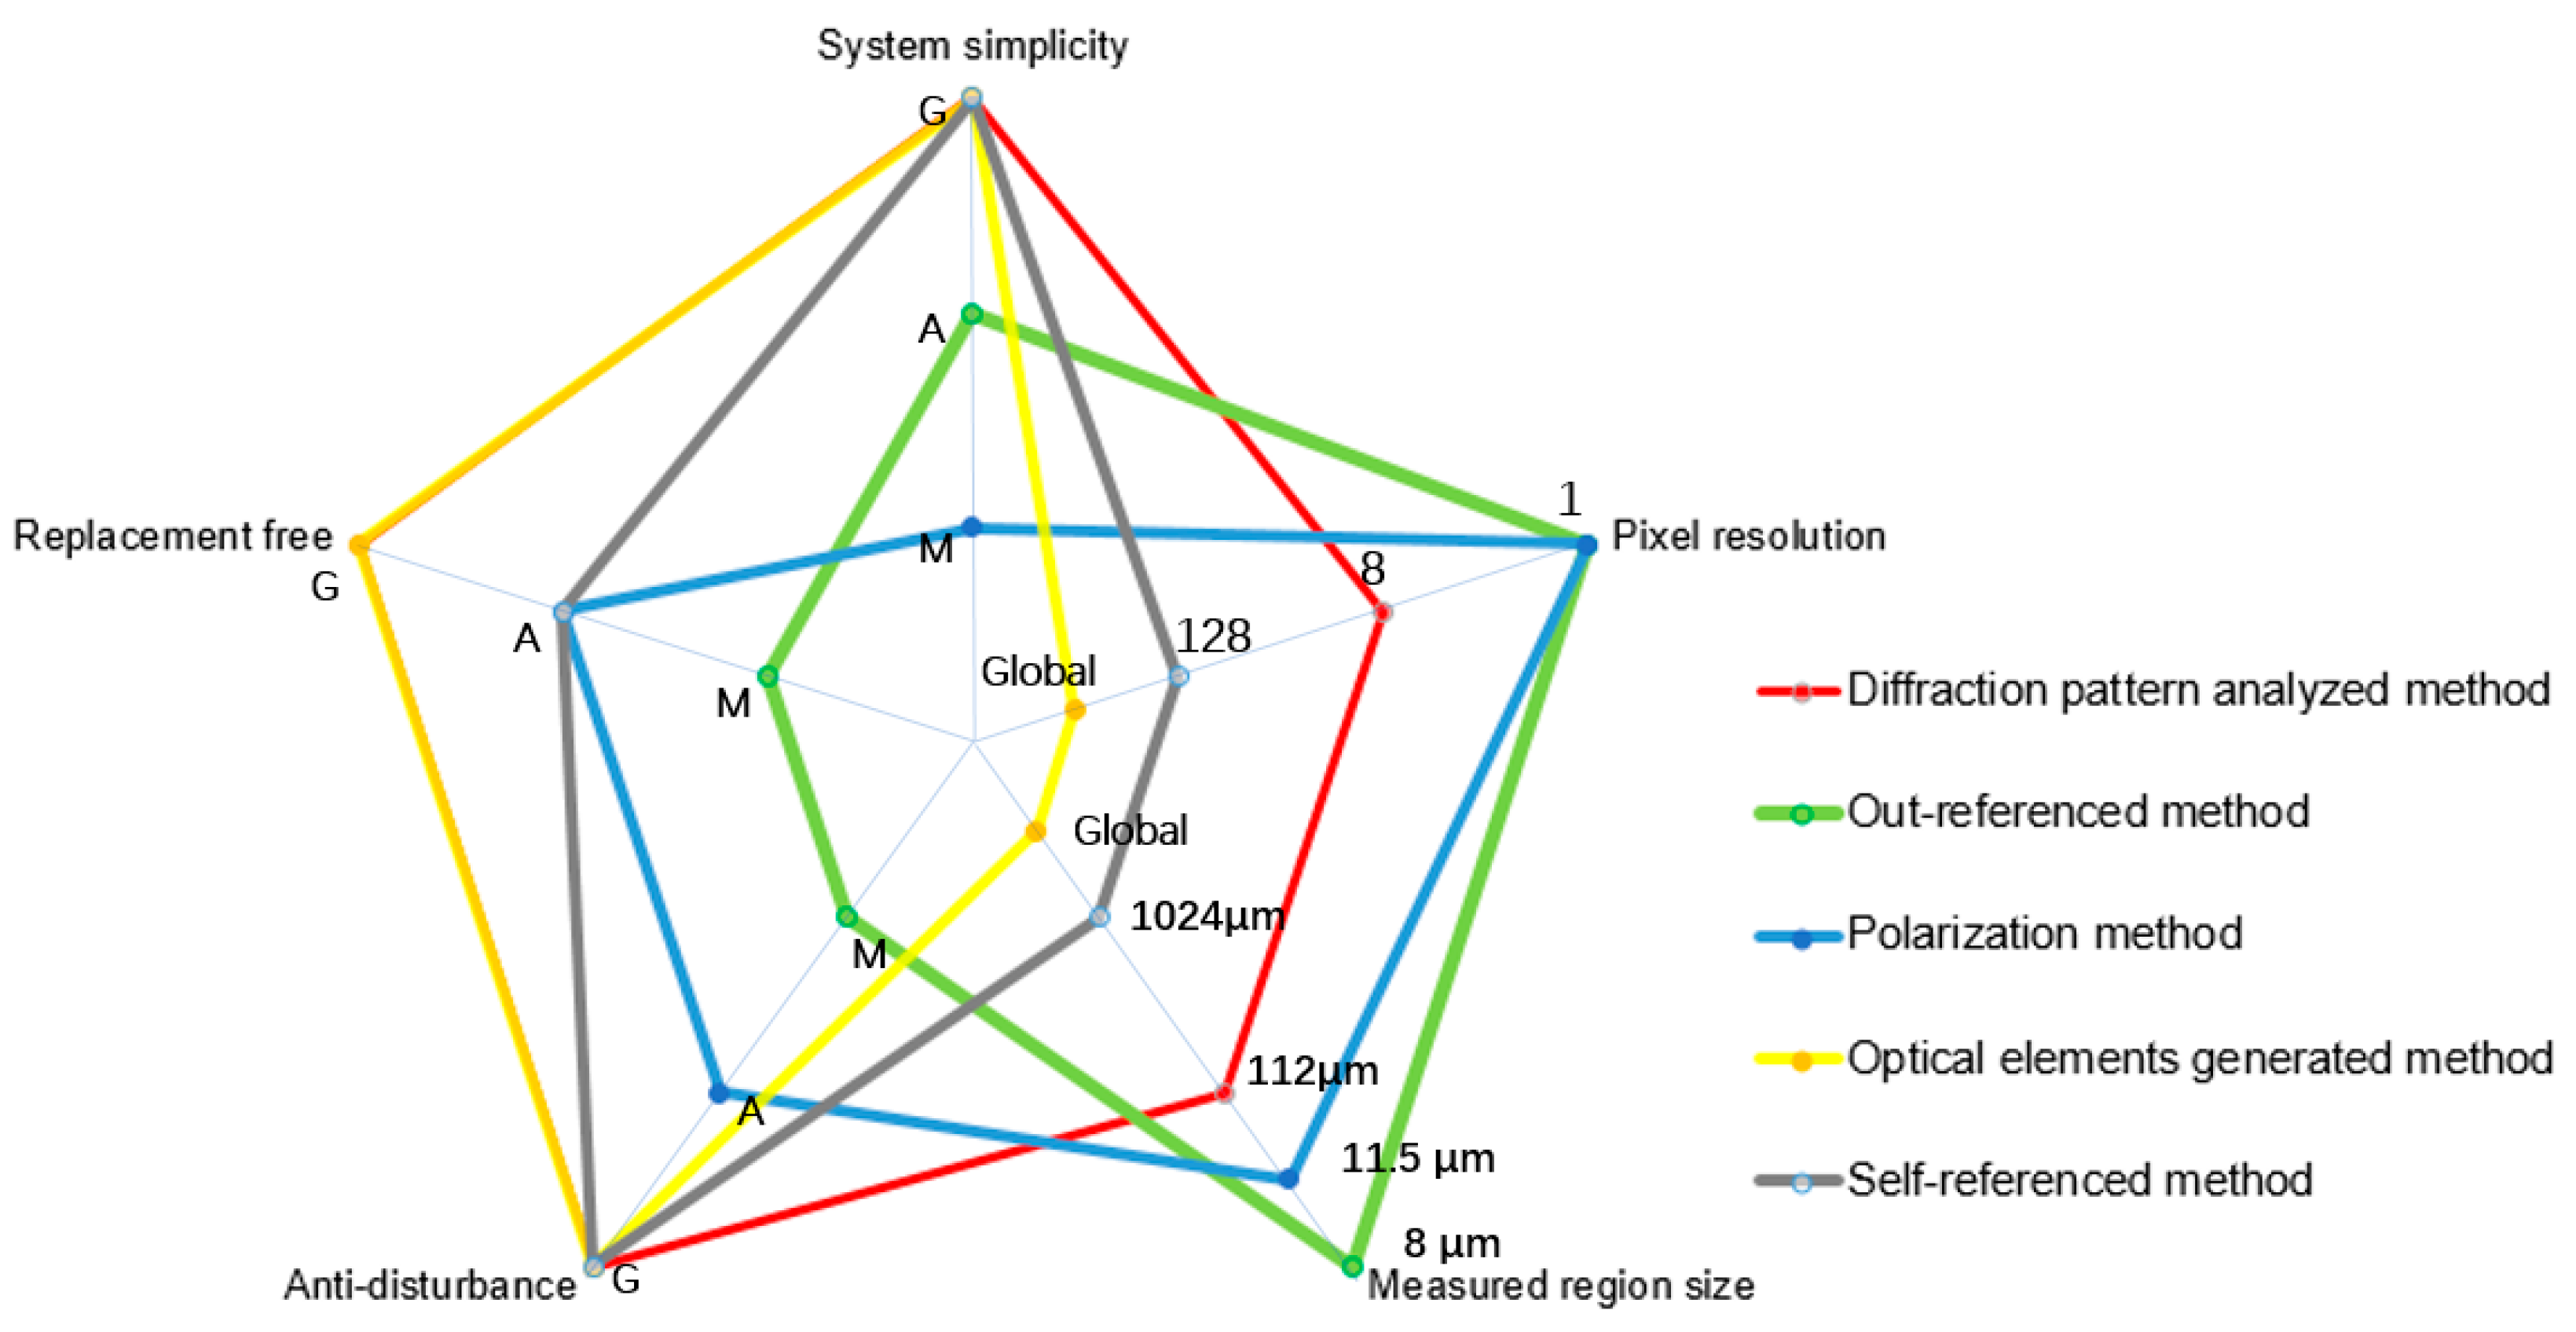
As shown in Figure 9, all the calibration methods mentioned in the article are presented under the consideration of five aspects: system simplicity; spatial resolution; measured region size; environment disturbance isolation; and SLM replacement after calibration. The measured region size is calculated by multiplying the pixel number of spatial resolution by the pixel pitch. The system simplicity, SLM replacement, and environmental disturbance isolation are evaluated at three levels: marginal, acceptable, and good. In addition, the diffraction pattern analyzed methods could be more functional with considerations of the five aspects.
6. Conclusions
The SLM phase calibration is essential for realizing high-precision phase modulation. The out-referenced method is suitable for high-precision systems due to its single pixel calibration ability; however, the SLM needs to be replaced. The polarization method could reach a high phase measurement accuracy of approximately 11.5 μm using a polarimeter, but the cost is complicated data processing. The self-referenced methods may come with inherited phase distortion. The diffraction pattern analyzed calibration methods are more practical for in-situ calibration. The spatial nonuniformity measurement could be carried out with easy alignments. With the help of advanced algorithms for phase reconstruction, the diffractive method could be more powerful.
Author Contributions
R.L. made the original draft preparation. R.L. and L.C. made the editing.
Funding
This research is supported by the National Key R & D Program of China (No. 2018YFF0212302), National Key R & D Program of China (No. 2017YFF0106400) and National Natural Science Foundation of China (No. 61827825).
Conflicts of Interest
The authors declare no conflict of interest.
References
- Zaperty, W.; Kozacki, T.; Kujawińska, M. Multi-SLM color holographic 3D display based on RGB spatial filter. J. Disp. Technol. 2016, 12, 1724–1731. [Google Scholar] [CrossRef]
- Han, Z.; Yan, B.; Qi, Y.; Wang, Y.; Wang, Y. Color holographic display using single chip LCOS. Appl. Opt. 2019, 58, 69–75. [Google Scholar] [CrossRef]
- Koba, M.I. High-Resolution Spatial Light Modulator for 3-Dimensional Holographic Display. U.S. Patent 6819469B1, 16 November 2004. [Google Scholar]
- Reynoso-Alvarez, A.; Strojnik, M.; García-Torales, G.; Flores-Nuñez, J.L. A high precision phase-shifter modulator in a shearing interferometric system. In Proceedings of the Infrared Remote Sensing and Instrumentation XXV, San Diego, CA, USA, 30 August 2017. [Google Scholar]
- Kacperski, J.; Kujawinska, M. Phase only SLM as a reference element in Twyman-Green laser interferometer for MEMS measurement. In Proceedings of the Optical Measurement Systems for Industrial Inspection V, Munich, Germany, 18 June 2007. [Google Scholar]
- Wulff, K.D.; Cole, D.G.; Clark, L.R.; Dileonardo, R.; Leach, J.; Cooper, J.; Gibson, G.; Padgett, M.J. Aberration correction in holographic optical tweezers. Opt. Express 2006, 14, 4169–4174. [Google Scholar] [CrossRef] [PubMed] [Green Version]
- Peng, T.; Li, R.; An, S.; Yu, X.; Zhou, M.; Bai, C.; Liang, Y.; Lei, M.; Zhang, C.; Yao, B.; et al. Real-time optical manipulation of particles through turbid media. Opt. Express 2019, 27, 4858–4866. [Google Scholar] [CrossRef]
- Duerr, P.; Dauderstaedt, U.; Kunze, D.; Auvert, M.; Bakke, T.; Schenk, H.; Lakner, H. Characterization of spatial light modulators for microlithography. In Proceedings of the MOEMS Display and Imaging Systems, San Jose, CA, USA, 20 January 2003. [Google Scholar]
- Tukker, T.W.; Pandey, N.; Verschuren, C.A. Illumination System for a Lithographic or Inspection Apparatus. U.S. Patent 20180004095A1, 1 April 2018. [Google Scholar]
- Mikhaylov, D.; Kiedrowski, T.; Lasagni, A.F. Beam Shaping Using Two Spatial Light Modulators for Ultrashort Pulse Laser Ablation of Metals; SPIE: San Francisco, CA, USA, 2019; Volume 10906. [Google Scholar]
- Engström, D.; Persson, M.; Bengtsson, J.; Goksör, M. Calibration of spatial light modulators suffering from spatially varying phase response. Opt. Express 2013, 21, 16086–16103. [Google Scholar] [CrossRef]
- Bentley, J.B.; Davis, J.A.; Albero, J.; Moreno, I. Self-interferometric technique for visualization of phase patterns encoded onto a liquid-crystal display. Appl. Opt. 2006, 45, 7791–7794. [Google Scholar] [CrossRef]
- Bergeron, A.; Gauvin, J.; Gagnon, F.; Gingras, D.; Arsenault, H.H.; Doucet, M. Phase calibration and applications of a liquid-crystal spatial light modulator. Appl. Opt. 1995, 34, 5133–5139. [Google Scholar] [CrossRef]
- Robertson, B.; Zhang, Z.; Redmond, M.M.; Collings, N.; Liu, J.; Lin, R.S.; Jeziorska-Chapman, A.M.; Moore, J.R.; Crossland, W.A.; Chu, D.P. Use of wavefront encoding in optical interconnects and fiber switches for cross talk mitigation. Appl. Opt. 2012, 51, 659–668. [Google Scholar] [CrossRef]
- Zhang, Z.; You, Z.; Chu, D. Fundamentals of phase-only liquid crystal on silicon (LCOS) devices. Light Sci. Amp. Appl. 2014, 3, e213. [Google Scholar] [CrossRef]
- Raynes, E.P. Optically active additives in twisted nematic devices. Rev. Phys. Appliq. 1975, 10, 117–120. [Google Scholar] [CrossRef]
- Schadt, M.; Helfrich, W. Voltage-dependent optical activity of a twisted nematic liquid crystal. Appl. Phys. Lett. 1971, 18, 127–128. [Google Scholar] [CrossRef]
- Yeh, P.; Gu, C. Optics of Liquid Crystal Displays, 2nd ed.; Wiley: Hoboken, NJ, USA, 2010; pp. 792–793. [Google Scholar]
- Dasgupta, P.; Das, M.K.; Das, B. physical properties of three liquid crystals with negative dielectric anisotropy from X-ray diffraction and optical birefringence measurements. Mol. Cryst. Liquid Cryst. 2011, 540, 154–161. [Google Scholar] [CrossRef]
- Kohns, P.; Schirmer, J.; Muravski, A.A.; Yakovenko, S.Y.; Bezborodov, V.; Dãbrowsk, R. Birefringence measurements of liquid crystals and an application: An achromatic waveplate. Liquid Cryst. 1996, 21, 841–846. [Google Scholar] [CrossRef]
- Fuentes, J.L.M.; Fernánde, E.J. Interferometric method for phase calibration in liquid crystal spatial light modulators using a self-generated diffraction-grating. Opt. Express 2016, 24, 14159–14171. [Google Scholar] [CrossRef] [PubMed]
- Yokoyama, H.; van Sprang, H.A. A novel method for determining the anchoring energy function at a nematic liquid crystal-wall interface from director distortions at high fields. J. Appl. Phys. 1985, 57, 4520–4526. [Google Scholar] [CrossRef]
- Zaperty, W.; Kozacki, T.; Gierwiało, R.; Kujawińska, M. The RGB imaging volumes alignment method for color holographic displays. In Proceedings of the Photonics Applications in Astronomy, Communications, Industry, and High-Energy Physics Experiments, Wilga, Poland, 28 September 2016. [Google Scholar]
- Zhang, H.; Xie, J.; Liu, J.; Wang, Y. Elimination of a zero-order beam induced by a pixelated spatial light modulator for holographic projection. Appl. Opt. 2009, 48, 5834–5841. [Google Scholar] [CrossRef] [PubMed]
- Persson, M.; Engström, D.; Goksör, M. Reducing the effect of pixel crosstalk in phase only spatial light modulators. Opt. Express 2012, 20, 22334–22343. [Google Scholar] [CrossRef] [PubMed]
- Martínez, J.L.; Moreno, I.; del Mar Sánchez-López, M.; Vargas, A.; García-Martínez, P. Analysis of multiple internal reflections in a parallel aligned liquid crystal on silicon SLM. Opt Express 2014, 22, 25866–25879. [Google Scholar]
- Zhao, Z.; Xiao, Z.; Zhuang, Y.; Zhang, H.; Zhao, H. An interferometric method for local phase modulation calibration of LC-SLM using self-generated phase grating. Rev. Sci. Ins. 2018, 89, 083116. [Google Scholar] [CrossRef]
- Mukhopadhyay, S.; Sarkar, S.; Bhattacharya, K.; Hazra, L. Polarization Phase Shifting Interferometric Technique for Phase Calibration of a Reflective Phase Spatial Light Modulator; SPIE: Bellingham, WA, USA, 2013; Volume 52, pp. 1–7. [Google Scholar]
- Xun, X.; Cohn, R.W. Phase calibration of spatially nonuniform spatial light modulators. Appl. Opt. 2004, 43, 6400–6406. [Google Scholar] [CrossRef]
- Zhang, H.; Zhang, J.; Wu, L. Evaluation of phase-only liquid crystal spatial light modulator for phase modulation performance using a Twyman–Green interferometer. Meas. Sci. Technol. 2007, 18, 1724–1728. [Google Scholar] [CrossRef]
- Otón, J.; Ambs, P.; Millán, M.S.; Pérez-Cabré, E. Multipoint phase calibration for improved compensation of inherent wavefront distortion in parallel aligned liquid crystal on silicon displays. Appl. Opt. 2007, 46, 5667–5679. [Google Scholar] [CrossRef]
- Schnars, U.; Falldorf, C.; Watson, J.; Jüptner, W. (Eds.) Digital Holography; Springer: Berlin, Germany, 2015; Chapter II; pp. 39–68. [Google Scholar]
- Yang, L.; Xia, J.; Chang, C.; Zhang, X.; Yang, Z.; Chen, J. Nonlinear dynamic phase response calibration by digital holographic microscopy. Appl. Opt. 2015, 54, 7799–7806. [Google Scholar] [CrossRef]
- Xia, J.; Zhu, W.; Heynderickx, I. 41.1: Three-dimensional Electro-Holographic Retinal Display. In SID Symposium Digest of Technical Papers; Blackwell Publishing Ltd.: Oxford, UK, 2011; pp. 591–594. [Google Scholar]
- Cuche, E.; Marquet, P.; Depeursinge, C. Spatial filtering for zero-order and twin-image elimination in digital off-axis holography. Appl. Opt. 2000, 39, 4070–4075. [Google Scholar] [CrossRef]
- Cotte, Y.; Toy, F.M.; Jourdain, P.; Pavillon, N.; Boss, D.E.; Magistretti, P.J.; Marquet, P.; Depeursinge, C.D. Marker-free phase nanoscopy. Nat. Photon. 2013, 7, 113. [Google Scholar] [CrossRef]
- Lohmann, A.W.; Dorsch, R.G.; Mendlovic, D.; Zalevsky, Z.; Ferreira, C. Space–bandwidth product of optical signals and systems. J. Opt. Soc. Am. A 1996, 13, 470–473. [Google Scholar] [CrossRef]
- Lee, B.; Hong, J.-Y.; Yoo, D.; Cho, J.; Jeong, Y.; Moon, S.; Lee, B. Single-shot phase retrieval via Fourier ptychographic microscopy. Optica 2018, 5, 976–983. [Google Scholar] [CrossRef]
- Engström, D.; Persson, M.; Goksör, M. Spatial Phase calibration used to improve holographic optical trapping. In Proceedings of the Biomedical Optics and 3-D Imaging, Miami, FL, USA, 28 April 2012. [Google Scholar]
- Zhang, Z.; Lu, G.; Francis, T.; Yu, S. Simple Method for Measuring Phase Modulation in Liquid Crystal Televisions; SPIE: Bellingham, WA, USA, 1994; Volume 33, pp. 3018–3022. [Google Scholar]
- Born, M.; Wolf, E. Principles of Optics, 7th ed.; Cambridge University Press: Cambridge, UK, 1999; pp. 425–430, Chapter VIII. [Google Scholar]
- Chen, X.; Chen, X.; Li, J.; Chen, D. A calibration algorithm for the voltage-phase characteristic of a liquid crystal optical phased array. In Proceedings of the Selected Papers of the Photoelectronic Technology Committee Conferences, Harbin, China, 5 November 2015. [Google Scholar]
- Kohler, C.; Zhang, F.; Osten, W. Characterization of a spatial light modulator and its application in phase retrieval. Appl. Opt. 2009, 48, 4003–4008. [Google Scholar] [CrossRef]
- Hart, N.W.; Roggemann, M.C.; Sergeyev, A.V.; Schulz, T.J. Characterizing Static Aberrations in Liquid Crystal Spatial Light Modulators Using Phase Retrieval; SPIE: Bellingham, WA, USA, 2007; Volume 46, pp. 1–7. [Google Scholar]
- Mendoza-Yero, O.; Mínguez-Vega, G.; Martínez-León, L.; Carbonell-Leal, M.; Fernández-Alonso, M.; Doñate-Buendía, C.; Pérez-Vizcaíno, J.; Lancis, J. Diffraction-based phase calibration of spatial light modulators with binary phase fresnel lenses. J. Disp. Technol. 2016, 12, 1027–1032. [Google Scholar] [CrossRef]
- Wolfe, J.E.; Chipman, R.A. Polarimetric characterization of liquid-crystal-on-silicon panels. Appl. Opt. 2006, 45, 1688–1703. [Google Scholar] [CrossRef]
- Martínez, F.J.; Márquez, A.; Gallego, S.; Ortuño, M.; Francés, J.; Beléndez, A.; Pascual, I. Averaged stokes polarimetry applied to evaluate retardance and flicker in PA-LCoS devices. Opt. Express 2014, 22, 15064–15074. [Google Scholar] [CrossRef] [PubMed]
Figure 1.
(a) Basic structure of LCoS. (b) Schematic of zero-twisted ECB mode-based LC cell in ON and OFF states. LC: liquid crystal; : threshold of the electric field amplitude.
Figure 1.
(a) Basic structure of LCoS. (b) Schematic of zero-twisted ECB mode-based LC cell in ON and OFF states. LC: liquid crystal; : threshold of the electric field amplitude.

Figure 2.
(a) The pre-set ideal gamma curve (red) and the desired gamma curve (green) for linear phase modulation. (b) The shifted phase modulated by SLM without calibration (red) and the desired linear shifted phase (green) [21].
Figure 2.
(a) The pre-set ideal gamma curve (red) and the desired gamma curve (green) for linear phase modulation. (b) The shifted phase modulated by SLM without calibration (red) and the desired linear shifted phase (green) [21].

Figure 3.
Configuration of the self-referenced phase calibration method for reflective LCoS (HOLOEYE GAEA-2). PS: monochromatic point light source; L1: collimating lens; P: polarizer; MASK: mask with two small holes; L2: Fourier lens; SLM: spatial light modulator; CAM: camera.
Figure 3.
Configuration of the self-referenced phase calibration method for reflective LCoS (HOLOEYE GAEA-2). PS: monochromatic point light source; L1: collimating lens; P: polarizer; MASK: mask with two small holes; L2: Fourier lens; SLM: spatial light modulator; CAM: camera.

Figure 4.
(a) Configuration of the self-referenced phase calibration method able to measure spatial nonuniformity. PS: monochromatic point light source; L: collimating lens; P: polarizer; SLM: spatial light modulator; CAM: camera. (b) Grayscale pattern uploaded on the SLM for the nonuniformity measurement and image captured by the camera [21].

Figure 5.
Schematic of the SLM calibration method based on digital holographic microscopy. MO: microscope objective; PH: pinhole filter; L: collimating lens; P: polarizer; BS: beam splitter; M: mirror; SLM: spatial light modulator; CAM: camera. [33].
Figure 5.
Schematic of the SLM calibration method based on digital holographic microscopy. MO: microscope objective; PH: pinhole filter; L: collimating lens; P: polarizer; BS: beam splitter; M: mirror; SLM: spatial light modulator; CAM: camera. [33].

Figure 6.
(a) Schematic of a diffraction pattern analyzed method. MO: microscope objective; PH: pinhole filter; L: collimating lens; P: polarizer; BS: beam splitter; BB: beam blocker; M: mirror; SLM: spatial light modulator; CAM: camera. (b) Uploaded pattern of Ronchi grating.
Figure 6.
(a) Schematic of a diffraction pattern analyzed method. MO: microscope objective; PH: pinhole filter; L: collimating lens; P: polarizer; BS: beam splitter; BB: beam blocker; M: mirror; SLM: spatial light modulator; CAM: camera. (b) Uploaded pattern of Ronchi grating.

Figure 7.
Pattern of single 8 × 8-pixel-grating unit uploaded for spatial nonuniformity measurement.
Figure 7.
Pattern of single 8 × 8-pixel-grating unit uploaded for spatial nonuniformity measurement.

Figure 8.
Schematic of an optical elements features analyzed method. BS: beam splitter; SLM: spatial light modulator; CAM: camera.
Figure 8.
Schematic of an optical elements features analyzed method. BS: beam splitter; SLM: spatial light modulator; CAM: camera.

Figure 9.
Comparison of features of calibration methods discussed in this review. System simplicity: simplicity of the calibration system; Pixel resolution: achieved spatial resolution in the discussed methods; Measured region size: calculated measured region size of nonuniformity measurement; Anti-disturbance: environment disturbance isolation; Replacement free: flexibility of deploying calibration procedure in an on-duty system without replacing the SLM. M: marginal; A: acceptable; G: good.


Table 1.
Phase calibration methods with best spatial resolution.
| Calibration Method | Resolution (Pixel Pitch) | Frames Needed 1 | Basic Alignment 2 | Reference 3 |
|---|---|---|---|---|
| Self-referenced | − 8 μm | <20 | Directly diffractive | [27] |
| Out-referenced | 1-pixel 8 μm | Several | Twyman-Green | [28,33] |
| Diffraction pattern analyzed | 8 × 8-pixel 14 μm | <10 | Directly diffractive | [11] |
| Optical elements generated | Global | 1 | Directly diffractive | [45] |
| Polarization methods | 1-pixel 11.5 μm | Several | Retro-reflection | [46,47] |
1 Images or data groups needed approximately for 512 × 512 pixels’ calibration at one grayscale. 2 Basic alignments for the best spatial resolution. 3 The parameters are listed according to the discussed referenced paper.
© 2019 by the authors. Licensee MDPI, Basel, Switzerland. This article is an open access article distributed under the terms and conditions of the Creative Commons Attribution (CC BY) license (http://creativecommons.org/licenses/by/4.0/).
Share and Cite
MDPI and ACS Style
Li, R.; Cao, L. Progress in Phase Calibration for Liquid Crystal Spatial Light Modulators. Appl. Sci. 2019, 9, 2012. https://doi.org/10.3390/app9102012
AMA Style
Li R, Cao L. Progress in Phase Calibration for Liquid Crystal Spatial Light Modulators. Applied Sciences. 2019; 9(10):2012. https://doi.org/10.3390/app9102012
Chicago/Turabian StyleLi, Rujia, and Liangcai Cao. 2019. "Progress in Phase Calibration for Liquid Crystal Spatial Light Modulators" Applied Sciences 9, no. 10: 2012. https://doi.org/10.3390/app9102012
Note that from the first issue of 2016, this journal uses article numbers instead of page numbers. See further details here.