
Utility of Obesity Indicators for Predicting Hypertension among Older Persons in Limpopo Province, South Africa

 , , and
Abstract
:1. Introduction
2. Materials and Methods
2.1. Study Design and Setting
2.2. Sample Size, Sampling Technique and Population
2.3. Data Collection and Tool
2.4. Data Analysis
2.5. Ethical Considerations
3. Results
3.1. The Demographic Characteristics of Participants
3.2. Anthropometric Characteristics of Older Persons
4. Discussion
5. Limitations of the Study
6. Conclusions
Supplementary Materials
Author Contributions
Funding
Institutional Review Board Statement
Informed Consent Statement
Data Availability Statement
Acknowledgments
Conflicts of Interest
References
- Tabish, S.A. Population Aging Is a Global Phenomenon. 2012. Available online: https://www.researchgate.net/publication/262915215_Population_aging_is_a_global_phenomenon (accessed on 1 January 2022).
- Lakatta, E.G.; Levy, D. Arterial and cardiac aging: Major shareholders in cardiovascular disease enterprises: Part I: Aging arteries: A “set up” for vascular disease. Circulation 2003, 107, 139–146. [Google Scholar] [CrossRef] [PubMed] [Green Version]
- Jura, M.; Kozak, L.P. Obesity and related consequences to ageing. Age 2016, 38, 23. [Google Scholar] [CrossRef] [PubMed] [Green Version]
- Baghel, D.S.; Kol, P.C.; Reddy, B. Oxidative Stress and Other Biochemical Parameters in Hypertension of Elderly males. Biomed. Pharmacol. J. 2014, 7, 247–251. [Google Scholar] [CrossRef] [Green Version]
- Jensen, M.D. Role of body fat distribution and the metabolic complications of obesity. J. Clin. Endocrinol. Metab. 2008, 93 (Suppl. 1), s57–s63. [Google Scholar] [CrossRef] [Green Version]
- Sironi, A.M.; Gastaldelli, A.; Mari, A.; Ciociaro, D.; Postano, V.; Buzzigoli, E.; Ghione, S.; Turchi, S.; Lombardi, M.; Ferrannini, E. Visceral fat in hypertension: Influence on insulin resistance and β-cell function. Hypertension 2004, 44, 127–133. [Google Scholar] [CrossRef] [Green Version]
- Bosy-Westphal, A.; Geisler, C.; Onur, S.; Korth, O.; Selberg, O.; Schrezenmeir, J.; Müller, M. Value of body fat mass vs anthropometric obesity indices in the assessment of metabolic risk factors. Int. J. Obes. 2006, 30, 475–483. [Google Scholar] [CrossRef] [Green Version]
- Jiang, S.Z.; Lu, W.; Zong, X.F.; Ruan, H.Y.; Liu, Y. Obesity and hypertension. Exp. Ther. Med. 2016, 12, 2395–2399. [Google Scholar] [CrossRef] [Green Version]
- Maimela, E.; Alberts, M.; Modjadji, S.E.; Choma, S.S.; Dikotope, S.A.; Ntuli, T.S.; Van Geertruyden, J.-P. The prevalence and determinants of chronic non-communicable disease risk factors amongst adults in the Dikgale health demographic and surveillance system (HDSS) site, Limpopo Province of South Africa. PLoS ONE 2016, 11, e0147926. [Google Scholar] [CrossRef] [Green Version]
- Mphekgwana, P.M.; Malema, N.; Monyeki, K.D.; Mothiba, T.M.; Makgahlela, M.; Kgatla, N.; Makgato, I.; Sodi, T. Hypertension Prevalence and Determinants among Black South African Adults in Semi-Urban and Rural Areas. Int. J. Environ. Res. Public Health 2020, 17, 7463. [Google Scholar] [CrossRef]
- Ntuli, S.T.; Maimela, E.; Alberts, M.; Choma, S.; Dikotope, S. Prevalence and associated risk factors of hypertension amongst adults in a rural community of Limpopo Province, South Africa. Afr. J. Prim. Health Care Family Med. 2015, 7, 1–5. [Google Scholar] [CrossRef] [Green Version]
- Raphadu, T.T.; Staden, M.V.; Dibakwane, W.M.; Monyeki, K.D. A Non-Invasive Investigation into the Prevalence of Higher than Normal Blood Pressure, Hypertension and the Association between Blood Pressure and Body Weight in Male and Female Adolescents in the Polokwane Local Municipality, Limpopo-South Africa: A Cross-Sectional Study. Children 2020, 7, 18. [Google Scholar]
- Bokaba, M.; Modjadji, P.; Mokwena, K.E. Undiagnosed Hypertension in a Workplace: The Case of a Logistics Company in Gauteng, South Africa. Healthcare 2021, 9, 964. [Google Scholar] [CrossRef]
- Modjadji, P. Communicable and non-communicable diseases coexisting in South Africa. Lancet Global Health 2021, 9, e889–e890. [Google Scholar] [CrossRef]
- Wong, E.B.; Olivier, S.; Gunda, R.; Koole, O.; Surujdeen, A.; Gareta, D.; Munatsi, D.; Modise, T.H.; Dreyer, J.; Nxumalo, S. Convergence of infectious and non-communicable disease epidemics in rural South Africa: A cross-sectional, population-based multimorbidity study. Lancet Global Health 2021, 9, e967–e976. [Google Scholar] [CrossRef]
- Mahlangu, K.; Modjadji, P.; Madiba, S. The Nutritional Status of Adult Antiretroviral Therapy Recipients with a Recent HIV Diagnosis; A Cross-Sectional Study in Primary Health Facilities in Gauteng, South Africa. Healthcare 2020, 8, 290. [Google Scholar] [CrossRef]
- Shukuri, A.; Tewelde, T.; Shaweno, T. Prevalence of old age hypertension and associated factors among older adults in rural Ethiopia. Integr. Blood Press. Control 2019, 12, 23. [Google Scholar] [CrossRef] [Green Version]
- WHO. Non Communicable Diseases Country Profiles; World Health Organization: Geneva, Switzerland, 2011. [Google Scholar]
- United Nations Department of Economic and Social Affairs PD: World Population Prospects: The 2015 Revision. United Nations Department of Economic and Social Affairs, Population Division 2015. Available online: https://esa.un.org/unpd/wpp/publications/files/key_findings_wpp_2015.pdf (accessed on 14 May 2020).
- Mash, B.; Fairall, L.; Adejayan, O.; Ikpefan, O.; Kumari, J.; Mathee, S.; Okun, R.; Yogolelo, W. A morbidity survey of South African primary care. PLoS ONE 2012, 7, e32358. [Google Scholar] [CrossRef]
- Peer, N.; Lombard, C.; Steyn, K.; Levitt, N. Waist-to-height ratio is a useful indicator of cardio-metabolic risk in South Africa. Fam. Pract. 2019, 37, 36–42. [Google Scholar] [CrossRef]
- Debeila, S.; Modjadji, P.; Madiba, S. High prevalence of overall overweight/obesity and abdominal obesity amongst adolescents: An emerging nutritional problem in rural high schools in Limpopo Province, South Africa. Afr. J. Prim. Health Care Family Med. 2021, 13, e1–e9. [Google Scholar] [CrossRef]
- Modjadji, P. Socio-demographic Determinants of Overweight and Obesity Among Mothers of Primary School Children Living in a Rural Health and Demographic Surveillance System Site, South Africa. TOPHJ 2020, 13, 518–528. [Google Scholar] [CrossRef]
- Nkwana, M.R.; Monyeki, K.D.; Lebelo, S.L. Body Roundness Index, A Body Shape Index, Conicity Index, and Their Association with Nutritional Status and Cardiovascular Risk Factors in South African Rural Young Adults. Int. J. Environ. Res. Public Health 2021, 18, 281. [Google Scholar] [CrossRef]
- Oldewage-Theron, W.H.; Egal, A.A.; Grobler, C.J. Is obesity associated with iron status in the elderly? A case study from Sharpeville, South Africa. Public Health Nutr. 2015, 18, 521–529. [Google Scholar] [CrossRef]
- Peltzer, K.; Phaswana-Mafuya, N. Hypertension and associated factors in older adults in South Africa. Cardiovasc. J. Afr. 2013, 24, 66. [Google Scholar] [CrossRef] [Green Version]
- Berry, K.M.; Parker, W.-A.; Mchiza, Z.J.; Sewpaul, R.; Labadarios, D.; Rosen, S.; Stokes, A. Quantifying unmet need for hypertension care in South Africa through a care cascade: Evidence from the SANHANES, 2011–2012. BMJ Glob. Health 2017, 2, e000348. [Google Scholar] [CrossRef] [Green Version]
- DeMarco, V.G.; Aroor, A.R.; Sowers, J.R. The pathophysiology of hypertension in patients with obesity. Nat. Rev. Endocrinol. 2014, 10, 364–376. [Google Scholar] [CrossRef] [Green Version]
- Lear, S.A.; Humphries, K.H.; Kohli, S.; Chockalingam, A.; Frohlich, J.J.; Birmingham, C.L. Visceral adipose tissue accumulation differs according to ethnic background: Results of the Multicultural Community Health Assessment Trial (M-CHAT). Am. J. Clin. Nutr. 2007, 86, 353–359. [Google Scholar] [CrossRef]
- Nordstrand, N.; Gjevestad, E.; Dinh, K.; Hofsø, D.; Røislien, J.; Saltvedt, E.; Os, I.; Hjelmesæth, J. The relationship between various measures of obesity and arterial stiffness in morbidly obese patients. BMC Cardiovasc. Disord. 2011, 11, 7. [Google Scholar] [CrossRef] [Green Version]
- Tawfik, H.M. Waist height ratio and waist circumference in relation to hypertension, Framingham risk score in hospitalized elderly Egyptians. Egypt. Heart J. 2018, 70, 213–216. [Google Scholar] [CrossRef]
- Wang, S.-K.; Ma, W.; Wang, S.; Yi, X.-R.; Jia, H.-Y.; Xue, F. Obesity and its relationship with hypertension among adults 50 years and older in Jinan, China. PLoS ONE 2014, 9, e114424. [Google Scholar] [CrossRef] [PubMed] [Green Version]
- Lin, Y.-A.; Chen, Y.-J.; Tsao, Y.-C.; Yeh, W.-C.; Li, W.-C.; Tzeng, I.S.; Chen, J.-Y. Relationship between obesity indices and hypertension among middle-aged and elderly populations in Taiwan: A community-based, cross-sectional study. BMJ Open 2019, 9, e031660. [Google Scholar] [CrossRef] [PubMed] [Green Version]
- Addo, J.; Agyemang, C.; Smeeth, L.; Aikins, A.D.G.; Adusei, A.; Ogedegbe, O. A review of population-based studies on hypertension in Ghana. Ghana Med. J. 2012, 46, 4–11. [Google Scholar] [PubMed]
- Muluvhu, T.C.; Monyeki, M.A.; Strydom, G.L.; Toriola, A.L. Relationship between obesity and blood pressure among employees in the Vhembe district municipality of Limpopo Province, South Africa: Cardiovascular topics. Cardiovasc. J. Afr. 2019, 30, 361–368. [Google Scholar] [CrossRef] [PubMed]
- Cogta: Vhembe District Municipality, Limpopo Province. 2020. Available online: https://www.cogta.gov.za/ddm/wp-content/uploads/2020/11/Vhembe-October-2020.pdf (accessed on 20 October 2020).
- Hightower, C.; Scott, K. Infer more, describe less: More powerful survey conclusions through easy inferential tests. Issues Sci. Technol. Librariansh. 2012, 69. [Google Scholar] [CrossRef]
- Fincham, J.E. Response rates and responsiveness for surveys, standards, and the Journal. Am. J. Pharm. Educ. 2008, 72, 43. [Google Scholar] [CrossRef] [Green Version]
- Schatz, E.; Madhavan, S.; Collinson, M.; Gómez-Olivé, F.X.; Ralston, M. Dependent or Productive? A New Approach to Understanding the Social Positioning of Older South Africans through Living Arrangements. Res. Aging 2015, 37, 581–605. [Google Scholar] [CrossRef] [Green Version]
- S F: Characteristics of Rural Settlements. 2019. Available online: https://rashidfaridi.com/2019/09/16/characteristics-of-rural-settlements/ (accessed on 25 February 2022).
- Riley, L.; Guthold, R.; Cowan, M.; Savin, S.; Bhatti, L.; Armstrong, T.; Bonita, R. The World Health Organization STEPwise approach to noncommunicable disease risk-factor surveillance: Methods, challenges, and opportunities. Am. J. Public Health 2016, 106, 74–78. [Google Scholar] [CrossRef]
- Tsang, S.; Royse, C.F.; Terkawi, A.S. Guidelines for developing, translating, and validating a questionnaire in perioperative and pain medicine. Saudi J. Anaesth. 2017, 11 (Suppl. 1), S80–S89. [Google Scholar] [CrossRef]
- Whelton, P.K.; Carey, R.M.; Aronow, W.S.; Casey, D.E.; Collins, K.J.; Himmelfarb, C.D.; DePalma, S.M.; Gidding, S.; Jamerson, K.A.; Jones, D.W. 2017 ACC/AHA/AAPA/ABC/ACPM/AGS/APhA/ASH/ASPC/NMA/PCNA guideline for the prevention, detection, evaluation, and management of high blood pressure in adults: A report of the American College of Cardiology/American Heart Association Task Force on Clinical Practice Guidelines. J. Am. Coll. Cardiol. 2018, 71, e127–e248. [Google Scholar]
- Pickering, T.; Miller, N.; Ogedegbe, G.; Krakoff, L.; Artinian, N.; Goff, D. American Society of Hypertension; Preventive Cardiovascular Nurses Association. Call to action on use and reimbursement for home blood pressure monitoring: A joint scientific statement from the American Heart Association, American Society of Hypertension, and Preventive Cardiovascular Nurses Association. Hypertension 2008, 52, 10–29. [Google Scholar]
- WHO. Physical Status: The Use and Interpretation of Anthropometry; WHO Technical Report Series No. 854; Report of a WHO Expert Committee 1995; WHO: Geneva, Switzerland, 1995. [Google Scholar]
- Ashwell, M.; Gibson, S. Waist-to-height ratio as an indicator of ‘early health risk’: Simpler and more predictive than using a ‘matrix’based on BMI and waist circumference. BMJ Open 2016, 6, e010159. [Google Scholar] [CrossRef] [Green Version]
- WMA: Declaration of Helsinki. Ethical Principles for Medical Research Involving Human Subjects. 2008. Available online: https://www.wma.net/what-we-do/medical-ethics/declaration-of-helsinki/doh-oct2008/ (accessed on 11 November 2018).
- National Department of Health (NDoH). S: South Africa Demographic and Health Survey 2016; NDoH: Pretoria, South Africa; Rockville, MD, USA, 2019. [Google Scholar]
- Modjadji, P.; Madiba, S. Childhood Undernutrition and Its Predictors in a Rural Health and Demographic Surveillance System Site in South Africa. Int. J. Environ. Res. Public Health 2019, 16, 3021. [Google Scholar] [CrossRef] [Green Version]
- Ralston, M.; Schatz, E.; Menken, J.; Gómez-Olivé, F.X.; Tollman, S. Who benefits—Or does not—From South Africa’s old age pension? Evidence from characteristics of rural pensioners and non-pensioners. Int. J. Environ. Res. Public Health 2016, 13, 85. [Google Scholar] [CrossRef]
- Lloyd-Sherlock, P.; Beard, J.; Minicuci, N.; Ebrahim, S.; Chatterji, S. Hypertension among older adults in low-and middle-income countries: Prevalence, awareness and control. Int. J. Epidemiol. 2014, 43, 116–128. [Google Scholar] [CrossRef] [Green Version]
- Goma, F.M.; Nzala, S.H.; Babaniyi, O.; Songolo, P.; Zyaambo, C.; Rudatsikira, E.; Siziya, S.; Muula, A.S. Prevalence of hypertension and its correlates in Lusaka urban district of Zambia: A population based survey. Int. Arch. Med. 2011, 4, 34. [Google Scholar] [CrossRef]
- Manandhar, K.; Koju, R.; Sinha, N.; Humagain, S. Prevalence and associated risk factors of hypertension among people aged 50 years and more in Banepa Municipality, Nepal. Kathmandu Univ. Med. J. 2012, 10, 35–38. [Google Scholar] [CrossRef] [Green Version]
- Mendes, T.d.A.B.; Goldbaum, M.; Segri, N.J.; Barros, M.B.d.A.; César, C.L.G.; Carandina, L. Factors associated with the prevalence of hypertension and control practices among elderly residents of São Paulo city, Brazil. Cad. Saude Publica 2013, 29, 2275–2286. [Google Scholar] [CrossRef] [Green Version]
- Wallace, S.M.; Yasmin McEniery, C.M.; Mäki-Petäjä, K.M.; Booth, A.D.; Cockcroft, J.R.; Wilkinson, I.B. Isolated systolic hypertension is characterized by increased aortic stiffness and endothelial dysfunction. Hypertension 2007, 50, 228–233. [Google Scholar] [CrossRef] [Green Version]
- Lionakis, N.; Mendrinos, D.; Sanidas, E.; Favatas, G.; Georgopoulou, M. Hypertension in the elderly. World J. Cardiol. 2012, 4, 135. [Google Scholar] [CrossRef]
- Safar, M.E.; Levy, B.I.; Struijker-Boudier, H. Current perspectives on arterial stiffness and pulse pressure in hypertension and cardiovascular diseases. Circulation 2003, 107, 2864–2869. [Google Scholar] [CrossRef] [Green Version]
- Franklin, S.S.; Gustin, W.T.; Wong, N.D.; Larson, M.G.; Weber, M.A.; Kannel, W.B.; Levy, D. Hemodynamic patterns of age-related changes in blood pressure. The Framingham Heart Study. Circulation 1997, 96, 308–315. [Google Scholar] [CrossRef] [Green Version]
- Lartey, S.T.; Magnussen, C.G.; Si, L.; Boateng, G.O.; De Graaff, B.; Biritwum, R.B.; Minicuc, N.; Kowal, P.; Blizzard, L.; Palmer, A.J. Rapidly increasing prevalence of overweight and obesity in older Ghanaian adults from 2007–2015: Evidence from WHO-SAGE Waves 1 & 2. PLoS ONE 2019, 14, e0215045. [Google Scholar]
- Msyamboza, K.P.; Kathyola, D.; Dzowela, T. Anthropometric measurements and prevalence of underweight, overweight and obesity in adult Malawians: Nationwide population based NCD STEPS survey. Pan. Afr. Med. J. 2013, 15, 108. [Google Scholar] [CrossRef]
- Adebayo, R.A.; Balogun, M.O.; Adedoyin, R.A.; Obashoro-John, O.A.; Bisiriyu, L.A.; Abiodun, O.O. Prevalence and pattern of overweight and obesity in three rural communities in southwest Nigeria. Diabetes Metab. Syndr. Obes. Targets Ther. 2014, 7, 153. [Google Scholar] [CrossRef] [Green Version]
- Newman, A. Obesity in older adults. Online J. Issues Nurs. 2009, 14, 1–8. [Google Scholar] [CrossRef]
- Luz, R.H.; Barbosa, A.R.; d’Orsi, E. Waist circumference, body mass index and waist-height ratio: Are two indices better than one for identifying hypertension risk in older adults? Prev. Med. 2016, 93, 76–81. [Google Scholar] [CrossRef]
- Zhang, W.; He, K.; Zhao, H.; Hu, X.; Yin, C.; Zhao, X.; Shi, S. Association of body mass index and waist circumference with high blood pressure in older adults. BMC Geriatr. 2021, 21, 260. [Google Scholar] [CrossRef]
- Harris, T.B.; Visser, M.; Everhart, J.; Cauley, J.; Tylavsky, F.; Fuerst, T.; Zamboni, M.; Taaffe, D.; Resnick, H.E.; Scherzinger, A.; et al. Waist circumference and sagittal diameter reflect total body fat better than visceral fat in older men and women. The Health, Aging and Body Composition Study. Ann. N. Y. Acad. Sci. 2000, 904, 462–473. [Google Scholar] [CrossRef]
- Berg, A.H.; Scherer, P.E. Adipose tissue, inflammation, and cardiovascular disease. Circ. Res. 2005, 96, 939–949. [Google Scholar] [CrossRef] [Green Version]
- Sebati, B.; Monyeki, K.; Kemper, H.; Sekgala, M.; Mphekgwana, M. Anthropometric indices for predicting cardiovascular risk factors: Ellisras longitudinal study. Am. J. Hum. Biol. 2019, 31, e23293. [Google Scholar] [CrossRef] [Green Version]
- Choi, J.R.; Koh, S.B.; Choi, E. Waist-to-height ratio index for predicting incidences of hypertension: The ARIRANG study. BMC Public Health 2018, 18, 767. [Google Scholar] [CrossRef]
- Minh, Q.N.; Vo, M.H. Anthropometric Indexes for Predicting High Blood Pressure in Vietnamese Adults: A Cross-Sectional Study. Integr. Blood Press Control. 2020, 13, 181–186. [Google Scholar] [CrossRef] [PubMed]
- Ghosh, J.; Bandyopadhyay, A. Comparative evaluation of obesity measures: Relationship with blood pressures and hypertension. Singap. Med. J. 2007, 48, 232. [Google Scholar]
- Hirani, V.; Zaninotto, P.; Primatesta, P. Generalised and abdominal obesity and risk of diabetes, hypertension and hypertension–diabetes co-morbidity in England. Public Health Nutr. 2008, 11, 521–527. [Google Scholar] [CrossRef] [PubMed] [Green Version]
- Calderón-García, J.F.; Roncero-Martín, R.; Rico-Martín, S.; De Nicolás-Jiménez, J.M.; López-Espuela, F.; Santano-Mogena, E.; Alfageme-García, P.; Sánchez Muñoz-Torrero, J.F. Effectiveness of Body Roundness Index (BRI) and a Body Shape Index (ABSI) in Predicting Hypertension: A Systematic Review and Meta-Analysis of Observational Studies. Int. J. Environ. Res. Public Health 2021, 18, 11607. [Google Scholar] [CrossRef]
- World Health Organization. ROfENUIZyciZy: Measuring Obesity: Classification and Description of Anthropometric Data: Report on a WHO Consultation on the Epidemiology of Obesity, Warsaw, 21–23 October 1987; World Health Organization, Regional Office for Europe: Geneva, Switzerland; Copenhagen, Denmark, 1989. [Google Scholar]
- Alberti, K.G.; Eckel, R.H.; Grundy, S.M.; Zimmet, P.Z.; Cleeman, J.I.; Donato, K.A.; Fruchart, J.C.; James, W.P.; Loria, C.M.; Smith, S.C., Jr. Harmonizing the metabolic syndrome: A joint interim statement of the International Diabetes Federation Task Force on Epidemiology and Prevention; National Heart, Lung, and Blood Institute; American Heart Association; World Heart Federation; International Atherosclerosis Society; and International Association for the Study of Obesity. Circulation 2009, 120, 1640–1645. [Google Scholar]
- Expert Panel on Detection, Evaluation. Executive Summary of the Third Report of the National Cholesterol Education Program (NCEP) Expert Panel on Detection, Evaluation, and Treatment of High Blood Cholesterol in Adults (Adult Treatment Panel III). JAMA 2001, 285, 2486–2497. [Google Scholar] [CrossRef]


| Variables | All, n = 350 n (%) | Men, n = 165 n (%) | Women, n = 185 n (%) | p-Value |
|---|---|---|---|---|
| Age (years) | 0.017 * 0.097 | |||
| Mean | 69 (±SD = 7) | 70 (±SD = 7) | 68 (±SD = 7) | |
| <69 | 184 (53) | 79 (47) | 105 (57) | |
| ≥69 | 166 (47) | 86 (52) | 80 (43) | |
| Marital status | 0.062 | |||
| Ever married | 341 (97) | 158 (96) | 183 (99) | |
| Single | 9 (3) | 7 (4) | 2 (1) | |
| Level of education | 0.002 * | |||
| Low literacy | 240 (69) | 100 (61) | 140 (76) | |
| High literacy | 110 (31) | 65 (39) | 45 (24) | |
| Receiving old age grant | 0.093 | |||
| No | 13 (4) | 3 (2) | 10 (5) | |
| Yes | 337 (96) | 162 (98) | 175 (95) | |
| Employed | 0.113 | |||
| No | 329 (94) | 159 (96) | 170 (92) | |
| Yes | 21 (6) | 6 (4) | 15 (8) | |
| Household headship | ≤0.0001 * | |||
| Self | 224 (64) | 131 (79) | 93 (50) | |
| Spouse | 71 (20) | 8 (5) | 63 (34) | |
| Child of the participant | 51 (15) | 24 (15) | 27 (15) | |
| Relative | 4 (1) | 2 (1) | 2 (1) | |
| Living with | 0.219 | |||
| Alone | 23 (7) | 8 (5) | 15 (8) | |
| Family members | 327 (93) | 157 (95) | 170 (91) | |
| Dwelling place | 0.734 | |||
| Brick-house | 301 (86) | 143 (87) | 158 (85) | |
| Non-brick house | 49 (14) | 22 (13) | 27 (15) | |
| Household income | 0.015 * | |||
| <R5000 (<$323.31) | 127 (36) | 49 (30) | 78 (42) | |
| ≥R5000 (≥$323.31) | 223 (64) | 116 (70) | 107 (58) | |
| Access to electricity | 1.000 | |||
| No | 0 (0) | 0 | 0 | |
| Yes | 350 (100) | 165 (100) | 185 (0) | |
| Access to water | 1.000 | |||
| No | 0 (0) | 0 | 0 | |
| Yes | 350 (100) | 165 (100) | 185 (0) | |
| Type of toilet | 1.000 | |||
| Flush | 8 (2) | 4 (2) | 4 (2) | |
| Pit | 242 (98) | 161 (98) | 161 (98) | |
| Smoking | 0.068 | |||
| No | 194 (55) | 83 (50) | 111(60) | |
| Yes | 156 (45) | 82 (50) | 74 (40) | |
| Alcohol use | 0.001 * | |||
| No | 225 (64) | 91 (55) | 134 (72) | |
| Yes | 125 (36) | 74 (45) | 51 (28) | |
| Family history of hypertension | 0.024 * | |||
| No | 279 (80) | 140 (85) | 139 (75) | |
| Yes | 71 (20) | 25 (15) | 46 (25) |
| Variables | All, n = 350 n (%) | Men, n = 165 n (%) | Women, n = 185 n (%) | p-Value |
|---|---|---|---|---|
| Blood pressure | 0.652 | |||
| (mmHg) | ||||
| Normal | 189 (54) | 87 (53) | 102 (55) | |
| High | 161 (46) | 78 (47) | 83 (45) | |
| SBP (mmHg) | 0.912 0.499 | |||
| Mean | 135 (±SD = 21) | 135 (±SD = 21) | 135 (±SD = 22) | |
| Normal | 108 (242) | 48 (29) | 60 (32) | |
| High | 242 (69) | 117 (71) | 125 (68) | |
| DBP (mmHg) | 0.588 0.682 | |||
| Mean | 81 (±SD = 13) | 82 (±SD = 11) | 81 (±SD = 11) | |
| Normal | 178 (51) | 82 (50) | 96 (52) | |
| High | 172 (49) | 83 (50) | 89 (48) | |
| BMI (kg/m2) | ≤0.0001 * ≤0.0001 * | |||
| Mean | 29 (±SD = 5) | 28 (±SD = 4) | 31 (±SD = 6) | |
| Underweight | 2 (1) | 2 (1) | 0 (0) | |
| Normal | 61 (17) | 33 (20) | 28 (15) | |
| Overweight | 162 (46) | 94 (57) | 68 (37) | |
| Obese | 125 (36) | 36 (22) | 89 (48) | |
| Waist (cm) | ≤0.0001 * ≤0.0001 * | |||
| Mean | 91 (±SD = 12) | 88 (±SD = 11) | 93 (±SD = 13) | |
| Normal | 151 (43) | 127 (78) | 24 (13) | |
| Abdominal obesity | 199 (57) | 38 (23) | 161 (87) | |
| WHR | ≤0.0001 * 0.658 | |||
| Mean | 0.95 (±SD = 0.01) | 0.97 (±SD = 0.01) | 0.92 (±SD = 0.07) | |
| Normal | 41 (12) | 18 (11) | 23 (12) | |
| Abdominal obesity | 309 (88) | 147 (89) | 162 (88) | |
| WHtR | ≤0.0001 * 0.039 * | |||
| Mean | 0.58 (±SD = 0.08) | 0.55 (±SD = 0.07) | 0.60 (±SD = 0.09) | |
| Normal | 7 (2) | 6 (4) | 1 (1) | |
| Abdominal obesity | 343 (98) | 159 (96) | 184 (99) |
| Variables | Normotensive, n (%) | Hypertensive, n (%) | ||||
|---|---|---|---|---|---|---|
| All n = 189 | Male n = 87 | Female n = 102 | All n = 161 | Male n = 78 | Female n = 83 | |
| BMI (kg/m2) | ||||||
| Normal | 37 (20) * | 20 (23) | 17 (17) * | 24 (15) * | 13 (17) | 11 (13) * |
| Overweight | 98 (52) | 53 (61) | 45 (44) | 64 (40) | 41 (52) | 23 (28) |
| Obesity | 52 (27) | 12 (14) | 40 (39) | 73 (45) | 24 (31) | 49 (59) |
| Underweight | 2 (1) | 2 (2) | 0 | 0 | 0 | 0 |
| Waist (cm) | ||||||
| Normal | 91 (48) * | 71 (82) | 20 (20) * | 60 (37) * | 56 (72) | 4 (5) * |
| Abdominal obesity | 98 (52) | 16 (18) | 82 (80) | 101 (63) | 22 (28) | 79 (95) |
| WHR | ||||||
| Normal | 19 (10) | 6 (10) | 13 (13) | 22 (14) | 12 (15) | 10 (12) |
| Abdominal obesity | 170 (90) | 81 (90) | 89 (87) | 139 (86) | 66 (85) | 73 (88) |
| WHtR | ||||||
| Normal | 5 (3) | 4 (5) | 1 (1) | 2 (1) | 2 (3) | 0 (0) |
| Abdominal obesity | 184 (97) | 83 (95) | 101 (99) | 159 (99) | 76 (97) | 83 (100) |
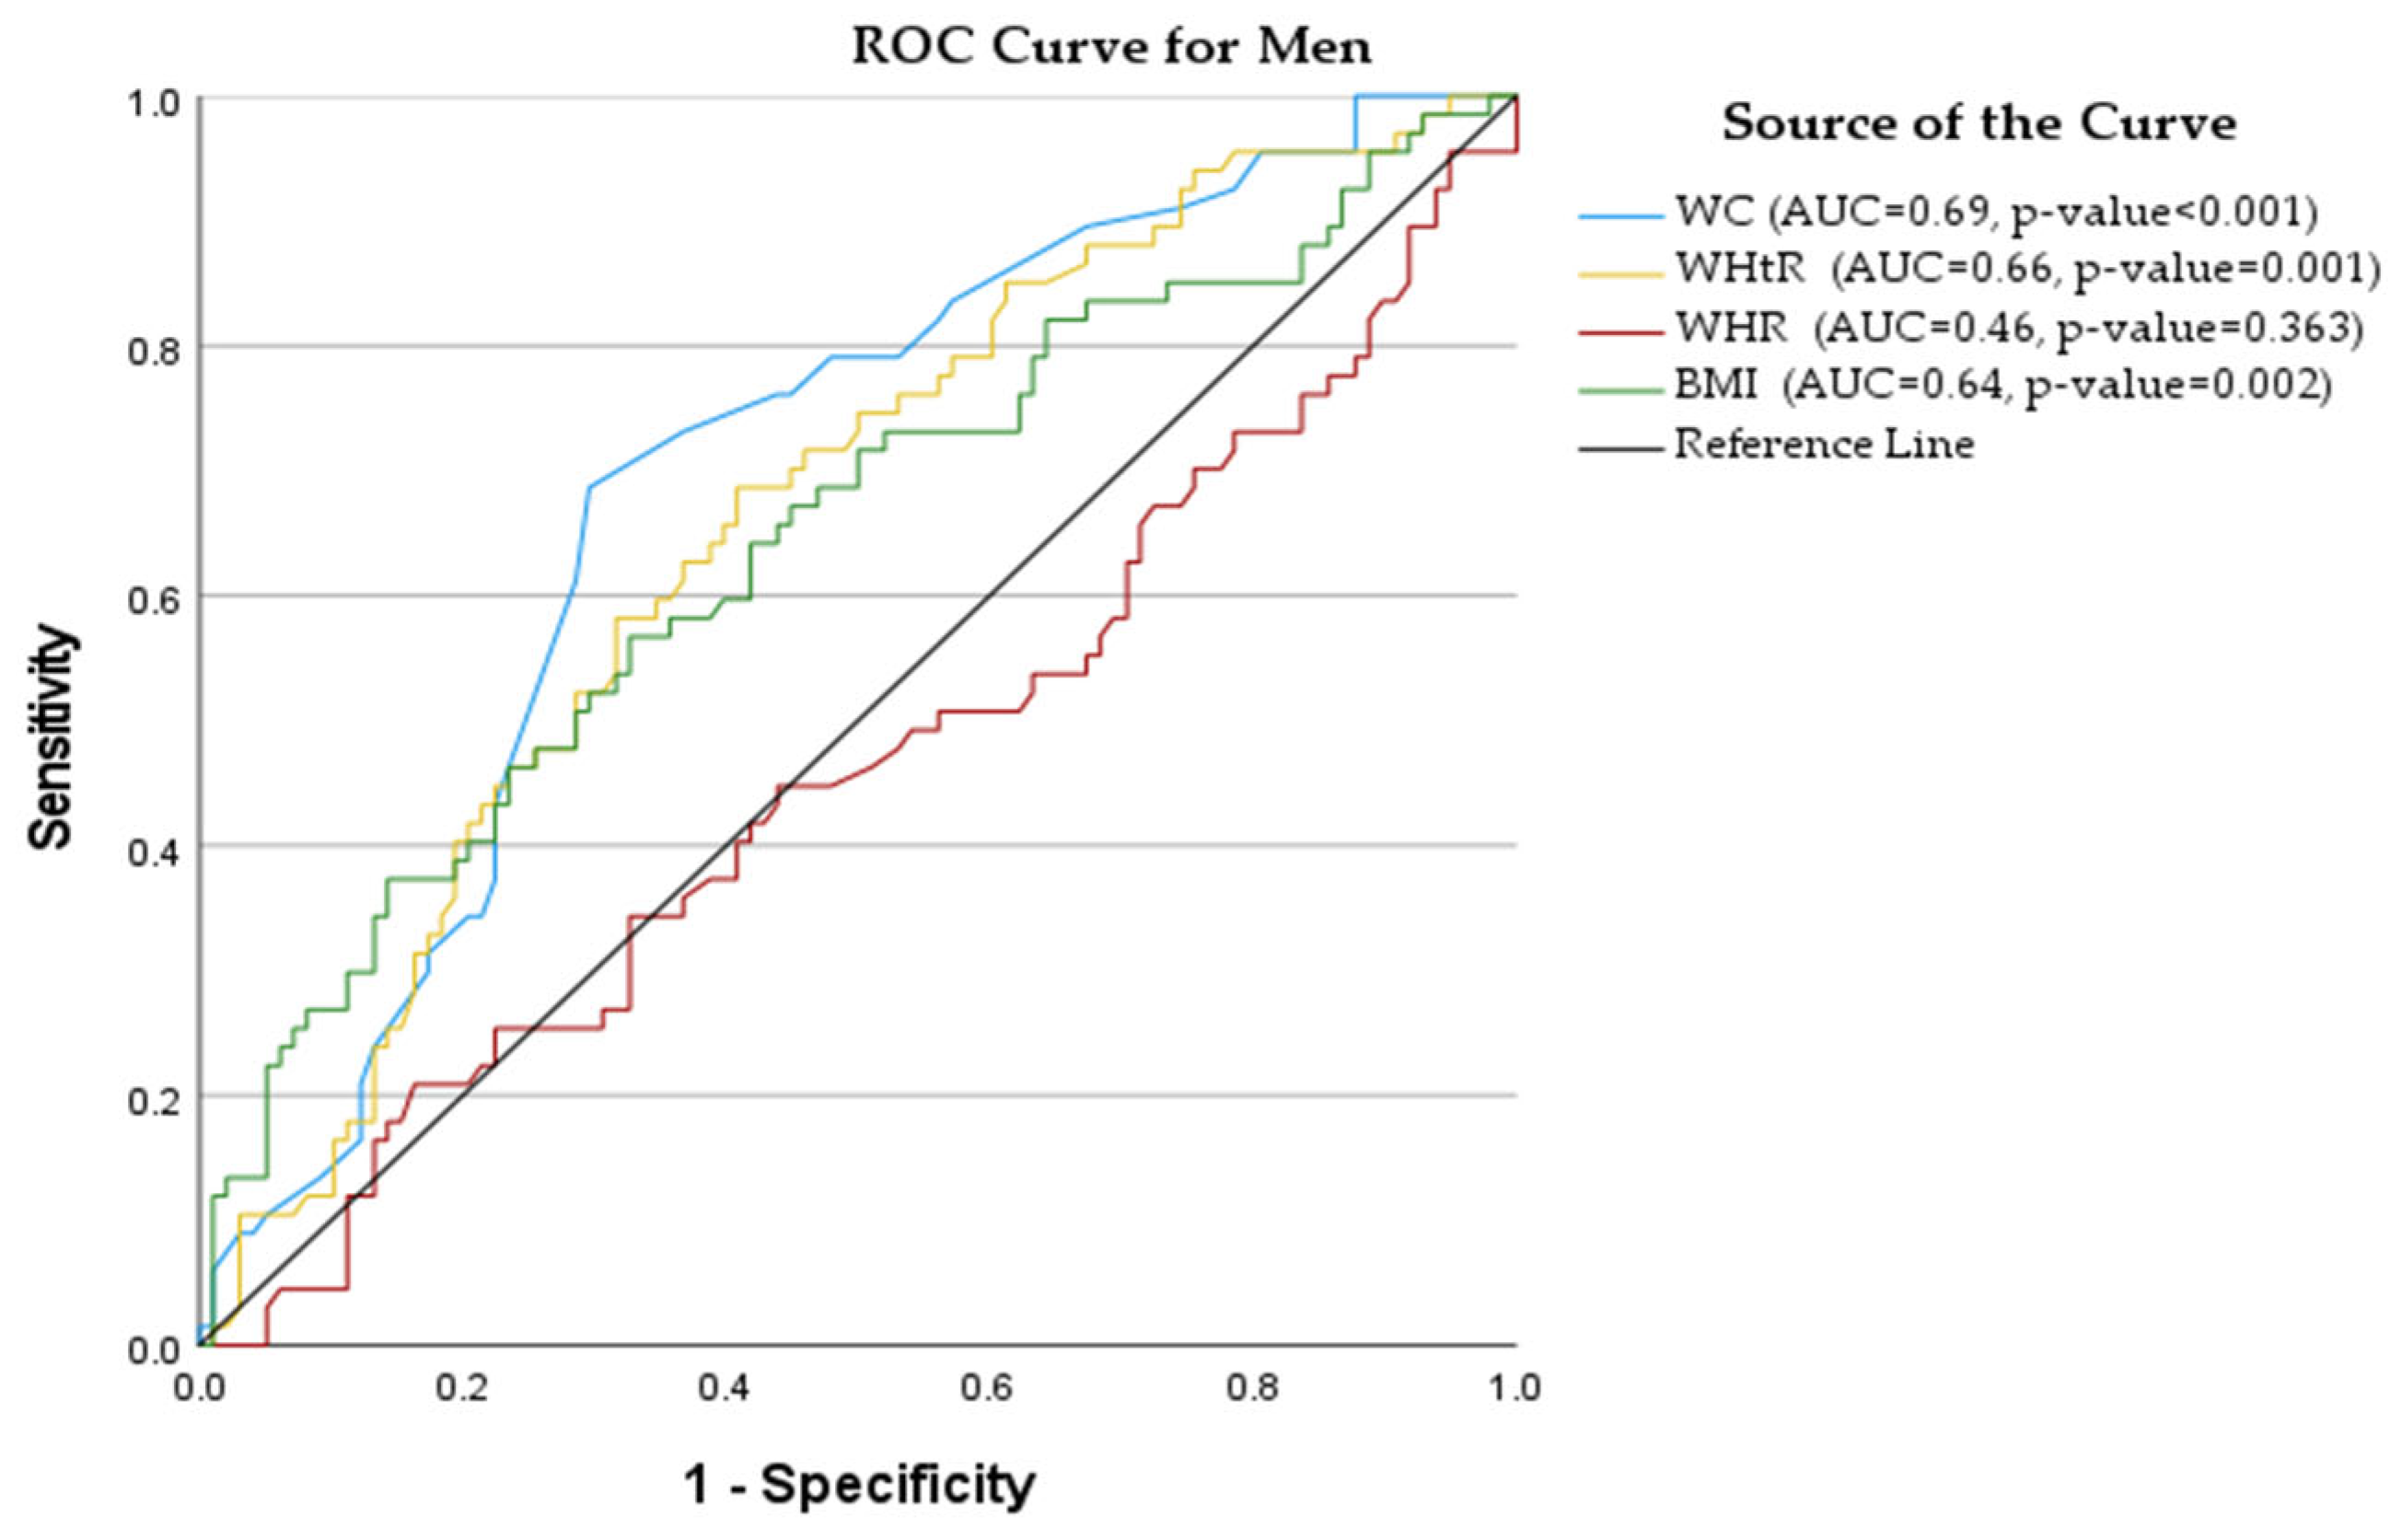
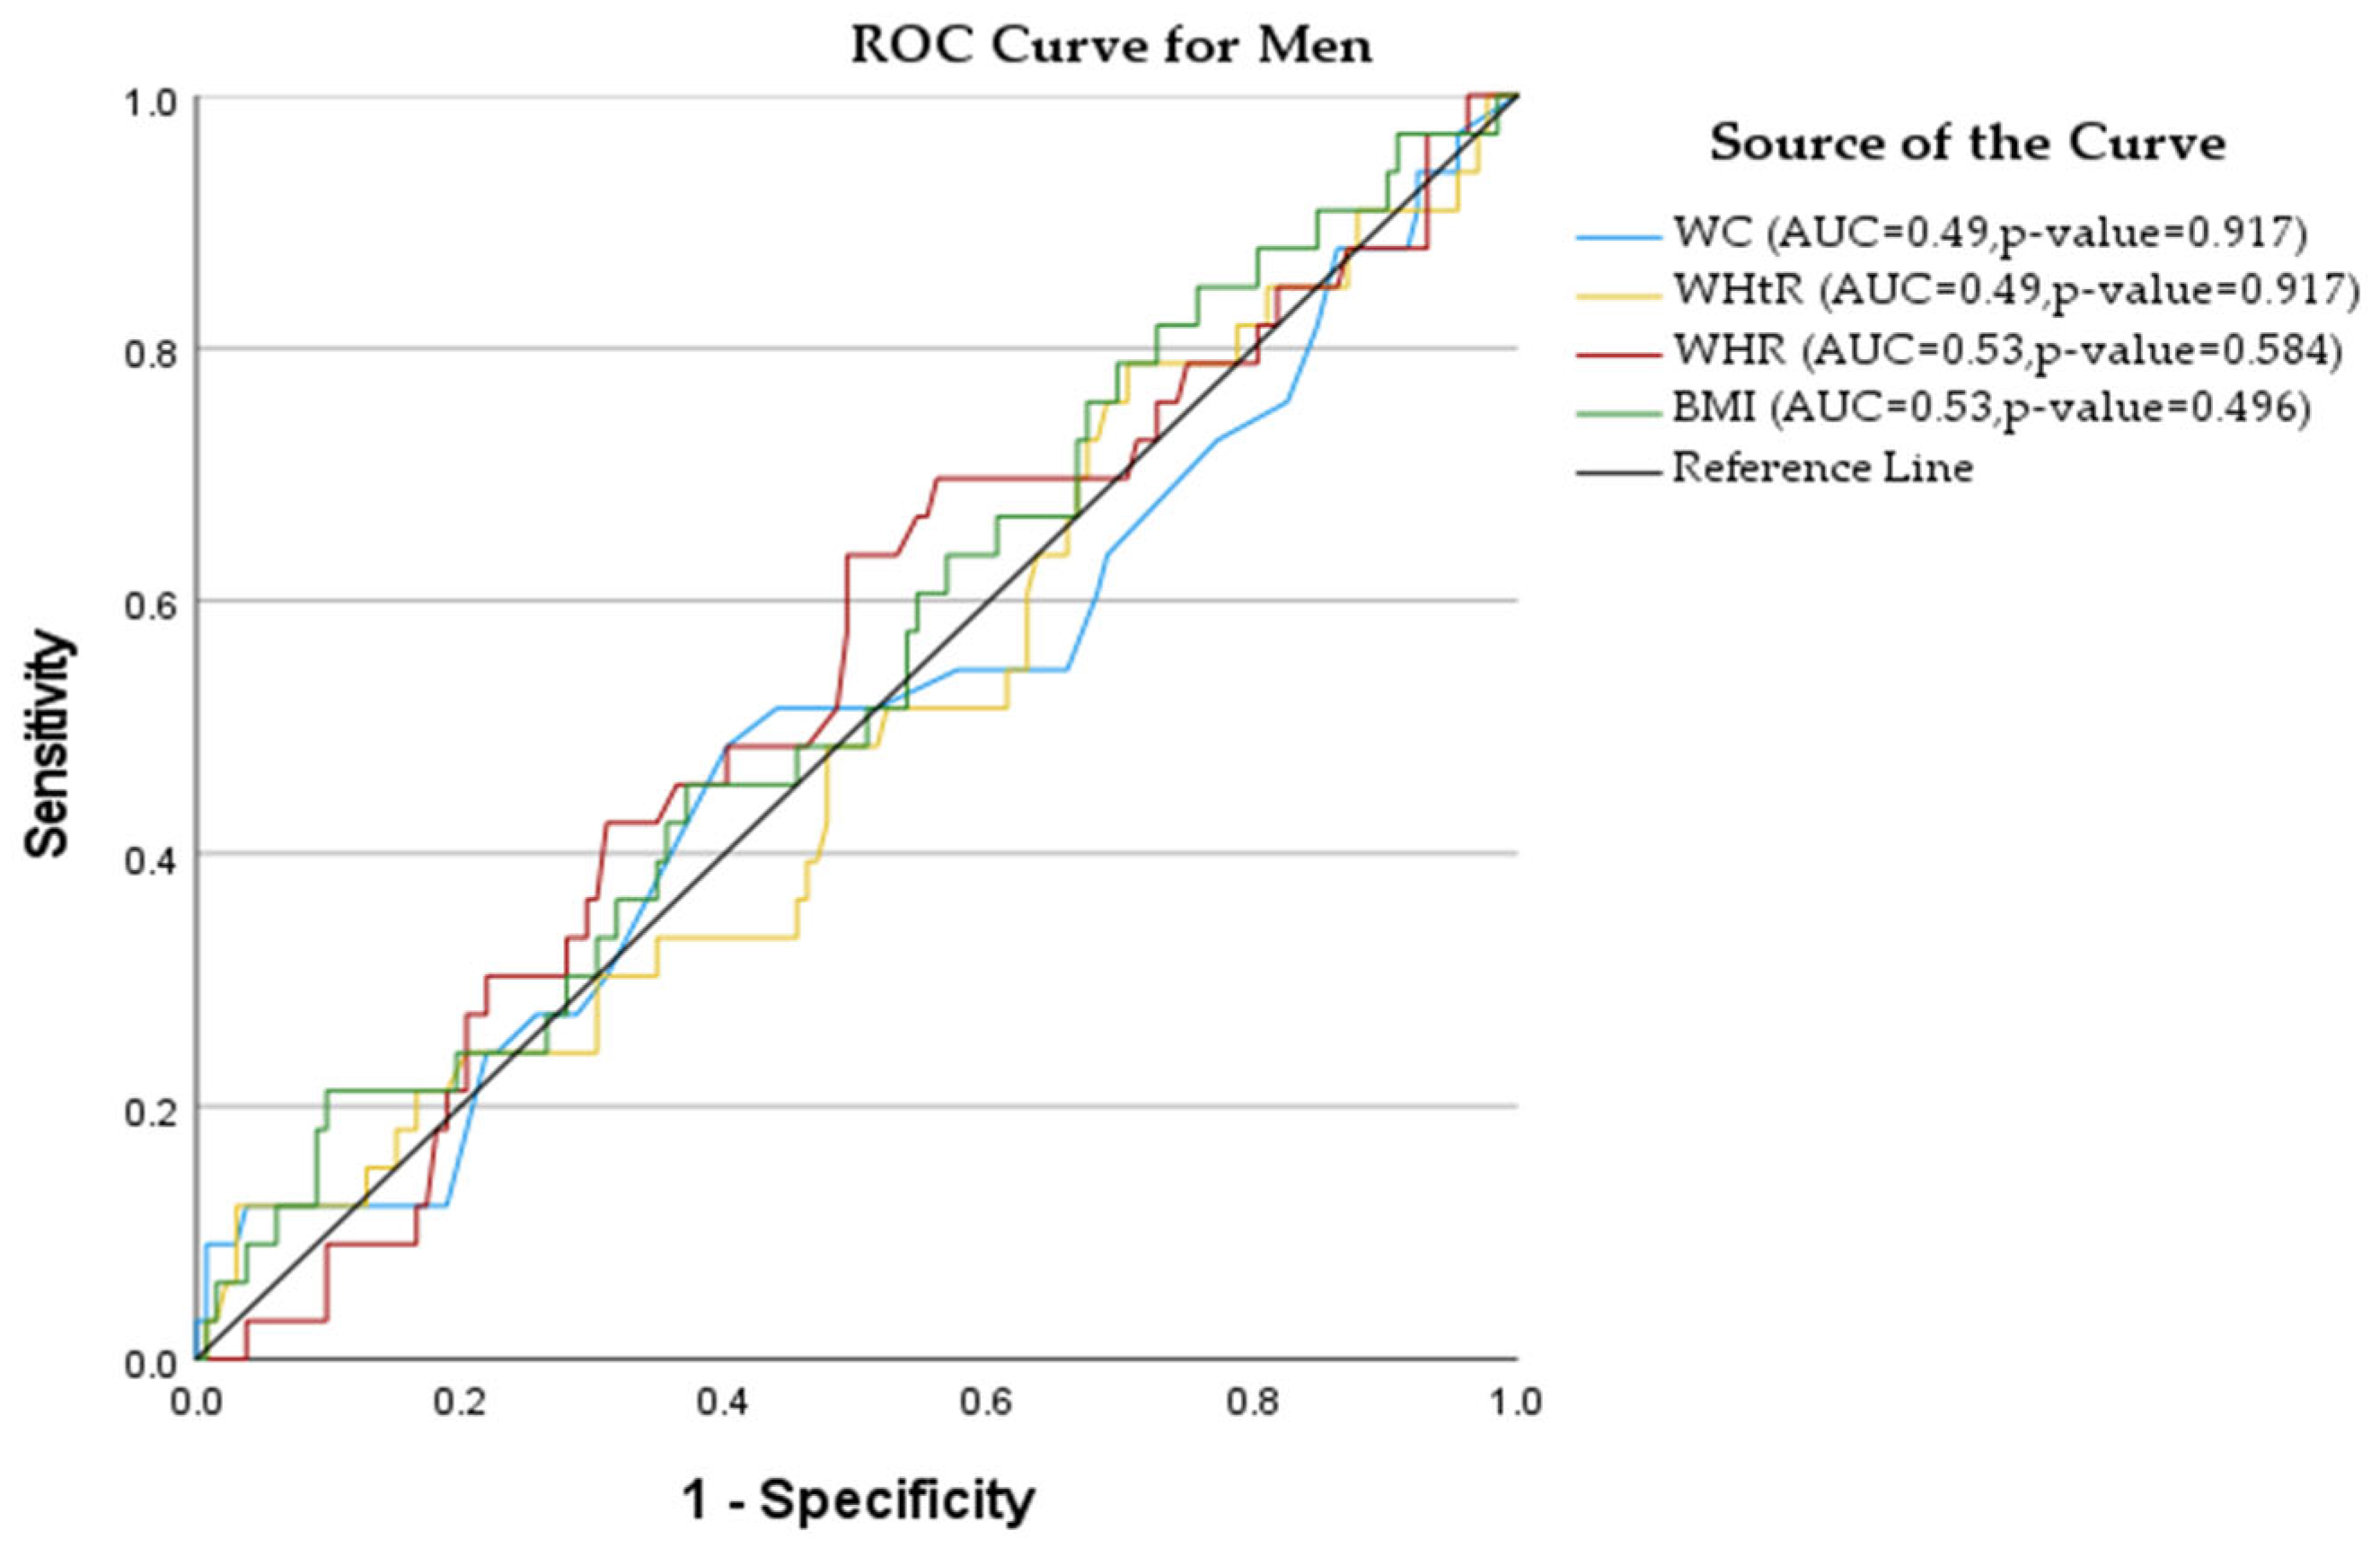
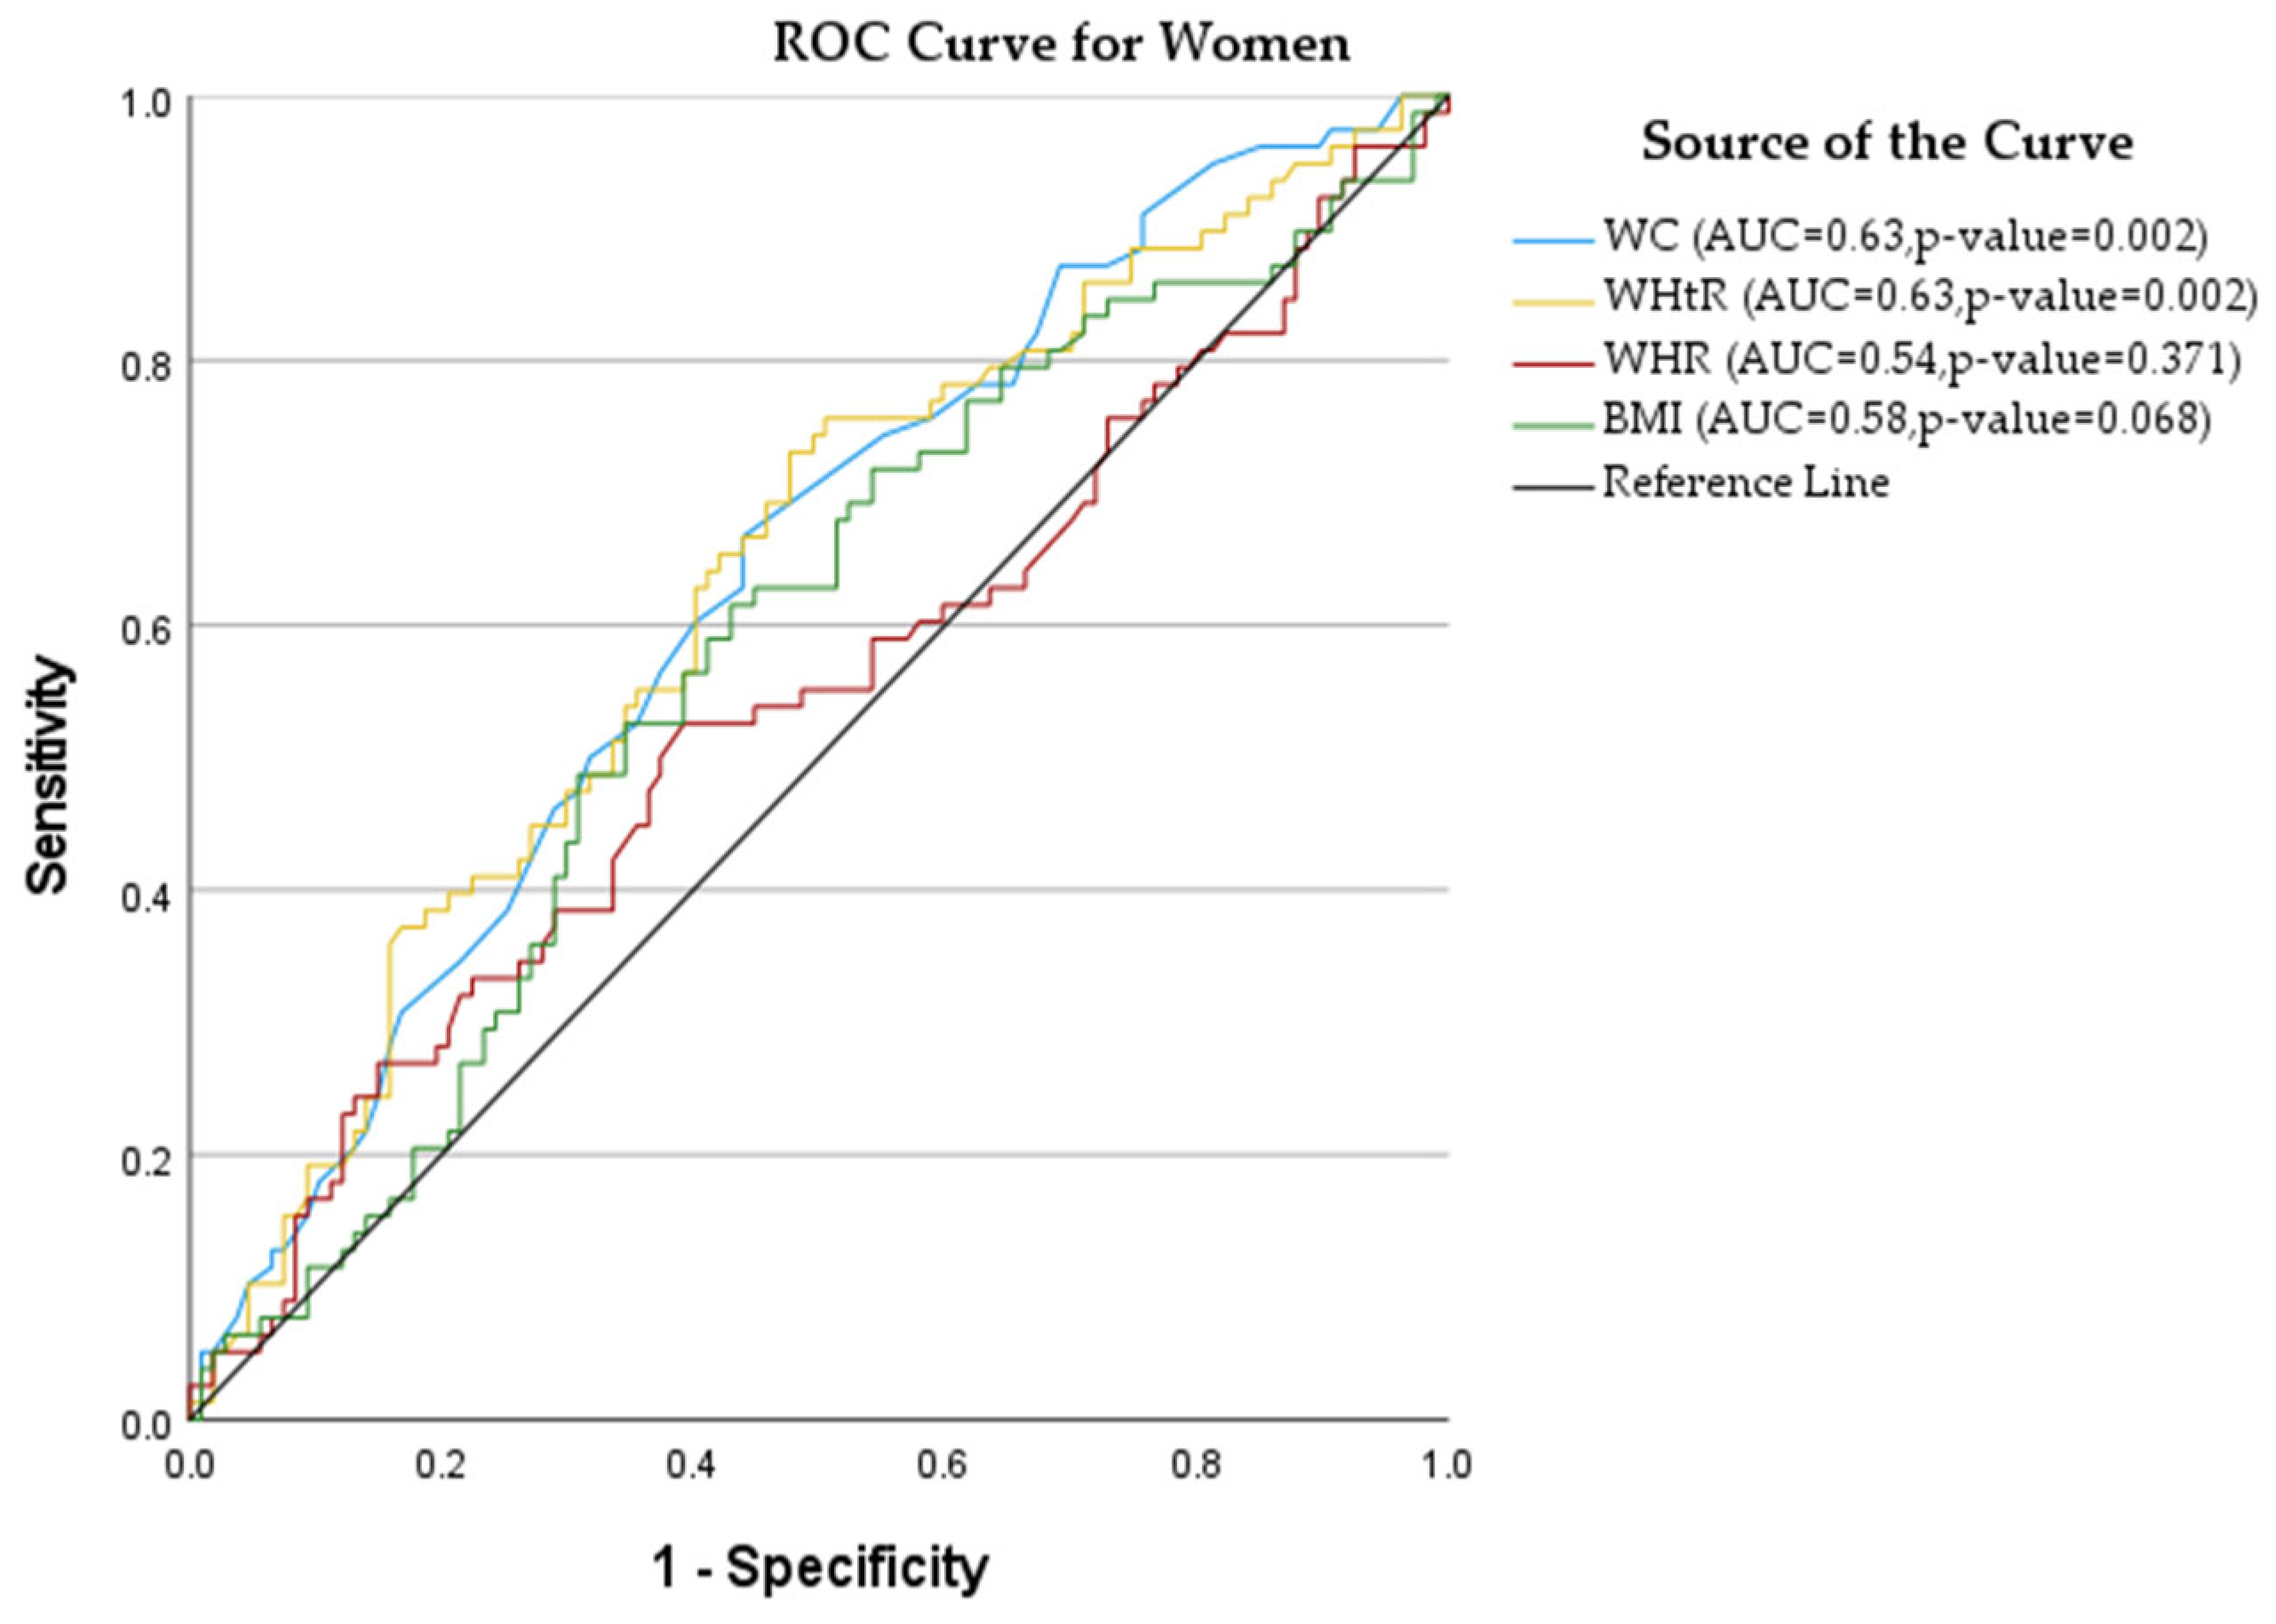
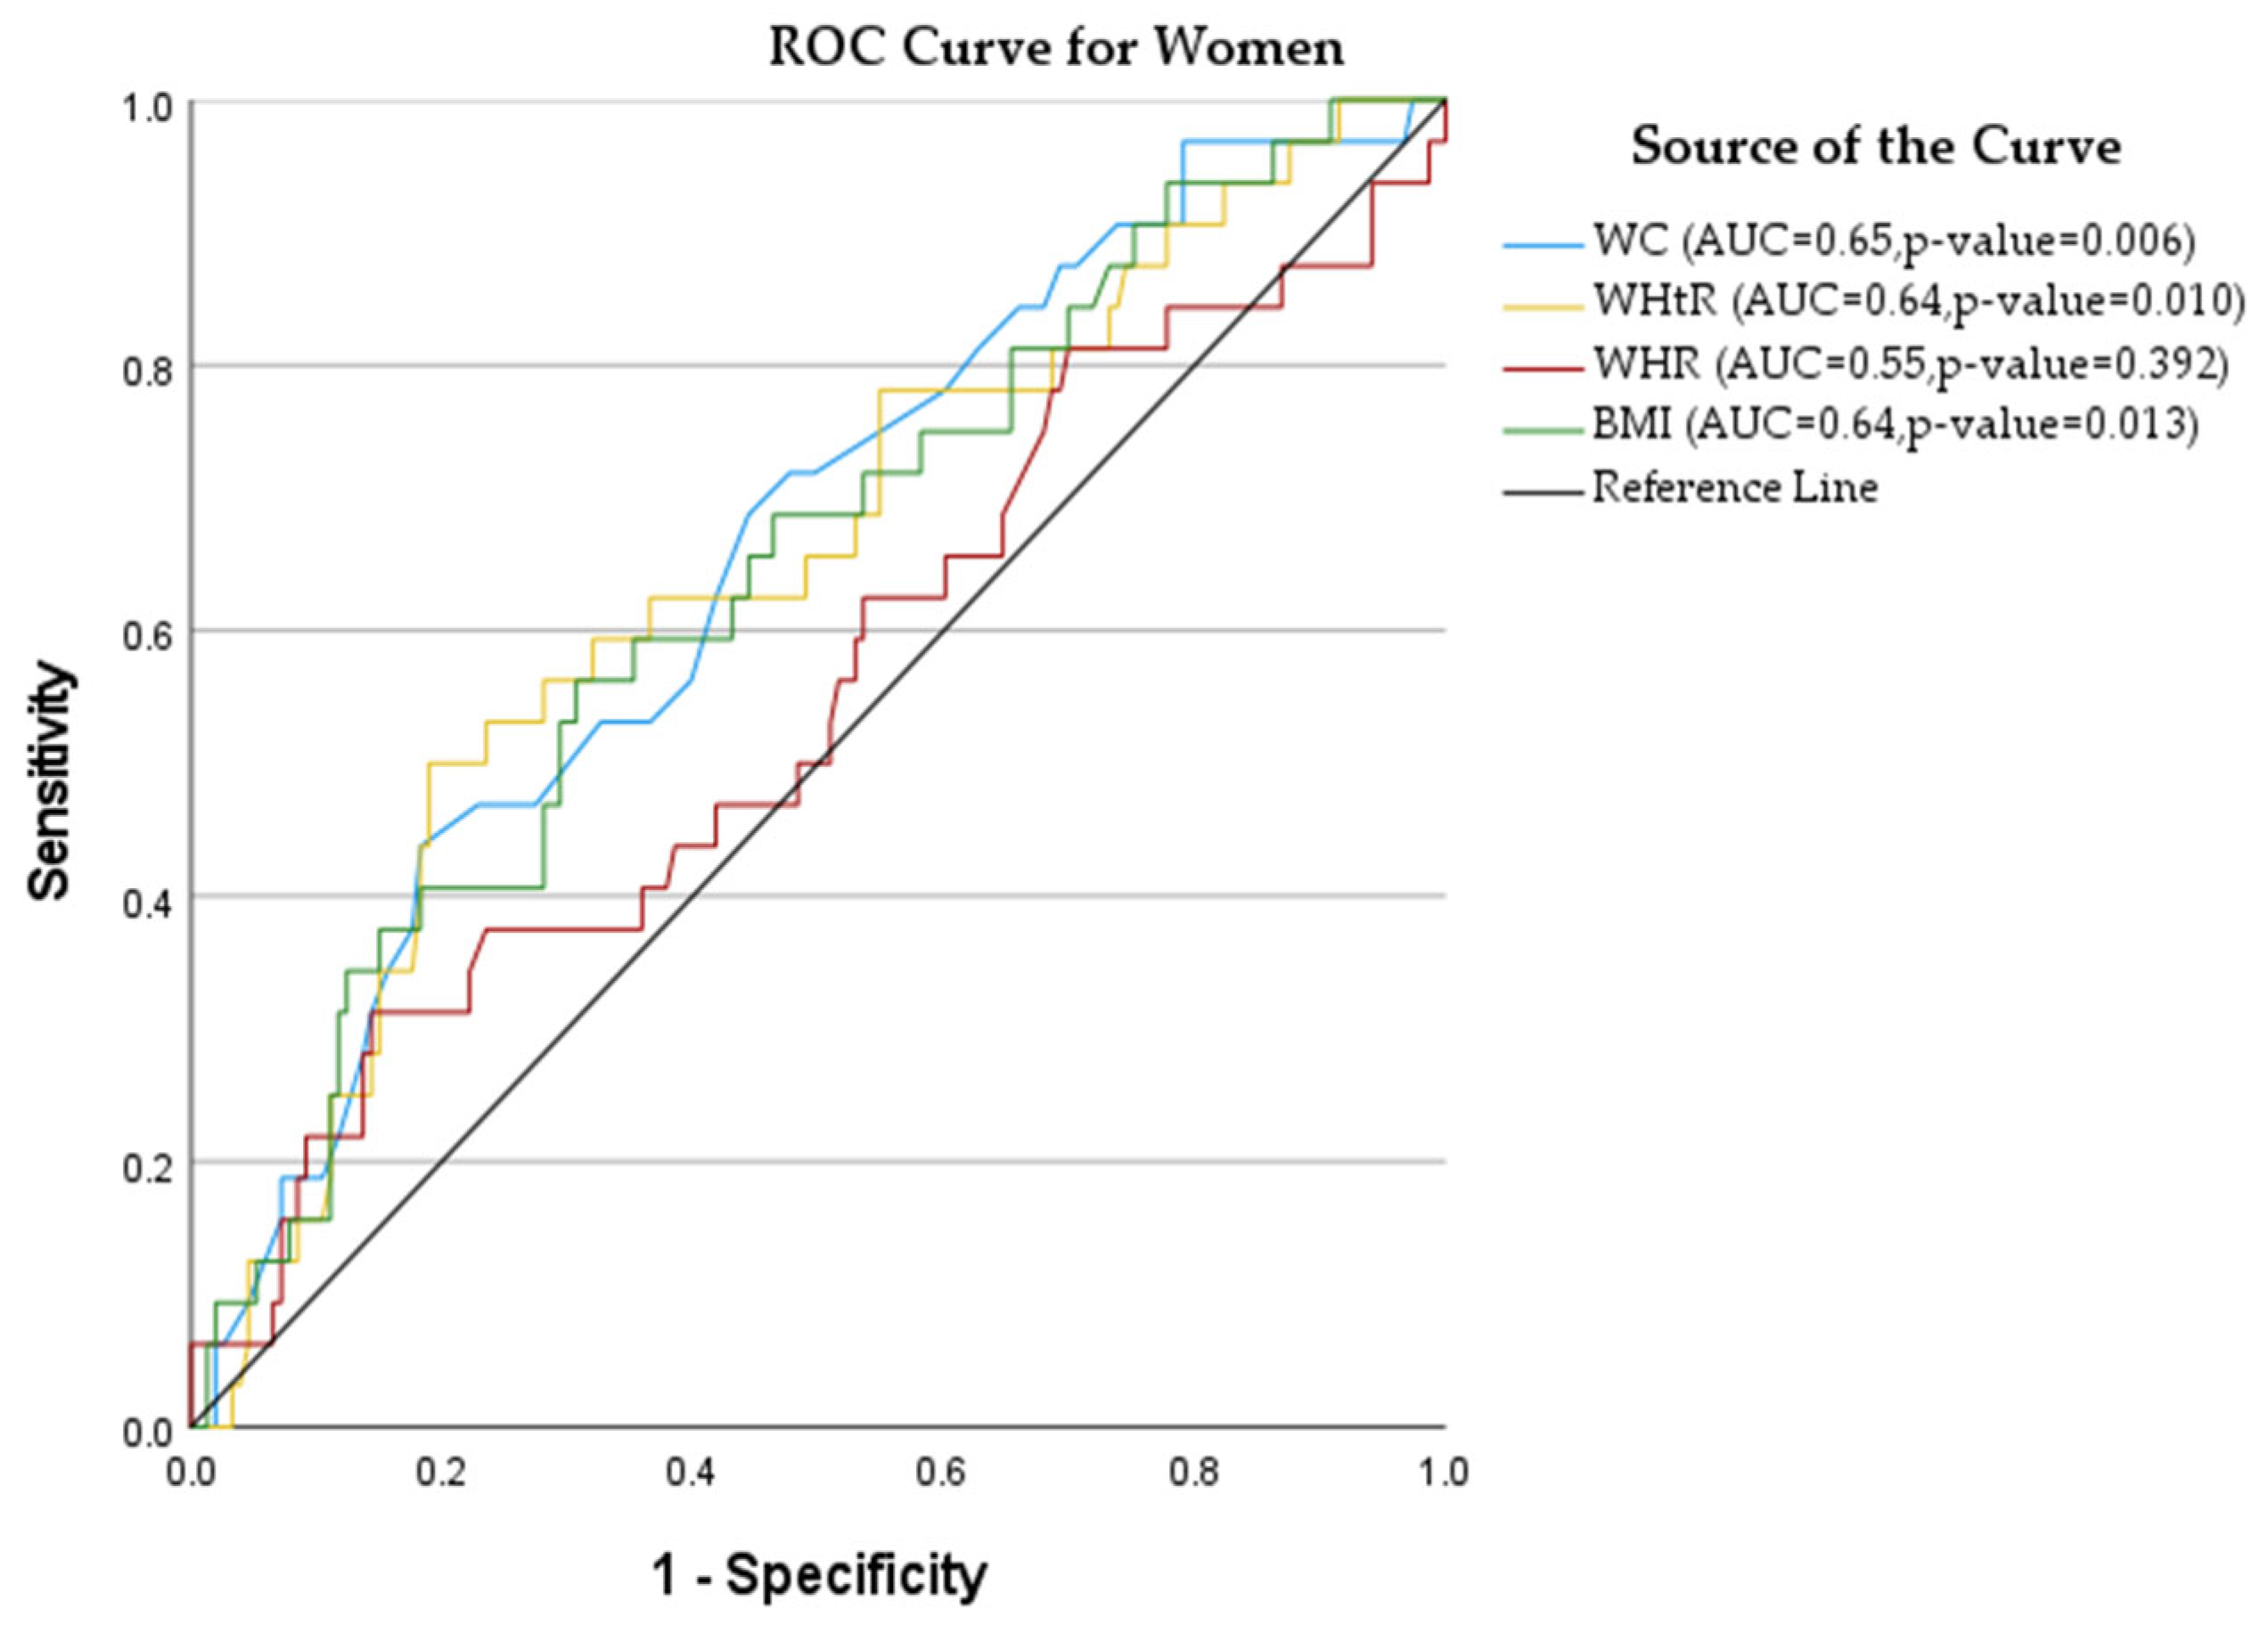
| Anthropometric Index | AUC (95% CI) | Cut-Off Point | Sensitivity (%) | Specificity (%) | p-Value |
|---|---|---|---|---|---|
| Men | |||||
| BMI | 0.603 (0.52; 0.69) * | 27.50 | 61 | 57 | 0.026 |
| WHR | 0.505 (0.41; 0.60) | 0.96 | 55 | 47 | 0.914 |
| WHtR | 0.589 (0.50; 0.68) | 0.55 | 55 | 61 | 0.053 |
| WC | 0.582 (0.49; 0.67) | 87.50 | 62 | 55 | 0.077 |
| Women | |||||
| BMI | 0.554 (0.47; 0.64) | 29.04 | 62 | 53 | 0.208 |
| WHR | 0.497 (0.41; 0.58) | 0.90 | 50 | 43 | 0.954 |
| WHtR | 0.605 (0.52; 0.69) * | 0.58 | 61 | 55 | 0.014 |
| WC | 0.640 (0.56; 0.72) * | 90.50 | 67 | 57 | 0.001 |
| Variable | Model 1 AOR (95% CI) | Model 2 AOR (95% CI) | Model 3 AOR (95% CI) | Model 4 AOR (95% CI) |
|---|---|---|---|---|
| Men | ||||
| BMI (≥25 kg/m2) | 1.84 (0.78; 4.62) | 1.77 (0.74; 4.51) | 1.78 (0.74; 4.55) | 1.57 (0.61; 4.30) |
| WHR (≥0.90) | 0.51 (0.18; 1.42) | 0.49 (0.16; 1.40) | 0.49 (0.16; 1.42) | 0.43 (0.13; 1.38) |
| WHtR (≥0.50) | 1.58 (0.73; 3.42) | 1.62 (0.74; 3.53) | 1.62 (0.74; 3.53) | 1.20 (0.49; 2.88) |
| WC (≥90 cm) | 0.86 (0.35; 2.10) | 0.85 (0.34; 2.10) | 0.84 (0.34; 2.09) | 0.58 (0.19; 1.66) |
| Women | ||||
| BMI (≥25 kg/m2) | 0.99 (0.42; 2.40) | 1.04 (0.43; 2.57) | 1.01 (0.41; 2.50) | 1.17 (0.42; 3.37) |
| WHR (≥0.90) | 0.90 (0.36; 2.27) | 0.79 (0.31; 2.04) | 0.78 (0.30; 2.01) | 1.01 (0.33; 3.28) |
| WHtR (≥0.50) | 1.11 (0.51; 2.45) | 1.11 (0.50; 2.46) | 1.11 (0.51; 2.48) | 0.83 (0.34; 2.03) |
| WC (≥90 cm) | 2.99 (0.94; 10.75) | 2.93 (0.92; 10.55) | 2.86 (0.89; 10.34) | 1.22 (1.16; 1.79) * |
Publisher’s Note: MDPI stays neutral with regard to jurisdictional claims in published maps and institutional affiliations. |
© 2022 by the authors. Licensee MDPI, Basel, Switzerland. This article is an open access article distributed under the terms and conditions of the Creative Commons Attribution (CC BY) license (https://creativecommons.org/licenses/by/4.0/).
Share and Cite
Modjadji, P.; Salane, M.C.; Mokwena, K.E.; Mudau, T.S.; Mphekgwana, P.M. Utility of Obesity Indicators for Predicting Hypertension among Older Persons in Limpopo Province, South Africa. Appl. Sci. 2022, 12, 4697. https://doi.org/10.3390/app12094697
Modjadji P, Salane MC, Mokwena KE, Mudau TS, Mphekgwana PM. Utility of Obesity Indicators for Predicting Hypertension among Older Persons in Limpopo Province, South Africa. Applied Sciences. 2022; 12(9):4697. https://doi.org/10.3390/app12094697
Chicago/Turabian StyleModjadji, Perpetua, Mulalo Caroline Salane, Kebogile Elizabeth Mokwena, Tshimangadzo Selina Mudau, and Peter Modupi Mphekgwana. 2022. "Utility of Obesity Indicators for Predicting Hypertension among Older Persons in Limpopo Province, South Africa" Applied Sciences 12, no. 9: 4697. https://doi.org/10.3390/app12094697