
Long-Term Thermal Stress Analysis and Optimization of Contraction Joint Distance of Concrete Gravity Dams


1
Jaroslav Černi Water Institute, 11226 Belgrade, Serbia
2
Faculty of Civil Engineering, University of Belgrade, 11120 Belgrade, Serbia
*
Author to whom correspondence should be addressed.
Appl. Sci. 2022, 12(16), 8163; https://doi.org/10.3390/app12168163
Submission received: 24 July 2022
/
Revised: 5 August 2022
/
Accepted: 12 August 2022
/
Published: 15 August 2022
(This article belongs to the Section Civil Engineering)
Abstract
:Results of the conducted research aiming to demonstrate the methodology of optimization of dam monolith length (distance between contraction joints), through monitoring the thermal tensile stresses during construction and service life of a concrete gravity dam that is built using the block method, are presented in this paper. A 3D space–time numerical model for phased thermal stress analysis is employed in a large concrete gravity dam case study. For the adopted block dimensions, schedule, and dynamics of construction and material parameters, the thermal stress analysis is conducted, taking into account the following: thermal physical properties of the material, the cement hydration process, heat exchange with the external environment and the reservoir, and self-weight of the structure. The main advantage of the proposed methodology is the possibility of controlling the cracks resulting from thermal tensile stresses in the monolith of a concrete gravity dam, by optimizing the monolith’s length to minimize the zones in which the tensile capacity of concrete is exceeded. The results obtained from the temperature field analysis show that the maximum temperature increase in the dam’s body results from the cement hydration process in combination with summer air temperatures in the construction phase. The aforementioned factors account for the increase in temperature of up to 45.0 °C, while during winter cooling of the structure occurs due to lower temperatures, especially in the surface zones. The results of the stress field analysis show that the extreme values of thermal tensile stresses are present in the process of a sudden or gradual cooling of the concrete when shrinkage occurs. Finally, it is shown that the reduction of the monolith length by 5.0 m (from 20.0 m to 15.0 m) results in a decrease in the extreme thermal tensile stress values by an average of 0.70 MPa (up to 12.0%) in winter and an average of 1.10 MPa (up to 20.0%) in summer; while for the entirety of the analyzed time period, results in a decrease in the extreme thermal tensile stress values by an average of 16.0% (0.93 MPa).
1. Introduction
Immediately upon pouring the concrete, the temperature in the body of a concrete gravity dam (CGD) rises [1,2,3,4]. As a consequence of the cooling of concrete, thermal dilatations initiate a change in the volume of the structure [2,3,5,6]. If the volumetric deformations are restrained or limited, this leads to the formation of thermal tensile stresses (TTS), which can eventually cause cracking in the structure [1,2,3]. Cracks tend to expand over time, reducing the dam’s capacity, enabling water penetration, and the increase in uplift forces [3,4,7,8].
Numerous researchers have dealt with the thermal analysis of concrete dams [9,10,11,12,13,14,15]. James and Dollar [16] conducted thermal stress analysis (TSA) of a concrete arch dam, taking into account the hydration heat for every freshly poured concrete block, phased change of the boundary conditions in the model, as well as crack development, but not including the impact of changes to the blocks’ dimensions on the crack formation process. Malkawi et al. [17] simulated the construction process of a CGD made of roller compacted concrete (RCC), which is built in layers. TSA was conducted for different monolith lengths (15, 30, and 45 m), accounting for the hydrostatic pressure on the upstream face, which distorted the field of TTS (which exclusively occurs as a consequence of thermal processes in the structure). Sheibany and Ghaemian [18] analyzed stresses in a concrete arch dam taking into account all the relevant thermal processes, self-weight of the structure, and hydrostatic pressure, which, as shown in the previous paper, does not provide a clear insight into TTS which are exclusively a consequence of thermal processes in the structure. Castilho et al. [19] conducted coupled chemo-thermal 3D analysis of a concrete arch dam and simulated hydration heat based on test results carried out during construction. Salazar et al. [20] analyzed the relevance of a correct calculation of the reference temperature to adequately determine the stress state of the arch dam. Kuzmanovic et al. [21,22] presented a methodology for calculating the monolith length of CGD Platanovryssi (Greece) made of RCC. In [21,22], the authors acknowledged all the relevant thermal processes along with the self-weight of the structure and described the realistic TTS field in the structure. The developed model is applicable with CGD made of RCC in which the placing of concrete is executed in layers up to 1 m thickness, as opposed to the model presented in this paper where the construction process is simulated on the same CGD by using the block method (TSA in case of changing construction technology). Sayed-Ahmed et al. [23] conducted coupled TSA of a CGD taking into account the relevant thermal processes, and experimental and analytical models of the authors [24] for model verification. The conducted analysis did not take into account the impact of different monolith lengths on the stress field (SF) in the dam’s body. Thermal stresses can present a big issue in many engineering topics, as well as additive manufacturing and other manufacturing processes [25,26,27,28].
Exceedance of concrete tensile resistance resulting from TTS occurs in the dam’s axis direction. This causes cracks in the vertical plane, through the height of the dam’s cross-section. Crack width and spacing between the adjacent cross-sections in which they occur depend on the degree of restraint against the change of volume; this is a function of the environment in which the foundation of the dam is cast, adjacent structures which are in contact with the dam, as well as previously cast concrete blocks [1]. Given possible consequences that damaging or eventual collapse of these types of objects [29] would have on the environment, it is customary to limit and sustain TTS below the concrete tensile resistance which is, for concrete class from C20/25 to C40/50, in the range from 2.2 to 3.5 MPa [5].
The goal of the research conducted in this paper is to present the methodology for optimizing the monolith length (spacing between the contraction joints) to reduce the impact of the thermal processes on the increase in TTS in concrete and thus reducing cracking, and degradation of durability and safety of CGD [30,31].
In this research, in the calculation models developed by the authors, which simulate the construction process using the block method, a phase semi-coupled TSA was performed, taking into account the following thermal boundary conditions: at the interface between the blocks and the rock mass, at the interface between the old and newly poured blocks, at the surfaces of blocks that are in contact with air and water, as well as temperature levels of the surrounding rock mass and fresh concrete mix. The analysis is conducted over a long-term period that entails the construction, reservoir filling, and exploitation process of the structure. Two different monolith lengths were considered (20.0 m and 15.0 m).
TTS analysis, performed on the calculation model, takes into account all the relevant thermal processes, and self-weight of the structure, but disregards other actions which would disturb the realistic TTS field (hydrostatic pressure and the uplift forces).
As the result of the analysis, the temperature fields (TF), the stress fields (SF), as well as the zones in which the concrete tensile resistance in the dam’s axis direction is exceeded, are shown for characteristic construction and exploitation phases. TF results show sensitivity to the cement hydration process [32] and external environment conditions during construction and exploitation. SF results show the sensitivity of the structure to the process of shrinkage of concrete caused by a sudden or gradual cooling process, as well as to the change of the monolith length, whereupon the reduction of the zones in which the concrete tensile resistance is exceeded resulting from the reduction of the monolith length is noticed.
The results of the research point out the significance of the process of optimization of the monolith length and the possibility of advancing the presented methodology by varying the arrangement and dynamics of pouring the concrete blocks, considering the cooling and concrete curing processes during construction [33,34] and connecting with a monitoring system in the construction and exploitation phase [35,36].
2. Thermal Stress Control and Prevention of Crack Formation
The condition for crack formation in concrete is that the maximum tensile stress surpasses the concrete tensile resistance:
where represents maximum tensile stress and represents the tensile resistance of concrete at a given moment and location in a structure.
The process of crack formation in a concrete gravity dam (CGD) can be avoided by construction measures, such as building in separate monoliths and casting concrete blocks in phases, while it is necessary to use slow-hardening cement in smaller quantities in the process of preparing the concrete mixture, as well as lowering the temperature by using ice, cold water or cooled aggregate, together with an adequate curing method after pouring the concrete [37,38].
Construction of CGD in separate, mutually independent monoliths [39] implies forming the contraction joints (Figure 1A) between the neighboring monoliths, which enables the relaxation of thermal tensile stresses (TTS), thus preventing or mitigating the crack-forming process. The water resistance of a dam is provided by connecting the monoliths with waterstops made of an elastic water-resistant material (Figure 1A). With properly arranged contraction joints, cracks that could be a consequence of differential settlement induced by topographic and/or geomechanics conditions can be avoided. Experience has shown that the distance between the two adjacent contraction joints, which is defined as the monolith length, is usually between 6.0 and 16.0 m, and it is conditioned by the requirement that cracks in concrete do not exceed the acceptable limits [40].
Unlike the contraction joints, the construction joints (Figure 1B,C) are temporary and shall ensure proper adhesion between blocks to obtain a monolith unit. The construction joints, which can be vertical, horizontal, and staggered, serve the purpose of reducing the initial stresses and the possibility of early cracking, which is a consequence of shrinkage, by enabling a more rapid and even emission of heat to the outside environment which surrounds the concrete. The construction joints must be previously prepared to secure a proper connection between the old and the newly cast concrete block [40].
Phased pouring implies casting concrete blocks according to the schedule of construction, which must be the result of a previously conducted thermal stress analysis (TSA) with the aim of reducing TTS. There are several ways to distribute blocks inside a monolith (Figure 1B,C): long blocks, staggered joints, vertical joints, and a combination of long blocks and vertical and/or staggered joints. The length of a block (in the direction toward the riverbank) is a dimension that is usually equal to the monolith length; the width of a block (in the upstream–downstream direction) depends on the monolith width and is typically up to 25 m, while the height of a block is usually from 0.5 to 3 m. The concrete block remains free to cool down for at least three days [40].
Based on the aforementioned, a conclusion can be made that, in the design process of CGD, special attention should be given to the definition of the structural elements, construction dynamic plan, as well as the choice of the concrete mix, which implies excellent knowledge of all the parameters and factors which influence the process of stress field (SF) development, leading to formation and propagation of cracks. Contemporary methods of thermal stress analysis, which are based on the application of the finite element method (FEM), offer the possibility of incorporating a large number of parameters and factors of importance for the process of computational modeling of this phenomenon.
3. Theoretical Basis of Thermal Stress Processes
3.1. Fundamental Heat Transfer Equations
The temperature change of a homogeneous isotropic body as a function of time is described by the well-known Fourier’s heat equation:
where ρ is the density of the material [kg/m3], c is the specific heat of concrete [J/(kg K)], T is the temperature [°C], k is the thermal conductivity coefficient [W/(m K)] and Q is the internal heat generation per unit volume [W/m3].
In practical problem solving, the demanded solution is T(x,y,z,τ) of Equation (2), which satisfies the appropriate initial and boundary conditions.
Initial conditions imply that the distribution of temperature in a cross-section at the initial time (τ = 0) is known and described by the temperature field T(x,y,z,0), while boundary conditions define the exchanged heat flux between the cast blocks and the environment:
where represents the temperature gradient at the blocks’ surfaces [°C/m], is the convective heat flux [W/m2] and is the radiative heat flux [W/m2].
The heat exchanged between blocks and the environment through convection, namely, between the blocks’ surfaces and the air, is described by Newton’s law of cooling:
where T represents the temperature of the block’s surface [°C], is the ambient temperature [°C] and is the convective heat transfer coefficient [W/m2 K].
The heat exchanged between the blocks’ surfaces through radiation is described by the linearized Stefan–Boltzmann radiation law:
where is the linearized radiation heat transfer coefficient [W/m2 K], defined by the equation [18]:
where ε is the block’s surface emissivity and σ is the Stefan–Boltzmann constant (5.669·10−8 W/m2).
The boundary condition (3), having in mind expressions (4) and (5), can be described in the following manner:
where h represents the combined () convective heat transfer coefficient [W/m2 K].
Figure 2 shows the examined heat transfer processes in the concrete gravity dam (CGD) represented in this paper.
3.2. The Release of Heat from Concrete
During the setting of concrete, heat that depends on the chemical and mineral composition of cement is released in the hydration process.
Experiments demonstrated that in the first 7 to 10 days of setting, up to 80.0% of the total heat produced by the cement hydration is released and that this process decelerates as the setting continues [40,41].
A curve that portrays the release of hydration heat is often approximated by the following relation [40]:
where represents the release of hydration heat from concrete at time τ in [J], is the maximum quantity of hydration heat that can be released from the concrete of a given mixture at the full cement hydration in [J], m is an empirical parameter that depends on the type of cement [1/h] and τ is time [h].
Temperature resulting from the heat released from the cement hydration process leads to peaks in thermal tensile stresses (TTS) during the dam construction, whereby an increase in temperature can amount up to 50.0 °C [40] and it is described by the following equation:
where represents the temperature resulting from the heat released from the cement hydration process [°C], is the quantity of released heat [J/kg], K is the cement per unit of volume ratio [kg/m3], c is the specific heat capacity of concrete [J/(kg K)] and is the density of concrete [kg/m3].
3.3. Thermal Tensile Stress
TTS represents the normal stress which in CGD acts in the dam’s axis direction, and if it exceeds the concrete tensile capacity, cracks in concrete will inevitably form. This stress, at time t, can be obtained according to the following relation:
where [MPa] represents the TTS in the CGD axis direction, E [MPa] is Young’s modulus of elasticity of concrete, [-] is the coefficient of thermal expansion of concrete, and [°C] is the temperature change in the CGD body.
4. Thermal Stress Analysis and Optimization of Contraction Joint Distance
4.1. Description of the Calculation Model
The 3D model for thermal stress analysis (TSA) has the geometry of one non-overflowing monolith of the concrete gravity dam (CGD) Platanovryssi (Greece) [42], 95.0 m high, and the surrounding rock mass of dimensions 154.0 × 50.0 m (Figure 3). By modeling the rock mass, heat exchange with the dam’s monolith is enabled.
The lowest level in the model is 101.0 masl (level of the bottom of the rock mass) and the highest is 230.0 masl (level of the crest). The local coordinate system is oriented so that the positive X direction coincides with the direction of the river flow, the Z-axis towards the right riverbank, and the positive direction of the Y-axis points upwards (Figure 3).
The dam’s monolith, as opposed to the model presented in [21,22], is divided into 78 blocks (Figure 4), arranged by combining long blocks and vertical joints (Figure 1C). The length of the blocks is equal to the length of the monolith (two separate analysis options with monolith lengths of 20.0 and 15.0 m are considered), the average width of the blocks is 20.0 m, while the height varies depending on the position of the block (blocks 1–63 are 3.0 m high; blocks 64–77 are 3.5 m high, while block 78 is 4.0 m high).
The blocks are shown in Figure 4, with the number of each block representing the sequence of pouring. Each block represents a new phase, which allows for a realistic simulation of the staged construction.
For analysis purposes, a 3D FEM model is generated using Lusas Academic software [43]. The finite element mesh is created using 4068 hexahedron finite elements (HX8M) with eight nodes.
4.2. Boundary Conditions and Actions
In the analysis of the temperature field (TF), the following boundary conditions are taken into account: (I) at the interface between the blocks and the rock mass, (II) at the interface between the old and newly poured blocks, (III) at the surfaces of blocks that are in contact with air and water, as well as (IV) temperature levels of the surrounding rock mass and the fresh concrete mix.
In every phase of the analysis, the ambient temperatures during construction and service life are applied on the surface of the blocks that are in contact with air [44], ranging from −2.0 to 33.0 °C (Table 1). The ambient temperatures were measured by the meteorological station that was built immediately upstream of the dam construction site. The boundary condition concerning the air temperature on the blocks’ side surfaces is applied taking into consideration the sequence of pouring of the blocks of the neighboring monoliths in space and time (Figure 5). In this case, proper cooling of a freshly cast block of the monolith considered is enabled from all sides.
On all sides of the galleries which are in contact with air, the measured internal air temperatures during construction and service life are applied [44], ranging from 10.0 to 22.0 °C (Table 2).
Filling of the reservoir to level 225.0 masl is applied in steps. On all blocks’ surfaces in contact with water on the upstream side, the value of the reservoir water temperature of 9.0 °C is applied [44]. Water temperature does not vary with depth as a result of the assumption of water flow resulting from the operation of the power plant intake near the upstream face of the dam. This assumption leads to the fact that the model of temperature variation through depth [45], typical for deep reservoirs, is not applied in this analysis. On the downstream side, the non-overflowing monolith is not in contact with the tailwater, and therefore the impact of the tailwater’s temperature on the structure is excluded.
The temperature of the surrounding rock mass is adopted as the constant mean multiannual value of 13.0 °C.
The temperature of the fresh concrete mixture ranges from 9.50 to 13.10 °C [44], depending on the season in which the mixing and transport are taking place (Table 3).
In the analysis of the stress field (SF), the displacement boundary condition is applied along the bottom, upstream, and downstream boundaries of the rock mass. In these areas, the nodal displacements (u) are restrained in all directions (Figure 6).
This way, a more realistic simulation of the rock mass behavior is enabled, as well as the self-weight-induced deformation when compared to the traditionally used fully clamped models of concrete dams without surrounding rock mass.
The specified boundary conditions take into account all the relevant thermal processes (including the impact of the reservoir water temperature on the structure) and self-weight of the structure, but disregards other actions which would disturb the realistic TTS field (hydrostatic pressure and the uplift forces).
At the beginning of each phase of the analysis, an active part of the model is defined, because the concrete blocks are being born successively one after another at the exactly defined time intervals (“birth and death element”). Thereby, a history of deformations from the preceding phases is taken into account. The dam’s self-weight and the weight of the surrounding rock mass are taken as an initial action on the model, which serves as a basis for defining the initial SF. Derivation of stresses and deformations resulting from the self-weight is performed in the first step of each of the analysis phases. The temperature field (TF) for the corresponding SF analysis step is taken from the previously conducted thermal analysis, by using semi-coupled TSA (in which deformations are impacted by temperature, but not vice versa). Hydrostatic pressure and uplift actions are not considered in the analysis, because including these actions in the analysis would conceal the actual impact of the thermal factors on the SF in the dam’s body.
4.3. Material Parameters for Thermal Stress Analysis
4.4. Phases of Analysis and Distinctive Dates
The analysis is conducted over a long-term period of 5 years, and it covers the construction, reservoir filling and exploitation process of the structure. The construction period contains the first 512 days with 78 analysis phases (for each block of the dam) and the analysis step of 1.5 days. The period from the construction finish to the beginning of reservoir filling lasts from day 512 to day 1080 with the analysis step of 2.25 days, while the period of reservoir filling together with the exploitation period occupies the remaining time (from day 1080 to day 1804) with the same analysis step of 2.25 days. Thereby, the following distinctive dates and periods during the construction are considered:
- Beginning of the construction—18 October. Of the first year (the year in which the construction commenced);
- The first (winter) break of 12 days in the period from 15–27 December in the first year;
- The second (summer) break of 135 days in the period from 20 June–2 November in the second year;
- The third (winter) break of 12 days in the period from 15–27 December in the second year;
- The reservoir filling in the period from 27 May–20 November in the fourth year.
Figure 7 shows a diagram of the reservoir filling [44] during the fourth year from the commencement of construction. The filling lasted nearly 6 months and after this process, the water level was typically about 225.0 masl for the following three years. Deviations from this level are negligible, as the lowest level is 224.40 masl and the highest level is 226.30 masl. Having this in mind, a constant water level of 225.0 masl is adopted in the analysis upon filling the reservoir.
The dynamics of building the dam by blocks are defined so that it follows the previously listed distinctive dates and periods with the corresponding redistribution of the boundary conditions in the altered geometry of the model, which is conditioned by pouring the concrete by blocks.
4.5. Optimization of Contraction Joint Distance
When mentioning thermal tensile stresses (TTS) in CGD, as a rule they are always related to the normal stresses acting in the direction parallel to the dam’s axis. Regarding the adopted coordinate system in the model, these are stresses which are designated as SZ in the software. By convention, tension stresses are positive.
The length of the monolith is a distance in the direction of the longitudinal axis between two adjacent contraction joints. The length of the monolith is also equal to the length of the block. Parameters of impact on the position and number of joints are SF in the dam’s body resulting from the thermal processes, the topography of the terrain, the adopted construction method, as well as the concrete pouring technology. Having in mind that CGD is an exceptionally massive structure, the greatest number of joints is constructed to limit TTS [1].
The methodology for optimization of the monolith length presented in this paper is based on successive reduction of its length, by monitoring for the exceedance of the concrete tensile resistance in the mid-plane of the monolith. The adopted monolith length is the one in which the exceedance of the concrete tensile resistance in the mid-plane of the monolith is either eliminated or limited for the most part, in the sense that there is no danger of crack formation and development on the account of exceedance of the concrete tensile capacity. This paper also presents the impact of reducing the monolith length by 5.0 m (from 20.0 m to 15.0 m) on the stress field in the structure as an example of verification of the applied methodology.
5. Results and Discussion
5.1. Validation of the Analysis Model concerning the Assigned Boundary Conditions
To assess the accuracy of the analysis model concerning the assigned boundary conditions, distinctive control nodes are chosen on the upstream and downstream face, in the middle of the monolith, and in the crest zone (Figure 8), in which the results of the concrete temperature change over time are analyzed (Figure 9, Figure 10, Figure 11 and Figure 12).
Figure 9 shows the concrete temperature in node 2787, which is located in the mid-plane of the monolith in the middle of the upstream face of block 25 (Figure 8), as a function of the duration of construction and exploitation. The node is exposed to the air with temperature periodically varying annually from −2.0 to 33.0 °C, from the moment of casting of the block (121st day from the commencement of construction) up until the moment when it came in contact with the water from the reservoir (1020th day from the commencement of construction) with a constant temperature of 9.0 °C. In Figure 9, the annual changes (long periods) and the daily changes (short oscillations) can be noticed. These changes are a consequence of variations in the air temperature during annual and daily oscillations.
As opposed to the concrete temperature in node 2787, the concrete temperature in node 2853 (Figure 10), which is located in the mid-plane of the monolith in the middle of the downstream face of block 34, is, from the moment of the casting of the block (162nd day from the commencement of construction) up until the end of the analysis period considered (1804th day since the construction started), under the influence of air whose temperature varies periodically annually from −2.0 to 33.0 °C. In this case, the annual and daily temperature changes reflected through long and short oscillations shown in the figure can be noticed, as well. As the monolith is not in contact with the downstream side’s tailwater, the impact of the water temperature in the nodes on the downstream face is non-existent.
The concrete temperature in node 3016, which is located inside the mass of the concrete, in the mid-plane, and in the middle of the top face of block 61, is shown in Figure 11. After placing the block (418th day from the commencement of construction) the node is exposed to December’s air temperatures (which ranged from 0 °C to 4.5 °C). After 4.5 days, block 63 is poured on top of block 61, and afterward the subsequent blocks. The temperature in this node starts to rise as a consequence of the released hydration heat from cement and reaches the extreme value of 35.0 °C after 70 days. After that, the process of cooling the concrete is evident, and it continued even through the last analysis step in which the temperature value is 20.0 °C.
The concrete temperature in node 3184, which is located in the mid-plane of the monolith, and in the middle of the top face of block 76, is shown in Figure 12. This node, at the moment of pouring block 76 (500th day from the beginning of construction), is exposed to March’s air temperature (ranging from 0 °C to 5.6 °C) for 4.5 days. At the moment when the final blocks 77 and 78 are cast above block 76, the temperature in this node starts to rise as a result of the heat released from the cement hydration process. In the following 30 days, it reaches the extreme value of 32.0 °C. Upon reaching the extreme temperature value, the concrete starts to cool, but with a significant impact of seasonal air temperature changes resulting from the proximity of the selected node to the dam’s crest. The cooling does not come to a halt even at the last analysis step, in which the concrete temperature in the node has a value of 15.0 °C. It can be said that the concrete temperature in this node, due to its position, approaches the mean annual ambient temperature. The faster cooling rate of concrete in node 3184, compared to node 3016, can be explained by the impact of the air temperature to which node 3184 is exposed during the construction and service life. Node 3016 is located deeper inside the mass, and the amplitude of ambient air temperature penetration declines with proximity to the central part of the monolith.
Based on the presented results in the control nodes, it can be concluded that the developed analysis model provides a correct representation of the real dam, from the standpoint of the applied boundary conditions.
5.2. Results of Temperature Field Analysis
Representation of the temperature field (TF) in the rock mass (Figure 13) shows that it is constant and equal to the applied mean multiannual temperature of 13.0 °C, except in the part directly underneath the foundation line. Therefore, and since the rock mass is not a subject of the analyses of this research, in the results which follow, this part of the model will be omitted from the presentation for the sake of clarity.
Results of TF and stress field (SF) in the dam’s body are shown in the chosen distinctive time sections, which the authors regarded as the best suited to represent the obtained results.
The selected distinctive time sections are:
- The 84th day from the beginning of construction (10 January of the second year, 15 days from completing block 16, and at the moment of finishing the first break in the construction);
- The 283rd day from the beginning of construction (27 July of the second year, 40 days from completing block 52, and during the long (summer) break in the construction);
- The 512th day from the beginning of construction (13 March of the third year, after casting the last block 78);
- The 1080th day from the beginning of construction (02 October of the fourth year, during the filling of the reservoir);
- The 1804th day from the beginning of construction (25 September of the sixth year, during the service life of the structure).
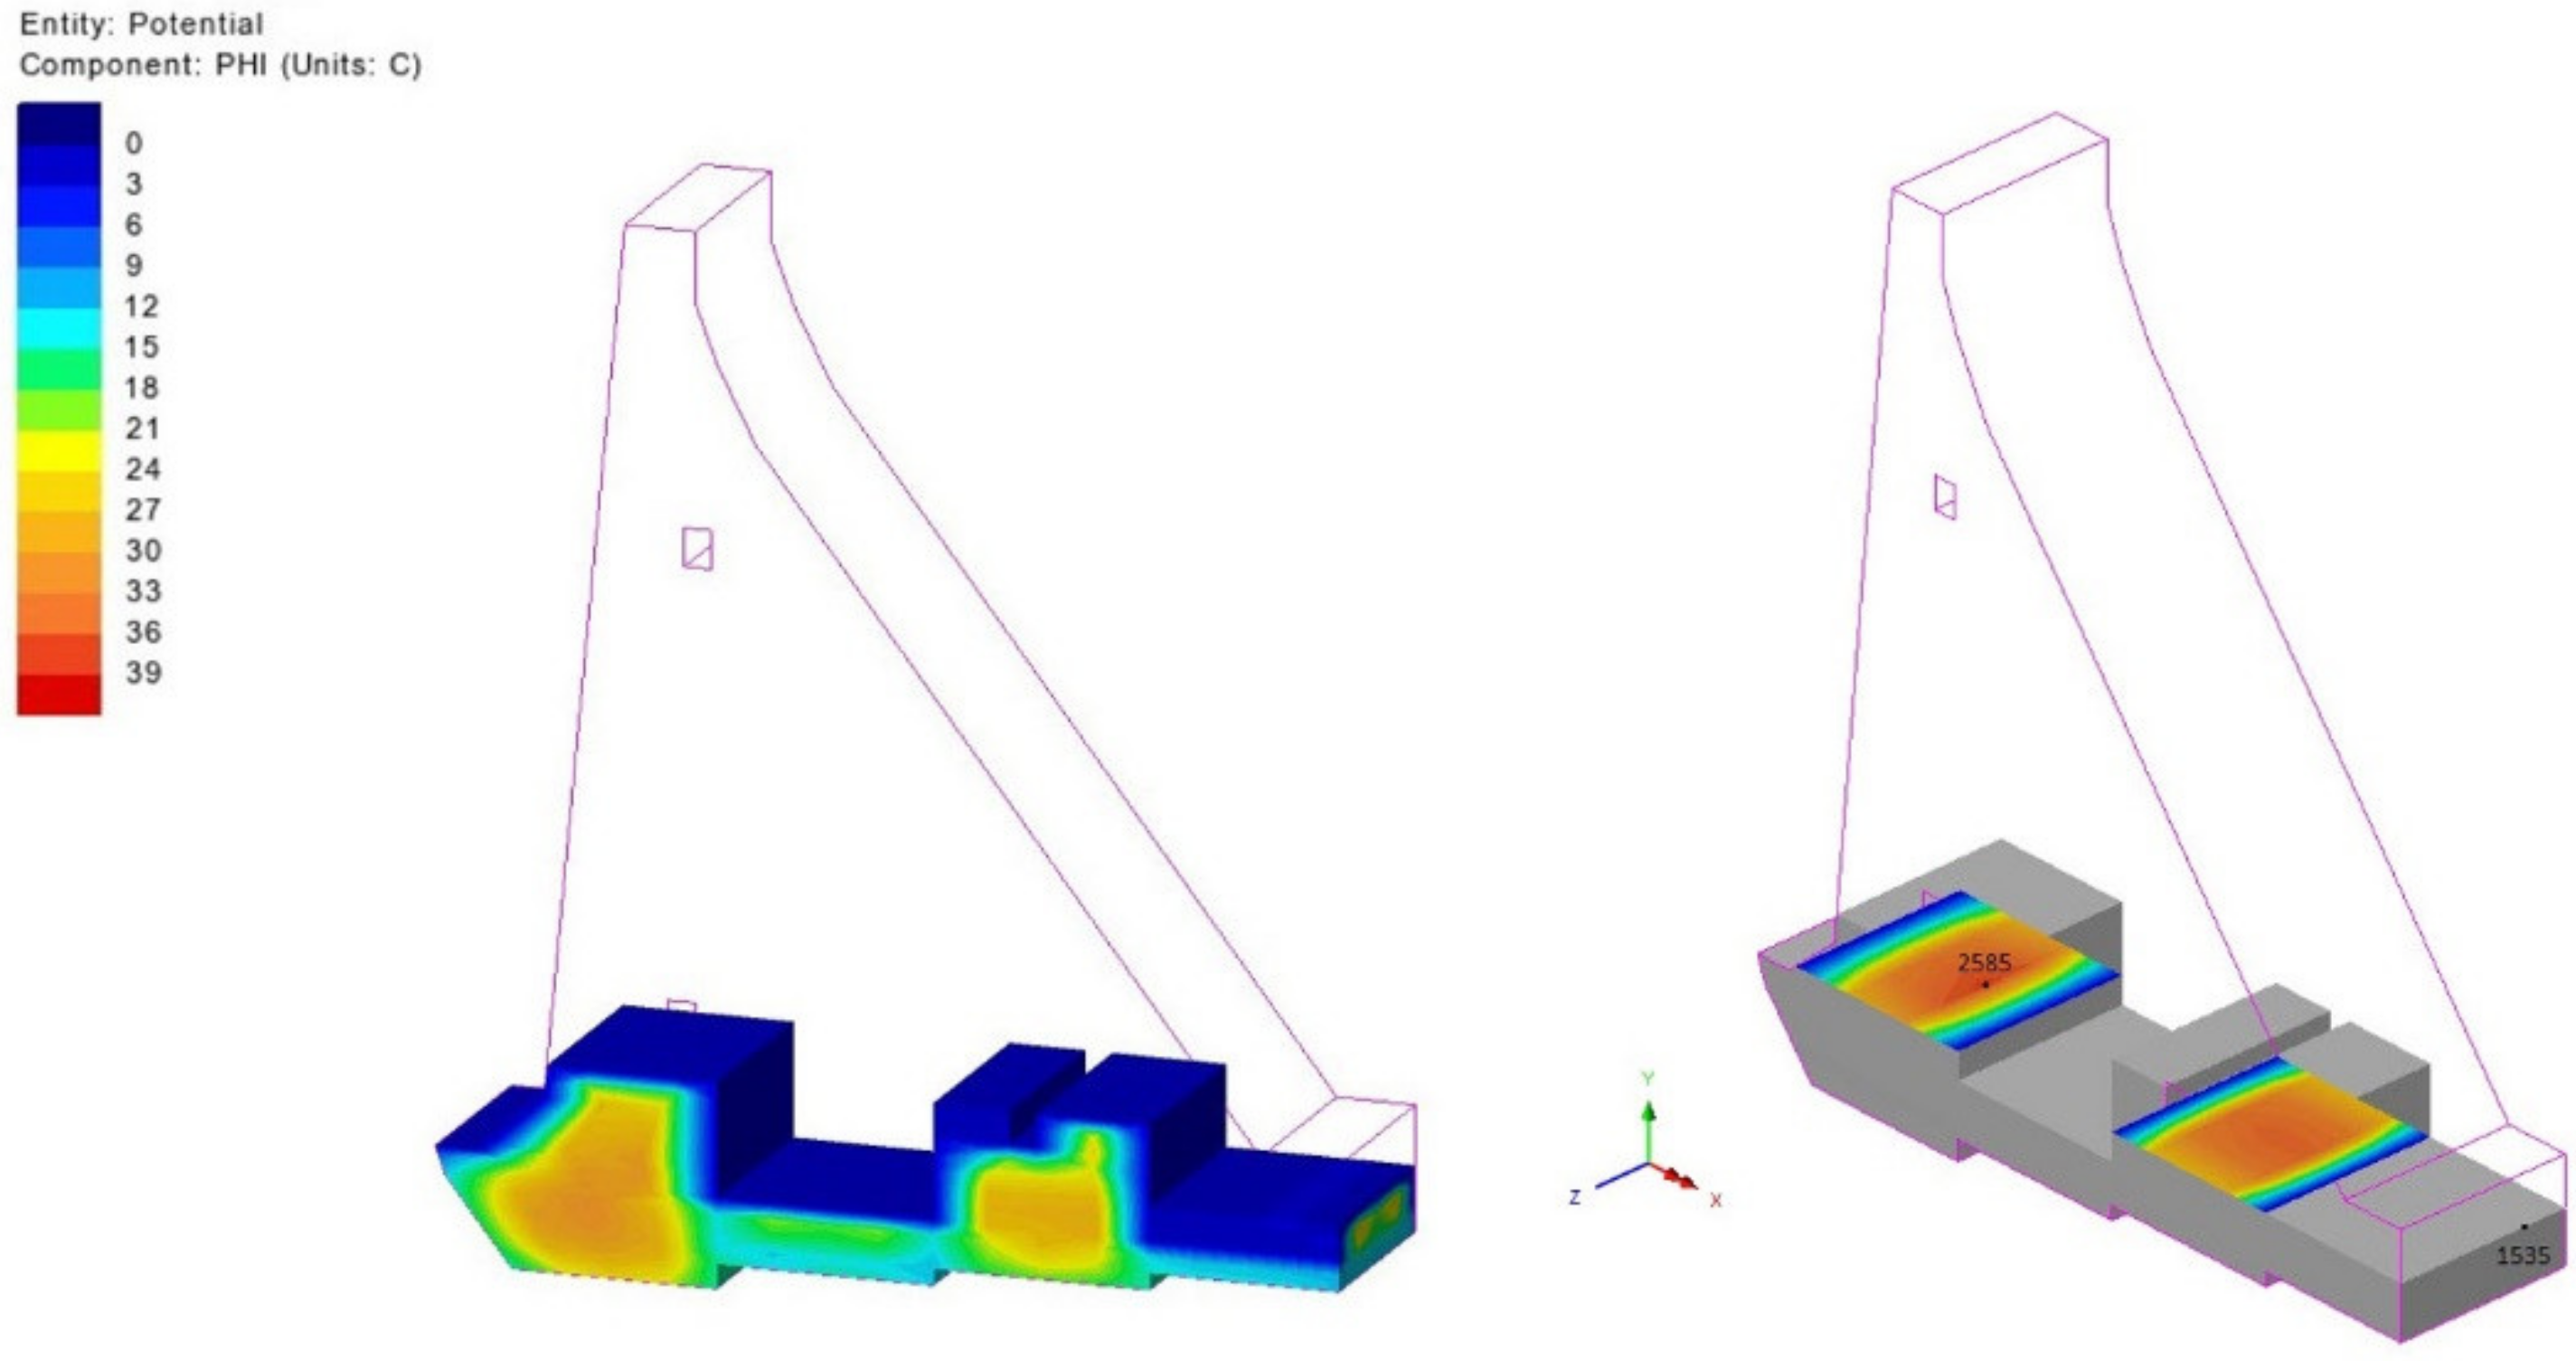
An increase in temperature resulting from the cement hydration process is pronounced in the internal parts of the structure during construction (Figure 14 and Figure 15), as well as upon the end of the construction process (Figure 16). In the aforementioned Figures, these parts are recognized as brightly colored with concrete temperatures in the interval between 37.7–41.4 °C.
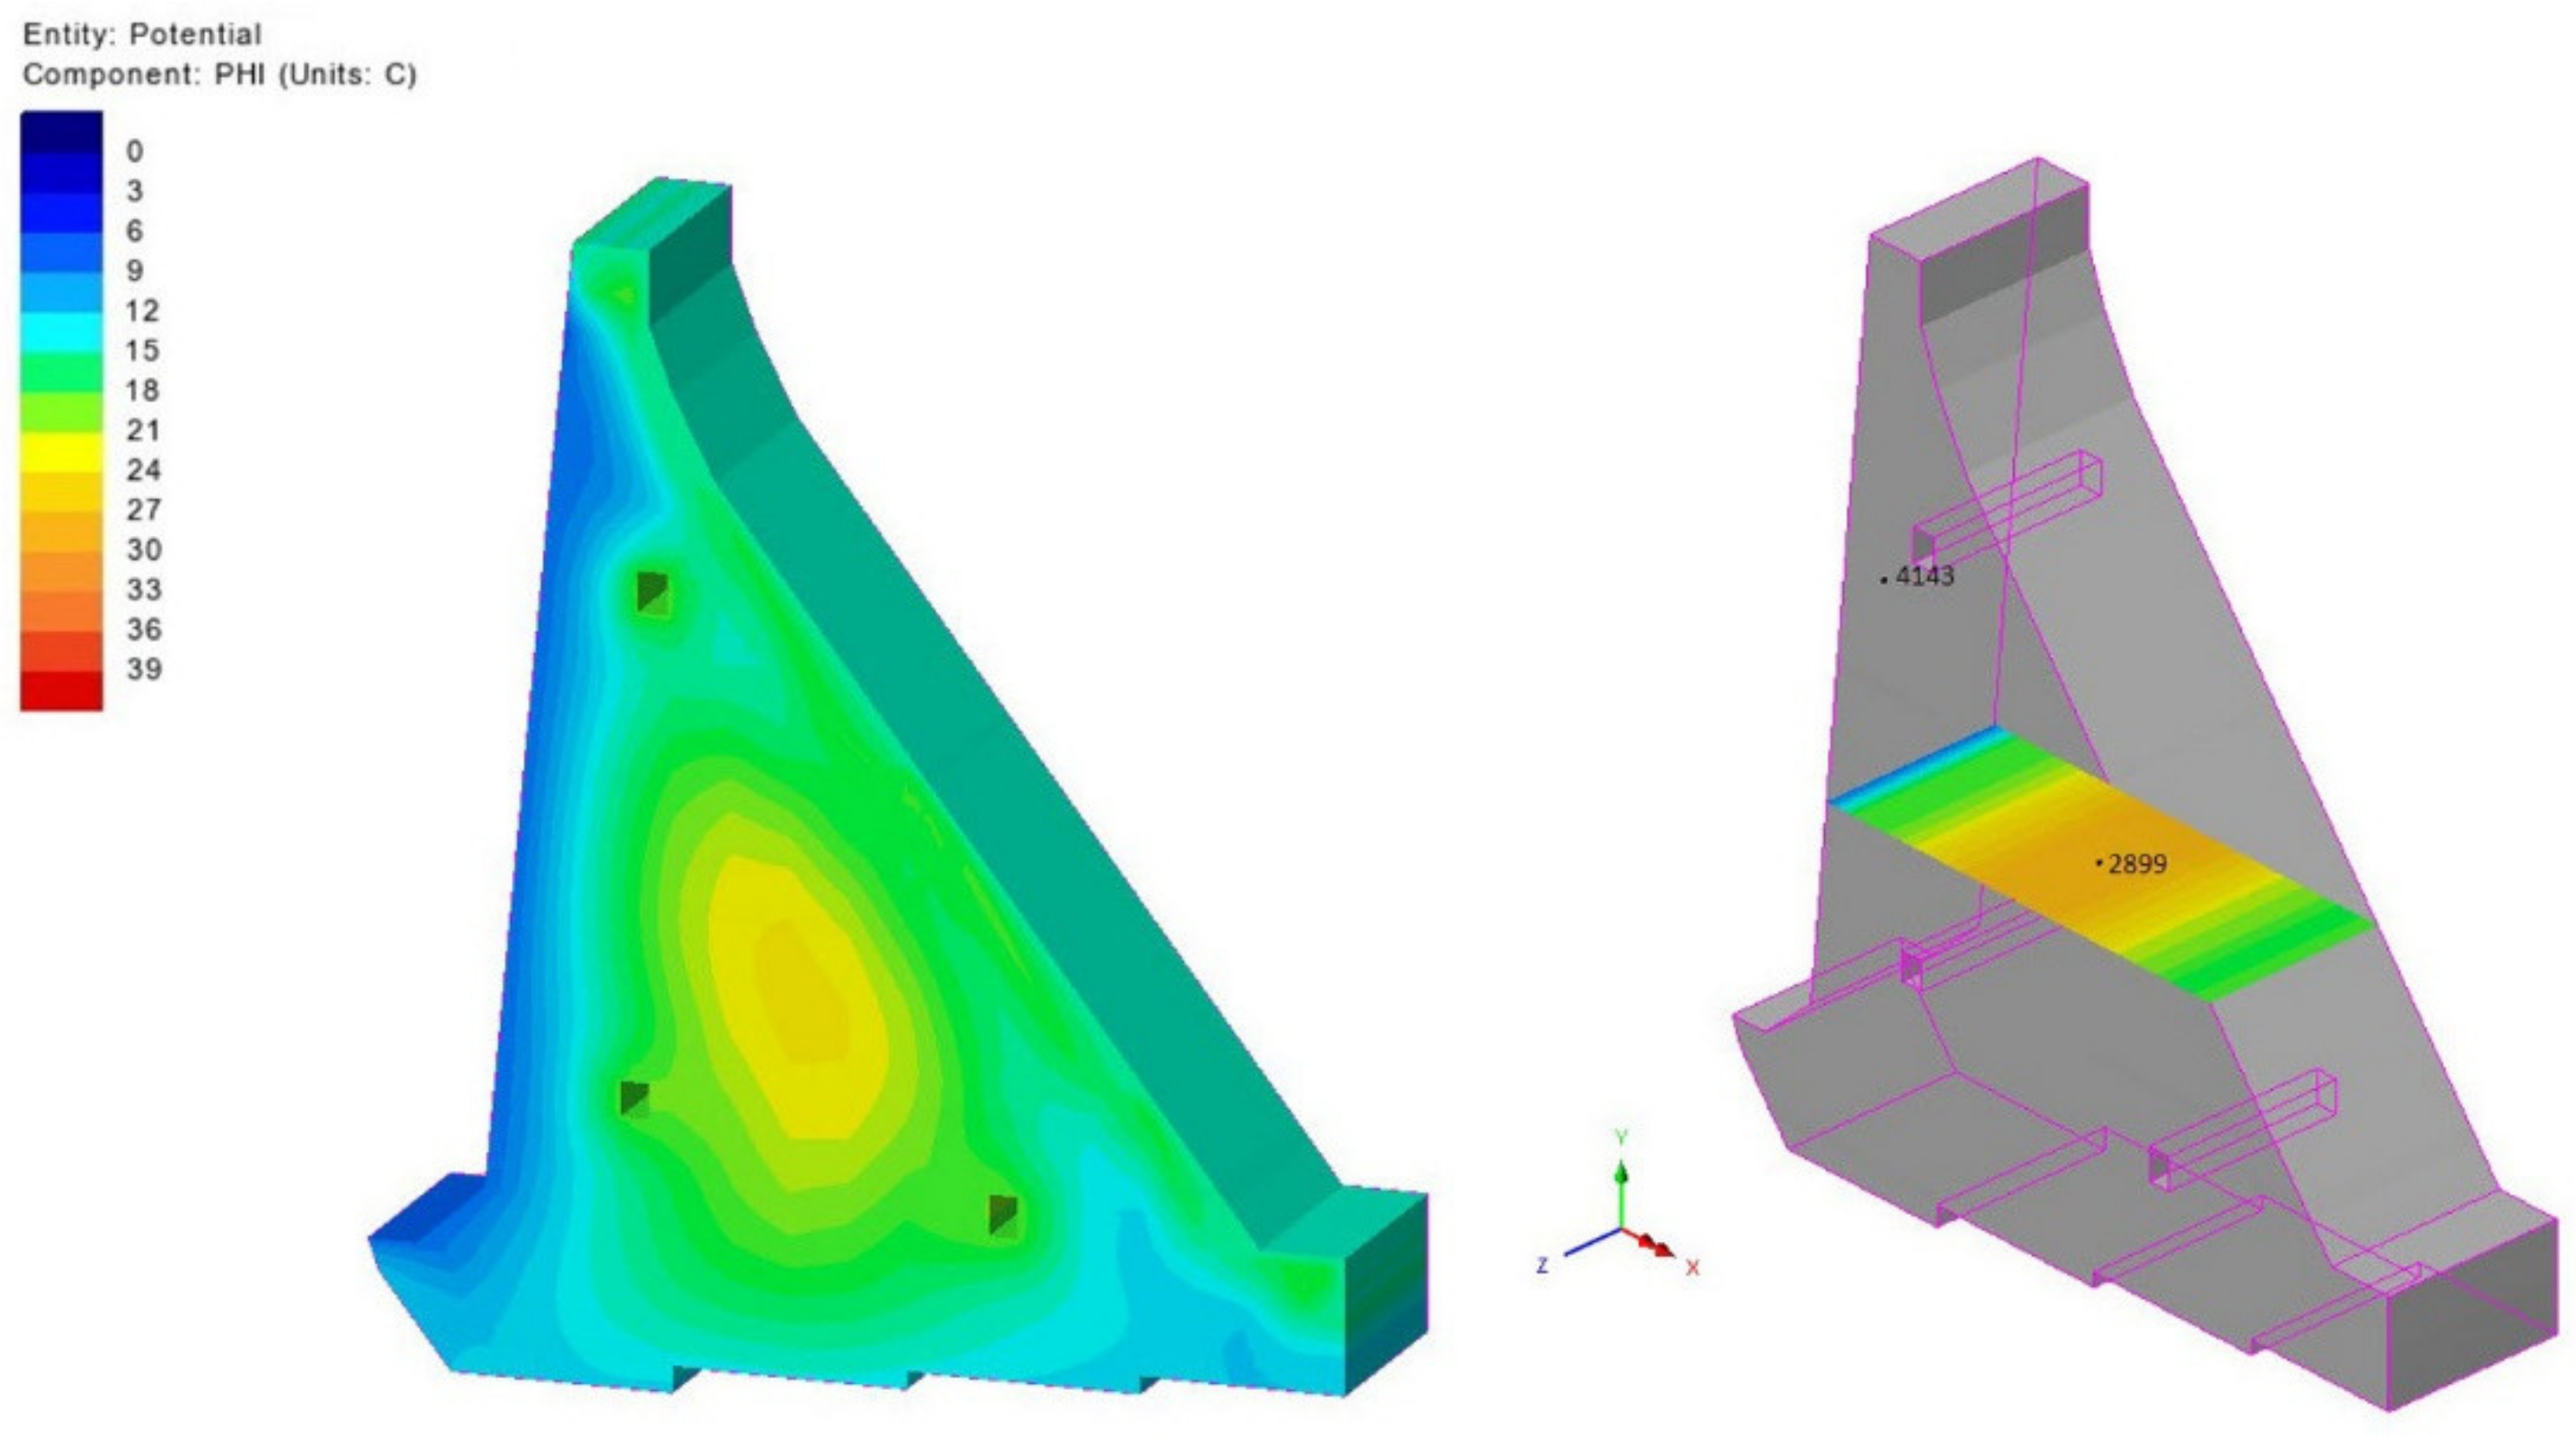
Immediately after the construction completion, the process of gradual cooling commences. In Figure 17 and Figure 18 this process is noticed as a reduction of the circumference of the orange–yellow zone, which is located in the central part of the monolith’s cross-section. Figure 18 also shows that the process of cooling does not finish even on the last analysis day, that is, 3.5 years after casting the last block. In Figure 17 and Figure 18 it can be seen that the reservoir water temperature during the filling and exploitation of the dam has an impact on the cooling process (blue-colored zones on the upstream side which are in the zones of contact with the reservoir). Moreover, Figure 16 shows that the cooling process is influenced by the galleries in the dam’s body, around which, in a given distinctive time section, zones of cold air impact are formed.
The impact of winter air temperatures on the surface zones of the monoliths is evident in the diagrams showing TF for day 84 (Figure 14) and day 512 (Figure 16). The impact of these temperatures is characterized by sudden cooling of the structure in the surface zone which leads to concrete shrinkage and the occurrence of extreme thermal tensile stresses (TTS).
Figure 15, which shows TF for day 283 (in the moment of the summer break in concreting which lasts for 135 days—from 20 June to 02 November of the second year), presents the impact of summer temperatures on the surfaces in contact with air, which, together with the heat released from the cement hydration process, leads to the increase in the maximum temperature in the monolith’s cross-section up to 41.0 °C. The effect of high ambient temperatures during the summer break is reflected on the display of TF on day 512, at the moment of the monolith’s construction completion (Figure 16), which shows noticeably elevated concrete temperatures in the middle of the cross-section (above 41.0 °C). High air temperatures in the second time interval cause an increase in the concrete temperatures which leads to an increase in the temperature gradient during the cold days. This process leads to concrete shrinkage resulting from cooling and the emergence of TTS which, when exceeded, results in the formation and development of cracks in concrete. It should be pointed out that the summer breaks in pouring concrete, as well as the appropriate concrete curing during the break (usage of covers, moisturizing the concrete), are of exceptional importance for preventing the excessive heating of the structure. The concrete curing process during the summer break is not in the scope of this paper.
5.3. Results of Stress Field Analysis
Results of SF analysis are shown in the chosen distinctive time sections in the figures that follow. Each of the figures shows the SF for two monolith lengths under consideration (20.0 m and 15.0 m). The results are shown in the mid-plane of the monolith, as the (SZ) stresses in this plane are the greatest.
It can be noticed from the obtained results that all blocks of the dam undergo similar stress fields during construction. Instantly upon concreting one of the blocks, heating and expansion occur, as a result of the released hydration heat, which, arising from limited deformation caused by the interaction with neighboring blocks, causes compressive stresses in the block and its narrow zone (freshly cast blocks in the upper parts of the monolith in Figure 19, Figure 20 and Figure 21). The heating of one block can be additionally facilitated by the extreme air temperatures over a longer period (as described in Figure 15). Subsequently, the concrete cooling process can be abrupt (resulting from a sudden change in the seasonal temperature) or gradual (as a result of the natural process by which the concrete temperature tends to be in equilibrium with the average annual air temperature), shrinkage occurs and, as a consequence of limited deformation due to restraints provided by the adjoining blocks, the compressive stresses transform into tensile stresses.
Observing the results of TF for the 84th and 512th day (Figure 14 and Figure 16), which are under the influence of winter air temperatures, it can be concluded that the maximum TTS (Figure 19 and Figure 21) is a consequence of a sudden cooling of the concrete in the surface region. Precisely, the process of sudden cooling is responsible for the occurrence of the maximum TTS in the entire analysis period (day 512, crest zone—Figure 21).
Extreme values of TTS also appear in the blocks between the vertical joints which progressed faster compared to concreting of the remaining parts of the structure (Figure 8 and Figure 20, Figure 21, Figure 22 and Figure 23, orange–yellow zones), which caused the heat released in the cement hydration process to become trapped inside the concrete as a result of the faster progress. TTS emerges when the heat is emitted, and the blocks start to cool.
Figure 24 and Figure 25 show the extreme values of for different monolith lengths as a function of the time period after the completion of construction, and the difference in these values during the same period, respectively. The oscillations of the stresses coincide with the annual ambient temperature changes, represented as in these Figures. Figure 26 shows the extreme value as a function of the ambient temperatures .
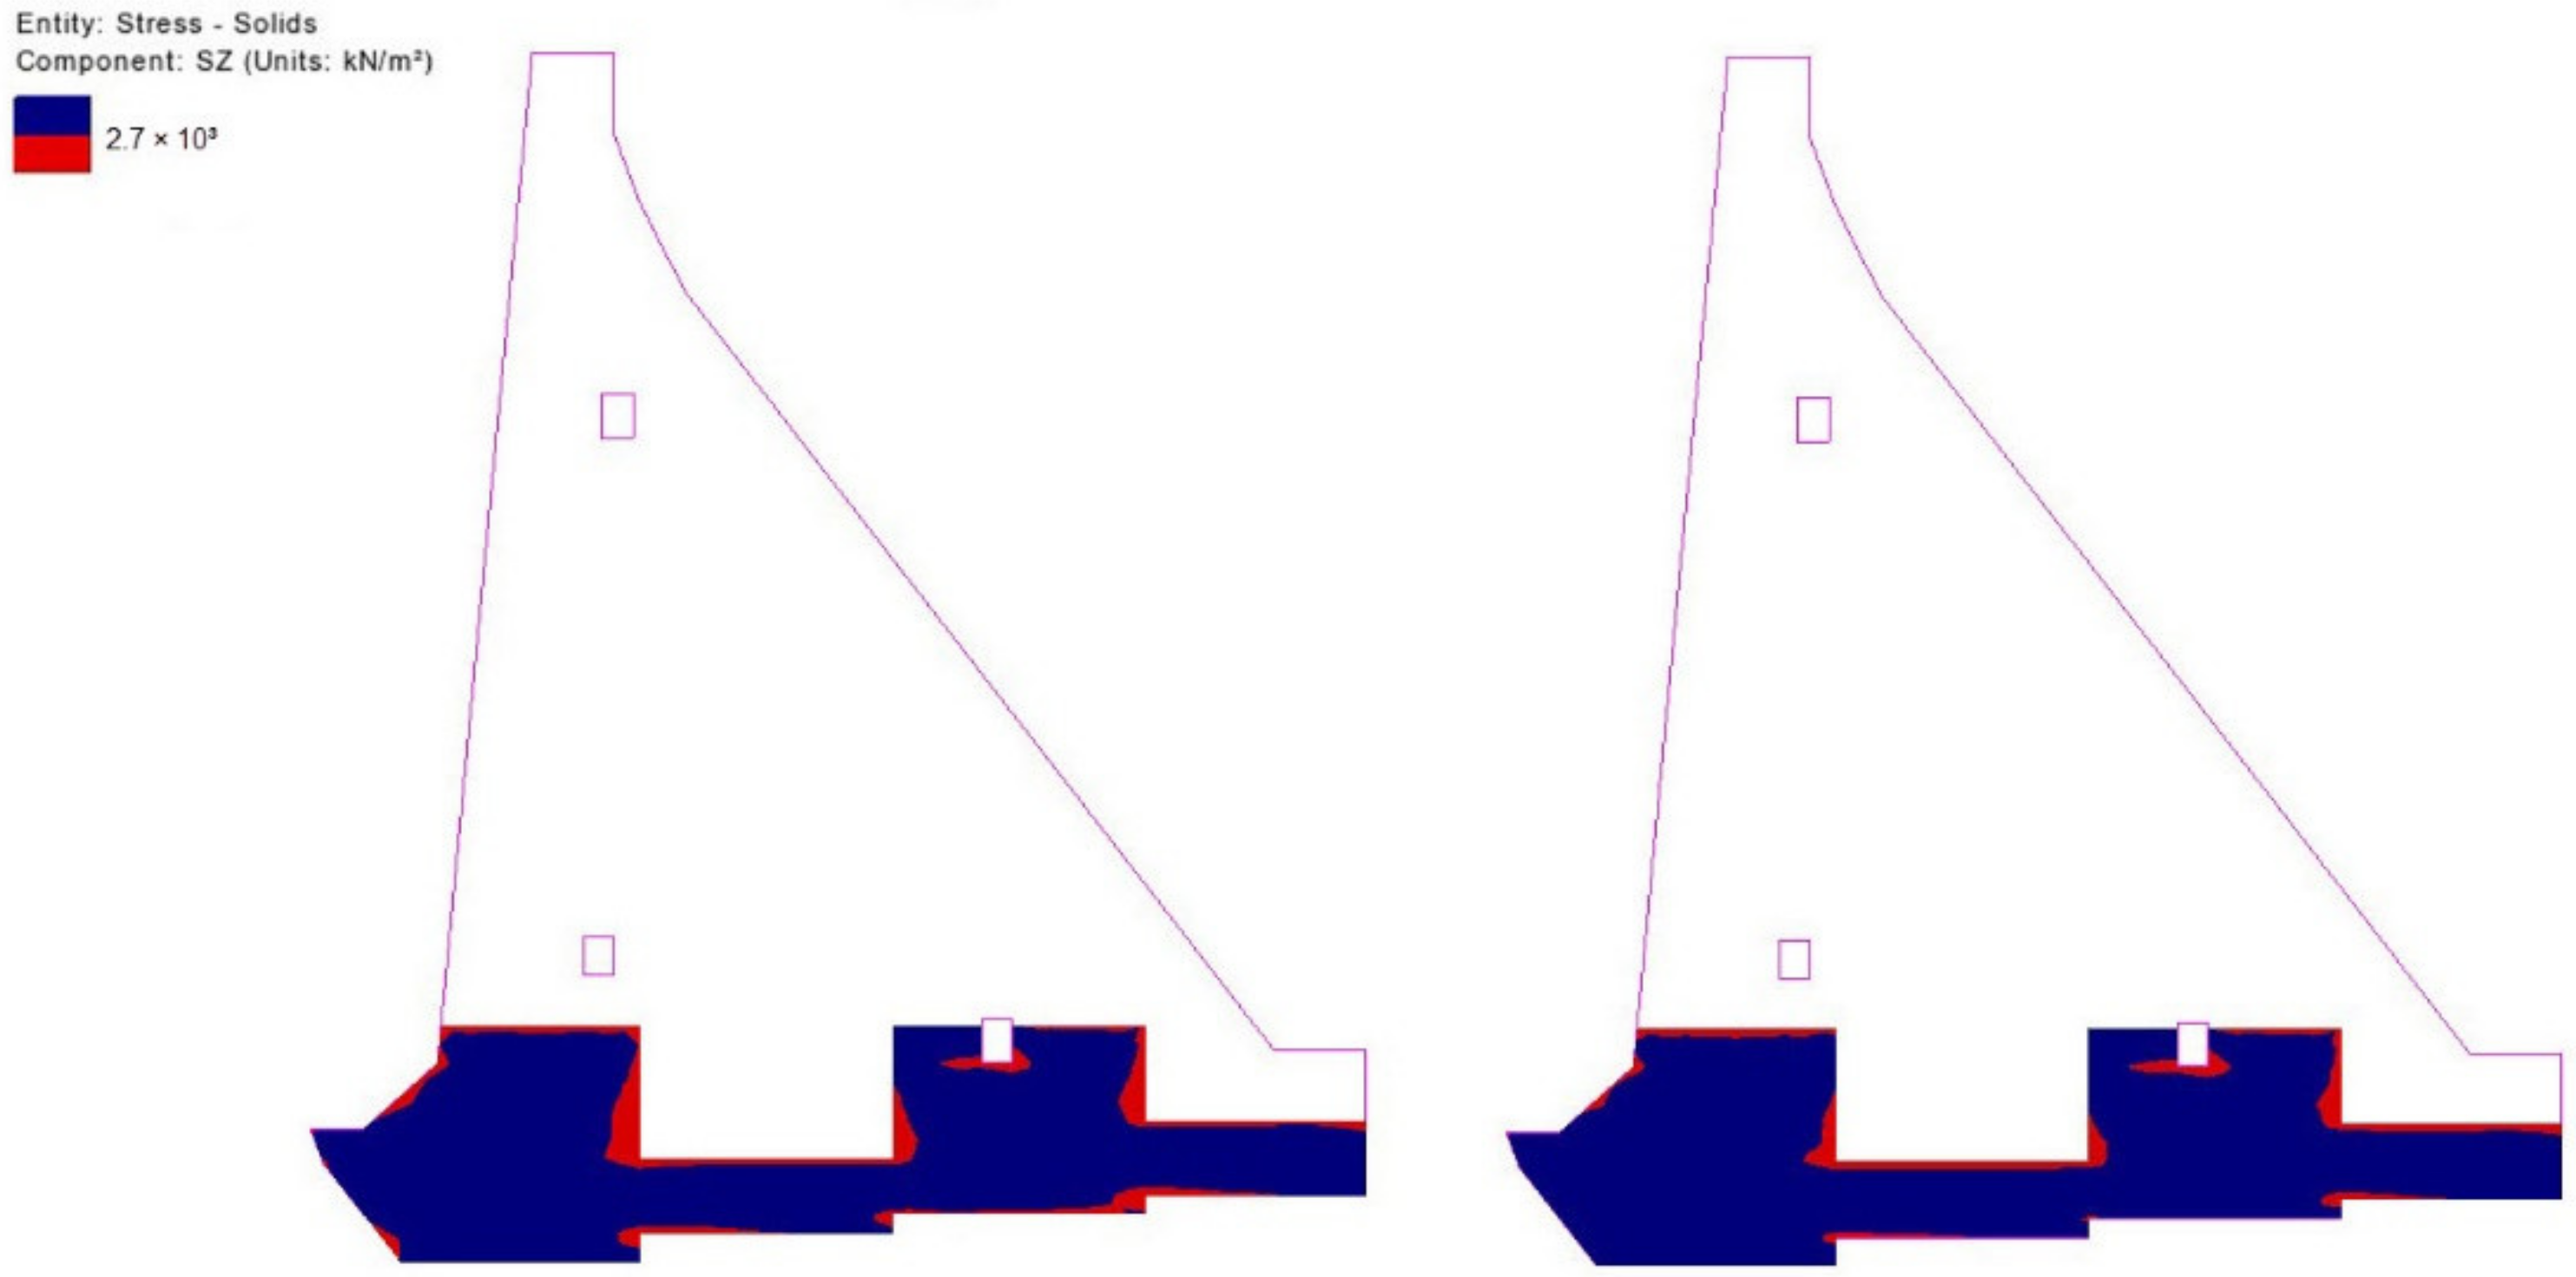
Figure 27, Figure 28, Figure 29, Figure 30 and Figure 31 show all the zones (marked red) in which the concrete tensile resistance is exceeded in the characteristic time sections for both of the monolith lengths. Figure 28, Figure 29, Figure 30 and Figure 31 confirm more clearly that the impact of the construction dynamics (faster progress of blocks between the vertical joints) contributed to the exceedance of the concrete tensile resistance in the aforementioned zones, while Figure 27 and Figure 29 clearly show the impact which a sudden cooling of the concrete in the surface regions exerts on the exceedance of the concrete tensile resistance.
The reservoir filling contributes to the cooling process of the entire cross-section of the dam (as described in Figure 17 and Figure 18); however, locally, in the zone of the interface of the upstream face of the structure with water of a constant temperature of 9.0 °C, the concrete tensile resistance is not exceeded.
Based on the obtained results shown in the distinctive time sections in Figure 19, Figure 20, Figure 21, Figure 22, Figure 23, Figure 24, Figure 25 and Figure 26, it can be concluded that by reducing the monolith length by 5.0 m (from 20.0 m to 15.0 m), the extreme value of TTS drops by 0.93 MPa (up to 16.0%) on average (0.70 MPa (up to 12.0%) in winter and 1.10 MPa (up to 20.0%) in summer). This decrease in TTS occurs as a result of the smaller release of heat during the hydration of cement in the 15.0 m long monolith compared to the 20.0 m long monolith. The reduction in monolith length contributes to a decrease in the number of zones in which the concrete tension resistance is exceeded (Figure 27, Figure 28, Figure 29, Figure 30 and Figure 31, red-colored zones).
6. Conclusions
The main contribution of the conducted research is the presentation of the methodology for optimizing the monolith length by monitoring thermal tensile stresses (TTS) with the aim to prevent crack formation inside monoliths of concrete gravity dams which are built using the block method. The presented methodology is demonstrated through the extensive numerical analysis of the 95.0 m high concrete gravity dam Platanovryssi (Greece).
The obtained results of temperature fields (TF) indicate that the maximum impact on the increase in temperature in the dam’s body originates from the hydration process in combination with the summer ambient temperatures during construction, which causes the temperature inside the structure to rise to up to 45.0 °C. The aforementioned demonstrates the significance of the control of the initial temperature of the fresh concrete mix, and concreting breaks in elevated temperature conditions. During winter temperatures, cooling of the structure occurs, especially in the surface zones. The process of cooling the entire cross-section of the structure is long and greatly influenced by the reservoir water temperature.
Upon concreting one block, the compressive stresses form in its narrow zone. This can be explained by the heating and expansion of the block resulting from the heat released from the hydration process with limited deformation caused by the coupling action between the adjacent blocks. In the cooling process of one of the blocks, the block starts shrinking, and, due to limited deformations, the compressive stresses transform into tensile stresses. The presented results of the stress field (SF) show that the extreme TTS value occurs as a consequence of a sudden cooling of concrete resulting from low temperatures in the surface zone immediately upon completion of the construction process. The extreme values of TTS also appear as a consequence of the cooling of the blocks in between the vertical joints inside the structure, which progressed faster than the rest of the structure in terms of concrete. Thereby, because of the faster rate of progress, the heat released in the cement hydration process is trapped inside the concrete. Because of the heat release and cooling of these blocks, TTS occurs. The results of SF show that by reducing the monolith length by 5.0 m (from 20.0 m to 15.0 m) the extreme value of TTS is reduced by 0.93 MPa on average (up to 16.0%), with an apparent reduction of the number of zones in which the concrete tensile resistance is exceeded. Decrease in the extreme TTS is 0.70 MPa (up to 12.0%) in winter and 1.10 MPa (up to 20.0%) in summer.
This research paper does not cover possible variations in the layout of blocks and/or dynamics of concreting, variation of a reference temperature, creep of concrete, usage of cooling systems such as cooling pipes, and curing of concrete during construction which can be the subject of further research for the advancement of the methodology presented herein.
Author Contributions
Numerical analysis and results presentation, U.M.; conceptualization, supervision, methodology, and writing, U.M., V.K., G.T. All authors have read and agreed to the published version of the manuscript.
Funding
This research received no external funding.
Institutional Review Board Statement
Not applicable.
Informed Consent Statement
Not applicable.
Data Availability Statement
Not applicable.
Conflicts of Interest
The authors declare no conflict of interest.
References
- Kuzmanović, V. Thermal-Stress Analysis of Roller Compacted Concrete Dams. Ph.D. Thesis, Faculty of Civil Engineering, University of Belgrade, Belgrade, Serbia, 2007. [Google Scholar]
- Blomdahl, J.; Malm, R.; Nordström, E.; Hassanzadeh, M. Minimiarmering i Vattenkraftens Betongkonstruktioner; Energiforsk: Stockholm, Sweden, 2016; pp. 48–50. [Google Scholar]
- Malm, R. Guideline for FE Analyses of Concrete Dams; Energiforsk: Stockholm, Sweden, 2016; pp. 100–102. [Google Scholar]
- Tanchev, L. Dams and Appurtenant Hydraulic Structures, 2nd ed.; Taylor & Francis Group: London, UK, 2014; pp. 551–563. [Google Scholar]
- Eurocode 2: EN 1992-1-1:2015; Design of Concrete Structures—General Rules and Rules for Buildings. British Standards Institution: London, UK, 2015.
- Eurocode 2: EN 1992-1-2:2004; Design of Concrete Structures—General Rules—Structural Fire Design. British Standards Institution: London, UK, 2004.
- Savić, L. Uvod u Hidrotehničke Građevine, 2nd ed.; Građevinski Fakultet: Belgrade, Serbia, 2009; pp. 100–103. [Google Scholar]
- Cotoi, T. Dam Engineering. Available online: http://www.scribd.com/doc/280436707/Dam-Engineering-GRV-BUTT (accessed on 5 May 2019).
- Léger, P.; Venturelli, J.; Bhattacharjee, S.S. Seasonal temperature and stress distributions in concrete gravity dams. Part 1: Modeling. Can. J. Civ. Eng. 1993, 20, 999–1017. [Google Scholar] [CrossRef]
- Léger, P.; Venturelli, J.; Bhattacharjee, S.S. Seasonal temperature and stress distributions in concrete gravity dams. Part 2: Behavior. Can. J. Civ. Eng. 1993, 20, 1018–1029. [Google Scholar] [CrossRef]
- Saetta, A.; Scotta, R.; Vitaliani, R. Stress analysis of concrete structures subjected to variable thermal loads. J. Struct. Eng. 1995, 121, 446–457. [Google Scholar] [CrossRef]
- Cervera, M.; Oliver, J.; Prato, T. Simulation of construction of RCC dams-I: Temperature and aging. J. Struct. Eng. 2000, 126, 1053–1061. [Google Scholar] [CrossRef]
- Cervera, M.; Oliver, J.; Prato, T. Simulation of construction of RCC dams-II: Stress and damage. J. Struct. Eng. 2000, 126, 1062–1069. [Google Scholar] [CrossRef]
- Ponce-Farfán, C.; Santillán, D.; Toledo, M.Á. Thermal simulation of rolled concrete dams: Influence of the hydration model and the environmental actions on the thermal field. Water 2020, 12, 858. [Google Scholar] [CrossRef]
- Habib, A.; Houri, A.A.; Habib, M.; Elzokra, A.; Yildirim, U. Structural Performance and Finite Element Modeling of Roller Compacted Concrete Dams: A Review. Lat. Am. J. Solids Struct. 2021, 18, 1–18. [Google Scholar] [CrossRef]
- James, R.J.; Dollar, D.A. Thermal Engineering for the Construction of Large Concrete Arch Dams. In Proceedings of the 6th ASME-JSME Thermal Engineering Joint Conference, Kohala Coast, HI, USA, 16–20 March 2003. [Google Scholar]
- Malkawi, A.; Mutasher, S.; Qiu, T. Thermal-structural modeling and temperature control of roller compacted concrete gravity dam. Perform. Constr. Facil. 2003, 17, 177–187. [Google Scholar] [CrossRef]
- Sheibany, F.; Ghaemian, M. Effects of environmental action on thermal stress analysis of Karaj concrete arch dam. J. Eng. Mech. 2006, 132, 532–544. [Google Scholar] [CrossRef]
- Castilho, E.; Schclar, N.; Tiago, C.; Farinha, M.L.B. FEA model for the simulation of the hydration process and temperature evolution during the concreting of an arch dam. Eng. Struct. 2018, 174, 165–177. [Google Scholar] [CrossRef]
- Salazar, F.; Vicente, D.J.; Irazábal, J.; De-Pouplana, I.; San Mauro, J. A Review on Thermo-mechanical Modelling of Arch Dams During Construction and Operation: Effect of the Reference Temperature on the Stress Field. Arch. Comput. Methods Eng. 2020, 27, 1681–1707. [Google Scholar] [CrossRef]
- Kuzmanović, V.; Savić, L.; Mladenović, N. Computation of Thermal-Stresses and Contraction Joint Distance of RCC Dams. J. Therm. Stresses 2013, 36, 112–134. [Google Scholar] [CrossRef]
- Kuzmanović, V.; Savić, L.; Mladenović, N. Thermal-stress behaviour of RCC gravity dams. FME Trans. 2015, 43, 30–34. [Google Scholar] [CrossRef]
- Sayed, A.; Ezzeldin, Y.; Amr, A.A.; Rana, A.E. Concrete dams: Thermal-stress and construction stage analysis. Dams Reserv. 2018, 28, 12–30. [Google Scholar] [CrossRef]
- Ayotte, E.; Massicotte, B.; Houde, J.; Gocevski, V. Modeling the thermal stresses at early ages in a concrete monolith. ACI Mater. J. 1997, 94, 577–587. [Google Scholar]
- Khorasani, M.; Ghasemi, A.; Leary, M.; Sharabian, E.; Cordova, L.; Gibson, I.; Downing, D.; Bateman, S.; Brandt, M.; Rolfe, B. The effect of absorption ratio on meltpool features in laser-based powder bed fusion of IN718. Opt. Laser Technol. 2022, 153, 108263. [Google Scholar] [CrossRef]
- Khan, H.M.; Waqar, S.; Koç, E. Evolution of temperature and residual stress behavior in selective laser melting of 316L stainless steel across a cooling channel. Rapid Prototyp. J. 2022, 28, 1272–1283. [Google Scholar] [CrossRef]
- Sezer, H.; Tang, J.; Ahsan, A.N.; Kaul, S. Modeling residual thermal stresses in layer-by-layer formation of direct metal laser sintering process for different scanning patterns for 316L stainless steel. Rapid Prototyp. J. 2022. ahead-of-print. [Google Scholar] [CrossRef]
- Shaikh, M.Q.; Berfield, T.A.; Atre, S.V. Residual stresses in additively manufactured parts: Predictive simulation and experimental verification. Rapid Prototyp. J. 2022. ahead-of-print. [Google Scholar] [CrossRef]
- Jansen, R.B. Dams and Public Safety; US Department of the Interior, Bureau of Reclamation: Denver, CO, USA, 1983; pp. 89–98. [Google Scholar]
- ICOLD (International Commission on Large Dams). Dam Safety Guidelines; ICOLD Bulletin 59; ICOLD: Paris, France, 1987. [Google Scholar]
- ICOLD (International Commission on Large Dams). Basic Elements in a Dam Safety Process; ICOLD Bulletin 138; ICOLD: Paris, France, 2009. [Google Scholar]
- Kim, S.G.; Wang, K. Effect of heat generation from cement hydration on mass concrete placement. Masters Abstr. Int. 2010, 49, 3. [Google Scholar]
- Bofang, Z. On pipe cooling of concrete dams. J. Hydraul. Eng. 2010, 5, 505–513. [Google Scholar]
- Bofang, Z. Compound Methods for Computing the Effect of Pipe Cooling in Concrete Dams. Water Resour. Hydropower Eng. 2013, 34, 47–50. [Google Scholar]
- ICOLD (International Commission on Large Dams). Dam Monitoring—General Considerations; ICOLD Bulletin 60; ICOLD: Paris, France, 1998. [Google Scholar]
- Swiss Committee on Dams. Methods of analysis for the prediction and the verification of dam behaviour. In Proceedings of the 21st Congress of the International Commission on Large Dams, Montreal, Switzerland, 16–20 June 2003. [Google Scholar]
- Bofang, Z. Introduction. In Thermal Stresses and Temperature Control of Mass Concrete; Butterworth-Heinemann: Oxford, UK, 2014; pp. 1–10. [Google Scholar] [CrossRef]
- Bofang, Z. Precooling and Surface Cooling of Mass Concrete. In Thermal Stresses and Temperature Control of Mass Concrete; Butterworth-Heinemann: Oxford, UK, 2014; pp. 401–408. [Google Scholar] [CrossRef]
- USACE. Gravity Dam Design; US Army Corps of Engineers: Washington, DC, USA, 1995; p. 2-1. [Google Scholar]
- Petrović, P. Hidrotehničke Konstrukcije, drugi deo; Građevinski Fakultet: Belgrade, Srbija, 2002. [Google Scholar]
- Schindler, A.K.; Folliard, K.J. Influence of supplementary cementing materials on the heat of hydration of concrete. In Proceedings of the Advances in Cement and Concrete IX Conference, Copper Mountain Conference Resort in Colorado, Copper Mountain, CO, USA, 10–14 August 2003. [Google Scholar]
- Malcolm Dunstan & Associates. Available online: https://rccdams.co.uk/dams/platanovryssi (accessed on 1 March 2022).
- LUSAS. Available online: https://www.lusas.com (accessed on 1 March 2022).
- Platanovryssi Hydroelectric Project. Measurement Results; Public Power Corporation: Athens, Greece, 2004. [Google Scholar]
- Bofang, Z. Prediction of Water Temperature in Deep Reservoirs. Dam Eng. 1997, 8, 13–25. [Google Scholar]
Figure 1.
Waterstops, blocks, and joints of a concrete gravity dam: (A) waterstops between adjacent monoliths; (B) combination of long blocks and staggered joints; (C) combination of long blocks and vertical joints.
Figure 1.
Waterstops, blocks, and joints of a concrete gravity dam: (A) waterstops between adjacent monoliths; (B) combination of long blocks and staggered joints; (C) combination of long blocks and vertical joints.

Figure 2.
Heat transfer processes represented in this paper.

Figure 3.
(Left): Characteristic cross-section; (right): 3D model of the monolith with 78 blocks and the surrounding rock mass for thermal stress analysis.
Figure 3.
(Left): Characteristic cross-section; (right): 3D model of the monolith with 78 blocks and the surrounding rock mass for thermal stress analysis.

Figure 4.
Concrete blocks in the gravity dam (numbers coincide with the sequence of pouring).

Figure 5.
The sequence of pouring the blocks of the odd (light grey) and even (dark grey) monoliths.
Figure 5.
The sequence of pouring the blocks of the odd (light grey) and even (dark grey) monoliths.

Figure 6.
The boundary condition for conducting stress analysis.

Figure 7.
Filling and water level in the reservoir in the exploitation phase.

Figure 8.
Distinctive control nodes of the model in the mid-plane of the monolith.

Figure 9.
Concrete temperature (°C) in node 2787 (upstream face).

Figure 10.
Concrete temperature (°C) in node 2853 (downstream face).

Figure 11.
Concrete temperature (°C) in node 3016 (middle of the monolith).

Figure 12.
Concrete temperature (°C) in node 3184 (zone of the dam’s crest).

Figure 13.
Presentation of the temperature field in the rock mass.

Figure 14.
Temperature field for day 84 (10th of January of the second year) with horizontal cross-section at 146.50 masl; maximum: node 2585, minimum: node 1535.
Figure 14.
Temperature field for day 84 (10th of January of the second year) with horizontal cross-section at 146.50 masl; maximum: node 2585, minimum: node 1535.

Figure 15.
Temperature field for day 283 (27th of July of the second year) with horizontal cross-section at 169.0 masl; maximum: node 2872, minimum: node 1334.
Figure 15.
Temperature field for day 283 (27th of July of the second year) with horizontal cross-section at 169.0 masl; maximum: node 2872, minimum: node 1334.

Figure 16.
Temperature field for day 512 (13th of March of the third year) with horizontal cross-section at 227.0 masl; maximum: node 2126, minimum: node 1646.
Figure 16.
Temperature field for day 512 (13th of March of the third year) with horizontal cross-section at 227.0 masl; maximum: node 2126, minimum: node 1646.

Figure 17.
Temperature field for day 1080 (2nd of October of the fourth year) with horizontal cross-section at 172.0 masl; maximum: node 2899, minimum: node 720.
Figure 17.
Temperature field for day 1080 (2nd of October of the fourth year) with horizontal cross-section at 172.0 masl; maximum: node 2899, minimum: node 720.

Figure 18.
Temperature field for day 1804 (25th of September of the sixth year) with horizontal cross-section at 170.50 masl; maximum: node 2899, minimum: node 4143.
Figure 18.
Temperature field for day 1804 (25th of September of the sixth year) with horizontal cross-section at 170.50 masl; maximum: node 2899, minimum: node 4143.

Figure 19.
Stresses in the mid-plane of the monolith 20 m long (left) and 15 m long (right) for the 84th day (10th of January of the second year); extremums: nodes 2505 and 21,575.
Figure 19.
Stresses in the mid-plane of the monolith 20 m long (left) and 15 m long (right) for the 84th day (10th of January of the second year); extremums: nodes 2505 and 21,575.

Figure 20.
Stresses in the mid-plane of the monolith 20 m long (left) and 15 m long (right) for the 283rd day (27th of July of the second year); extremums: nodes 16,058 and 15,946.
Figure 20.
Stresses in the mid-plane of the monolith 20 m long (left) and 15 m long (right) for the 283rd day (27th of July of the second year); extremums: nodes 16,058 and 15,946.

Figure 21.
Stresses in the mid-plane of the monolith 20 m long (left) and 15 m long (right) for the 512th day (13th of March of the third year); extremums: nodes 302,084 and 28,182.
Figure 21.
Stresses in the mid-plane of the monolith 20 m long (left) and 15 m long (right) for the 512th day (13th of March of the third year); extremums: nodes 302,084 and 28,182.

Figure 22.
Stresses in the mid-plane of the monolith 20 m long (left) and 15 m long (right) for the 1080th day (2nd of October of the fourth year); extremums: nodes 301,351 and 27,434.
Figure 22.
Stresses in the mid-plane of the monolith 20 m long (left) and 15 m long (right) for the 1080th day (2nd of October of the fourth year); extremums: nodes 301,351 and 27,434.

Figure 23.
Stresses in the mid-plane of the monolith 20 m long (left) and 15 m long (right) for the 1804th day (25th of September of the sixth year); extremums: nodes 301,351 and 27,434.
Figure 23.
Stresses in the mid-plane of the monolith 20 m long (left) and 15 m long (right) for the 1804th day (25th of September of the sixth year); extremums: nodes 301,351 and 27,434.

Figure 24.
Extreme values of [MPa] as a function of the time period after the completion of construction (blue—monolith length 20.0 m; orange—monolith length 15.0 m; yellow—ambient temperature ).
Figure 24.
Extreme values of [MPa] as a function of the time period after the completion of construction (blue—monolith length 20.0 m; orange—monolith length 15.0 m; yellow—ambient temperature ).

Figure 25.
The difference between extreme values of [MPa] between two monolith lengths as a function of the time period after the completion of construction (grey) and ambient temperature (yellow).
Figure 25.
The difference between extreme values of [MPa] between two monolith lengths as a function of the time period after the completion of construction (grey) and ambient temperature (yellow).

Figure 26.
Extreme values of [MPa] as a function of ambient temperatures [°C] (blue—monolith length 20.0 m; orange—monolith length 15.0 m).
Figure 26.
Extreme values of [MPa] as a function of ambient temperatures [°C] (blue—monolith length 20.0 m; orange—monolith length 15.0 m).

Figure 27.
Zones in which the concrete tensile resistance is exceeded (red) in the mid-plane of the monolith 20 m long (left) and 15 m (right) for the 84th day from the beginning of construction (10th of January of the second year).
Figure 27.
Zones in which the concrete tensile resistance is exceeded (red) in the mid-plane of the monolith 20 m long (left) and 15 m (right) for the 84th day from the beginning of construction (10th of January of the second year).

Figure 28.
Zones in which the concrete tensile resistance is exceeded (red) in the mid-plane of the monolith 20 m long (left) and 15 m long (right) for the 283rd day from the beginning of construction (27th of July of the second year).
Figure 28.
Zones in which the concrete tensile resistance is exceeded (red) in the mid-plane of the monolith 20 m long (left) and 15 m long (right) for the 283rd day from the beginning of construction (27th of July of the second year).

Figure 29.
Zones in which the concrete tensile resistance is exceeded (red) in the mid-plane of the monolith 20 m long (left) and 15 m long (right) for the 512th day from the beginning of construction (13th of March of the third year).
Figure 29.
Zones in which the concrete tensile resistance is exceeded (red) in the mid-plane of the monolith 20 m long (left) and 15 m long (right) for the 512th day from the beginning of construction (13th of March of the third year).

Figure 30.
Zones in which the concrete tensile resistance is exceeded (red) in the mid-plane of the monolith 20 m long (left) and 15 m long (right) for the 1080th day from the beginning of construction (2nd of October of the fourth year).
Figure 30.
Zones in which the concrete tensile resistance is exceeded (red) in the mid-plane of the monolith 20 m long (left) and 15 m long (right) for the 1080th day from the beginning of construction (2nd of October of the fourth year).

Figure 31.
Zones in which the concrete tensile resistance is exceeded (red) in the mid-plane of the monolith 20 m long (left) and 15 m long (right) for the 1804th day from the beginning of construction (25th of September of the sixth year).
Figure 31.
Zones in which the concrete tensile resistance is exceeded (red) in the mid-plane of the monolith 20 m long (left) and 15 m long (right) for the 1804th day from the beginning of construction (25th of September of the sixth year).


Table 1.
Measured ambient temperatures [°C].
| Date/Time | 2 | 4 | 6 | 8 | 10 | 12 | 14 | 16 | 18 | 20 | 22 | 24 |
|---|---|---|---|---|---|---|---|---|---|---|---|---|
| X 8-23 | 10.2 | 11.5 | 12.7 | 13.9 | 15.5 | 18.0 | 20.5 | 19.0 | 15.4 | 12.4 | 10.7 | 9.0 |
| X-XI 23-8 | 4.2 | 5.4 | 6.7 | 7.9 | 9.1 | 9.5 | 10.0 | 9.4 | 7.5 | 5.4 | 4.2 | 3.0 |
| XI 8-23 | 4.6 | 5.2 | 5.8 | 6.5 | 7.4 | 9.0 | 10.6 | 9.6 | 7.9 | 6.4 | 5.2 | 4.0 |
| XI-XII 23-8 | 2.2 | 2.4 | 2.6 | 2.8 | 3.3 | 4.5 | 5.8 | 5.4 | 4.5 | 3.7 | 2.8 | 2.0 |
| XII 8-23 | 0.0 | 0.0 | 0.0 | 0.0 | 0.4 | 2.5 | 4.5 | 3.6 | 2.5 | 1.8 | 1.0 | 0.0 |
| XII-I 23-8 | 6.2 | 6.4 | 6.6 | 6.8 | 7.1 | 7.5 | 7.9 | 7.3 | 7.0 | 6.8 | 6.4 | 6.0 |
| I 8-23 | −1.8 | −1.6 | −1.4 | −1.2 | −0.5 | 1.5 | 3.6 | 3.3 | 2.7 | −0.4 | −1.2 | −2.0 |
| I-II 23-8 | 1.2 | 1.4 | 1.6 | 1.8 | 2.2 | 3.0 | 3.8 | 3.3 | 2.5 | 1.8 | 1.5 | 1.0 |
| II 8-23 | 2.0 | 2.0 | 2.0 | 2.0 | 2.4 | 4.0 | 5.6 | 5.4 | 4.5 | 3.6 | 2.9 | 2.0 |
| II-III 23-8 | 0.2 | 0.4 | 0.6 | 0.8 | 1.4 | 3.4 | 5.6 | 5.4 | 4.5 | 3.3 | 1.6 | 0.0 |
| III 8-18 | 1.2 | 1.4 | 1.6 | 1.8 | 2.3 | 3.5 | 4.8 | 3.7 | 2.5 | 2.0 | 1.6 | 1.0 |
| III 18-31 | 1.0 | 1.0 | 1.0 | 1.0 | 1.2 | 2.5 | 3.7 | 4.0 | 4.0 | 3.5 | 2.2 | 1.0 |
| IV 1-14 | 4.6 | 4.7 | 4.8 | 4.9 | 5.4 | 7.5 | 9.6 | 10.0 | 9.0 | 7.4 | 6.0 | 4.5 |
| IV 15-28 | 4.6 | 4.2 | 3.7 | 3.3 | 3.9 | 8.5 | 13.1 | 14.0 | 13.5 | 11.7 | 8.3 | 5.0 |
| IV-V 29-11 | 15.2 | 16.0 | 16.7 | 17.4 | 18.4 | 20.5 | 22.6 | 23.0 | 21.5 | 19.1 | 16.8 | 14.5 |
| V 12-26 | 13.0 | 14.1 | 15.1 | 16.2 | 17.7 | 21.0 | 24.3 | 24.3 | 23.0 | 20.3 | 16.2 | 12.0 |
| V-VI 27-9 | 15.2 | 14.9 | 14.6 | 14.2 | 14.9 | 19.5 | 24.1 | 25.0 | 24.0 | 21.7 | 18.6 | 15.5 |
| VI 10-24 | 17.0 | 17.0 | 17.0 | 17.0 | 17.9 | 22.5 | 27.1 | 28.0 | 26.5 | 23.7 | 20.3 | 17.0 |
| VI-VII 25-7 | 21.2 | 20.9 | 20.6 | 20.2 | 21.0 | 26.0 | 31.0 | 31.3 | 29.5 | 26.9 | 24.2 | 21.5 |
| VII 8-22 | 24.0 | 22.9 | 21.9 | 20.8 | 20.9 | 25.5 | 30.1 | 30.1 | 28.5 | 26.7 | 25.8 | 25.0 |
| VII-VIII 23-5 | 20.7 | 19.5 | 20.0 | 21.7 | 23.8 | 28.0 | 32.2 | 33.0 | 32.0 | 29.5 | 25.7 | 22.0 |
| VIII 6-19 | 20.3 | 18.7 | 19.0 | 20.7 | 22.7 | 26.0 | 29.3 | 30.7 | 29.5 | 27.0 | 24.5 | 22.0 |
| VIII-IX 20-2 | 16.2 | 15.3 | 16.0 | 17.7 | 19.6 | 22.5 | 25.4 | 24.7 | 23.5 | 22.0 | 19.5 | 17.0 |
| IX 3-9 | 15.2 | 14.3 | 14.7 | 16.0 | 17.5 | 20.0 | 22.5 | 23.0 | 22.0 | 20.2 | 18.1 | 16.0 |
Table 2.
Measured mean monthly temperatures of air inside the galleries [°C].
| Month | I | II | III | IV | V | VI | VII | VIII | IX | X | XI | XII |
|---|---|---|---|---|---|---|---|---|---|---|---|---|
| T (°C) | 10 | 10 | 12 | 14 | 16 | 20 | 22 | 22 | 20 | 16 | 12 | 10 |
Table 3.
Measured mean monthly fresh concrete mix temperatures T(x,y,z,τ = 0) [°C].
| Month | X | XI | XII | I | II | III | IV | V | VI |
|---|---|---|---|---|---|---|---|---|---|
| T (°C) | 10.0 | 9.7 | 9.5 | 9.5 | 9.7 | 9.7 | 12.3 | 13.1 | 12.9 |
Table 4.
Concrete thermal parameters.
| Parameter | Meaning | Value | Unit |
|---|---|---|---|
| k | Thermal conductivity coefficient | 1.80 | W/(m K) |
| c | Specific heat capacity | 950.0 | J/(kg K) |
| α | Coefficient of thermal expansion | 11.5·10−6 | 1/°C |
| h | Combined convective heat transfer coefficient | 20.10 | W/(m2 K) |
| Tref | Reference temperature | 13.0 | °C |
Table 5.
Concrete hydration analysis parameters.
| Meaning | Value | Unit |
|---|---|---|
| Cement ratio (type I) in the concrete mass M (for Portland cement) | 50 | kg/m3 |
| 12.5·10−3 | 1/h | |
| Water-cement ratio Fly ash ratio in the concrete mass | 0.47 | - |
| 225.0 | kg/m3 | |
| CaO ratio in the fly ash | 17.0 | % |
Table 6.
Rock mass thermal parameters.
| Parameter | Meaning | Value | Unit |
|---|---|---|---|
| k | Thermal conductivity coefficient | 2.40 | W/(m K) |
| c | Specific heat capacity | 880.0 | J/(kg K) |
| α | Coefficient of thermal expansion | 9.0·10−6 | 1/°C |
Table 7.
Concrete parameters used in SF analysis.
| Parameter | Meaning | Value | Unit |
|---|---|---|---|
| Volume density | 2360.0 | kg/m3 | |
| E | Elastic modulus | 30.0 | GPa |
| ν | Poisson’s ratio | 0.20 | - |
Table 8.
Rock mass parameters used in SF analysis.
| Parameter | Meaning | Value | Unit |
|---|---|---|---|
| Volume density | 2430.0 | kg/m3 | |
| E | Elastic modulus | 20.0 | GPa |
| ν | Poisson’s ratio | 0.20 | - |
Publisher’s Note: MDPI stays neutral with regard to jurisdictional claims in published maps and institutional affiliations. |
© 2022 by the authors. Licensee MDPI, Basel, Switzerland. This article is an open access article distributed under the terms and conditions of the Creative Commons Attribution (CC BY) license (https://creativecommons.org/licenses/by/4.0/).
Share and Cite
MDPI and ACS Style
Mirković, U.; Kuzmanović, V.; Todorović, G. Long-Term Thermal Stress Analysis and Optimization of Contraction Joint Distance of Concrete Gravity Dams. Appl. Sci. 2022, 12, 8163. https://doi.org/10.3390/app12168163
AMA Style
Mirković U, Kuzmanović V, Todorović G. Long-Term Thermal Stress Analysis and Optimization of Contraction Joint Distance of Concrete Gravity Dams. Applied Sciences. 2022; 12(16):8163. https://doi.org/10.3390/app12168163
Chicago/Turabian StyleMirković, Uroš, Vladan Kuzmanović, and Goran Todorović. 2022. "Long-Term Thermal Stress Analysis and Optimization of Contraction Joint Distance of Concrete Gravity Dams" Applied Sciences 12, no. 16: 8163. https://doi.org/10.3390/app12168163
Note that from the first issue of 2016, this journal uses article numbers instead of page numbers. See further details here.