

Effect of Moisture Content on Subgrade Soils Resilient Modulus for Predicting Pavement Rutting


1
Virginia Department of Transportation, 1700 N Main St., Suffolk, VA 23434, USA
2
Department of Civil and Environmental Engineering, University of South Carolina, 300 Main St., Columbia, SC 29208, USA
*
Author to whom correspondence should be addressed.
Geosciences 2023, 13(4), 103; https://doi.org/10.3390/geosciences13040103
Submission received: 8 February 2023
/
Revised: 22 March 2023
/
Accepted: 28 March 2023
/
Published: 30 March 2023
Abstract
:The subgrade soil stiffness, which depends on the in-situ moisture content and soil index characteristics, is a key factor in pavement rutting. Due to variations in the compaction process used during construction and seasonal changes, the subgrade soil moisture content may deviate from the desired condition. The resilient modulus (MR), an important parameter of the Mechanistic-Empirical (M-E) pavement design process, is used to specify the subgrade soil stiffness. Repeated load triaxial tests, which can be challenging and time-consuming to execute, are often used to determine MR. As a result, correlations between MR and more accessible stiffness metrics and index qualities are frequently used. California bearing ratio (CBR) and repeated load triaxial tests were carried out in this investigation. Soil specimens were fabricated at moisture levels that were both above and below the optimum moisture content (). The results of the two tests were correlated, and statistical models were created to correlate the parameters of the generalized constitutive resilient modulus model with the characteristics of the soil index. Additionally, utilizing the MR found for subgrade soils compacted at and ±2%, pavement rutting was analyzed for three base layer types. The results demonstrated that a laboratory-measured MR (MR(Lab)) decreases as the moisture content increases. Specimens compacted at −2% showed higher MR(Lab) than specimens compacted at . Specimens compacted at +2% showed lower MR(Lab) than specimens compacted at . Results also indicated that the MR(Lab) predicted higher pavement rutting compared to field measured MR (MR(Lab)). If a stabilized aggregate foundation layer was employed instead of an untreated granular base, subgrade soil moisture condition showed a significant impact on rutting.
1. Introduction
Rutting is a structural distress that affects the riding quality and structural performance of flexible pavements. The structural life of a pavement is affected by several factors, including traffic conditions [1,2], climatic conditions [3,4], and pavement and subgrade materials [5,6,7,8]. To predict distresses, such as pavement rutting and roughness, over the design life of the pavement, the Mechanistic-Empirical Pavement Design Guide (MEDPG) [9] is used. The subgrade resilient modulus (MR), out of all the material inputs, has been determined to have the most significant influence on rutting predicted by MEPDG [10,11]. A repeated load triaxial (RLT) test can be used to directly obtain MR, although the test is considered difficult, time-consuming, and expensive. As a result, correlations of MR to other parameters are frequently used. These include correlations to the pavement resilient modulus found using the falling weight deflectometer (FWD) (e.g., refs. [12,13,14,15,16,17]) and correlations to the dynamic cone penetrometer [18] and California Bearing Ratio (CBR) (e.g., refs. [19,20,21]). Additionally, correlations between MR from RLT tests and soil index properties have been developed (e.g., refs. [22,23,24,25,26]). Instead of covering a range of moisture conditions and dry densities, most correlations are for a specific subgrade condition, such as the optimum moisture condition and maximum dry density. Moisture variation significantly influences subgrade MR and, subsequently, pavement performance [25,27,28,29,30]. Soil samples compacted on the wet side of have been shown to experience higher permanent strain potentials than those compacted dry side of and at [31]. An increase in moisture content above optimum has decreased MR. However, MR results obtained for specimens on the dry side were close to those of samples tested at [30]. Subgrade MR also varies seasonally because of changes in moisture content [28].
In recent years, there has been an increased interest in determining the effect of moisture changes on the mechanical behavior of subgrade soils [32,33,34,35]. The new MEPDG stresses the importance of these environmental conditions. It incorporates them in pavement design through models that analyze the changes in mechanical properties with moisture variations. The soil water characteristics curve is used to evaluate seasonal changes in moisture contents and to define the relationship between the variations of water contents with soil suction in unsaturated subgrade soil. Resilient modulus is sensitive to moisture changes and the state of stresses dictated by the soil suction within a subgrade layer. Knowledge of moisture impact and suction’s influence on the subgrade’s resilient modulus is necessary when designing and rehabilitating new pavements [36].
Since there have been few studies on the effects of moisture variation of subgrade MR on pavement rutting in MEPDG (e.g., ref. [25]) and few studies on the correlations between MR and soil index properties and alternate stiffness test parameters for a range of moisture contents, e.g., refs. [23,25,29], the goal of this study is to conduct RLT tests and CBR tests on specimens at various moisture contents and establish relations between the results to predict MR and subsequent pavement rutting for moisture concentrations at, above, and below using MEPDG. Finally, the influence of subgrade soil moisture content on resilient modulus and pavement rutting will be investigated for three commonly used base types in South Carolina.
2. Objectives
The main research question addressed in this study is How does moisture content affect the subgrade MR for predicting pavement rutting using MEPDG? The primary research hypothesis associated with this research question is that MR can be effectively used as an appropriate design input parameter for MEPDG in efforts to simulate different moisture conditions.
The following research tasks were completed in an effort to answer the research question:
- Perform repeated load triaxial tests on remolded samples of subgrade soil collected from beneath existing pavements. Determine MR of these subgrade soils at different moisture contents above and below the optimum moisture content.
- Conduct CBR tests on specimens remolded at different moisture contents and densities.
- Develop a correlation between CBR and the resilient modulus from repeated load triaxial tests. Establish statistical models between soil index properties and the resilient modulus model parameters for remolded soils.
- Back-calculate MR(FWD) from FWD tests performed on existing pavements where the subgrade soil samples were obtained. Relate the laboratory-measured MR(Lab) to the back-calculated MR(FWD) and obtain the coefficient of conversion (C-factor).
- Evaluate the effect of subgrade resilient modulus obtained for a range of moisture contents and densities on pavement rutting using the MEPDG software v2.6.1 for different pavement base types.
3. Methodology
Eight different subgrade soils were selected for this study. Soil samples were collected at 25 locations from beneath three existing pavement sections in different South Carolina regions. Pavement A is a 6.5-km section of US-521 in Georgetown County, Pavement B is a 9.9 km section of US-321 in Orangeburg County, and Pavement C is a 2.1 km section of SC-93 in Pickens County. Asphalt cores of 152.4 mm diameter were collected from the center of the right lane at spacings of 457 to 914 m along each pavement section. Samples of the subgrade soil were taken from beneath the asphalt core. There were 7 boreholes along Pavement A, 13 along Pavement B, and 5 along Pavement C. Approximately 22.6 kg of bulk soil was retrieved from each borehole, which was used for MR, CBR, and geotechnical index tests. Shelby tube samples were obtained in addition to the bulk samples.
Soils were classified according to both USCS (ASTM D2488) and AASHTO (AASHTO M145). Soils were compacted in a standard Proctor mold (101.6 mm in diameter and 116.4 mm in height, compacted in three layers, 25 blows per layer) and a CBR mold (152.4 mm in diameter and 177.8 mm in height, compacted in three layers, 56 blows per layer) to establish relationships between density and moisture content. The relations were compared to the moisture and density of the field samples to show how well the laboratory-prepared samples represented the field conditions for different soil types.
CBR tests were performed by AASHTO T 193 [37]. Specimens were prepared at moisture contents of wopt, ±4%wopt, ±2%wopt, and others as needed to define the relation between CBR and moisture content. CBR values were calculated as the ratio of load needed for 2.54 mm penetration of a circular spindle of 1935 mm2 in the area to 1360 kg load or for 5.08 mm penetration to 2041 kg load.
Repeated load triaxial tests were performed as per AASHTO T307 [38]. Specimens were fabricated by compacting the soil in a CBR mold at moisture contents of ±%2wopt and wopt. Once the soil was compacted in the CBR mold, a 76.2 mm diameter Shelby tube was pushed into the soil to collect a 76.2 mm diameter × 152.4 mm long cylindrical specimen. The specimen was then extruded, inserted into a rubber membrane, and subjected to static confining pressure. A repeated axial cyclic stress of fixed magnitude, load duration, and cycle duration was applied per the testing sequence in AASHTO T307 [38].
The generalized constitutive resilient modulus model and Equation (1) was used to determine MR from laboratory testing [39]:
where is atmospheric pressure, is bulk stress = , is major principal stress, is intermediate principal stress, is minor principal stress, is octahedral shear stress, and , , and are model parameters/material constants, was used to calculate the MR(Lab) with a confining stress () equal to 13.8 kPa, and cyclic stress (deviator) stress equal to (σd) 41.4 kPa per NCHRP-285 [39].
Equation (2) [9] was used to estimate MR from CBR and serve as a comparison to the MR vs. CBR relation developed in this study.
FWD tests were performed at intervals of about 61 m along the three pavement sections. There were 80 stations along Pavement A, 155 along Pavement B, and 36 stations along Pavement C. The Dynatest system was used to conduct the FWD testing [40]. The device has 7 sensors with 7 distinct offsets (0, 203, 305, 457, 610, 915, and 1194 mm from the loading plate). Impulse loads of 4 different magnitudes (30.5, 40, 54, and 70 kN) were used for each test. Deflection basin data were collected and used to evaluate the pavement’s condition and estimate the backcalculated modulus, MR(FWD), using the AASHTOWare backcalculation tool [41].
The effect of MR on pavement rutting using the MEPDG was studied for five different resilient modulus input types: backcalculated from FWD data (MR(FWD)), MR obtained from 2% dry side of (MR(Lab, Dry)), (MR(Lab, )) 2% wet side of (MR(Lab, Wet)), and using the PMED default value based on soils classification (MR(Default)). The default resilient modulus value was obtained for the unbound materials based on correlations to the soil classification in the MEPDG [3]. The value of 110 MPa, 124 MPa, and 90 MPa was used for Site A, Site B, and Site B, respectively. A summary of the MEPDG inputs is shown in Table 1. Pavement A, Pavement B, and Pavement C are asphalt concrete pavements with different bases [42]. Pavement A has a cement-stabilized base, Pavement B has a graded aggregate base, and Pavement C has an asphalt aggregate base. The construction dates for Pavement A, Pavement B, and Pavement C pavement sections are 2003, 2004, and 2001, respectively. The MEPDG analysis was run for 20 years.
4. Results
4.1. Index Test Results
The properties of the investigated soils are shown in Table 2. The samples listed represent one sample for each of the eight different soil classifications (considering both USCS and AASHTO) found at the pavement sites. The soil samples from all Pavement A and Pavement B boreholes were classified as coarse-grained soils. Fine-grained soil is defined as having more than 50% passing the No. 200 sieve per USCS and 35% per AASHTO. Using the AASHTO criteria, Pavement C is fine-grained soil.
Relationships between γd and moisture content developed for specimens compacted in a standard Proctor mold and a CBR mold are shown in Figure 1. Samples compacted in the CBR molds had and close to that of the samples compacted in the Proctor mold. Field moisture content and dry density found from Shelby tube samples are also shown. The dry unit weights for the field samples were 3–22% less than the standard Proctor dry density, except for the Pavement C C-4 field samples, which were 4% lower to 9% higher than obtained from the standard Proctor test.
4.2. CBR Test Results
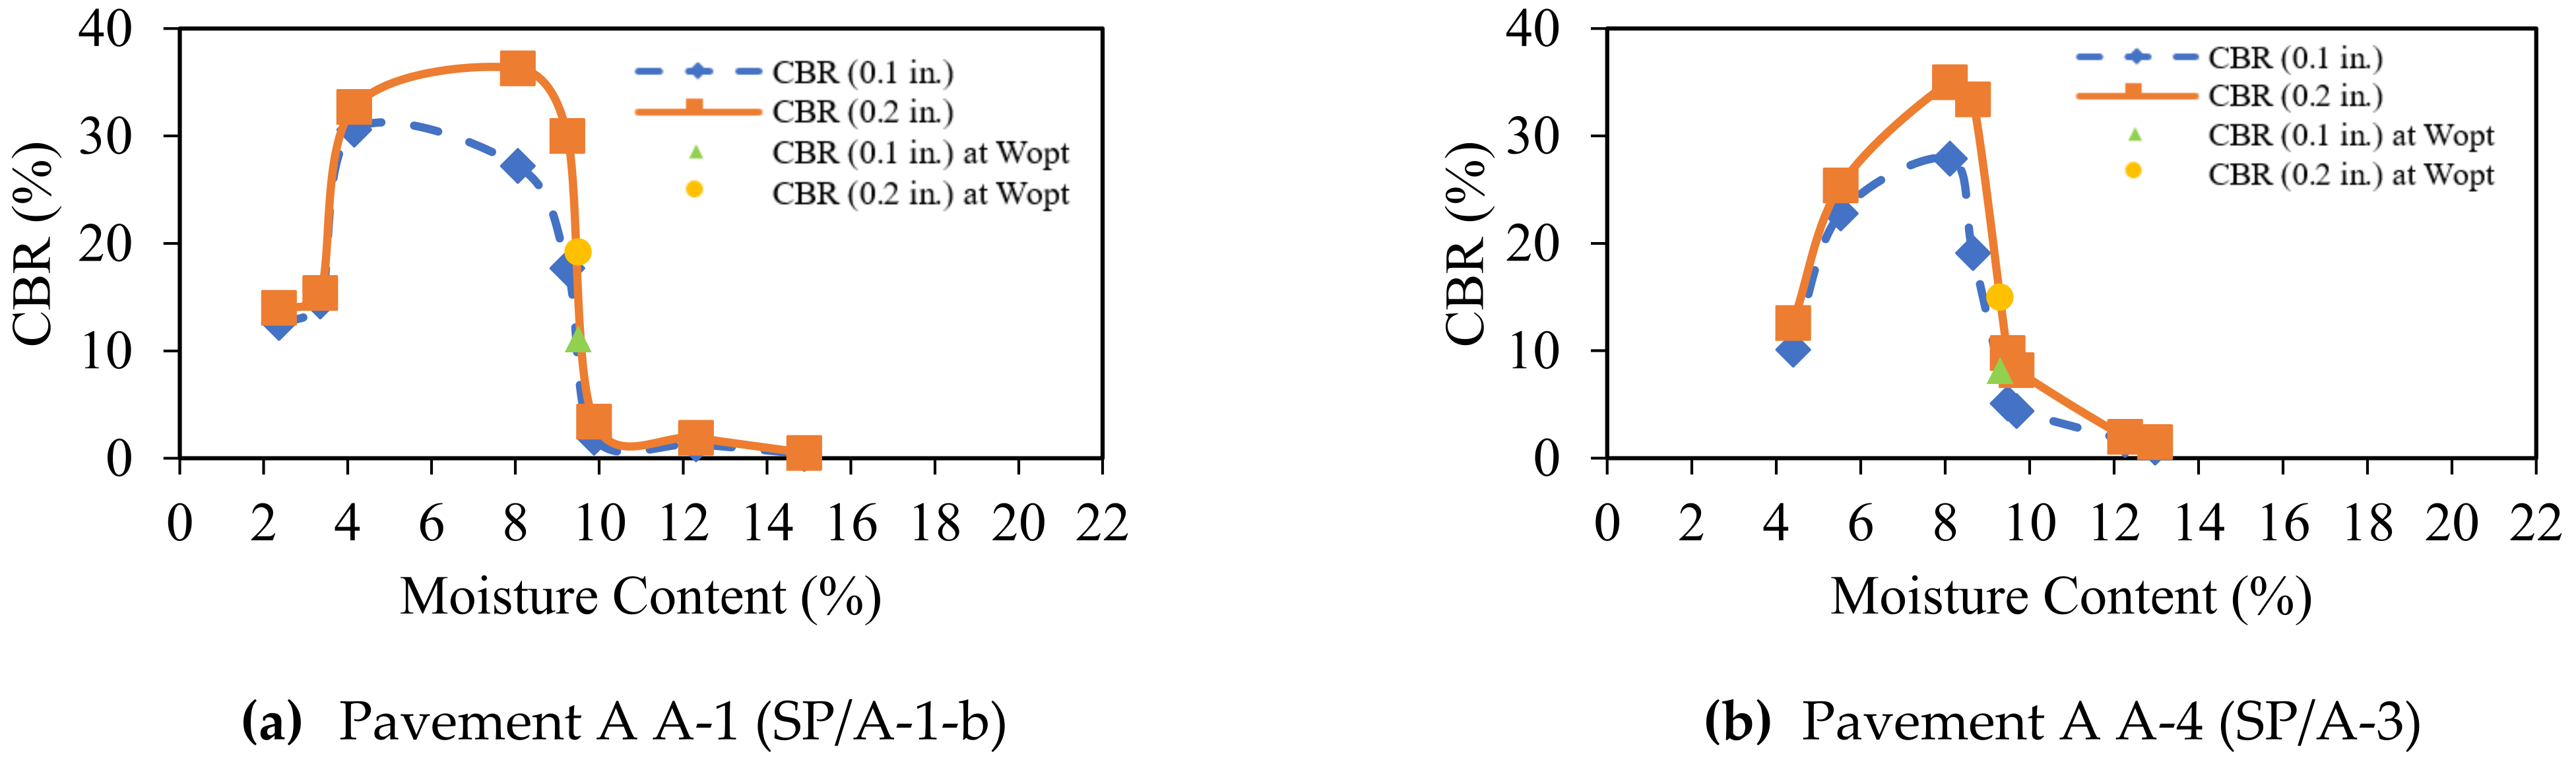
The CBR results for penetration depths of 2.54 mm and 5.08 mm over a range of moisture contents are shown in Figure 2. For all eight soils, the CBR and moisture content relationships show a distinct peak similar to the moisture–density relation found from a standard Proctor compaction test (i.e., Figure 1). For the penetration of 2.54 mm, the peak CBR values were found to be 31 and 17 for Pavement A A-1 and A-4, respectively; 25, 18, and 28 for Pavement B B-3, B-6, and B-8, respectively; and 16, 18, and 21 for Pavement C C-2, C-4, and C-5, respectively. The peak CBR for penetration of 5.08 mm was 8% to 25% higher than the peak CBR for penetration of 2.54 mm for the Pavement B soils, 11% to 83% higher than the peak CBR for Pavement A soils, and about the same for the Pavement A soils. Note that the peak value of CBR does not coincide with the . Instead, it is on the dry side of optimum (0.5% to 5% dry side for the different soils).
4.3. Resilient Modulus Results
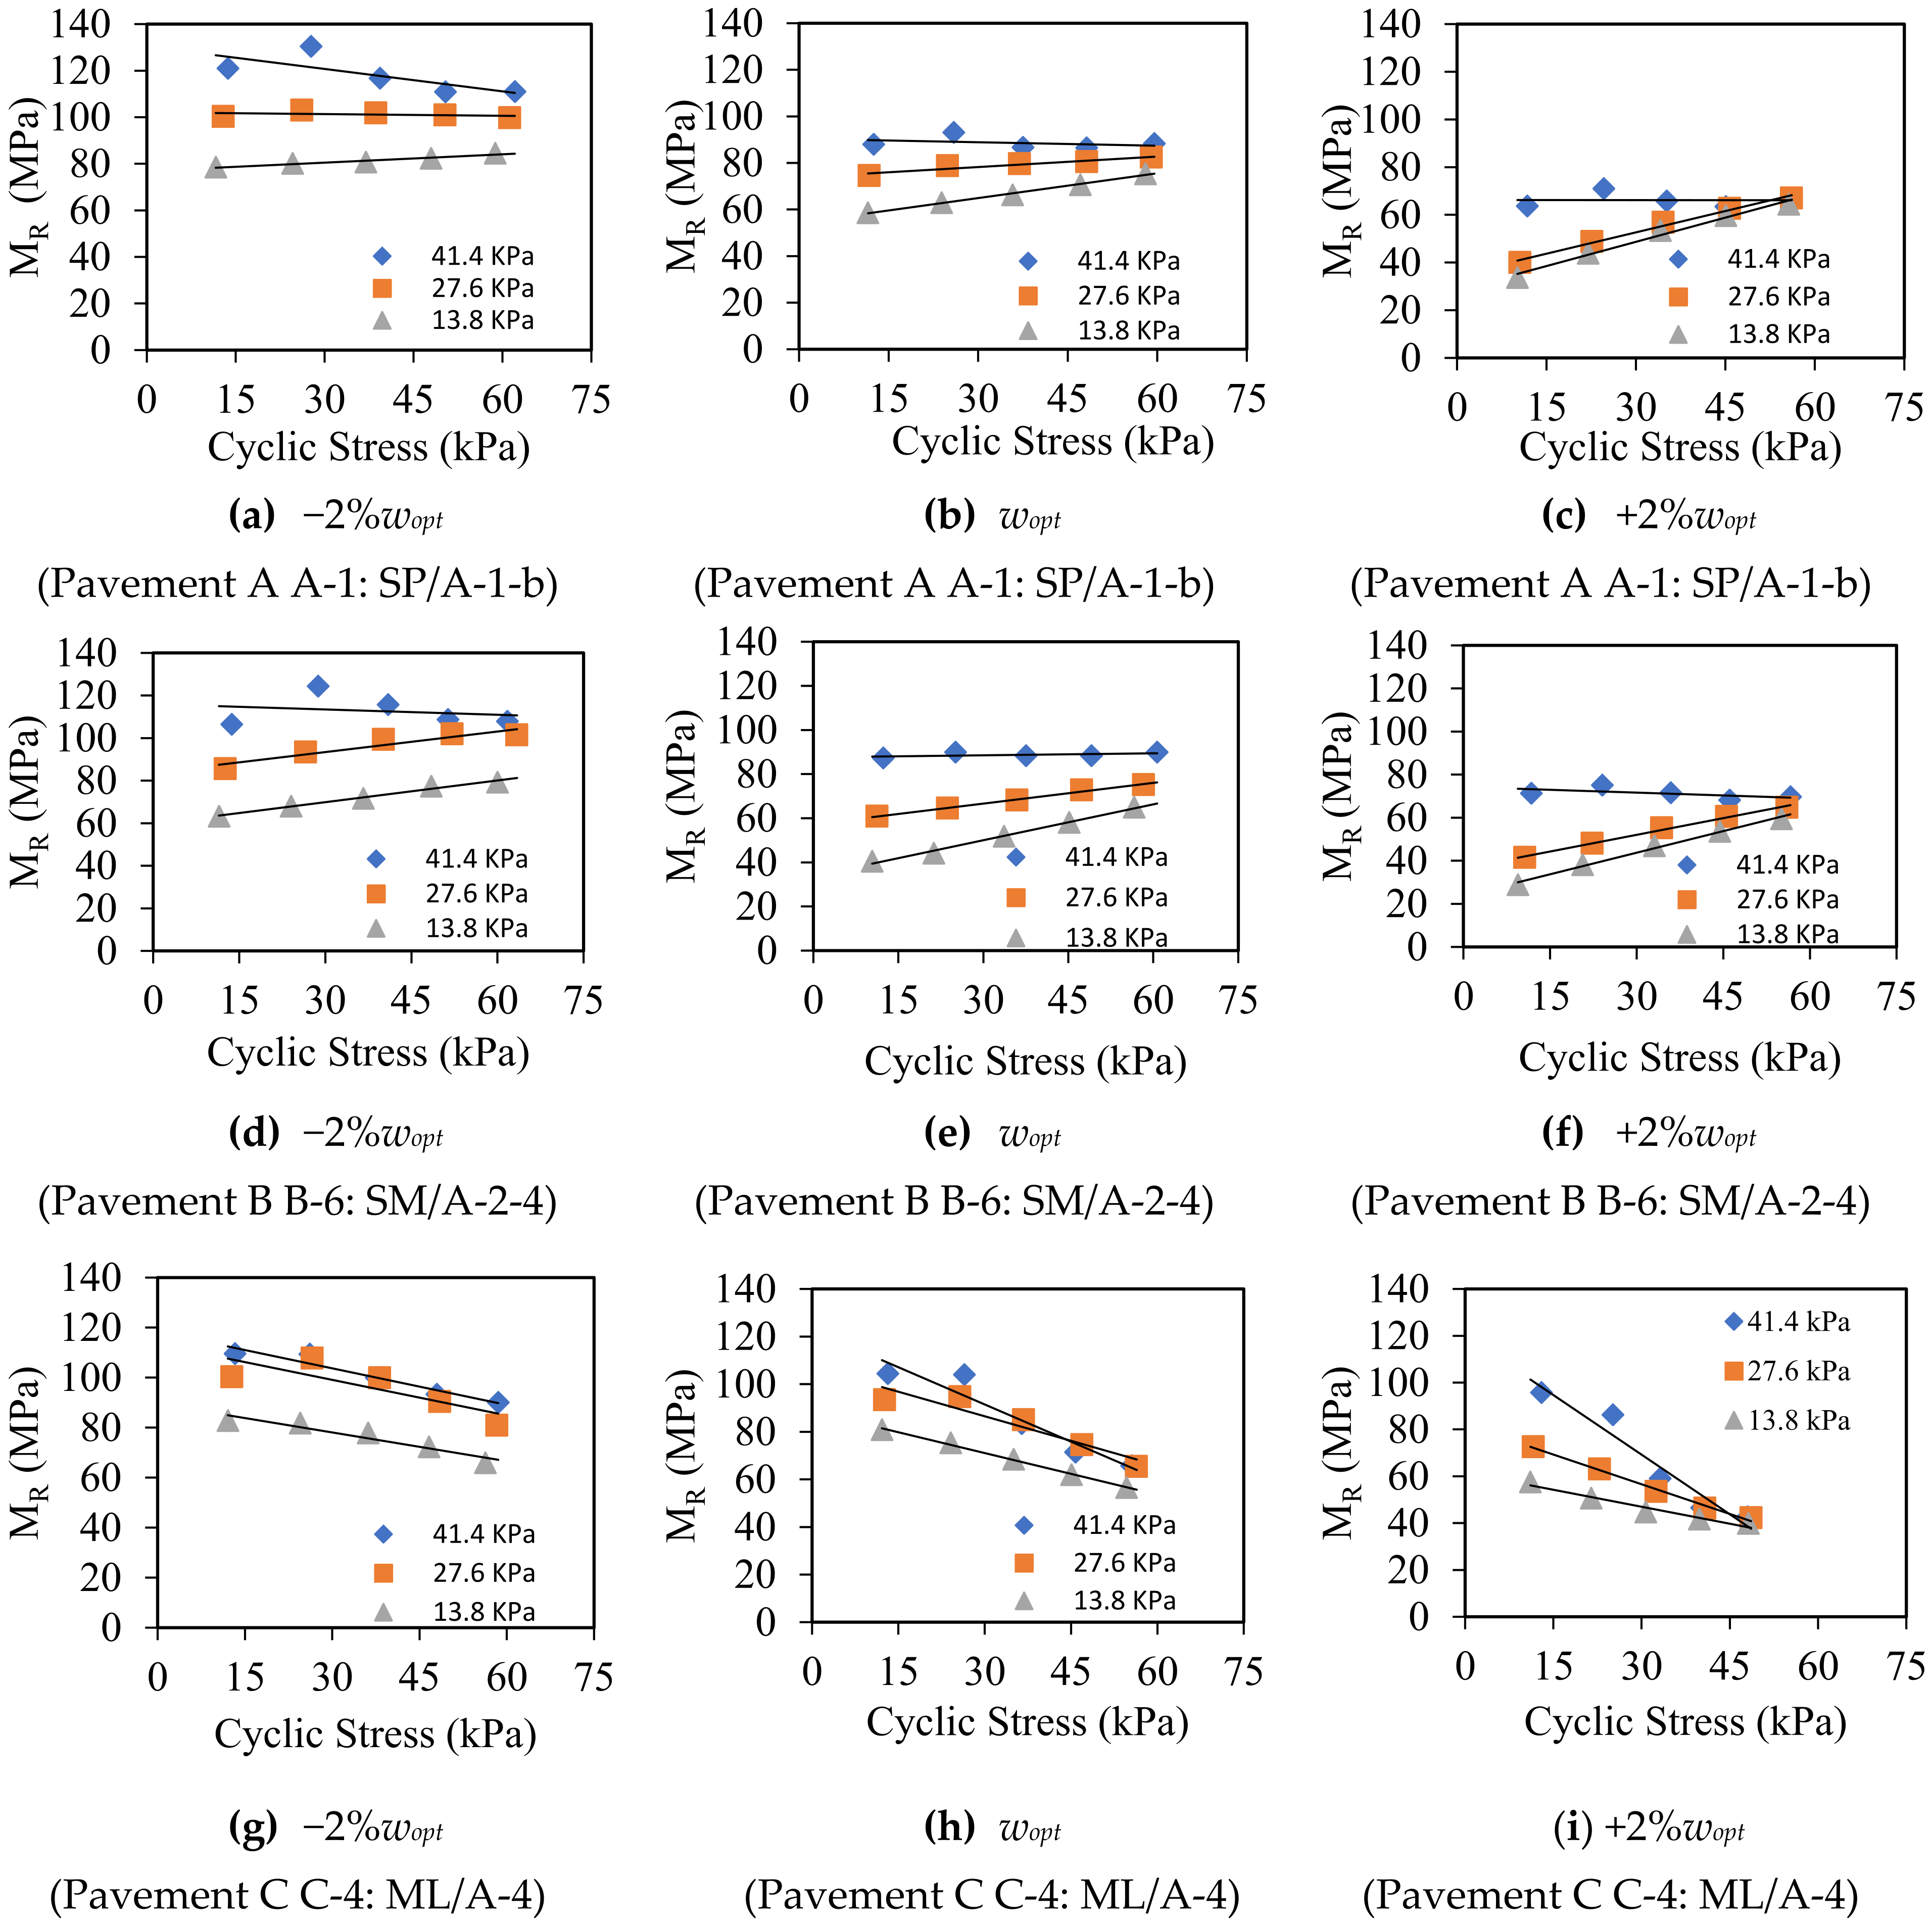
MR test results for Pavement A A-1, Pavement B B-6, and Pavement C C-4 are shown in Figure 3 to illustrate results for each of the three sites. MR versus cyclic stress at three different confining pressures is shown for specimens prepared at −2%, , and +2%. For the two granular soils (Pavement A in Figure 3a,b and Pavement B in Figure 3c–e), MR increases with increasing cyclic stress, and a higher MR is found for higher confining pressure, whereas, for the finer-grained soil (Pavement C in Figure 3f–i), MR decreases with increasing cyclic stress. These trends agree with published literature (i.e., refs. [15,43,44,45,46,47]) illustrating the strain-hardening effect in sands and the stress-softening effect in clays. The softening effect decreases the resilient modulus of cohesive soils with increased deviator stress. Cohesive soils, if typically consolidated, soften while sheared and remolded. A decrease in stress is observed at strains beyond the peak stress; therefore, resilient modulus decreases. For loose granular soils, the resilient modulus increases with an increase in deviator stress, which indicates strain hardening (granular interlock) due to particle reorientation into the denser state [42]. Research studies have shown that subgrade MR decreases with an increase in moisture content or degree of saturation [42,43,44,45,46,47,48]. Butalia et al. [49] observed a reduction in resilient modulus due to increased positive pore pressure with increased moisture content for unsaturated cohesive soils.
Furthermore, as the moisture content increases from −2% to to +2%, MR decreases for each cyclic stress and confining pressure. Hence, tests performed on specimens compacted on the dry side of optimum showed higher MR than those compacted at , and those compacted on the wet side of optimum showed lower MR than those compacted at . Moreover, MR for the specimens compacted on the wet side of optimum are less sensitive to the confining pressure at higher cyclic stress.
4.4. MR Model Parameters and the Effects of Moisture Content
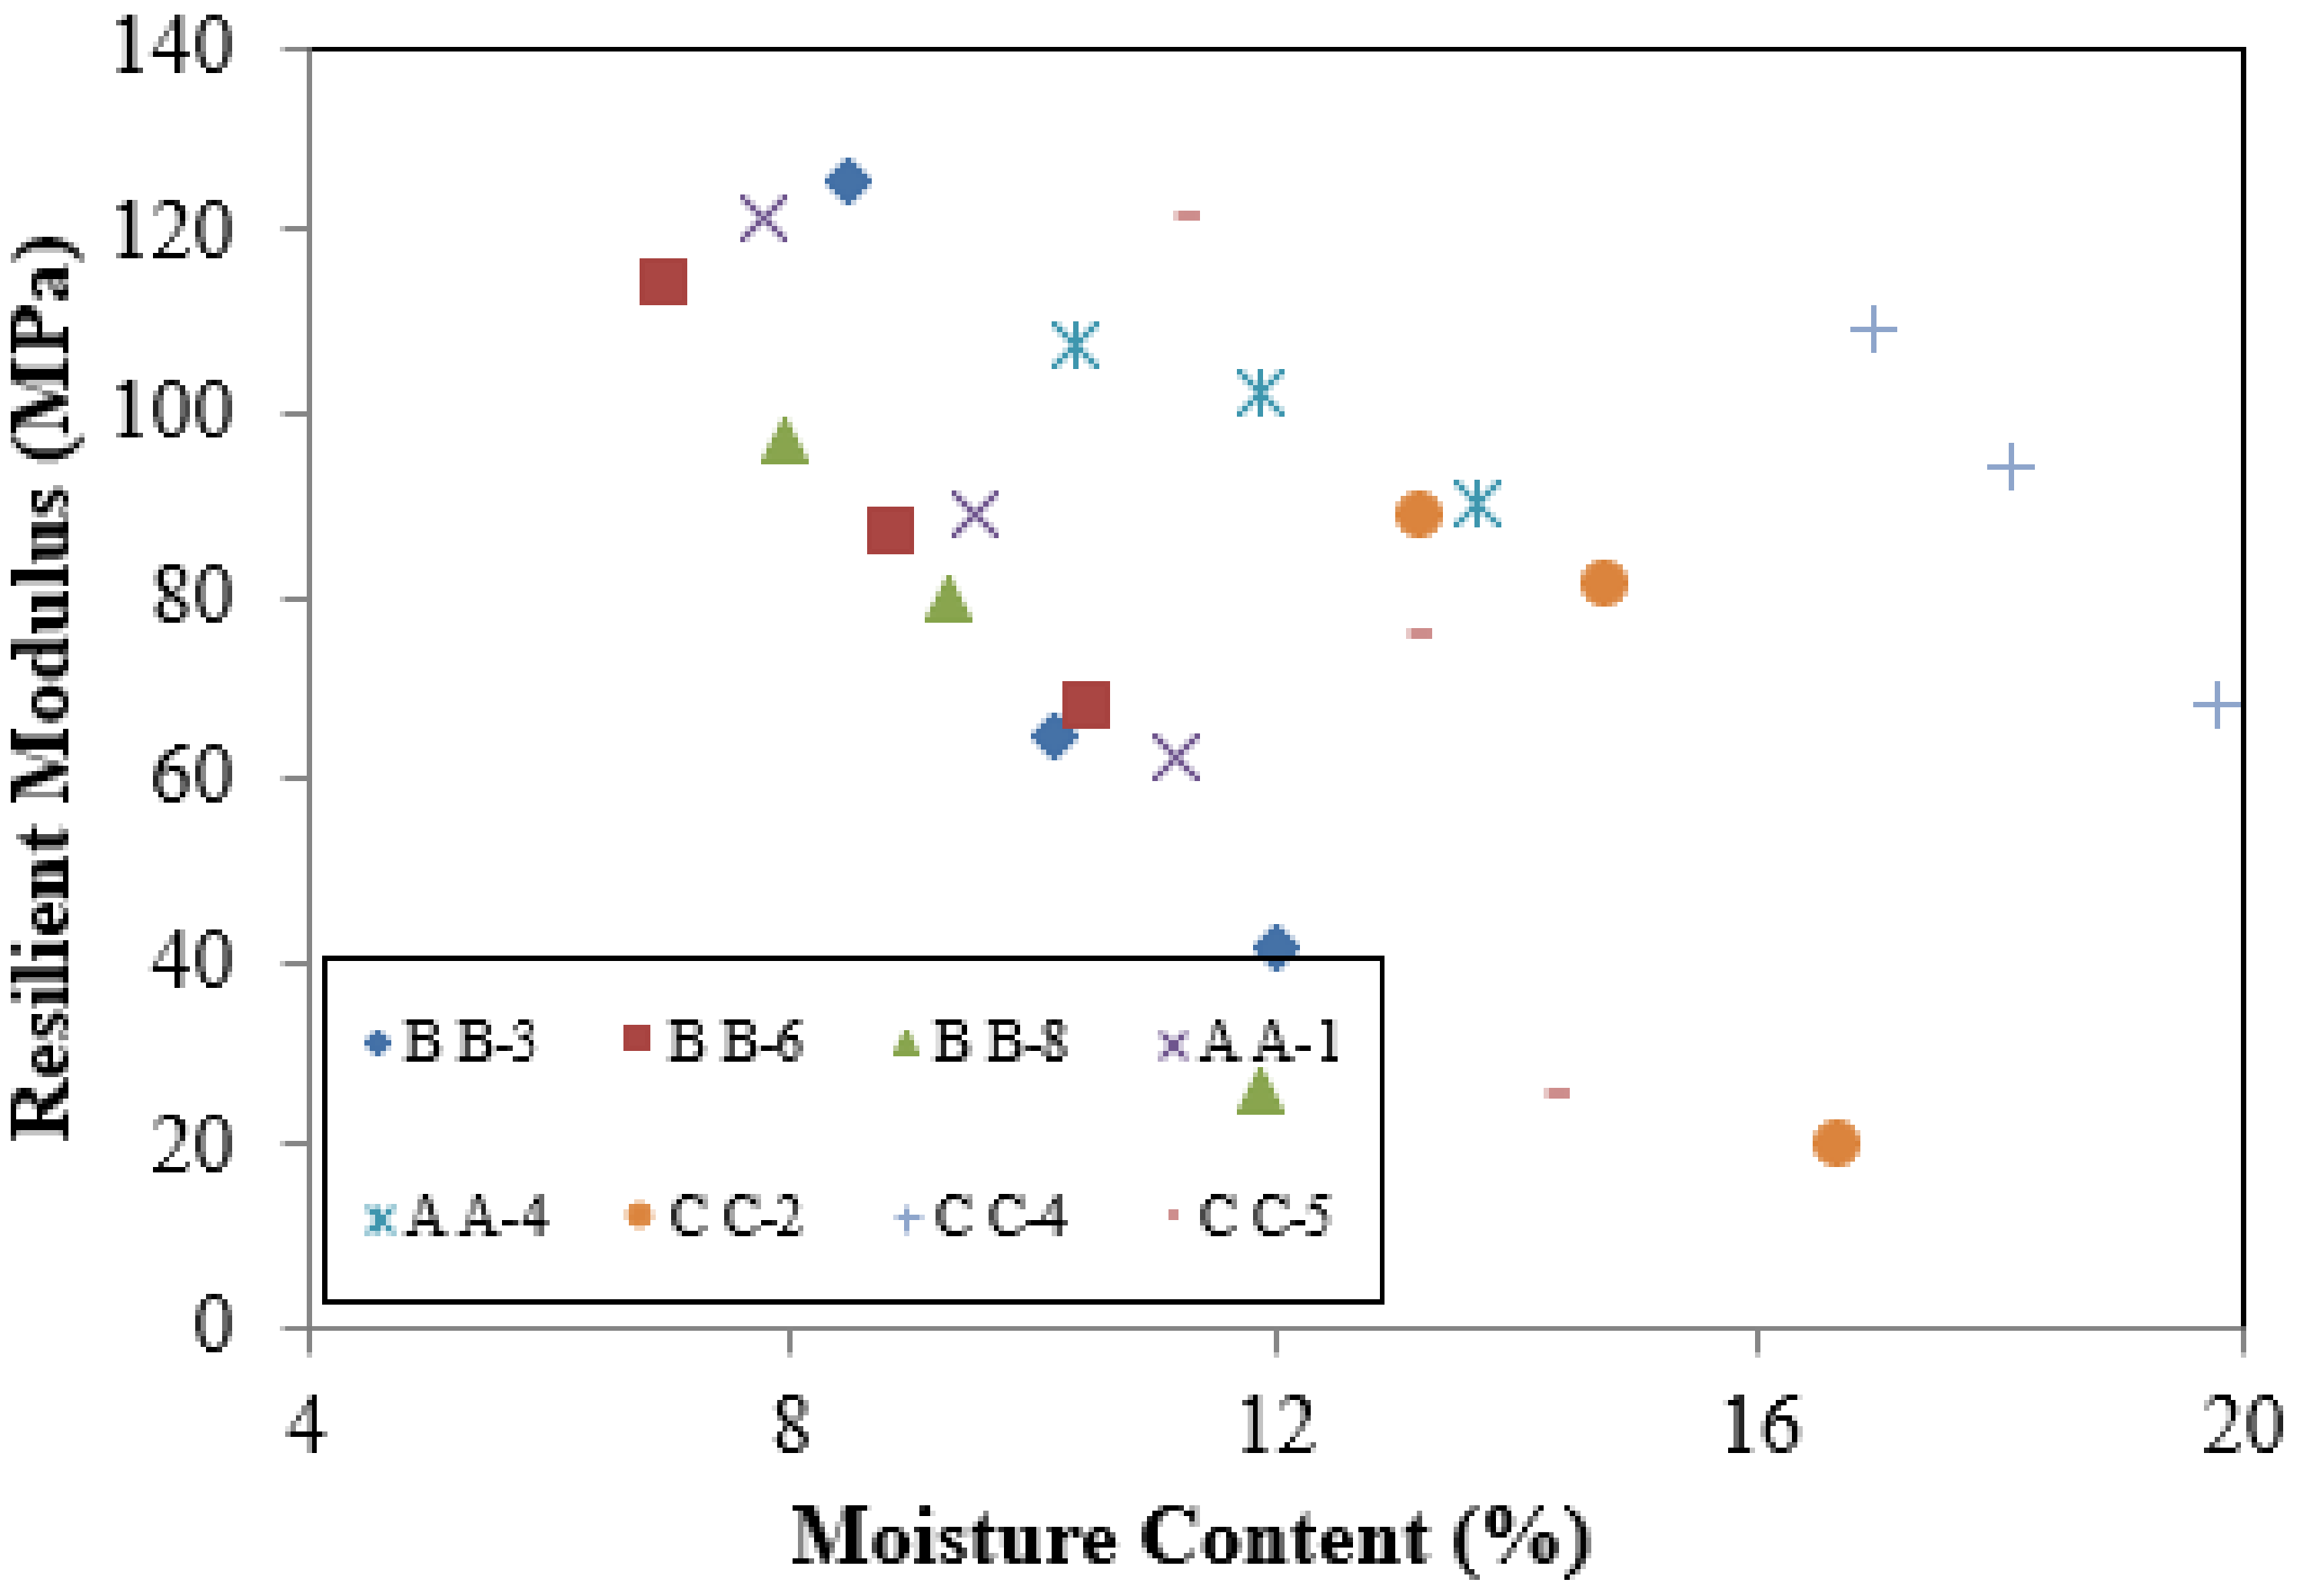
Model parameters were obtained for the generalized constitutive resilient modulus model used in the AASHTO M-E Pavement Design Guide (Equation (1)). Table 3 shows three states (dry, optimum, and wet) for 24 samples. Most of the test results show a good coefficient of determination (). Results indicate that for the eight soil types, specimens prepared on the dry side of have a higher MR than those prepared at , and those prepared at have a higher MR than those prepared on the wet side of . In general, as shown in Figure 4, as the moisture increases, MR decreases for all soils tested herein, as observed by others (e.g., refs. [28,47,48,49,50,51]). In most cases, the dry densities of the specimens compacted at are close to those compacted at ±2% (see Table 3). Thus, for small changes in density, i.e., 19.35 kN/m3 and 19.57 kN/m3 for specimens compacted at 2% and respectively for Pavement B B-3, there is no clear trend in MR.
4.5. Correlation of Resilient Modulus with CBR Values
Correlations between MR and CBR are shown in Figure 5. Figure 5a shows the correlation between MR and CBR for both 2.54 mm and 5.08 mm penetration and indicates that CBR increases with increasing MR for both penetrations, with the MR for 2.54 mm penetration being approximately 6% higher than 5.08 mm penetration. Figure 5b shows the correlation between MR and CBR as a function of different soil types and indicates that CBR increases with increasing MR for all soils tested herein. The following correlation Equation (3) between MR and CBR was developed for South Carolina using the CBR data for all 24 samples at 2.54 mm penetration:
4.6. Correlation of Laboratory-Measured Resilient Modulus and MR Obtained from Falling Weight Deflectometer
Figure 6 compares the average laboratory-measured MR for all samples tested at the three sites (−2%) and FWD back-calculated MR results. Generally, higher MR was observed for the sites with coarse-grained soils (Pavement A and Pavement B). The average laboratory MR(Lab) was 70–80% less for these sites than the MR(FWD). For the site with fine-grained soils (Pavement C), the laboratory MR(Lab) was approximately 60% less than the MR(FWD). Higher FWD values can be obtained from different FWD equipment, loading magnitudes, or back-calculation tools [50]. Johnson (1992) [51] developed a correlation between FWD-derived modulus and laboratory-resilient modulus. He found that the maximum ratio of MR(FWD) to MR(Lab) is 12.4, the minimum ratio is 1.8, and the average ratio for all sites is 5.7. Table 4 shows the C factors found for coarse and fine-grained soils at each of −2%. Table 4 also lists the combined C value for coarse and fine-grained soils. Results showed that the C values are influenced by the moisture content. The correlation between the FWD back-calculated modulus and the laboratory MR developed here is shown in Equation (4) and used to find the coefficient of conversion (C-factor) in the relation (see Equation (4)):
where C = 3.6 for coarse and fine-grained soils.
For pavement design consideration, the laboratory-measured MR(Lab) using the NCHRP 285 [39] stress conditions are more conservative than the backcalculated MR(FWD). It is recommended that state agencies develop an MR design catalog for using local soils as input Level 2 during flexible pavement design. Proper selection of the subgrade resilient modulus can significantly affect the required thicknesses of the pavement layers and directly influence the cost. There are no unique methods to back-calculate the MR from FWD data. Different back-calculation tools give different values. Islam et al. (2020) [52] found that the average MR for the BAKFAA and AASHTOWare tools are around 6% different. In contrast, the average MR along the pavement length found using the SCDOT program was approximately 21–30 % lower than the other two tools. Furthermore, seasonal variation, climate, temperature, and surface condition of the asphalt concrete layer affect the deflection data of the FWD test [51,52,53,54].
4.7. Correlation of Resilient Modulus Model Parameters with Soil Index Properties
Using multiple linear regression techniques, the generalized constitutive resilient modulus model parameters () for remolded soils were correlated with soil index properties. The soil properties considered in the statistical analysis include the compacted soil dry density (), moisture content (), maximum dry density (), optimum moisture content (), percent passing through No. 4 (, No. 40 (), and No. 200 sieve (), , , , uniformity coefficient (), coefficient of curvature (), liquid limit, plastic limit, plasticity index (PI), liquidity index (LI), specific gravity (), and the percent of sand, silt, and clay. Combined statistical models were developed using the results for the eight soils. Table 5 shows the coefficients for the developed models. Coefficients of determination of 0.43, 0.61, and 0.71 were found for , respectively.
Table 5 shows the significance of different soil properties on the coefficients and overall model significance using p-value, where p < 0.001 indicates a statistically significant effect. p < 0.01 and p < 0.05 indicate statistically moderate and low significant effects, respectively. For the eight soils tested, , LI, , and γd,max showed a statistically significant effect on all three model coefficients (, and ); and γd showed a statistically significant effect on and w, γd, and showed a statistically significant effect on .
Predicted and measured , are shown in Figure 7a–c, respectively. Model coefficients are the regression constants of Equation (1). Therefore, these were measured from the applied bulk stresses and octahedral shear stresses. The resultant resilient modulus values were obtained from 15 test sequences using regression analysis for each test. Most of the data points for all three models are observed close to the equity line.
The laboratory-measured MR(Lab) is compared to the predicted in Figure 8a and to the LTPP sand model in Figure 8b. The predicted MR (from the locally developed constitutive model) more accurately predicted MR than the LTPP sand model in terms of lower bias (e.g., −2.07 vs. 37.40) and standard error (SE) (e.g., 21.56 vs. 34.59). The LTPP model for silts and the LTPP model for clay were also studied. However, the LTPP model for sand showed better results when compared to the measured MR for the soils studied herein. These results demonstrate the importance of performing local calibration studies to find the constitutive model parameters for use in the MEPDG rather than using the universal constitutive model parameters found within the LTPP program [52].
5. Effect of Subgrade Resilient Modulus on Pavement Rutting
Figure 9 shows the cumulative rutting of different layers for each of the three pavement sections. Rutting for the AC layer only, rutting for the AC and base layer, and total rutting (AC + base + subgrade rutting) are shown. Pavement rutting is shown for five different subgrades inputs (MR(Lab, Dry), MR(Lab, ), MR(Lab, Wet), MR(FWD), and MR(Default)) to show the effect of subgrade moisture content and the influence of MR for designing flexible pavement. For all three sites, the highest total rutting was obtained using an MR wet of optimum as the input for the subgrade soil, and the lowest total rutting was obtained using an MR(FWD).
For Pavement A (Figure 9a) showed subgrade rutting of 8.58, 7.75, and 7.23 mm, respectively, for the MR(Lab, Wet), MR(Lab, ), and MR(Lab, Dry), respectively, a pavement age of 20 years. Pavement A also follows a similar trend to Pavement B, but the total rutting is approximately 2 times greater. The predicted total rutting using MR(FWD) is lower than other inputs except for AC and AC+Base layer conditions.
As observed for Pavement B in Figure 9b, using a wet of optimum MR(Lab, ), as the input for the subgrade soil showed subgrade rutting (total rutting—AC and base rutting) that is approximately 1.7 times the subgrade rutting using a dry of optimum MR(Lab, Dry), for a pavement age of 20 years (17.41 mm versus 10.15 mm subgrade rutting). Using the MR(Lab, ), found at produced rutting that was in between these values (7.26 mm). That means it indicates higher moisture content produced lower subgrade MR and predicts the total pavement rutting. The figure also shows that the MR(FWD) predicted higher rutting (AC layer only, and AC and base layer) than laboratory-measured MR(Lab). It can be observed that subgrade MR directly influences the total pavement rutting. The MR(Default) predicts approximately 1.5 times higher total rutting than the MR(FWD) and is also close to the dry side of optimum MR(Lab, Dry).
Pavement C showed the largest subgrade rutting (8.88 mm) for the MR(Lab, Wet) at wet of optimum (Figure 9c). Even though Pavement B has a higher subgrade MR(Lab, Wet) for the wet side of optimum (45 MPa) than that of Pavement C (38 MPa), higher subgrade rutting (12.5 n Pavement B) was observed (6.33 mm in Pavement C). This is because subgrade rutting is affected by the rutting of the layers above it (i.e., base layer rutting and AC rutting). These three sites were modeled with the same AC layer but a different type of base layer: Pavement A has a 152.2 mm thick cement stabilized aggregate base (CSB), Pavement B has a 152.2 mm thick graded aggregate base (GAB), and Pavement C has a 147.3 mm thick asphalt treated aggregate base (AAB) (see Table 5).
The GAB has a lower modulus (E = 138 MPa) than CSB and AAB (E = 6894 MPa); therefore, the largest subgrade rutting (and total rutting) was observed for all three MR inputs (wet, , dry) for the Pavement B site with GAB as the base course (see Figure 9b) when compared to the Pavement A and Pavement C sections with CSB and AAB as the base courses (see Figure 9b,c), respectively. This indicates that the effect of moisture variation on the MR for a subgrade layer, and the resulting rutting predicted in MEDPG, is more important when an untreated unbound layer (i.e., GAB) is present than when a stabilized layer (i.e., cement stabilized aggregate base layer or asphalt aggregate base layer) is present.
Overall, laboratory-measured MR (wet, , dry) predicts higher total pavement rutting than back-calculated MR(FWD) and MR(default) obtained from soil classification except for Pavement C. According to AASHTOWare Pavement ME Design software (version 2.6.1), both MR values are classified as Level 2 input parameters for subgrade resilient modulus. The default MR values (Level 3) are inconsistent in predicting pavement rutting. Sometimes, it showed that the expected pavement rutting was in close agreement with the dry side of MR (~1% difference) (see Figure 9a,b), and sometimes it exhibited more than a 6% difference (See Figure 9c). The default MR(default) exhibits higher total rutting than the dry side of optimum MR(Lab, Dry) for a pavement age of 20 years (5.95 mm versus 5.58 mm subgrade rutting) at the Pavement C site.
6. Conclusions
This paper presented an extensive field and laboratory testing program to establish subgrade material input parameters for predicting rutting over 20 years using MEPDG. FWD tests were performed along three asphalt concrete pavement sections, e.g., Pavement A, Pavement B, and Pavement C, and the AASHTOWare back-calculation tool [41] was used to backcalculate MR(FWD). Standardized field and laboratory methods were used to collect natural subgrade samples and characterize MR(Lab) through repeated load triaxial tests per AASHTO T 307. Multiple linear regression techniques were used to establish the generalized constitutive resilient modulus model parameters () for remolded soils and were correlated with soil index properties. Correlations were developed between MR(Lab) vs. MR(FWD) and MR(Lab) vs. CBR. Based on the analysis, the following conclusions can be drawn:
- The peak value of both CBR and MR(Lab) was found on the dry side of and at a γd less than the maximum.
- MR(Lab) decreases as the moisture content increases. Specimens compacted at −2% showed higher MR(Lab) than specimens compacted at . Specimens compacted at +2% showed lower MR(Lab) than specimens compacted at .
- The resilient modulus for the specimens compacted on the wet side of is less sensitive to the confining pressure at higher cyclic stress.
- A good correlation was made between MR(Lab) and CBR. MR(Lab) increases with increasing CBR for the different soils.
- Percent passing the No. 4 sieve, liquidity index, optimum moisture content, and maximum dry density showed a statistically significant effect on the coefficients of the generalized constitutive resilient modulus model.
- The locally developed constitutive models of coefficients predicted MR more accurately than the universal LTPP models in lower bias and standard error.
- Laboratory-measured MR(Lab) predicted higher pavement rutting compared to FWD.
- If a graded aggregate base is used, the soil moisture condition significantly influences the subgrade MR and the resulting subgrade rutting. However, if a higher stiffness base layer is used (i.e., cement-stabilized base or asphalt-treated aggregate base), the moisture effect is less significant.
Author Contributions
Conceptualization, methodology, software, validation, writing—original draft, writing-review and editing, M.M.R.; conceptualization, methodology, writing—review and editing, S.L.G.; conceptualization, methodology, software, writing—review and editing, K.M.I. All authors have read and agreed to the published version of the manuscript.
Funding
This project was funded by the SCDOT and the FHWA [grant SPR 708]. Any opinions, findings, conclusions, or recommendations expressed in this material are those of the authors and do not necessarily reflect the views of the SCDOT or the FHWA.
Data Availability Statement
Not applicable.
Acknowledgments
The writers would like to acknowledge the SCDOT for the sponsorship of this project. The opinions, findings and conclusions expressed herein are those of the authors and not necessarily those of the SCDOT or FHWA. The authors would like to express gratitude to USC graduate students Emad Gheibi and M. Majbah Uddin for their assistance in the soil index tests and statistical analyses. The authors would also like to express gratitude to USC undergraduate students Lex Nelson and Javonte Isaac or performing Atterberg limit tests for this study.
Conflicts of Interest
The authors declare no conflict of interest.
References
- Zaghloul, S.; Ayed, A.; Halim, A.A.; Vitillo, N.; Sauber, R. Investigations of Environmental and Traffic Impacts on Mechanistic-Empirical Pavement Design Guide Predictions. Transp. Res. Rec. 2006, 1967, 148–159. [Google Scholar] [CrossRef]
- Jadoun, F.M.; Kim, Y.R. Calibrating Mechanistic-Empirical Pavement Design Guide for North Carolina. Transp. Res. Rec. 2012, 2305, 131–140. [Google Scholar] [CrossRef]
- Zapata, C.E.; Andrei, D.; Witczak, M.W.; Houston, W.N. Incorporation of Environmental Effects in Pavement Design. Transp. Res. Rec. 2007, 8, 667–693. [Google Scholar] [CrossRef]
- Johanneck, L.; Khazanovich, L. Comprehensive Evaluation of Effect of Climate in Mechanistic–Empirical Pavement Design GuidePredictions. Transp. Res. Rec. J. Transp. Res. Board 2010, 2170, 45–55. [Google Scholar] [CrossRef]
- Saxena, P.; Tompkins, D.; Khazanovich, L.; Balbo, T. Evaluation of Characterization and Performance Modeling of Cementitiously Stabilized Layers in the Mechanistic-Empirical Pavement Design Guide. Transp. Res. Rec. 2010, 2186, 111–119. [Google Scholar] [CrossRef]
- Hossain, Z.; Zaman, M.; Doiron, C.; Solanki, P. Evaluation of Mechanistic-Empirical Design Guide Input Parameters for Resilient Modulus of Subgrade Soils in Oklahoma. J. Test. Eval. 2011, 39, 803–814. [Google Scholar]
- Singh, D.; Zaman, M.; Commuri, S. Evaluation of Measured and Estimated Dynamic Moduli for Selected Asphalt Mixed. J. ASTM Int. 2011, 8, 1–19. [Google Scholar]
- Xu, Q.; Ruiz, M.; Moravec, M.; Rasmussen, R.O. Simulation of Unbound Material Resilient Modulus Effects on Mechanistic-Empirical Pavement Designs. Mater. Struct. 2013, 46, 1089–1100. [Google Scholar] [CrossRef]
- American Association of State Highway and Transportation Officials (AASHTO). Mechanistic-Empirical Pavement Design Guide: A Manual of Practice, Interim Edition; AASHTO: Washington, DC, USA, 2008. [Google Scholar]
- Orobio, A.; Zaniewski, J.P. Sampling-Based Sensitivity Analysis of the Mechanistic–Empirical Pavement Design Guide Applied to Material Inputs. Transp. Res. Rec. J. Transp. Res. Board 2011, 2226, 85–93. [Google Scholar] [CrossRef]
- Islam, K.M.; Gassman, S.L. Predicting Flexible Pavement Distress and IRI Considering Subgrade Resilient Modulus of Fine-Grained Soils Using MEPDG. Materials 2023, 16, 1126. [Google Scholar] [CrossRef]
- Ksaibati, K.; Armaghani, J.; Fisher, J. Effect of Moisture on Modulus Values of Base and Subgrade Materials. Transp. Res. Rec. J. Transp. Res. Board 2000, 1716, 20–29. [Google Scholar] [CrossRef]
- Flintsch, G.W.; Al-Qadi, I.L.; Park, Y.; Brandon, T.L.; Appea, A. Relation between Back-calculated and Laboratory Measured Resilient Modulus of Unbound Materials. Transp. Res. Rec. 2003, 1849, 1177–1182. [Google Scholar] [CrossRef]
- Nazzal, M.D.; Mohammad, L.N. Estimation of Modulus Resilient of Subgrade Soils using Falling Weight Deflectometer. Transp. Res. Rec. 2010, 2186, 1–10. [Google Scholar] [CrossRef]
- Islam, K.M.; Gassman, S.; Rahman, M.M. Field and laboratory characterization of subgrade resilient modulus for pavement mechanistic-empirical pavement design guide application. Transp. Res. Rec. 2020, 2674, 921–930. [Google Scholar] [CrossRef]
- Islam, K.M.; Gassman, S.L. Estimation of Subgrade Modulus Using Falling Weight Deflectometer. In Tran-SET 2021; American Society of Civil Engineers: Reston, VA, USA, 2021; pp. 247–258. [Google Scholar] [CrossRef]
- Islam, K.M.; Gassman, S.L. Influence of Subgrade Resilient Modulus Selection Methodology on AASHTOWare Pavement ME Design. Geo-Congress 2022, 192–204. [Google Scholar] [CrossRef]
- Chen, D.; Wang, J.; Bilyeu, J. Application of Dynamic Cone Penetrometer in Evaluation of Base and Subgrade Layers. Transp. Res. Rec. 2001, 1764, 1–10. [Google Scholar] [CrossRef]
- Heukelom, W.; Klomp, A.J.G. Dynamic Testing as a Means of Controlling Pavement during and after Construction. In Proceedings of the 1st International Conference on the Structural Design of Asphalt Pavement, Ann Arbor, MI, USA, 20–24 August 1962; University of Michigan: Ann Arbor, MI, USA, 1962. [Google Scholar]
- George, K.P. Prediction of Resilient Modulus from Soil Properties Publication FHWA-MS-04-172, F.H.W.A.; US Department of Transportation: Washington, DC, USA, 2004.
- Garg, N.; Larkin, A.; Brar, H. A Comparative Subgrade Evaluation using CBR, Vane Shear, Light Weight Deflectometer, and Resilient Modulus Tests. In Proceedings of the 8th International Conference on the Bearing Capacity of Roads, Railways and Airfields, Champaign, IL, USA, 29 June–2 July 2009; Volume 5, pp. 57–64. [Google Scholar]
- Yau, A.; Von Quintus, H.L. Predicting Elastic Response Characteristics of Unbound Materials and Soils. Transp. Res. Rec. 2004, 1874, 47–56. [Google Scholar] [CrossRef]
- Kim, D.; Kim, J.R. Resilient Behavior of Compacted Subgrade Soils Under the Repeated Triaxial Test. Constr. Build. Mater. 2007, 21, 1470–1479. [Google Scholar] [CrossRef]
- Malla, R.B.; Joshi, S. Resilient Modulus Prediction Models Based on Analysis of LTPP Data for Subgrade Soils and Experimental Verifications. Int. J. Transp. Eng. 2007, 133, 491–504. [Google Scholar] [CrossRef]
- Zhou, C.; Huang, B.; Drumm, E.; Xiang, S.; Qiao, D.; Udeh, S. Soil Resilient Modulus Regressed from Physical Properties and Influence of Seasonal Variation on Asphalt Pavement Performance. J. Transp. Eng. 2014, 141, 1–9. [Google Scholar] [CrossRef]
- Titi, H.H.; English, R.; Faheem, A. Resilient Modulus of Fine-Grained Soils for Mechanistic-Empirical Pavement Design. Transp. Res. Rec. 2015, 2510, 24–35. [Google Scholar] [CrossRef]
- Guan, Y.; Drumm, E.C.; Jackson, N.M. Weighting Factor for Seasonal Subgrade Resilient Modulus. Transp. Res. Rec. 1998, 1821, 47–55. [Google Scholar] [CrossRef]
- Heydinger, A.G. Evaluation of Seasonal Effects on Subgrade Soils. Transp. Res. Rec. 2003, 1619, 94–101. [Google Scholar] [CrossRef]
- Khoury, N.N.; Zaman, M.M. Correlation Between Resilient Modulus, Moisture Variation, and Soil Suction for Subgrade Soils. Transp. Res. Rec. 2004, 1874, 99–107. [Google Scholar] [CrossRef]
- Ceratti, J.A.; Gehling, W.Y.; Nunez, W. Seasonal Variation of a Subgrade Soil Resilient Modulus in Southern Brazil. Transp. Res. Rec. 2004, 1876, 165–173. [Google Scholar] [CrossRef]
- Puppala, A.J.; Saride, S.; Chomtid, S. Experimental and Modeling Studies of Permanent Strains of Subgrade Soils. J. Geotech. Geoenvironmental Eng. 2009, 135, 1379–1389. [Google Scholar] [CrossRef]
- Hicks, R.G.; Monismith, C.L. Factors Influencing the Resilient Properties of Granular Materials, Transportation Research Record 345, Transportation Research Board; National Research Council: Washington, DC, USA, 1971; pp. 15–31. [Google Scholar]
- Taheri, A.; Tatsuoka, F. Primary stress–strain relations inferred from multiple-step triaxial compression test results. Soils Found 2012, 52, 748–766. [Google Scholar] [CrossRef]
- De Freitas, J.B.; de Rezende, L.R.; de F.N. Gitirana, G., Jr. Prediction of the resilient modulus of two tropical subgrade soils considering unsaturated conditions. Eng. Geol. 2020, 270, 105580. [Google Scholar] [CrossRef]
- Perez-Garcia, N.; Fredlund, D.; Garnica-Anguas, P.; Mestas-Martinez, N. A model to predict changes in resilient modulus resulting from wetting and drying. Infraestruct. Vial 2015, 17, 23–30. [Google Scholar] [CrossRef]
- Khoury, N.; Brooks, R.; Khoury, C. Environmental influences on the engineering behavior of unsaturated undisturbed subgrade soils: Effect of soil suctions on resilient modulus. Int. J. Geotech. Eng. 2009, 3, 303–311. [Google Scholar] [CrossRef]
- AASHTO T 193; Standard Test Method of Test for the California Bearing Ratio Test. Standard Specifications for Transportation Materials and Methods of Sampling and Testing. AASHTO: Washington, DC, USA, 2003.
- AASHTO-T307-99; Standard Method of Test for Determining the Resilient Modulus of Soils and Aggregate Materials Standard Method of Test for Soils and Aggregate Materials. AASHTO: Washington, DC, USA, 2017.
- NCHRP 1-28A; Laboratory Determination of Resilient Modulus for Flexible Pavement Design. National Cooperative Highway Research Program, Digest No. 285. AASHTO: Washington, DC, USA, 2004; pp. 1–52.
- Dynatest Consulting, Inc. Dynatest FWD/HWD Test Systems. 2009. Available online: http://www.dynatest.com/media/4180/3_dynatest_fwd_hwd.pdf (accessed on 3 April 2022).
- AASHTO ME Back-Calculation User Manual, User Manual for Pavement ME Deflection. Data Analysis and Back-Calculation Tool. 2017. Available online: https://me-design.com/MEDesign/data/BcT_UserManual.pdf (accessed on 7 February 2023).
- Maher, A.; Bennert, T.; Gucunski, N. Papp WJ Resilient Modulus Properties of New Jersey Subgrade Soils Publication FHWA-NJ-00-01, F.H.W.A.; US Department of Transportation: Washington, DC, USA, 2000.
- Ng, K.; Henrichs, Z.R.; Ksaibati, K.; Wulff, S.S. Measurement and Estimation of the Resilient Modulus of Subgrade Materials for Mechanistic-Empirical Pavement Design Guide in Wyoming. Compendium of Papers of the 95th TRB Annual Meeting (CD-ROM); Transportation Research Board: Washington, DC, USA, 2016. [Google Scholar]
- Gassman, S.L.; Rahman, M.M. Calibration of the AASHTO Pavement Design Guide to South Carolina Conditions-Phase I; FHWA-SC-16-02; US Department of Transportation: Washington, DC, USA, 2016.
- Rahman, M.M.; Gassman, S.L. Data Collection Experience for Preliminary Calibration of the AASHTO Pavement Design Guide for Flexible Pavements in South Carolina. Int. J. Pavement Res. Technol. 2018, 11, 445–457. [Google Scholar] [CrossRef]
- Rahman, M.M.; Gassman, S.L. Effect of Resilient Modulus of Undisturbed Subgrade Soils on Pavement Rutting. Int. J. Geotech. Eng. 2019, 13, 152–161. [Google Scholar] [CrossRef]
- Fredlund, D.G.; Bergan, A.T.; Wong, P.K. Relation between Resilient Modulus and Stress Research Conditions for Cohesive Subgrade Soils. Transp. Res. Rec. 1977, 642, 73–81. [Google Scholar]
- Drumm, E.C.; Reeves, J.S.; Madgett, M.R.; Trolinger, W.D. Subgrade Resilient Modulus Correction for Saturation Effects. J. Geotech. Geo-Environ. Eng. 1977, 123, 663–670. [Google Scholar] [CrossRef]
- Butalia, T.S.; Huang, J.; Kim, D.G.; Croft, F. Effect of Moisture Content and Pore Water Pressure Build on Resilient Modulus of Cohesive Soils. In Resilient Modulus Testing for Pavement Components, ASTM STP 1437; ASTM International: West Conshohocken, PA, USA, 2003. [Google Scholar]
- Tarefder, R.A.; Ahmed, M.U. Modeling of the FWD deflection basin to evaluate airport pavements. Int. J. Geomech. 2013, 14, 205–213. [Google Scholar] [CrossRef]
- Johnson, A.M. Design of Flexible Pavement Overlays by Dynamic Deflections. Ph.D. Dissertation, University of South Carolina, Columbia, SC, USA, 1992. [Google Scholar]
- Islam, K.M.; Rahman, M.M.; Gassman, S.L. Use of FWD Data to Subdivide Pavement Sections for MEPDG Calibration. In Geo-Congress 2020: Geotechnical Earthquake Engineering and Special Topics; American Society of Civil Engineers: Reston, VA, USA, 2020; pp. 426–435. [Google Scholar]
- Lee, S.W.; Mahoney, J.P.; Jackson, N.C. Verification of Backcalculation of Pavement Moduli. J. Transp. Res. Rec. 1988, 1196, 131–135. [Google Scholar]
- Hossain, M.; Romanoschi, S.; Gisi, A.J. Seasonal and Spatial Variations of Subgrade Response. Geotech. Spec. Publ. 2000, 98, 150–167. [Google Scholar]
Figure 1.
Relationships between Density and Moisture Content.


Figure 2.
CBR With Moisture Content.


Figure 3.
Resilient Modulus Test Results.

Figure 4.
Effects of Moisture Content with Resilient Modulus.

Figure 5.
Resilient Modulus with CBR.


Figure 6.
Relationship between Laboratory and Backcalculated FWD MR.

Figure 7.
Predicted versus Measured Model Coefficients.


Figure 8.
Comparison of Different Models.

Figure 9.
Effects of Subgrade MR on Pavement Rutting: (a) Pavement A, (b) Pavement B, and (c) Pavement C.
Figure 9.
Effects of Subgrade MR on Pavement Rutting: (a) Pavement A, (b) Pavement B, and (c) Pavement C.


Table 1.
Summary of MEPDG Inputs.
| County. | Pavement A | Pavement B | Pavement C | |
|---|---|---|---|---|
| Base Year AADTT | 368 | 720 | 490 | |
| AC Layer and Thickness (mm) | PG 76-22 (96.5) | PG 76-22 (142.2) | PG 76-22 (86.3) | |
| Effective Binder Content (%) | 11.6 | |||
| Air Void (%) | 7 | |||
| Base Layer and Thickness (mm) | Cement Stabilized (152.2) | Graded Aggregate (152.2) | Asphalt Aggregate (147.3) | |
| Base Elastic Modulus, MPa | 6894 | 138 | 6894 | |
| Subgrade Layer and Thickness (mm) | A-3 (semi-infinite) | A-2-4 (semi-infinite) | A-7-6 (semi-infinite) | |
| Subgrade Resilient Modulus, MPa | MR (Lab, Dry) 1 | 114 | 112 | 107 |
| MR (Lab, wopt) 1 | 96 | 77 | 84 | |
| MR (Lab, Wet) 1 | 76 | 45 | 38 | |
| MR (FWD) 2 | 310 | 361 | 190 | |
| MR (Default) 3 | 110 | 124 | 90 | |
Note: 1 Average MR for each site found from repeated load triaxial tests per AASHTO T93 on a remolded sample at 2% dry side of , 2% wet side of . 2 Average back-calculated MR for each site found from FWD tests using the AASHTOWare back-calculation tool (v 1.1.2) [41]. 3 Directly taken from PMED software latest version 2.6.1. For this study, = 2.979 for unbound untreated/stabilized granular base; for subgrade material;, , for asphalt concrete layer. Studies are ongoing to develop the final local calibration coefficients for South Carolina.
Table 2.
Properties of Investigated Soils.
| Site | Bore- Hole No. | Passing No. 200 Sieve (%) | wL (%) | wP (%) | PI (%) | (kN/m3) | Soil Classification | |||
|---|---|---|---|---|---|---|---|---|---|---|
| USCS | AASHTO | |||||||||
| Pavement A | A-1 | 1.5 | NP | NP | NP | 2.65 | 9.3 | 19.5 | SP | A-1-b |
| A-4 | 0.8 | NP | NP | NP | 2.71 | 12.2 | 17 | SP | A-3 | |
| Pavement B | B-3 | 24.7 | 26 | 17 | 9 | 2.66 | 10.1 | 19.8 | SC | A-2-4 |
| B-6 | 20.6 | 18 | 17 | 1 | 2.39 | 10.7 | 19.4 | SM | A-2-4 | |
| B-8 | 22.8 | 20 | 16 | 4 | 2.6 | 10.6 | 19.5 | SC-SM | A-2-4 | |
| Pavement C | C-2 | 43.8 | 45 | 29 | 16 | 2.55 | 15.1 | 17.6 | SM | A-7-6 |
| C-4 | 51.2 | 36 | 26 | 10 | 2.52 | 16.3 | 17.7 | ML | A-4 | |
| C-5 | 44 | 42 | 28 | 14 | 2.51 | 13.8 | 18.5 | SC | A-7-6 | |
Note: wL = liquid limit, wP = plastic limit, PI = plasticity index, = specific gravity of soil, = optimum moisture content, = maximum dry unit weight, NP = Non-plastic.
Table 3.
Resilient Modulus Model Parameters.
| Site | Soil | State | γd (kN/m3) | MC (%) | k1 | k2 | k3 | R2 | MR (MPa) |
|---|---|---|---|---|---|---|---|---|---|
| Pavement A | A-1 (SP/A-1-b) | Dry | 19.01 | 7.8 | 1134 | 0.5054 | −1.3099 | 0.97 | 121 |
| wopt | 19.26 | 9.5 | 777 | 0.3886 | −0.3628 | 0.96 | 89 | ||
| Wet | 18.74 | 11.2 | 449 | 0.3814 | 1.2511 | 0.79 | 62 | ||
| A-4 (SP/A-3) | Dry | 17.04 | 10.3 | 830 | 0.4098 | 0.5921 | 0.99 | 107 | |
| wopt | 17.12 | 11.9 | 763 | 0.5265 | 0.4989 | 0.99 | 103 | ||
| Wet | 16.37 | 13.7 | 694 | 0.4645 | 0.4067 | 0.99 | 90 | ||
| Pavement B | B-3 (SC/A-2-4) | Dry | 19.35 | 8.5 | 1219 | 0.5585 | −1.8260 | 0.92 | 125 |
| wopt | 19.57 | 10.2 | 617 | 0.5820 | −1.7710 | 0.70 | 65 | ||
| Wet | 18.60 | 12.0 | 303 | 0.2642 | 1.6491 | 0.63 | 42 | ||
| B-6 (SM/A-2-4) | Dry | 18.49 | 7.0 | 955 | 0.6050 | −0.7623 | 0.96 | 114 | |
| wopt | 19.04 | 8.9 | 667 | 0.7167 | −0.4379 | 0.97 | 87 | ||
| Wet | 18.68 | 10.5 | 480 | 0.6250 | 0.5291 | 0.86 | 68 | ||
| B-8 (SC-SM/A-2-4) | Dry | 19.45 | 8.0 | 879 | 0.8272 | −2.1703 | 0.96 | 97 | |
| wopt | 19.56 | 9.3 | 617 | 0.6108 | −0.1492 | 0.82 | 79 | ||
| Wet | 18.14 | 11.9 | 188 | 0.7616 | −0.1470 | 0.81 | 26 | ||
| Pavement C | C-2 (SM/A-7-6) | Dry | 17.45 | 13.2 | 1047 | 0.4518 | −3.0797 | 0.95 | 89 |
| wopt | 17.72 | 14.7 | 1147 | 0.4173 | −4.4504 | 0.94 | 81 | ||
| Wet | 17.39 | 16.7 | 292 | 0.4084 | −4.7921 | 0.67 | 20 | ||
| C-4 (ML/A-4) | Dry | 15.39 | 16.9 | 1183 | 0.3862 | −2.1402 | 0.87 | 109 | |
| wopt | 16.24 | 18.1 | 1192 | 0.3151 | −3.1520 | 0.90 | 94 | ||
| Wet | 16.21 | 19.8 | 1037 | 0.4409 | −5.1491 | 0.90 | 68 | ||
| C-5 (SC/A-7-6) | Dry | 18.25 | 11.2 | 1288 | 0.3607 | −1.8520 | 0.85 | 122 | |
| wopt | 18.46 | 13.2 | 1093 | 0.6480 | −5.4391 | 0.94 | 76 | ||
| Wet | 18.08 | 14.3 | 389 | 0.6976 | −6.1519 | 0.87 | 25 |
Table 4.
Developed C factors for Coarse and Fine-Grained Soil Samples.
| Moisture Condition | Coarse-Grained Soils | Fine-Grained Soils | Combined Coarse and Fine-Grained Soils | |||
|---|---|---|---|---|---|---|
| C1 | C2 | C1 | C2 | C1 | C2 | |
| −2% | 0.33 | 3.06 | 0.30 | 3.38 | 0.30 | 3.6 |
| 0.25 | 3.97 | 0.23 | 4.31 | |||
| 0.17 | 5.82 | 0.10 | 9.58 | |||
C1 factor w respect to MR(Lab) to MR(FWD); C2 factor w respect to MR(FWD) to MR(Lab).
Table 5.
Developed Constitutive Models of Coefficients.
| Models | F Value | |
|---|---|---|
) | 0.43 | 3.58 * |
| 0.61 | 6.06 *** | |
| 0.71 | 21.01 *** |
* p < 0.05; ** p < 0.01; *** p < 0.001.
Disclaimer/Publisher’s Note: The statements, opinions and data contained in all publications are solely those of the individual author(s) and contributor(s) and not of MDPI and/or the editor(s). MDPI and/or the editor(s) disclaim responsibility for any injury to people or property resulting from any ideas, methods, instructions or products referred to in the content. |
© 2023 by the authors. Licensee MDPI, Basel, Switzerland. This article is an open access article distributed under the terms and conditions of the Creative Commons Attribution (CC BY) license (https://creativecommons.org/licenses/by/4.0/).
Share and Cite
MDPI and ACS Style
Rahman, M.M.; Gassman, S.L.; Islam, K.M. Effect of Moisture Content on Subgrade Soils Resilient Modulus for Predicting Pavement Rutting. Geosciences 2023, 13, 103. https://doi.org/10.3390/geosciences13040103
AMA Style
Rahman MM, Gassman SL, Islam KM. Effect of Moisture Content on Subgrade Soils Resilient Modulus for Predicting Pavement Rutting. Geosciences. 2023; 13(4):103. https://doi.org/10.3390/geosciences13040103
Chicago/Turabian StyleRahman, Md Mostaqur, Sarah L. Gassman, and Kazi Moinul Islam. 2023. "Effect of Moisture Content on Subgrade Soils Resilient Modulus for Predicting Pavement Rutting" Geosciences 13, no. 4: 103. https://doi.org/10.3390/geosciences13040103
Note that from the first issue of 2016, this journal uses article numbers instead of page numbers. See further details here.