
Managing Persistent Subsolid Nodules in Lung Cancer: Education, Decision Making, and Impact of Interval Growth Patterns
 and
and 
Abstract
:1. Introduction
2. Relevant Sections
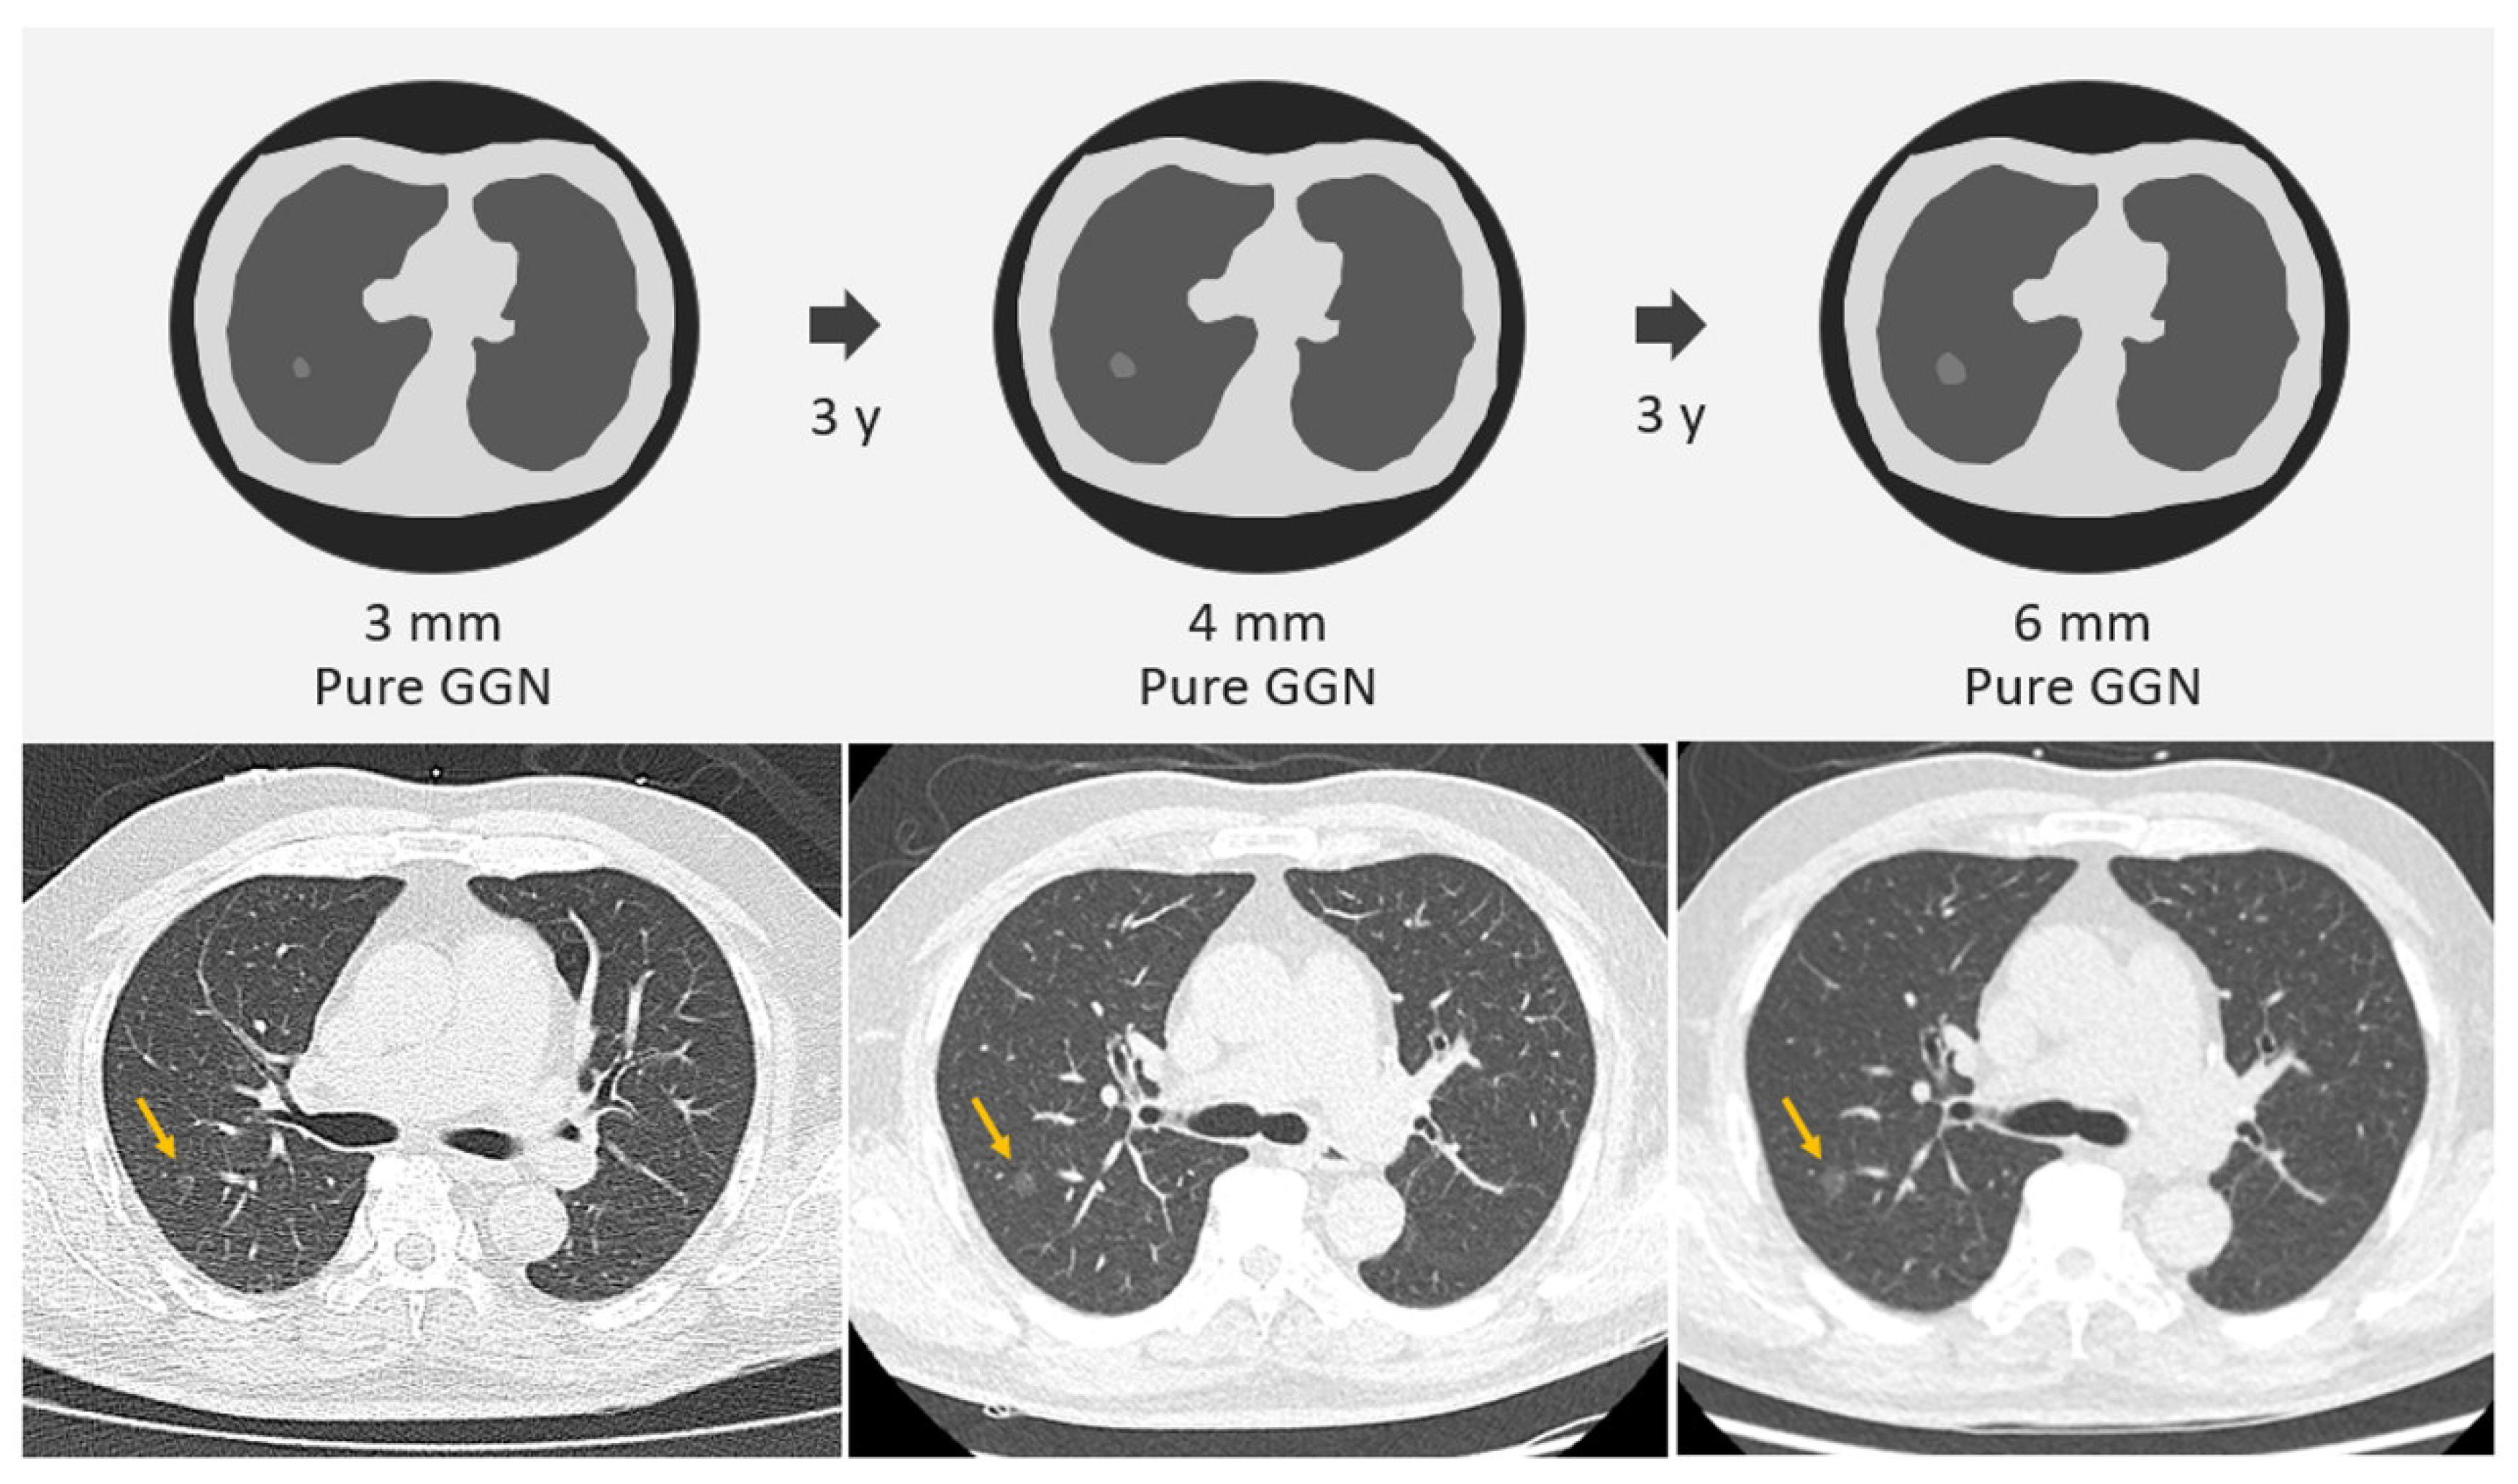
2.1. SSNs Interval Growth with an Increase of ≥2 mm
2.2. SSNs Interval Growth with an Increase of ≥5 mm
2.3. SSNs Interval Growth with Clinical Stage Shift
2.4. SSNs Interval Growth with Volumetric Assessment
2.5. SSNs Interval Growth with Radiomic Assessment
2.6. Summative Umbrella and Narrative Review Approach for SSN Growth
3. Discussion
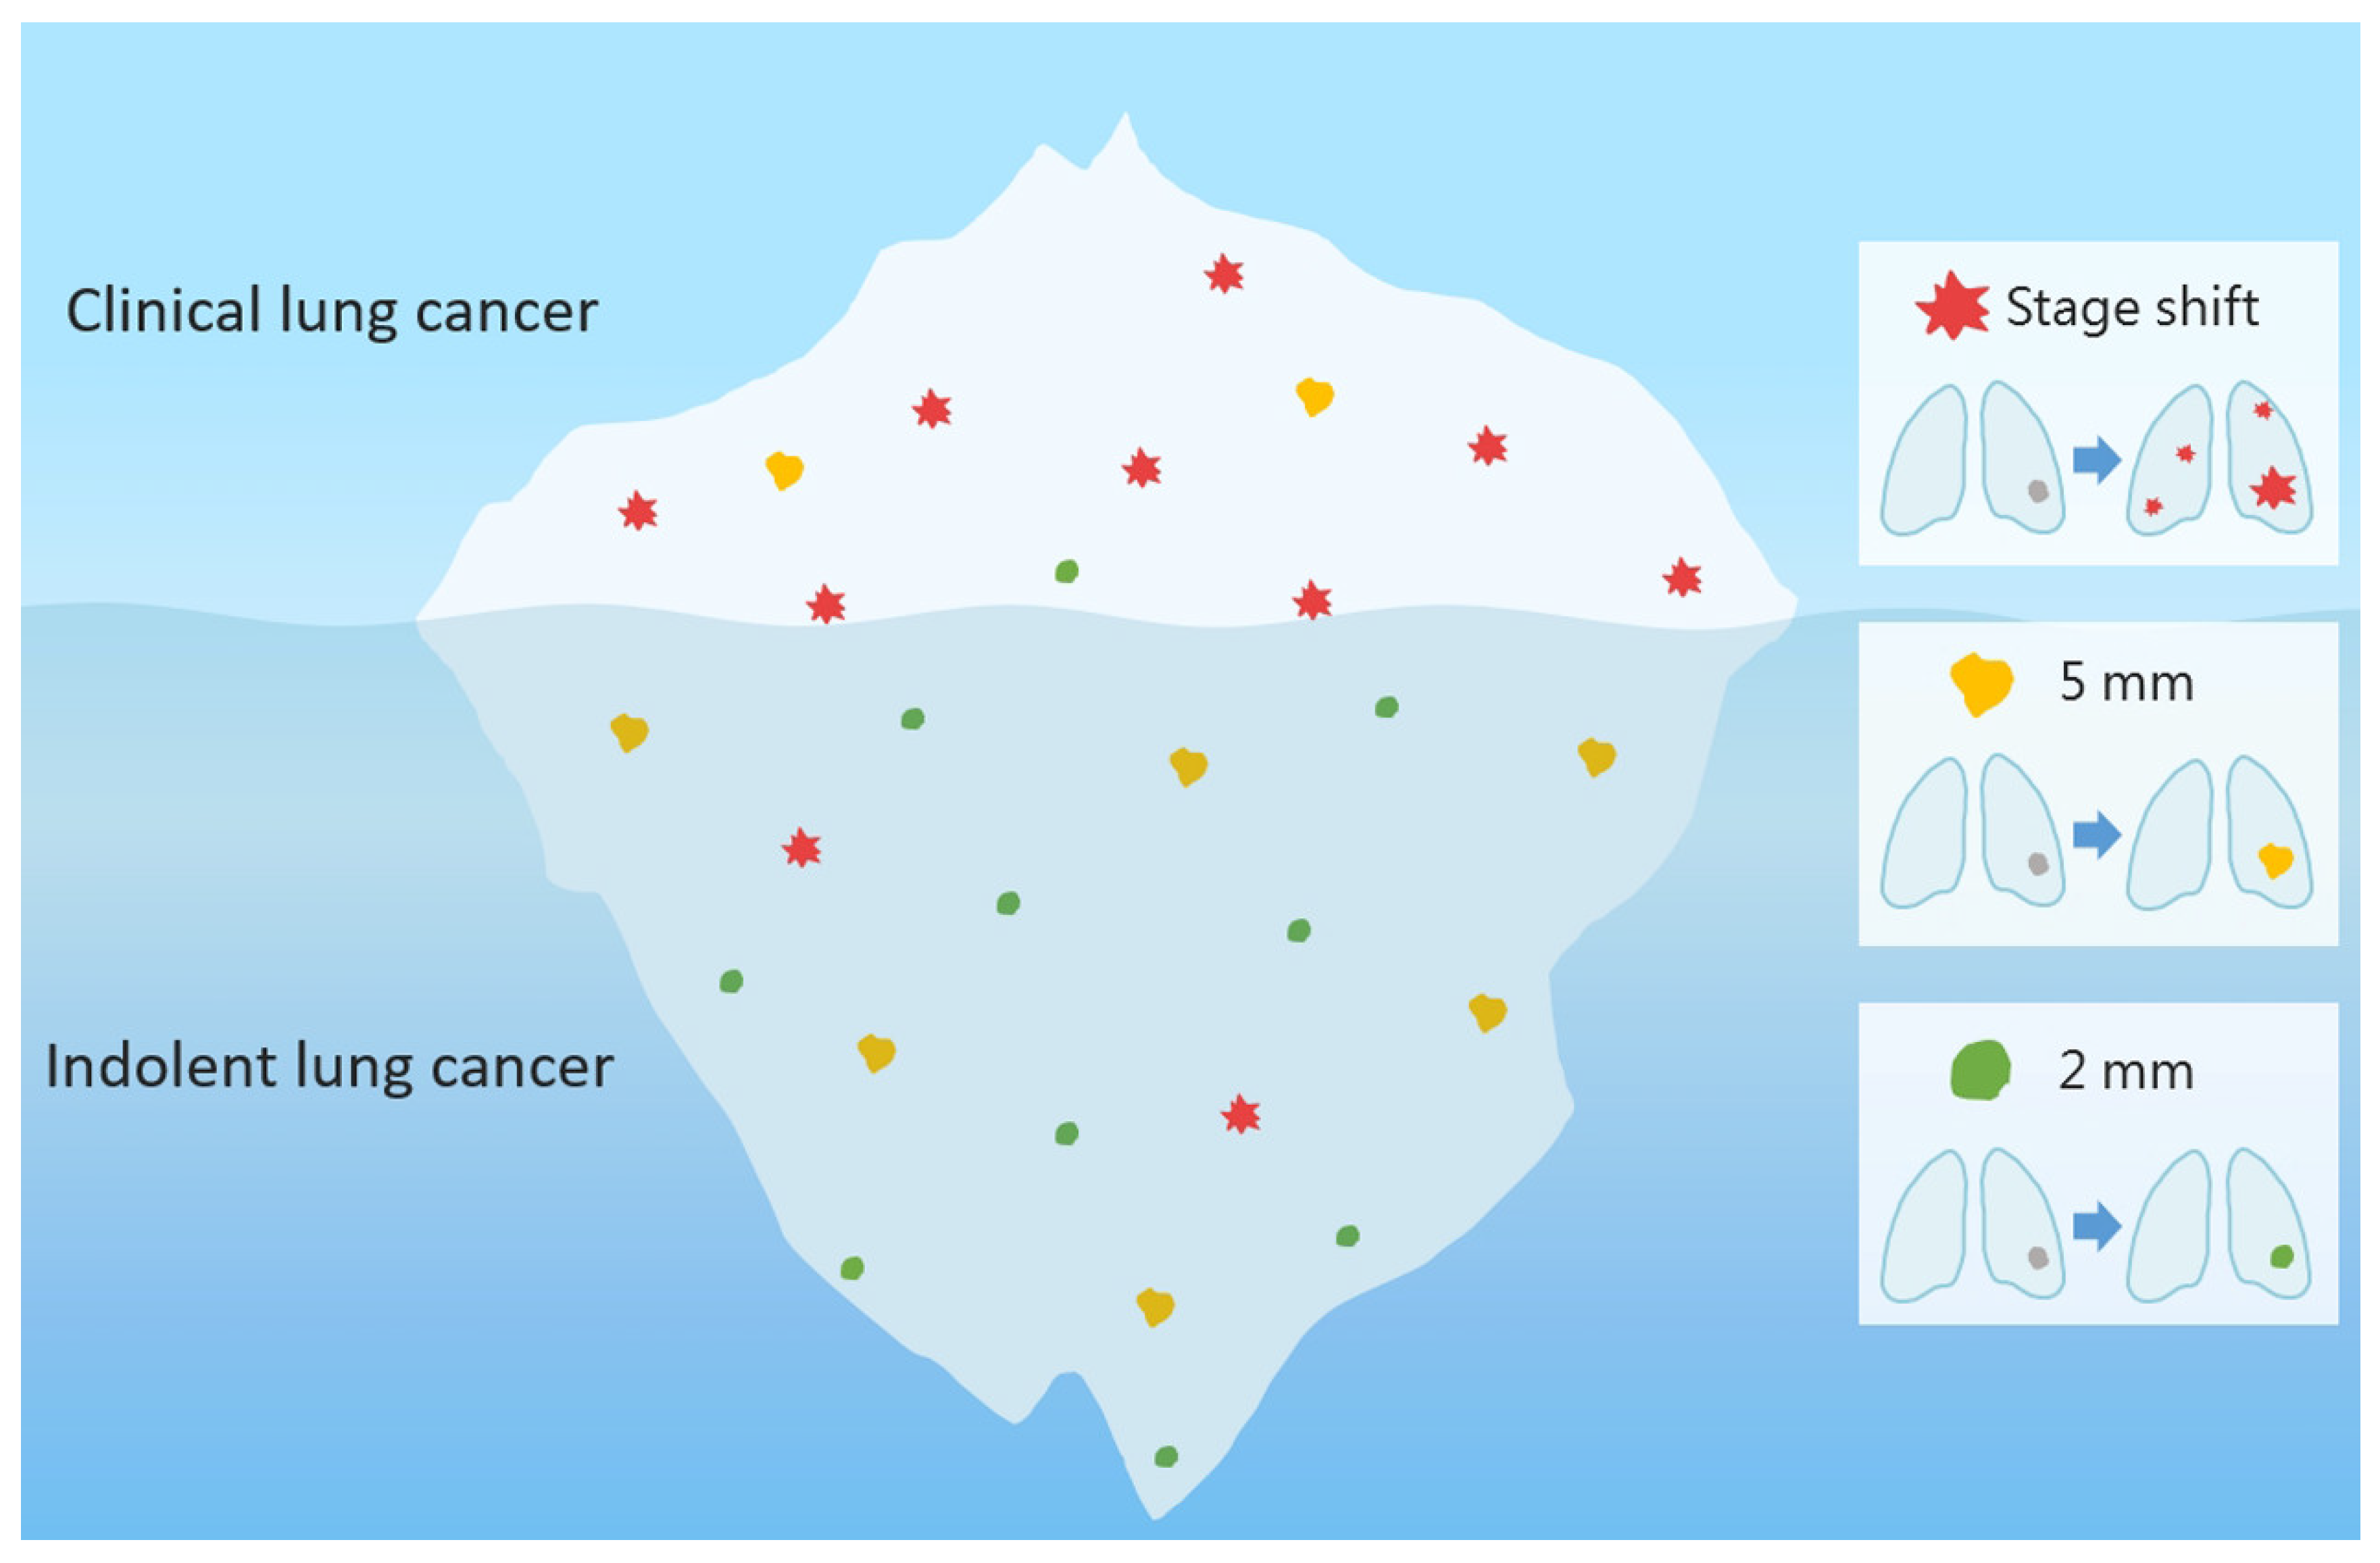
3.1. Overdiagnosis
3.2. Succinct Summary According to Summative Umbrella and Narrative Review
3.3. Future Direction
4. Conclusions
Author Contributions
Funding
Institutional Review Board Statement
Informed Consent Statement
Data Availability Statement
Conflicts of Interest
Abbreviations
| VDT | volume doubling time |
| PACS | picture archiving and communication system |
| SSNs | subsolid nodules |
| AUC | area under the curve |
| GGNs | ground-glass nodules |
| PSNs | part-solid nodules |
| AI | artificial intelligence |
| LDCT | low-dose computed tomography |
References
- Hsu, H.-T.; Tang, E.-K.; Wu, M.-T.; Wu, C.C.; Liang, C.-H.; Chen, C.-S.; Mar, G.-Y.; Lai, R.-S.; Wang, J.-C.; Wu, C.-L.; et al. Modified Lung-RADS Improves Performance of Screening LDCT in a Population with High Prevalence of Non–smoking-related Lung Cancer. Acad. Radiol. 2018, 25, 1240–1251. [Google Scholar] [CrossRef]
- Lee, J.; Kim, Y.; Kim, H.Y.; Goo, J.M.; Lim, J.; Lee, C.-T.; Jang, S.H.; Lee, W.-C.; Lee, C.W.; Choi, K.S.; et al. Feasibility of implementing a national lung cancer screening program: Interim results from the Korean Lung Cancer Screening Project (K-LUCAS). Transl. Lung Cancer Res. 2021, 10, 723–736. [Google Scholar] [CrossRef]
- Wang, M.; Lin, S.; He, N.; Yang, C.; Zhang, R.; Liu, X.; Suo, C.; Lin, T.; Chen, H.; Xu, W. The Introduction of Low-Dose CT Imaging and Lung Cancer Overdiagnosis in Chinese Women. Chest 2023, 163, 239–250. [Google Scholar] [CrossRef]
- Wu, F.Z.; Huang, Y.L.; Wu, C.C.; Tang, E.K.; Chen, C.S.; Mar, G.Y.; Yen, Y.; Wu, M.T. Assessment of Selection Criteria for Low-Dose Lung Screening CT among Asian Ethnic Groups in Taiwan: From Mass Screening to Specific Risk-Based Screening for Non-Smoker Lung Cancer. Clin. Lung Cancer 2016, 17, e45–e56. [Google Scholar] [CrossRef]
- Lin, K.F.; Wu, H.F.; Huang, W.C.; Tang, P.L.; Wu, M.T.; Wu, F.Z. Propensity score analysis of lung cancer risk in a population with high prevalence of non-smoking related lung cancer. BMC Pulm. Med. 2017, 17, 120. [Google Scholar] [CrossRef] [Green Version]
- National Lung Screening Trial Research Team. Reduced Lung-Cancer Mortality with Low-Dose Computed Tomographic Screening. N. Engl. J. Med. 2011, 365, 395–409. [Google Scholar] [CrossRef] [Green Version]
- Bonney, A.; Malouf, R.; Marchal, C.; Manners, D.; Fong, K.M.; Marshall, H.M.; Irving, L.B.; Manser, R. Low-dose computed tomography (LDCT) screening for lung cancer—Related mortality. Cochrane Database Syst. Rev. 2021, 8, CD013829. [Google Scholar] [CrossRef]
- Wu, F.Z.; Huang, Y.L.; Wu, Y.J.; Tang, E.K.; Wu, M.T.; Chen, C.S.; Lin, Y.P. Prognostic effect of implementation of the mass low-dose computed tomography lung cancer screening program: A hospital-based cohort study. Eur. J. Cancer Prev. 2020, 29, 445–451. [Google Scholar] [CrossRef]
- Nawa, T.; Nakagawa, T.; Mizoue, T.; Kusano, S.; Chonan, T.; Fukai, S.; Endo, K. Long-term prognosis of patients with lung cancer detected on low-dose chest computed tomography screening. Lung Cancer 2012, 75, 197–202. [Google Scholar] [CrossRef]
- Gao, W.; Wen, C.P.; Wu, A.; Welch, H.G. Association of Computed Tomographic Screening Promotion with Lung Cancer Overdiagnosis among Asian Women. JAMA Intern. Med. 2022, 182, 283–290. [Google Scholar] [CrossRef]
- Hung, Y.C.; Tang, E.K.; Wu, Y.J.; Chang, C.J.; Wu, F.Z. Impact of low-dose computed tomography for lung cancer screening on lung cancer surgical volume: The urgent need in health workforce education and training. Medicine 2021, 100, e26901. [Google Scholar] [CrossRef]
- Wu, F.-Z.; Chang, Y.-C. Toward More Effective Lung Cancer Risk Stratification to Empower Screening Programs for the Asian Nonsmoking Population. J. Am. Coll. Radiol. 2023, 20, 156–161. [Google Scholar] [CrossRef]
- MacMahon, H.; Naidich, D.P.; Goo, J.M.; Lee, K.S.; Leung, A.N.C.; Mayo, J.R.; Mehta, A.C.; Ohno, Y.; Powell, C.A.; Prokop, M.; et al. Guidelines for Management of Incidental Pulmonary Nodules Detected on CT Images: From the Fleischner Society 2017. Radiology 2017, 284, 228–243. [Google Scholar] [CrossRef] [Green Version]
- Hansell, D.M.; Bankier, A.A.; MacMahon, H.; McLoud, T.C.; Müller, N.L.; Remy, J. Fleischner Society: Glossary of Terms for Thoracic Imaging. Radiology 2008, 246, 697–722. [Google Scholar] [CrossRef] [Green Version]
- Martin, M.D.; Kanne, J.P.; Broderick, L.S.; Kazerooni, E.A.; Meyer, C.A. Lung-RADS: Pushing the Limits. RadioGraphics 2017, 37, 1975–1993. [Google Scholar] [CrossRef] [PubMed]
- Ye, T.; Deng, L.; Xiang, J.; Zhang, Y.; Hu, H.; Sun, Y.; Li, Y.; Shen, L.; Wang, S.; Xie, L.; et al. Predictors of Pathologic Tumor Invasion and Prognosis for Ground Glass Opacity Featured Lung Adenocarcinoma. Ann. Thorac. Surg. 2018, 106, 1682–1690. [Google Scholar] [CrossRef]
- Kim, Y.W.; Kwon, B.S.; Lim, S.Y.; Lee, Y.J.; Park, J.S.; Cho, Y.-J.; Yoon, H.I.; Lee, K.W.; Lee, J.H.; Chung, J.-H.; et al. Lung cancer probability and clinical outcomes of baseline and new subsolid nodules detected on low-dose CT screening. Thorax 2021, 76, 980. [Google Scholar] [CrossRef]
- Borghesi, A.; Michelini, S.; Golemi, S.; Scrimieri, A.; Maroldi, R. What’s New on Quantitative CT Analysis as a Tool to Predict Growth in Persistent Pulmonary Subsolid Nodules? A Literature Review. Diagnostics 2020, 10, 55. [Google Scholar] [CrossRef] [Green Version]
- Travis, W.D.; Brambilla, E.; Noguchi, M.; Nicholson, A.G.; Geisinger, K.R.; Yatabe, Y.; Beer, D.G.; Powell, C.A.; Riely, G.J.; Van Schil, P.E.; et al. International association for the study of lung cancer/american thoracic society/european respiratory society international multidisciplinary classification of lung adenocarcinoma. J. Thorac. Oncol. 2011, 6, 244–285. [Google Scholar] [CrossRef] [Green Version]
- Nicholson, A.G.; Tsao, M.S.; Beasley, M.B.; Borczuk, A.C.; Brambilla, E.; Cooper, W.A.; Dacic, S.; Jain, D.; Kerr, K.M.; Lantuejoul, S.; et al. The 2021 WHO Classification of Lung Tumors: Impact of Advances Since 2015. J. Thorac. Oncol. 2022, 17, 362–387. [Google Scholar] [CrossRef]
- Tang, E.-K.; Chen, C.-S.; Wu, C.C.; Wu, M.-T.; Yang, T.-L.; Liang, H.-L.; Hsu, H.-T.; Wu, F.-Z. Natural History of Persistent Pulmonary Subsolid Nodules: Long-Term Observation of Different Interval Growth. Heart Lung Circ. 2019, 28, 1747–1754. [Google Scholar] [CrossRef]
- Kakinuma, R.; Noguchi, M.; Ashizawa, K.; Kuriyama, K.; Maeshima, A.M.; Koizumi, N.; Kondo, T.; Matsuguma, H.; Nitta, N.; Ohmatsu, H.; et al. Natural History of Pulmonary Subsolid Nodules: A Prospective Multicenter Study. J. Thorac. Oncol. 2016, 11, 1012–1028. [Google Scholar] [CrossRef] [PubMed] [Green Version]
- Pérez-Morales, J.; Lu, H.; Mu, W.; Tunali, I.; Kutuk, T.; Eschrich, S.A.; Balagurunathan, Y.; Gillies, R.J.; Schabath, M.B. Volume doubling time and radiomic features predict tumor behavior of screen-detected lung cancers. Cancer Biomark 2022, 33, 489–501. [Google Scholar] [CrossRef] [PubMed]
- Wu, L.; Gao, C.; Kong, N.; Lou, X.; Xu, M. The long-term course of subsolid nodules and predictors of interval growth on chest CT: A systematic review and meta-analysis. Eur. Radiol. 2022, 33, 2075–2088. [Google Scholar] [CrossRef]
- Lee, H.W.; Jin, K.N.; Lee, J.K.; Kim, D.K.; Chung, H.S.; Heo, E.Y.; Choi, S.H. Long-Term Follow-Up of Ground-Glass Nodules After 5 Years of Stability. J. Thorac. Oncol. 2019, 14, 1370–1377. [Google Scholar] [CrossRef]
- Hiramatsu, M.; Inagaki, T.; Inagaki, T.; Matsui, Y.; Satoh, Y.; Okumura, S.; Ishikawa, Y.; Miyaoka, E.; Nakagawa, K. Pulmonary ground-glass opacity (GGO) lesions-large size and a history of lung cancer are risk factors for growth. J. Thorac. Oncol. 2008, 3, 1245–1250. [Google Scholar] [CrossRef] [Green Version]
- Lee, J.H.; Lim, W.H.; Hong, J.H.; Nam, J.G.; Hwang, E.J.; Kim, H.; Goo, J.M.; Park, C.M. Growth and Clinical Impact of 6-mm or Larger Subsolid Nodules after 5 Years of Stability at Chest CT. Radiology 2020, 295, 448–455. [Google Scholar] [CrossRef]
- Wu, Y.J.; Tseng, J.H.; Liang, C.H.; Tang, E.K.; Wu, F.Z. The fate of subsolid nodule: Predictable or unpredictable? J. Thorac. Dis. 2020, 12, 1118–1120. [Google Scholar] [CrossRef]
- Silva, M.; Sverzellati, N.; Manna, C.; Negrini, G.; Marchianò, A.; Zompatori, M.; Rossi, C.; Pastorino, U. Long-term surveillance of ground-glass nodules: Evidence from the MILD trial. J. Thorac. Oncol. 2012, 7, 1541–1546. [Google Scholar] [CrossRef] [Green Version]
- Chang, B.; Hwang, J.H.; Choi, Y.H.; Chung, M.P.; Kim, H.; Kwon, O.J.; Lee, H.Y.; Lee, K.S.; Shim, Y.M.; Han, J.; et al. Natural history of pure ground-glass opacity lung nodules detected by low-dose CT scan. Chest 2013, 143, 172–178. [Google Scholar] [CrossRef] [Green Version]
- Matsuguma, H.; Mori, K.; Nakahara, R.; Suzuki, H.; Kasai, T.; Kamiyama, Y.; Igarashi, S.; Kodama, T.; Yokoi, K. Characteristics of subsolid pulmonary nodules showing growth during follow-up with CT scanning. Chest 2013, 143, 436–443. [Google Scholar] [CrossRef]
- Lee, S.W.; Leem, C.S.; Kim, T.J.; Lee, K.W.; Chung, J.H.; Jheon, S.; Lee, J.H.; Lee, C.T. The long-term course of ground-glass opacities detected on thin-section computed tomography. Respir. Med. 2013, 107, 904–910. [Google Scholar] [CrossRef] [Green Version]
- Kobayashi, Y.; Fukui, T.; Ito, S.; Usami, N.; Hatooka, S.; Yatabe, Y.; Mitsudomi, T. How long should small lung lesions of ground-glass opacity be followed? J. Thorac. Oncol. 2013, 8, 309–314. [Google Scholar] [CrossRef] [Green Version]
- Eguchi, T.; Kondo, R.; Kawakami, S.; Matsushita, M.; Yoshizawa, A.; Hara, D.; Matsuoka, S.; Takeda, T.; Miura, K.; Agatsuma, H.; et al. Computed tomography attenuation predicts the growth of pure ground-glass nodules. Lung Cancer 2014, 84, 242–247. [Google Scholar] [CrossRef]
- Kobayashi, Y.; Sakao, Y.; Deshpande, G.A.; Fukui, T.; Mizuno, T.; Kuroda, H.; Sakakura, N.; Usami, N.; Yatabe, Y.; Mitsudomi, T. The association between baseline clinical-radiological characteristics and growth of pulmonary nodules with ground-glass opacity. Lung Cancer 2014, 83, 61–66. [Google Scholar] [CrossRef]
- Qiu, Y.; Mao, F.; Zhang, H.; Shen-Tu, Y. Factors Influencing the Progression Trend of Early Lung Cancer and CT Findings. Zhongguo Fei Ai Za Zhi 2018, 21, 793–799. [Google Scholar] [CrossRef]
- Kakinuma, R.; Ashizawa, K.; Kuriyama, K.; Fukushima, A.; Ishikawa, H.; Kamiya, H.; Koizumi, N.; Maruyama, Y.; Minami, K.; Nitta, N.; et al. Measurement of focal ground-glass opacity diameters on CT images: Interobserver agreement in regard to identifying increases in the size of ground-glass opacities. Acad. Radiol. 2012, 19, 389–394. [Google Scholar] [CrossRef]
- Han, D.; Heuvelmans, M.A.; Oudkerk, M. Volume versus diameter assessment of small pulmonary nodules in CT lung cancer screening. Transl. Lung Cancer Res. 2017, 6, 52–61. [Google Scholar] [CrossRef] [Green Version]
- Liang, X.; Liu, M.; Li, M.; Zhang, L. Clinical and CT Features of Subsolid Pulmonary Nodules with Interval Growth: A Systematic Review and Meta-Analysis. Front. Oncol. 2022, 12, 929174. [Google Scholar] [CrossRef]
- Travis, W.D.; Asamura, H.; Bankier, A.A.; Beasley, M.B.; Detterbeck, F.; Flieder, D.B.; Goo, J.M.; MacMahon, H.; Naidich, D.; Nicholson, A.G.; et al. The IASLC Lung Cancer Staging Project: Proposals for Coding T Categories for Subsolid Nodules and Assessment of Tumor Size in Part-Solid Tumors in the Forthcoming Eighth Edition of the TNM Classification of Lung Cancer. J. Thorac. Oncol. 2016, 11, 1204–1223. [Google Scholar] [CrossRef] [Green Version]
- Zhang, Z.; Zhou, L.; Yang, F.; Li, X. The natural growth history of persistent pulmonary subsolid nodules: Radiology, genetics, and clinical management. Front. Oncol. 2022, 12, 1011712. [Google Scholar] [CrossRef]
- Gao, C.; Li, J.; Wu, L.; Kong, D.; Xu, M.; Zhou, C. The Natural Growth of Subsolid Nodules Predicted by Quantitative Initial CT Features: A Systematic Review. Front. Oncol. 2020, 10, 318. [Google Scholar] [CrossRef]
- Wu, F.-Z.; Wu, Y.-J.; Chen, C.-S.; Tang, E.-K. Prediction of Interval Growth of Lung Adenocarcinomas Manifesting as Persistent Subsolid Nodules ≤ 3 cm Based on Radiomic Features. Acad. Radiol. 2023. [Google Scholar] [CrossRef]
- Morgan, H.; O’Dowd, E.L.; Nair, A.; Baldwin, D.R. New fissure-attached nodules in lung cancer screening: More practical implications from the NELSON study? Transl. Lung Cancer Res. 2020, 9, 2161–2164. [Google Scholar] [CrossRef]
- Liu, M.; Wigle, D.; Wampfler, J.A.; Dai, J.; Stoddard, S.M.; Xue, Z.; Nichols, F.C.; Jiang, G.; Yang, P. T category of non-small cell lung cancer invading the fissure to the adjacent lobe. J. Thorac. Cardiovasc. Surg. 2017, 154, 1777–1783.e1773. [Google Scholar] [CrossRef]
- Van Schil, P.E. Non-small cell lung cancer transgressing an adjacent fissure: Does one T category fit all? J. Thorac. Dis. 2018, 10, S3290–S3291. [Google Scholar] [CrossRef]
- Song, Y.S.; Park, C.M.; Park, S.J.; Lee, S.M.; Jeon, Y.K.; Goo, J.M. Volume and mass doubling times of persistent pulmonary subsolid nodules detected in patients without known malignancy. Radiology 2014, 273, 276–284. [Google Scholar] [CrossRef]
- Qi, L.L.; Wu, B.T.; Tang, W.; Zhou, L.N.; Huang, Y.; Zhao, S.J.; Liu, L.; Li, M.; Zhang, L.; Feng, S.C.; et al. Long-term follow-up of persistent pulmonary pure ground-glass nodules with deep learning-assisted nodule segmentation. Eur. Radiol. 2020, 30, 744–755. [Google Scholar] [CrossRef]
- Xu, X.; Wu, K.; Zhao, Y.; Mei, L. Stage I lung adenocarcinoma: The value of quantitative CT in differentiating pathological subtypes and predicting growth of subsolid nodules. Medicine 2017, 96, e6595. [Google Scholar] [CrossRef]
- Shin, K.E.; Lee, K.S.; Yi, C.A.; Chung, M.J.; Shin, M.H.; Choi, Y.H. Subcentimeter lung nodules stable for 2 years at LDCT: Long-term follow-up using volumetry. Respirology 2014, 19, 921–928. [Google Scholar] [CrossRef]
- Scholten, E.T.; de Jong, P.A.; de Hoop, B.; van Klaveren, R.; van Amelsvoort-van de Vorst, S.; Oudkerk, M.; Vliegenthart, R.; de Koning, H.J.; van der Aalst, C.M.; Vernhout, R.M.; et al. Towards a close computed tomography monitoring approach for screen detected subsolid pulmonary nodules? Eur. Respir. J. 2015, 45, 765–773. [Google Scholar] [CrossRef]
- He, Y.; Xiong, Z.; Tian, D.; Zhang, J.; Chen, J.; Li, Z. Natural progression of persistent pure ground-glass nodules 10 mm or smaller: Long-term observation and risk factor assessment. Jpn. J. Radiol. 2023, 41, 605–616. [Google Scholar] [CrossRef]
- Shewale, J.B.; Nelson, D.B.; Rice, D.C.; Sepesi, B.; Hofstetter, W.L.; Mehran, R.J.; Vaporciyan, A.A.; Walsh, G.L.; Swisher, S.G.; Roth, J.A.; et al. Natural History of Ground-Glass Lesions among Patients with Previous Lung Cancer. Ann. Thorac. Surg. 2018, 105, 1671–1677. [Google Scholar] [CrossRef] [Green Version]
- De Margerie-Mellon, C.; Gill, R.R.; Monteiro Filho, A.C.; Heidinger, B.H.; Onken, A.; VanderLaan, P.A.; Bankier, A.A. Growth Assessment of Pulmonary Adenocarcinomas Manifesting as Subsolid Nodules on CT: Comparison of Diameter-Based and Volume Measurements. Acad. Radiol. 2020, 27, 1385–1393. [Google Scholar] [CrossRef]
- Oudkerk, M.; Devaraj, A.; Vliegenthart, R.; Henzler, T.; Prosch, H.; Heussel, C.P.; Bastarrika, G.; Sverzellati, N.; Mascalchi, M.; Delorme, S.; et al. European position statement on lung cancer screening. Lancet Oncol. 2017, 18, e754–e766. [Google Scholar] [CrossRef]
- Han, D.; Heuvelmans, M.A.; Vliegenthart, R.; Rook, M.; Dorrius, M.D.; de Jonge, G.J.; Walter, J.E.; van Ooijen, P.M.A.; de Koning, H.J.; Oudkerk, M. Influence of lung nodule margin on volume- and diameter-based reader variability in CT lung cancer screening. Br. J. Radiol. 2018, 91, 20170405. [Google Scholar] [CrossRef] [Green Version]
- Xie, X.; Zhao, Y.; Snijder, R.A.; van Ooijen, P.M.; de Jong, P.A.; Oudkerk, M.; de Bock, G.H.; Vliegenthart, R.; Greuter, M.J. Sensitivity and accuracy of volumetry of pulmonary nodules on low-dose 16- and 64-row multi-detector CT: An anthropomorphic phantom study. Eur. Radiol. 2013, 23, 139–147. [Google Scholar] [CrossRef] [Green Version]
- Lee, J.H.; Hwang, E.J.; Lim, W.H.; Goo, J.M. Determination of the optimum definition of growth evaluation for indeterminate pulmonary nodules detected in lung cancer screening. PLoS ONE 2022, 17, e0274583. [Google Scholar] [CrossRef]
- Gao, C.; Yan, J.; Luo, Y.; Wu, L.; Pang, P.; Xiang, P.; Xu, M. The Growth Trend Predictions in Pulmonary Ground Glass Nodules Based on Radiomic CT Features. Front. Oncol. 2020, 10, 580809. [Google Scholar] [CrossRef]
- Sun, Y.; Ma, Z.; Zhao, W.; Jin, L.; Gao, P.; Wang, K.; Huang, X.; Duan, S.; Li, M. Computed tomography radiomics in growth prediction of pulmonary ground-glass nodules. Eur. J. Radiol. 2022, 159, 110684. [Google Scholar] [CrossRef]
- Yoon, H.J.; Park, H.; Lee, H.Y.; Sohn, I.; Ahn, J.; Lee, S.H. Prediction of tumor doubling time of lung adenocarcinoma using radiomic margin characteristics. Thorac. Cancer 2020, 11, 2600–2609. [Google Scholar] [CrossRef] [PubMed]
- Tan, M.; Ma, W.; Sun, Y.; Gao, P.; Huang, X.; Lu, J.; Chen, W.; Wu, Y.; Jin, L.; Tang, L.; et al. Prediction of the Growth Rate of Early-Stage Lung Adenocarcinoma by Radiomics. Front. Oncol. 2021, 11, 658138. [Google Scholar] [CrossRef]
- Wu, Y.J.; Wu, F.Z.; Yang, S.C.; Tang, E.K.; Liang, C.H. Radiomics in Early Lung Cancer Diagnosis: From Diagnosis to Clinical Decision Support and Education. Diagnostics 2022, 12, 1064. [Google Scholar] [CrossRef]
- Moskowitz, C.S.; Welch, M.L.; Jacobs, M.A.; Kurland, B.F.; Simpson, A.L. Radiomic Analysis: Study Design, Statistical Analysis, and Other Bias Mitigation Strategies. Radiology 2022, 304, 265–273. [Google Scholar] [CrossRef] [PubMed]
- Nardone, V.; Reginelli, A.; Grassi, R.; Boldrini, L.; Vacca, G.; D’Ippolito, E.; Annunziata, S.; Farchione, A.; Belfiore, M.P.; Desideri, I.; et al. Delta radiomics: A systematic review. La Radiol. Medica 2021, 126, 1571–1583. [Google Scholar] [CrossRef] [PubMed]
- Altorki, N.K.; Markowitz, G.J.; Gao, D.; Port, J.L.; Saxena, A.; Stiles, B.; McGraw, T.; Mittal, V. The lung microenvironment: An important regulator of tumour growth and metastasis. Nat. Rev. Cancer 2019, 19, 9–31. [Google Scholar] [CrossRef] [Green Version]
- Lee, G.; Park, H.; Bak, S.H.; Lee, H.Y. Radiomics in Lung Cancer from Basic to Advanced: Current Status and Future Directions. Korean J. Radiol. 2020, 21, 159–171. [Google Scholar] [CrossRef]
- Wu, F.-Z.; Wu, Y.-J.; Tang, E.-K. An integrated nomogram combined semantic-radiomic features to predict invasive pulmonary adenocarcinomas in subjects with persistent subsolid nodules. Quant. Imaging Med. Surg. 2022, 13, 654–668. [Google Scholar] [CrossRef]
- Bastos, P.A.D.; Barbosa, R. The tip of the iceberg for diagnostic dilemmas: Performance of current diagnostics and future complementary screening approaches. Eur. J. Med. Genet 2020, 63, 104089. [Google Scholar] [CrossRef]
- Wilson, D.O.; Ryan, A.; Fuhrman, C.; Schuchert, M.; Shapiro, S.; Siegfried, J.M.; Weissfeld, J. Doubling times and CT screen–detected lung cancers in the Pittsburgh Lung Screening Study. Am. J. Respir. Crit. Care Med. 2012, 185, 85–89. [Google Scholar] [CrossRef] [Green Version]
- Last, J.M.; Adelaide, D.P. The iceberg: ‘completing the clinical picture’ in general practice. 1963. Int. J. Epidemiol. 2013, 42, 1608–1613. [Google Scholar] [CrossRef] [PubMed]
- Welch, H.G.; Black, W.C. Overdiagnosis in cancer. J. Natl. Cancer Inst. 2010, 102, 605–613. [Google Scholar] [CrossRef] [PubMed] [Green Version]
- Healey, T.T.; Shepard, J.-A.O. Biopsy of Subsolid Nodules Suspicious for Adenocarcinoma: Point—CT-Guided Biopsy of Subsolid Nodules Is a Safe and Effective Means to Establish a Definitive Preoperative Diagnosis. Am. J. Roentgenol. 2021, 217, 813–814. [Google Scholar] [CrossRef] [PubMed]
- Kiranantawat, N.; McDermott, S.; Petranovic, M.; Mino-Kenudson, M.; Muniappan, A.; Sharma, A.; Shepard, J.O.; Digumarthy, S.R. Determining malignancy in CT guided fine needle aspirate biopsy of subsolid lung nodules: Is core biopsy necessary? Eur. J. Radiol. Open 2019, 6, 175–181. [Google Scholar] [CrossRef] [PubMed] [Green Version]
- Silva, M.; Prokop, M.; Jacobs, C.; Capretti, G.; Sverzellati, N.; Ciompi, F.; van Ginneken, B.; Schaefer-Prokop, C.M.; Galeone, C.; Marchianò, A.; et al. Long-Term Active Surveillance of Screening Detected Subsolid Nodules is a Safe Strategy to Reduce Overtreatment. J. Thorac. Oncol. 2018, 13, 1454–1463. [Google Scholar] [CrossRef] [Green Version]
- Ricciardi, S.; Booton, R.; Petersen, R.H.; Infante, M.; Scarci, M.; Veronesi, G.; Cardillo, G. Managing of screening-detected sub-solid nodules-a European perspective. Transl. Lung Cancer Res. 2021, 10, 2368–2377. [Google Scholar] [CrossRef]


| 1st Author, Year | Type | Enrolled Studies | Sample Size | Purpose | Main Findings | Limitations |
|---|---|---|---|---|---|---|
| Chen Gao, 2020 [59] | Systematic review | n = 10 | 850 | Association between quantitative features of initial CT imaging and interval natural growth of SSNs to explore the potential risk factors. | CT attenuation in predicting the natural growth of SSNs. | 1. Small sample size. 2. Regarding the variable inclusion criteria among studies. 3. Length of follow up varied. |
| Zhedong Zhang, 2022 [41] | Narrative review | N/A | N/A | Briefly describe and review the differential diagnosis, growth patterns and rates, genetic characteristics, and factors that influence the growth of persistent SSNs. | Predicting and quantitatively evaluating the growth of GGNs based on clinical and imaging feature data can provide a reference for the formulation of clinical diagnosis and treatment strategies for GGNs. | Liquid biopsy, multi-omics, and delta-radiomics prediction model development for further research direction. |
| Linyu Wu, 2022 [24] | Systematic review and meta-analysis | n = 16 | 2898 (available SSNs) | To estimate the incidence of interval growth after long-term follow up and identify the predictors of interval growth in SSNs on chest CT. | The pooled incidence of SSN growth was 22%, with a 26% incidence for pure GGNs. | The heterogeneity of SSNs in the included studies was high. |
| Xin Liang, 2022 [39] | Systematic review and meta-analysis | n = 19 | 2444 (3012 SSNs) | To identify clinical and CT risk features correlated with SSN interval growth. | Male sex, history of lung cancer, nodule size > 10 mm, nodule consistency, and age > 65 y were identified as independent risk factors for SSN growth. | 1. The patients in the included studies were not completely homogenous. 2. Most of the features had no multivariate analysis. |
Disclaimer/Publisher’s Note: The statements, opinions and data contained in all publications are solely those of the individual author(s) and contributor(s) and not of MDPI and/or the editor(s). MDPI and/or the editor(s) disclaim responsibility for any injury to people or property resulting from any ideas, methods, instructions or products referred to in the content. |
© 2023 by the authors. Licensee MDPI, Basel, Switzerland. This article is an open access article distributed under the terms and conditions of the Creative Commons Attribution (CC BY) license (https://creativecommons.org/licenses/by/4.0/).
Share and Cite
Liu, Y.-C.; Liang, C.-H.; Wu, Y.-J.; Chen, C.-S.; Tang, E.-K.; Wu, F.-Z. Managing Persistent Subsolid Nodules in Lung Cancer: Education, Decision Making, and Impact of Interval Growth Patterns. Diagnostics 2023, 13, 2674. https://doi.org/10.3390/diagnostics13162674
Liu Y-C, Liang C-H, Wu Y-J, Chen C-S, Tang E-K, Wu F-Z. Managing Persistent Subsolid Nodules in Lung Cancer: Education, Decision Making, and Impact of Interval Growth Patterns. Diagnostics. 2023; 13(16):2674. https://doi.org/10.3390/diagnostics13162674
Chicago/Turabian StyleLiu, Yung-Chi, Chia-Hao Liang, Yun-Ju Wu, Chi-Shen Chen, En-Kuei Tang, and Fu-Zong Wu. 2023. "Managing Persistent Subsolid Nodules in Lung Cancer: Education, Decision Making, and Impact of Interval Growth Patterns" Diagnostics 13, no. 16: 2674. https://doi.org/10.3390/diagnostics13162674