Article

Effect of a SO2 Rich Atmosphere on Tempera Paint Mock-Ups. Part 2: Accelerated Aging of Azurite- and Malachite-Based Paints

1
Departamento de Enxeñaría de Recursos Naturais e Medio Ambiente, Universidade de Enxeñaría de Minas e Enerxía, Universidade de Vigo, 36310 Vigo, Spain
2
Department of Mineralogy and Petrology, Faculty of Science, University of Granada, 18071 Granada, Spain
3
CERENA, Instituto Superior Técnico, Universidade de Lisboa. Av. Rovisco Pais, 1049-001 Lisboa, Portugal
*
Author to whom correspondence should be addressed.
Minerals 2020, 10(5), 424; https://doi.org/10.3390/min10050424
Submission received: 1 April 2020 / Revised: 1 May 2020 / Accepted: 3 May 2020 / Published: 10 May 2020
(This article belongs to the Special Issue Historical Mineral Pigments)

Abstract

:
In order to improve our knowledge of the weathering response of tempera paints exposed to an industrial atmosphere, azurite- and malachite-based paint mock-ups prepared with either rabbit glue or egg yolk binders were artificially aged in an SO2 rich atmosphere. The aim was to identify the different alteration mechanisms and forms of degradation in the paints by observing their physical (color, gloss, reflectance, and roughness), mineralogical, chemical, and micro-textural characteristics. Superficial physical changes were evaluated by stereomicroscopy, spectrophotometry, gloss measurement, hyperspectral imaging, and roughness measurements. Chemical and mineralogical changes were evaluated by X-ray diffraction (XRD), Fourier transform infrared spectroscopy (FTIR), and scanning electron microscopy with microanalysis (SEM-EDS), which was also used to evaluate the micro-texture of the paints. The differences between the fresh temperas were due mainly to the binder (egg yolk or rabbit glue) used in the paint mixture, which also played a crucial role in the different deterioration patterns in the artificially aged paint mock-ups. Thus, the egg yolk-based paints remained physically quite intact after SO2 exposure, although they suffered more significant chemical degradation, above all in the form of copious precipitation of Cu and Ca-rich sulfate salts and the subsequent yellowing of the egg yolk binder. The SO2 aged rabbit glue-based mock-ups showed microscopically important crack formation and binder loss and fewer sulfated salts precipitated on the surface of the paints.

1. Introduction

In order to design preventive conservation strategies to protect polychrome artworks and historical paintings, paint mock-ups are used to evaluate the damage caused by different agents such as relative humidity, (solar/artificial) irradiation, and atmospheric gases including pollutants (ozone, nitrogen oxides, carbon dioxide, and sulfur dioxide) among others [1,2,3,4,5,6,7,8,9,10]. In the specific field of atmospheric contaminants, artificial aging tests have produced important findings regarding the interaction between model tempera paints and gases such as ozone, nitric acid, and nitrogen [8,11,12]. Despite the fact that the concentration of SO2 gas in the atmosphere has been reduced in some regions of Europe in recent years due to European guidelines [13], its damaging effects on other materials used in cultural heritage, such as building stone, are still apparent in polluted metropolitan areas [14]. When the construction materials (stones, bricks, mortars, etc.) used in historic monuments are exposed to SO2, oxidation occurs, producing one of the most serious forms of alteration, i.e., black gypsum crusts. These processes have been widely studied in both carbonate sedimentary rocks and granites [15,16,17], and it seems likely that this gas would have even more harmful effects on more sensitive artistic materials such as tempera paints. The interaction between SO2 and tempera paints should therefore be investigated in order to develop preventive conservation strategies to protect these artworks.
As tempera paints are made by mixing inorganic pigments with a proteinaceous binder (e.g., egg yolk or rabbit glue) [18], the damage caused to them by atmospheric gases such as SO2 must be studied from different perspectives, focusing on the changes induced by the pigments, those related with the binder and those produced by binder-pigment interaction. The literature reports that the appearance and surface finish of fresh unaltered tempera paints varied depending on the type of pigment used, the pigment particle size and the type and amount of binder present in the paints, as all these factors influenced the color of the paint and the roughness of its surface [19,20,21,22]. Other recent research has reported that the impurities found in the historic mineral pigments used in tempera paints might significantly alter their optical, chemical, and physical properties [22,23,24]. Although some research has been conducted on aged tempera paint mock-ups mainly exposed to artificial UV light and outdoor atmosphere, including direct sunlight radiation, very little work has been done on the effects of impurities and pigment grain size on their weathering processes [21,25,26]. Herrera et al. [10] examined accelerated lime-based paint mock-ups and reported the importance of the mineralogical composition of the pigments (including impurities) and the specific surface area of the paint related to the binder. They also noted the role of pigment grain size in the susceptibility of the paint to sulfation, such that pigments containing portlandite–Ca(OH2)–sulfated faster than pigments only containing calcite (CaCO3).
The pigments studied in this present paper are azurite (Cu3(CO3)2(OH)2 and malachite (Cu2CO3(OH)2). Both are hydrated copper carbonates used as blue and green pigments, respectively [27]. Both these natural pigments usually contain impurities of other minerals such as calcite, haematite (Fe2O3), goethite α-FeO(OH), quartz (SiO2), cuprite (Cu2O), rutile/anatase (TiO2), and chrysocolle ((Cu,Al)2H2Si2O5(OH)4·nH2O, found with malachite), as well as trace elements including arsenic (As), zirconium (Zr), antimony (Sb), barium (Ba), zinc (Zn), and bismuth (Bi) [28,29,30]. In fact, the particular mineral composition of natural azurite and malachite varies significantly between artworks produced at different times and places, and may be related to provenance [30]. In addition to the mineralogy, the pigment grain size also influences the color and other superficial physical properties, as demonstrated for azurite in several scientific papers [22,31]. These studies also highlighted the importance of the binder (type and content) on the physical properties of the paint. Therefore, the mineralogy, pigment grain size and the type and content of binder should be evaluated to understand the deterioration processes that take place in tempera paints under different decay scenarios.
Azurite is formed from cupric-ion-bearing solutions under relatively acid conditions and relatively high carbonate activity, while malachite is a more common form of copper carbonate under ambient conditions [32]. Malachite may pseudomorph after azurite; thus malachite maintains the same external form as the original azurite crystal, but the unit cells of azurite are gradually replaced by those of malachite. In aqueous systems, CO32− and HCO3 activities (and Cu2+ activity to a lesser extent) define the stability of both azurite and malachite minerals [32]. In the field of tempera paint conservation, it has been proved that exposure to UV light can transform azurite into malachite as detected via grains with an intermediate chemical composition between both phases [21]. Also, the exposure of historical azurite tempera paints to chloride-rich water (like those of rivers or sea floods) can lead to precipitation of green paratacamite ((Cu2+)3(Cu,Zn)(OH)6Cl2) [33]. The treatment of such damaged azurite tempera paints with ammonium carbonate and barium hydroxide (both well-known chemical reagents used in the restoration of mural paintings) can also yield the precipitation of black copper species such as copper hydroxide or basic copper chloride [33]. Black colored tenorite (CuO) was the final product of the reaction between malachite and azurite with alkaline solutions in laboratory conditions [34]. As regards artificial aging of azurite due to SO2 exposure, to the knowledge of the authors, only one research study has so far been carried out. In the cited study, the effect on egg yolk-based azurite paint mock-ups of exposure to a mixture of 10.2 ppm SO2, 11.4 ppm NO, and 5.2 ppm NO2 was evaluated over 4 days (23 °C and 55% RH) [7]: the authors detected the formation of inorganic compounds such as nitrates (NO3), nitrites (NO2), and sulfates (SO42−).
This work is part of a two-part research series entitled Effect of a SO2 rich atmosphere on tempera paint mock-ups. Part 1 is entitled Accelerated aging of smalt- and lapis lazuli-based paints, while this paper, Part 2, studies azurite- and malachite-based paints, made by mixing one of the pigments with either egg yolk or rabbit glue binder, which were then exposed to SO2 for two months in order to examine the effect of this gas pollutant on the physical-chemical properties of the paints. We studied the physical (color, gloss, reflectance, and roughness values), mineralogical (XRD), molecular (FTIR), and chemical, micro-textural, and micro-morphological (SEM-EDS) characteristics of fresh and aged paint mock-ups in order to detect evidence of sulfation leading to the formation of new minerals in the paints.

2. Materials and Methods

2.1. Tempera Paint Mock-ups

Azurite (AZ hereafter) with five different grain sizes and malachite (MAL hereafter) with one grain size (Table 1) were used to prepare tempera mock-ups by mixing one of the pigments with a proteinaceous binder, i.e., egg yolk denoted E hereafter (composed of albumin, ovalbumin, carbohydrates, lipids, and fatty acids) obtained from eggs purchased locally, or rabbit glue (R hereafter) from Kremer Pigments GmbH & Co. (Aichstetten, Germany, collagen pearls, ref. 63028). The lipids present in egg yolk are triglycerides (neutral lipids), phospholipids, cholesterol, and fatty acids (saturated 38%, monounsaturated 42% and polyunsaturated 20%) [35]. Both binders are barely acidic: egg yolk has a pH of 6.4 [36] and rabbit glue has a pH of 5.8 [24].
All the pigments were supplied by Kremer Pigments GmbH & Co. KG (Aichstetten, Germany). Table 1 shows the commercial name, the mineralogical composition according to Kremer, and the mineralogical composition and grain sizes as determined by the authors [22]. Five azurite pigments were selected for this work. According to the information provided by the supplier, four of these (extra coarse: AZ-EC, coarse: AZ-C, medium: AZ-M, extra-fine: AZ-EF, named by the authors) were prepared using the Michel Price (MP) method, while the fifth is an azurite natural standard (ST). There is no mention of this latter being prepared using the MP method. Only one malachite pigment was used: malachite natural standard (MAL). The MP method consists of consecutive washing of the pigments in an egg yolk medium followed by grain size classification according to Stoke’s Law [37]. In this way, grains of classified pigments surrounded by a protein coating were obtained [19]. When analyzing these same commercial pigments, Cardell et al. [21] found that the egg yolk content added to AZ-EC, AZ-C, AZ-M, and AZ-EF due to the MP process ranged from 2 wt% to 3.5 wt%, whereas the egg yolk content in AZ-ST was significantly higher (10.5 wt%).
The tempera mock-ups were prepared by mixing one of the pigments and one of the binders according to Old Master recipes [38]. The procedure for the egg yolk-based paints can be consulted in [39] and that for the rabbit glue-based paints in [21]. The pigment-binder mixture (i.e., the tempera paint) was applied onto glass slides (ca. 76 mm × 26 mm × 1 mm) using a paintbrush; several layers were applied (once the previous layer was completely dry) in order to ensure that the substrate was well covered. Paints were applied on glass slides in order to use a simple and homogeneous substrate in composition and physical properties (porosity, roughness, etc.) to avoid the introduction into the system of variables difficult to control that could influence the behavior of the paint to the accelerated aging test. The tempera mock-ups obtained were identified by writing first the pigment letter followed by the binder letter (i.e., E or R). They were then stored under laboratory-controlled conditions (18 ± 5 °C; 60 ± 10% RH) for 1 month. Afterwards, each paint mock-up was divided into two pieces measuring 38 mm × 26 mm × 1 mm; one piece was used for the SO2 accelerating aging test and the other piece was stored untested under the aforementioned laboratory conditions for reference purposes. These paint mock-ups were distinguished by adding Ref to the names of the fresh untested paints and by adding SO2 to the names of the aged paints. Note that the mock-ups solely made with binder are the same ones prepared and studied in the work: Effect of a SO2 rich atmosphere on tempera paint mock-ups. Part 1: Accelerated aging of smalt- and lapis lazuli-based paints [40], which is published also in this Special Issue.

2.2. SO2 Accelerated Aging Test

The accelerated aging test by SO2 exposure was performed using a FITOCLIMA 300EDTU climatic chamber (25 °C; 45% RH) with SO2 exposure in the Instituto Superior Tecnico in Lisbon (Portugal). SO2 was diluted at 3% in 3000 ppm of nitrogen and dosed at a concentration of 200 ppm, which is 250,000 times higher than current SO2 levels in most European cities (average value 0.00076 ppm) [41]. This high SO2 concentration compared to the current atmospheric concentration was used to accelerate the aging of the model paints and to define a worst-case scenario. The paint mock-ups were stored inside the chamber for two months.
The water used in the test chamber to produce the RH (45%) was analyzed by high-resolution liquid chromatography (HRLC) (Metrohm instrument with Metrosep A Supp5-250 column, Metrohm, Herisau, Switzerland) and the ICP-OES (inductively coupled plasma-optical emission spectrometry) technique (Perkin Elmer Optima 4300 DV ICP-EPS, PerkinElmer, Waltham, MA, USA) and was found to have the following composition: 15.8 mg/L Cl, <0.05 mg/L NO2, 2.15 mg/L NO3, 23.7 mg/L SO42−, 0.017 mg/L Ba2+, 17.35 mg/L Ca2+, 2.37 mg/L K+, 3.74 mg/L Mg2+, and 13.18 mg/L Na2+.

2.3. Analytical Methods

A multi-analytical approach was applied to determine the changes that take place in the azurite and malachite-based tempera mock-ups due to SO2 exposure.
Firstly, the reference (fresh) and aged samples were visualized using a stereomicroscope (SMZ 1000, Nikon, Brighton, MI, USA) to examine the possible textural and chromatic changes.
The mineralogical composition of fresh and aged mock-ups was studied by means of X-ray diffraction (XRD) using a Siemens D5000 (Siemens, Munich, Germany) equipped with an X-ray generator and Cu-Kα radiation. The random powder method was applied, and each mineral phase was identified using the X’Pert HighScore (Malvern Panalytical B.V., Almelo, The Netherlands). Analyses were done using the following set up conditions: Cu-Kα radiation, Ni filter, 45 kV voltage, 40 mA intensity, and exploration range between 3° to 60° 2θ with a goniometer speed of 0.05° 2θ s1.
Color changes before and after SO2 exposure were characterized using CIELAB and CIELCH color spaces [42,43] measuring L* (lightness), a*, and b* (color coordinates) by means of a CM-700d spectrophotometer (Minolta, Osaka, Japan). L* is the lightness ranging from 0 (absolute black) to 100 (absolute white); a* indicates the color position between red (positive values) and green (negative values); and b* between yellow (positive values) and blue (negative values). Nine measurements were taken randomly for each paint to provide statistically consistent results. The measurements were made using the Specular Component Included (SCI) mode, for a spot diameter of 3 mm, using D65 as the illuminant and an observer angle of 10°. In order to evaluate the color changes, color data were processed as the color differences (ΔL*, Δa* and Δb*) and the global color change (ΔE*ab) between the fresh and aged paint mock-ups [42,43]. The highest values were therefore obtained in the paints with the most visible color change.
The variation in the gloss (ΔG) value after SO2 exposure was obtained using a Unigloss 60Plus (Konica Minolta, Kyoto, Japan) with a reflection angle of 60°. Three measurements were taken for each paint mock-up.
The difference in roughness between fresh and SO2 aged paints was characterized by a profilometer (Mitutoyo SJ400, Mitutoyo, Takatsuku, Kawasaki, Kanagawa, Japan) obtaining the arithmetic average roughness (Ra, µm), the root mean square roughness (Rq, µm) and the average maximum profile height (Rz, µm) following [44]. The profilometer traced a scan length of 2 cm, and 3 profiles were obtained per paint. Each roughness parameter was obtained for each profile, after which average values were computed.
Reflectance variation due to SO2 exposure was characterized using a hyperspectral imaging system, which is a combination of an imaging spectrograph with a monochrome matrix array sensor. The system is composed of a CCD sensor Pulnix TM-1327 GE (PULNiX America Inc., CA, USA), 1040 rows, 1392 columns) with an objective lens with a focal length of 10 mm. An ImSpector V10 spectrograph with a spectral resolution of 4.55 nm and a spectral range from 400 to 1000 nm was positioned between the sensor and the lens. The camera scans the surface line by line to obtain an image at each of 1040 wavelengths. A Schott DCR® III incandescent lamp (SCHOTT-FOSTEC, LLC, New York, NY, USA) with a rectangular head (51 mm long and 0.89 mm wide) was used as a light source. The light was focused on each paint through a cylindrical lens, so illuminating an area of the sample that was 15 cm long and 1 cm wide. The paint was placed on a motorized XYZ translation stage in which the Z-axis was perpendicular to the paint surface. Each paint mock-up was fully scanned. Each hyperspectral image was processed in a MATLAB programming environment to obtain the reflectance graphs.
Changes in the chemical (molecular) composition were evaluated by means of attenuated transmittance reflectance–Fourier transform infrared spectroscopy (ATR-FTIR) with a Thermo Nicolet 6700 (Thermo Scientific, Waltham, MA, USA). Infrared (IR) spectra were recorded at a 2 cm−1 resolution over 100 scans from 400 to 4000 cm−1.
A sample of each paint (reference/fresh and aged paint) measuring approx. 4 mm × 26 mm × 1 mm was cut from the glass slide substrate, and was then embedded in resin and cross-sectioned in order to study the paint layer transversally. The cross-sections were visualized with an Axioscope 5 (Zeiss, Oberkochen, Germany) polarized light microscope (PLM).
Finally, micromorphological, microtextural and chemical analyses of fresh and SO2 aged paints were performed by scanning electron microscopy (SEM) with energy-dispersive X-ray spectroscopy (EDS) using the two machines (Philips XL30 and FEI Quanta 200, Thermo Scientific, Waltham, MA, USA) in both modes, i.e., Secondary Electron (SE) and Back Scattered Electron (BSE). The surfaces of the paint mock-ups and cross sections were carbon-coated. Optimum observation conditions were obtained at an accelerating potential of 15–20 kV, a working distance of 9–11 mm, and a specimen current of 60 mA. The acquisition time to record the EDS spectra, i.e., the dwell time, was 40–60 s.
In order to investigate the hydrophobicity of the fresh paints, the static contact angle (SCA) of the fresh tempera mock-ups and the fresh binder mock-ups was measured using a goniometer SEO Phoenix-300 Touch (Kromtek Sdn Bhd, Selangor D.E., Malaysia.) following [45]. The sessile drop method (three droplets of 6 µL per sample) was applied.

3. Results and Discussion
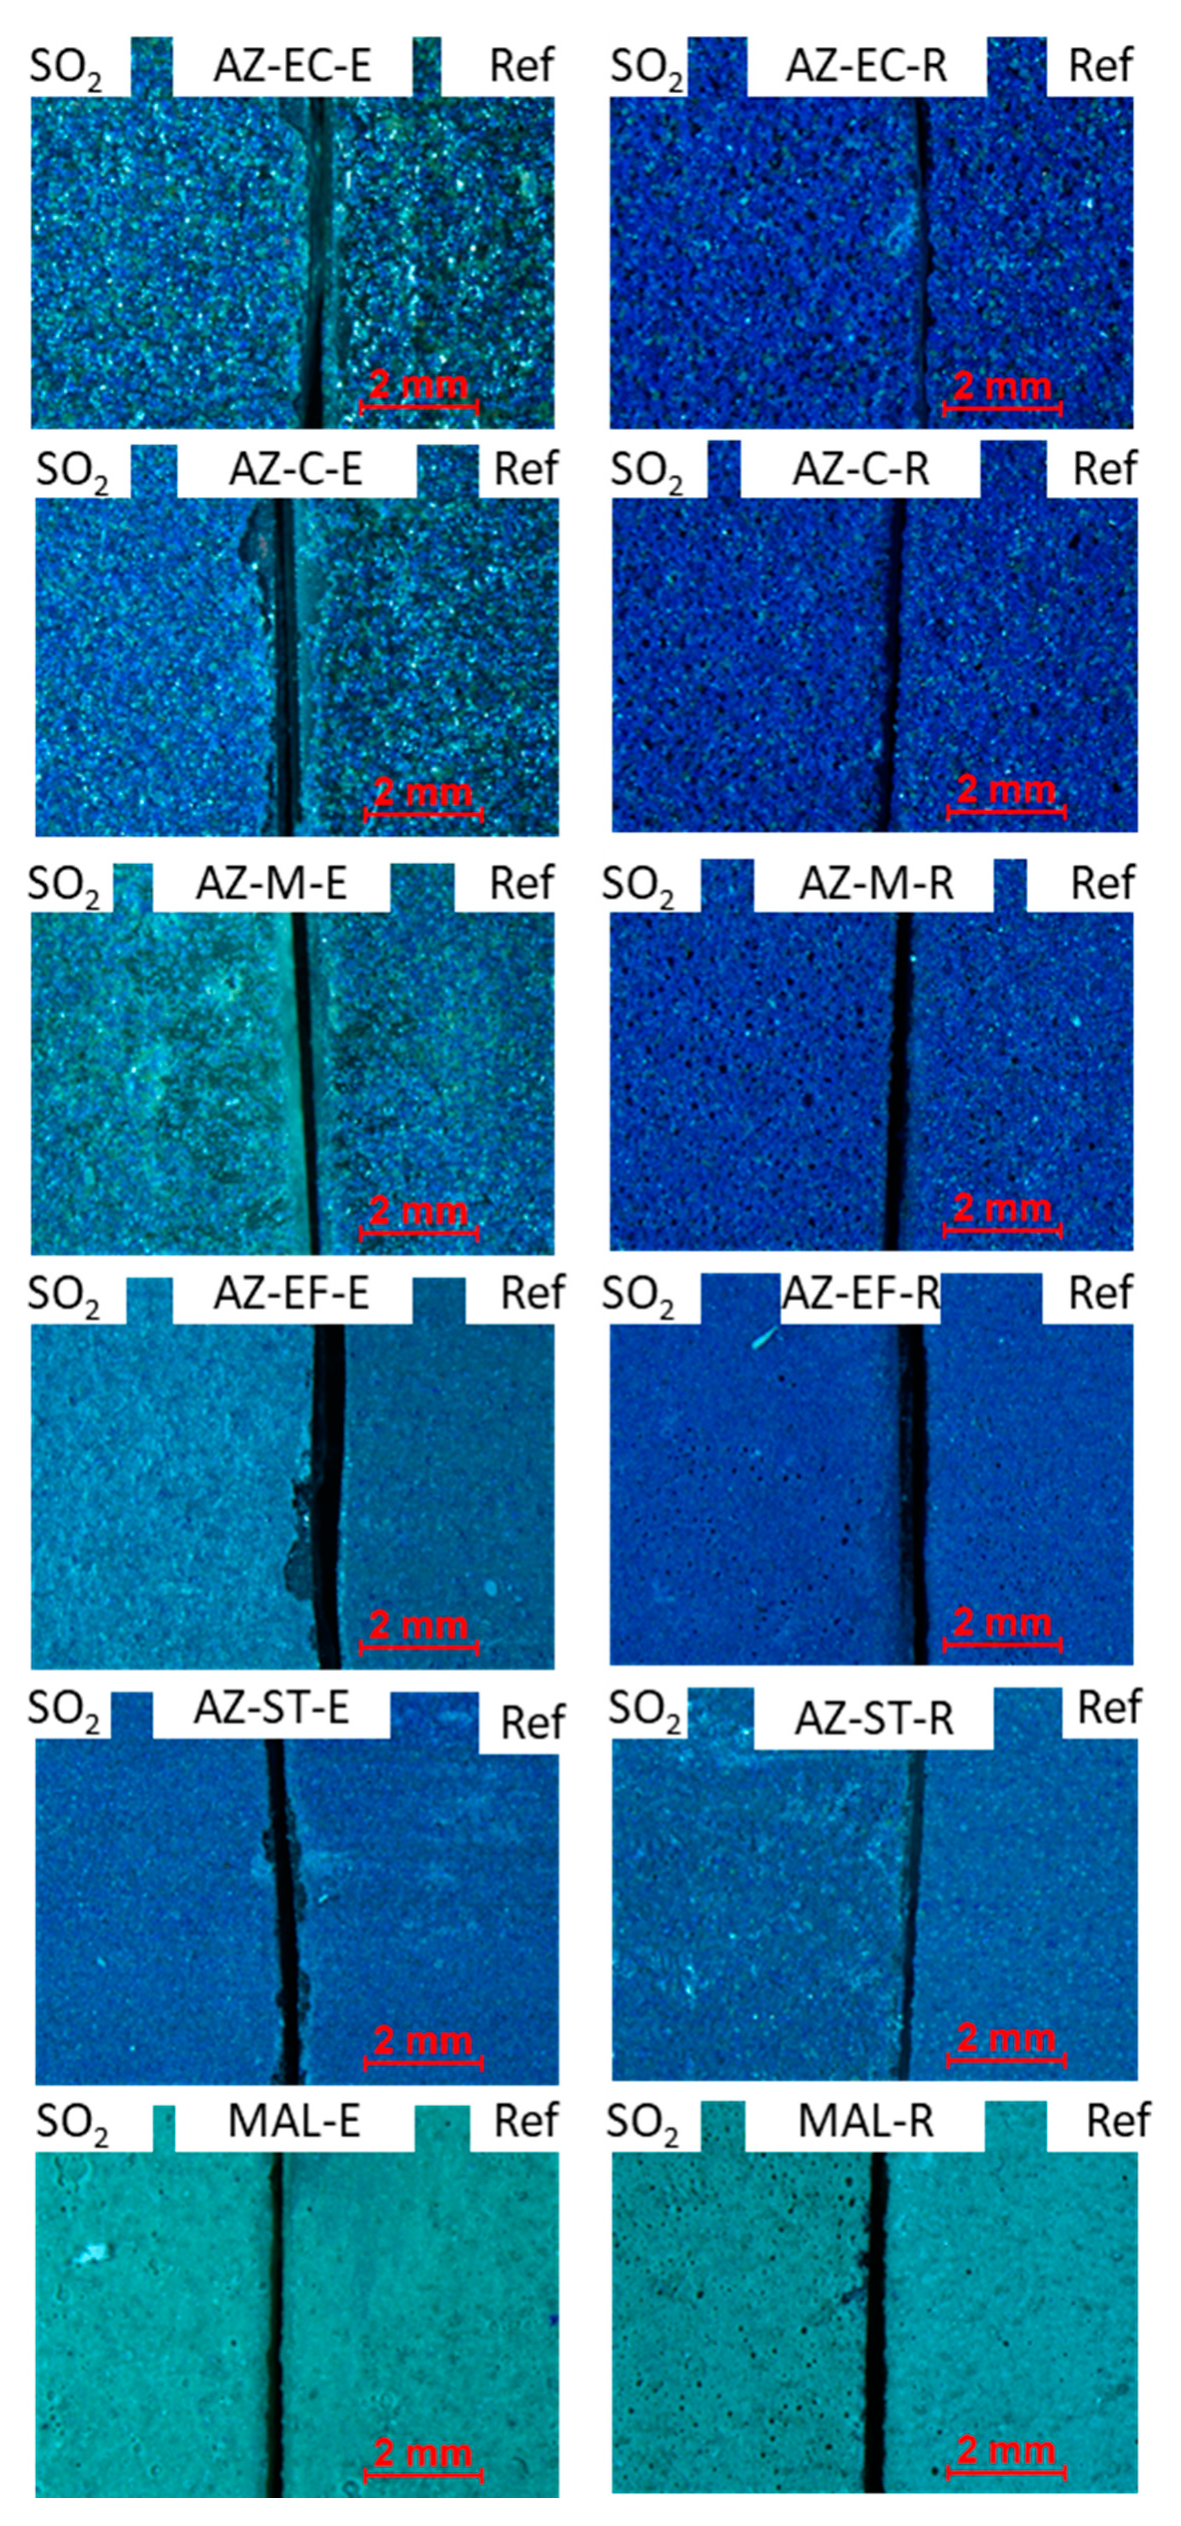
Before SO2 exposure, stereomicroscopy (
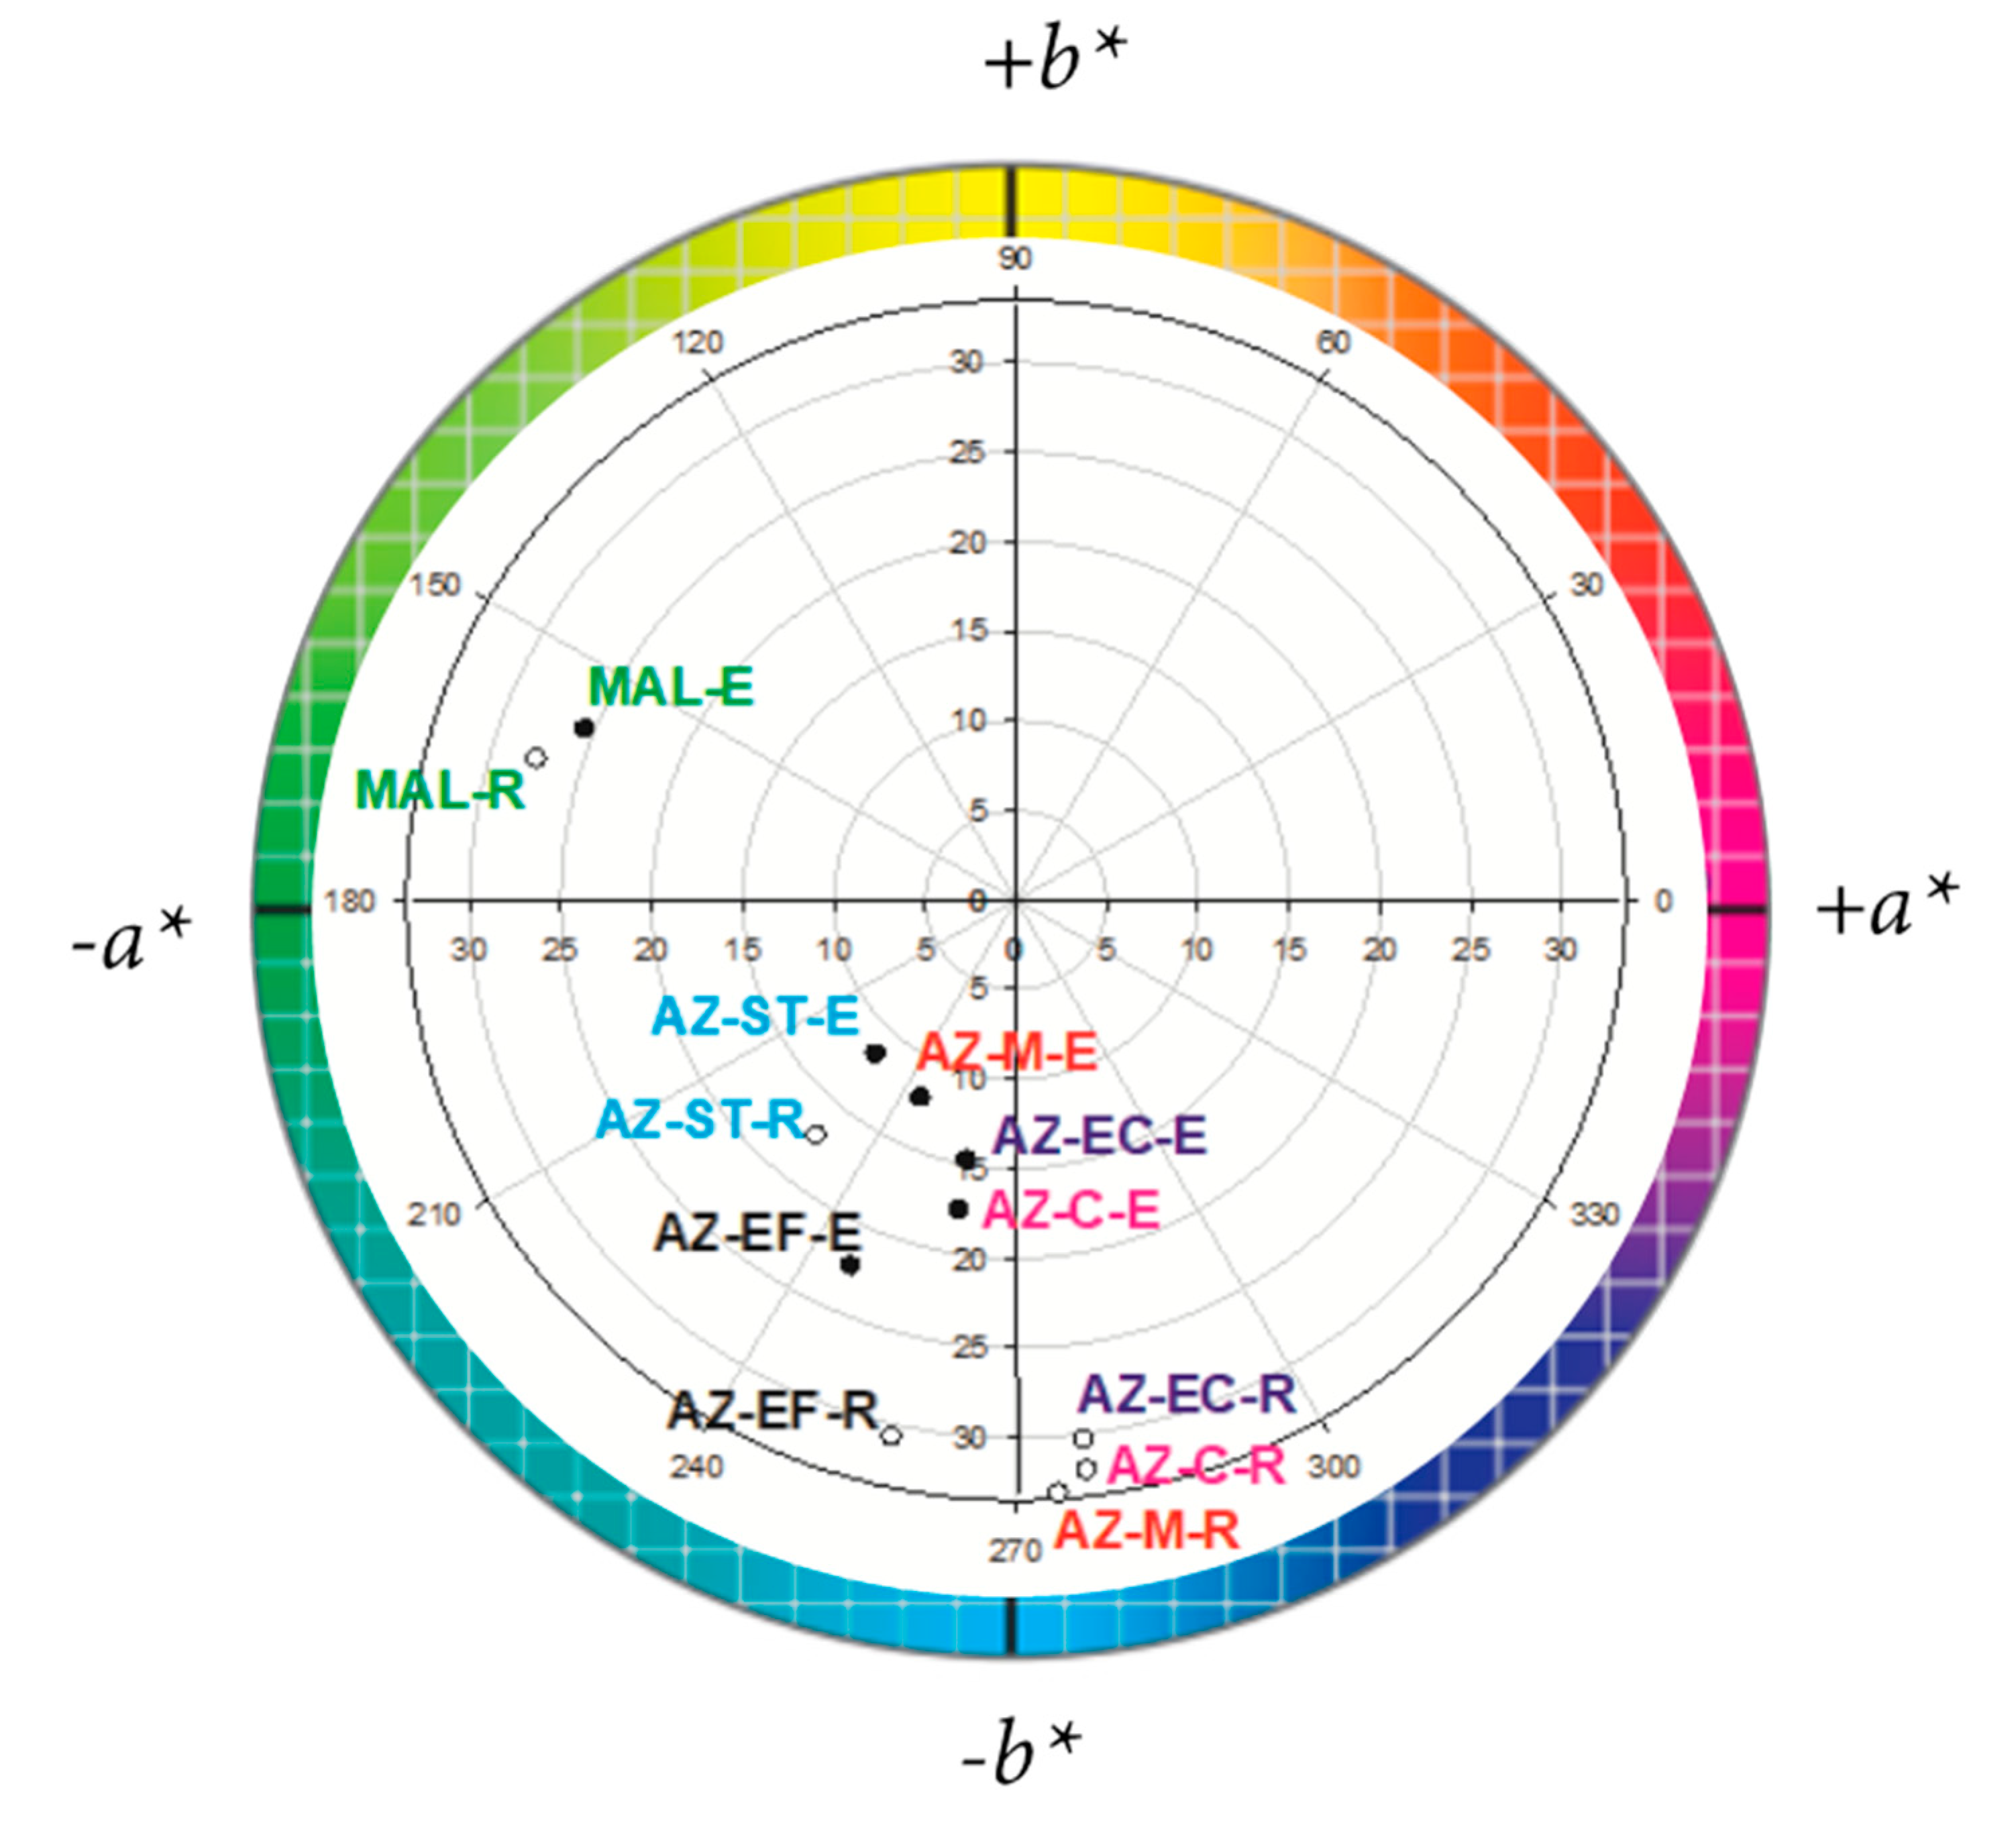
Figure 1) confirmed different aspects of the fresh paints according to the binder, above all in the AZ-based paints. Thus, the AZ mock-ups made with egg yolk (mainly those made with coarser pigment AZ-EC and AZ-C) had a slightly greener color than their counterparts made with rabbit glue; the AZ-ST mock-ups made with egg yolk and rabbit glue had a similar color. Color measurements confirmed the stereomicroscopy observations. In Table 2, L* coordinate values of each paint is depicted, whereas in Figure 2, the projection of a* and b* coordinates in a polar graph is represented. Firstly, all R-based mock-ups had higher L* values than the E-based mock-ups (Table 2). Therefore, R-based mock-ups were lighter than E-based mock-ups. Secondly, the values of a* and b* confirmed a shift of the hue of azurite: E-based mock-ups towards the green (these paints are positioned, on the graph of Figure 2, closer to a green hue than their R-based paints counterparts, which consequently, have a bluer coloration). Finally, azurite R-based mock-ups showed more vivid colors than their egg yolk-based paints counterparts: azurite E-based paints are placed closer to the center of the color wheel which corresponds to dull colors.
Mineralogical analysis by XRD of the fresh paints is presented in Table 1. Firstly, it was found that the commercial pigments contained impurities that had not been reported by the manufacturer. Quartz and malachite were detected in the azurite pigments, while pseudomalachite (Cu5(PO4)2(OH)4) and quartz were detected in the malachite pigment (Table 1). The manufacturer does not mention the impurities in the azurite and malachite pigments, as reported elsewhere for other historical pigments supplied by Kremer [22,23]. It seems possible that the presence of these impurities could induce changes in the pigment coloration. Moreover, the presence of these impurities suggests that the pigments are of natural origin in that if they were synthetic, the presence of other compounds such as calcite, gypsum (CaSO4·2H2O), or barite (BaSO4) (added as fillers) would be expected; these compounds are deliberately added to synthetic pigments to decrease costs or change their color [23].
Secondly, similar mineralogical composition among the pigments and their corresponding temperas was found. Only in the case of malachite mock-ups did we find a slight disparity with respect to the composition of the initial pigment: in MAL-E mock-up, no quartz was detected and in MAL-R mock-up no pseudomalachite was detected. This could be due to a dilution effect on the minerals found in trace quantities (as in the case of quartz and pseudomalachite) due to the addition of the binder; this fact can lead to non-detection of these trace minerals whose relative amounts are lowered in the paint below the detection limit (3%). Another difference in the mineralogical composition was found between the azurite egg yolk- and rabbit glue-based mock-ups: the amount of malachite in all AZ-E mock-ups was slightly higher (except for the AZ-M mock-ups) than the amount in their counterparts made with rabbit glue. This is confirmed by the estimation of the ratio AZ/MAL in all the fresh paints by calculating the intensity (cps, i.e., count per second) of the maximum reflection peak of azurite (3.51 Å, 25.31 θ) and the intensity of the I = 86% reflection peak of the malachite (5.97 Å, 14.82 2θ): this ratio was slightly lower in AZ-E mock-ups, which means that these paints had larger amounts of malachite. The AZ-M mock-up was an exception in that it had a similar AZ/MAL ratio in both E- and R-based mock ups.
It could be argued that the higher amount of malachite in E-based mock-ups than in R-based mock-ups could be related to a transformation of azurite into malachite during the preparation of the tempera. However, from a chemical point of view, this transformation is not possible considering that egg yolk is acidic (pH 6.4, [36]). Following the pH-Eh stability diagram of malachite-azurite [32], malachite is more stable at alkaline pH, whereas the stability of azurite falls off at more acidic pH. So, the stable mineral phase in this acidic environment is precisely azurite.
The existence of higher amounts of malachite in E-based paints could be due to a lack of uniformity in the composition of different batches of the azurite pigments delivered by Kremer. In a previous work [21], the different batches of azurite pigments used in the experimentation showed dissimilar mineralogical compositions. In our present study, different batches were also used, but given that this circumstance (i.e., the compositional non-uniformity of the pigments that come from the factory) was unknown at the time of paint preparation, it was not possible to record which paint was prepared with one or the other batch, and unfortunately, no analytical control was maintained regarding the composition of the original azurite pigments. Therefore, in order to avoid uncertainties, it is of enormous importance to check the composition of the commercial pigments from different batches prior to preparing paint mock-ups.
The greener coloration of AZ-E mock ups compared to that of AZ-R mock-ups could be due to the slightly higher amount of malachite in the former paints. Also, interaction between the color of the azurite pigment and the color of the binder after tempera drying should not be ruled out. Indeed, some authors found that the use of egg yolk as a binder with certain pigments can lead to the appearance of an undesirable color, producing yellowish tones in some tempera paints [21,46]. Consequently, in our paints, this yellowing could have contributed to the change of blue color towards green. Other authors stated that azurite can change its blue color as a result of chemical interaction with the binder. Thus, Odlyha et al. [7] related the color change of temperas prepared with azurite mixed with either egg yolk, egg white, apple cider, or a solution of mastic in white spirit, to an oxidation of the binder. Other authors [35] stated that once the pigment and the egg yolk are mixed, oxidation of the binder and binder-pigment interactions begin to take place through radical reactions, cross-linking, and chain scission.
After SO2 exposure, stereomicroscopic observations allowed the confirmation of an intense color change in AZ-E paints, mainly those containing the pigments AZ-EC, AZ-C, AZ-M, and AZ-EF, compared to the corresponding reference fresh paints (Figure 1), where aged paints appeared to have lost the initial greenish coloration. Instead, AZ-R mock-ups hardly changed color after the SO2 test, since they kept their initial blue coloration without remarkable changes except the AZ-ST-R mock-up, whose surface became whiter than the corresponding fresh paint. Regarding malachite tempera, the MAL-R paint showed the formation of new voids.
XRD identified various newly formed sulfated phases in the SO2 aged paints and confirmed the oxidation of SO2 and its transformation into more oxidized forms in the paint mock-ups (Table 1). The precipitation of copper (Cu) sulfates therefore indicates that both the azurite and the malachite pigments undergo chemical alteration, since they are the only possible sources of Cu. Another interesting fact is that the malachite present in AZ-EC-E, AZ-EC-R, AZ-C-R, AZ-M-E, and AZ-EF-R paints disappeared after the SO2 test (Table 1). It should be noted that the stability of the two minerals, azurite and malachite, is different depending on the pH of the media [32]: at acidic pH—which is the characteristic pH of the SO2 deposition and of its transformation to sulfate species—azurite is more stable than malachite. The disappearance of malachite impurities in AZ-E mock-ups could therefore explain why the AZ-E paints had lost their greenish color after the SO2 aging test. As regards the identification of neoformed mineral phases rich in Ca or Mg or Na in the SO2-aged azurite and malachite-based paints with both binders (Table 1), the most likely source of the cations present in the new sulfated minerals is the test water (see Section 2.2).
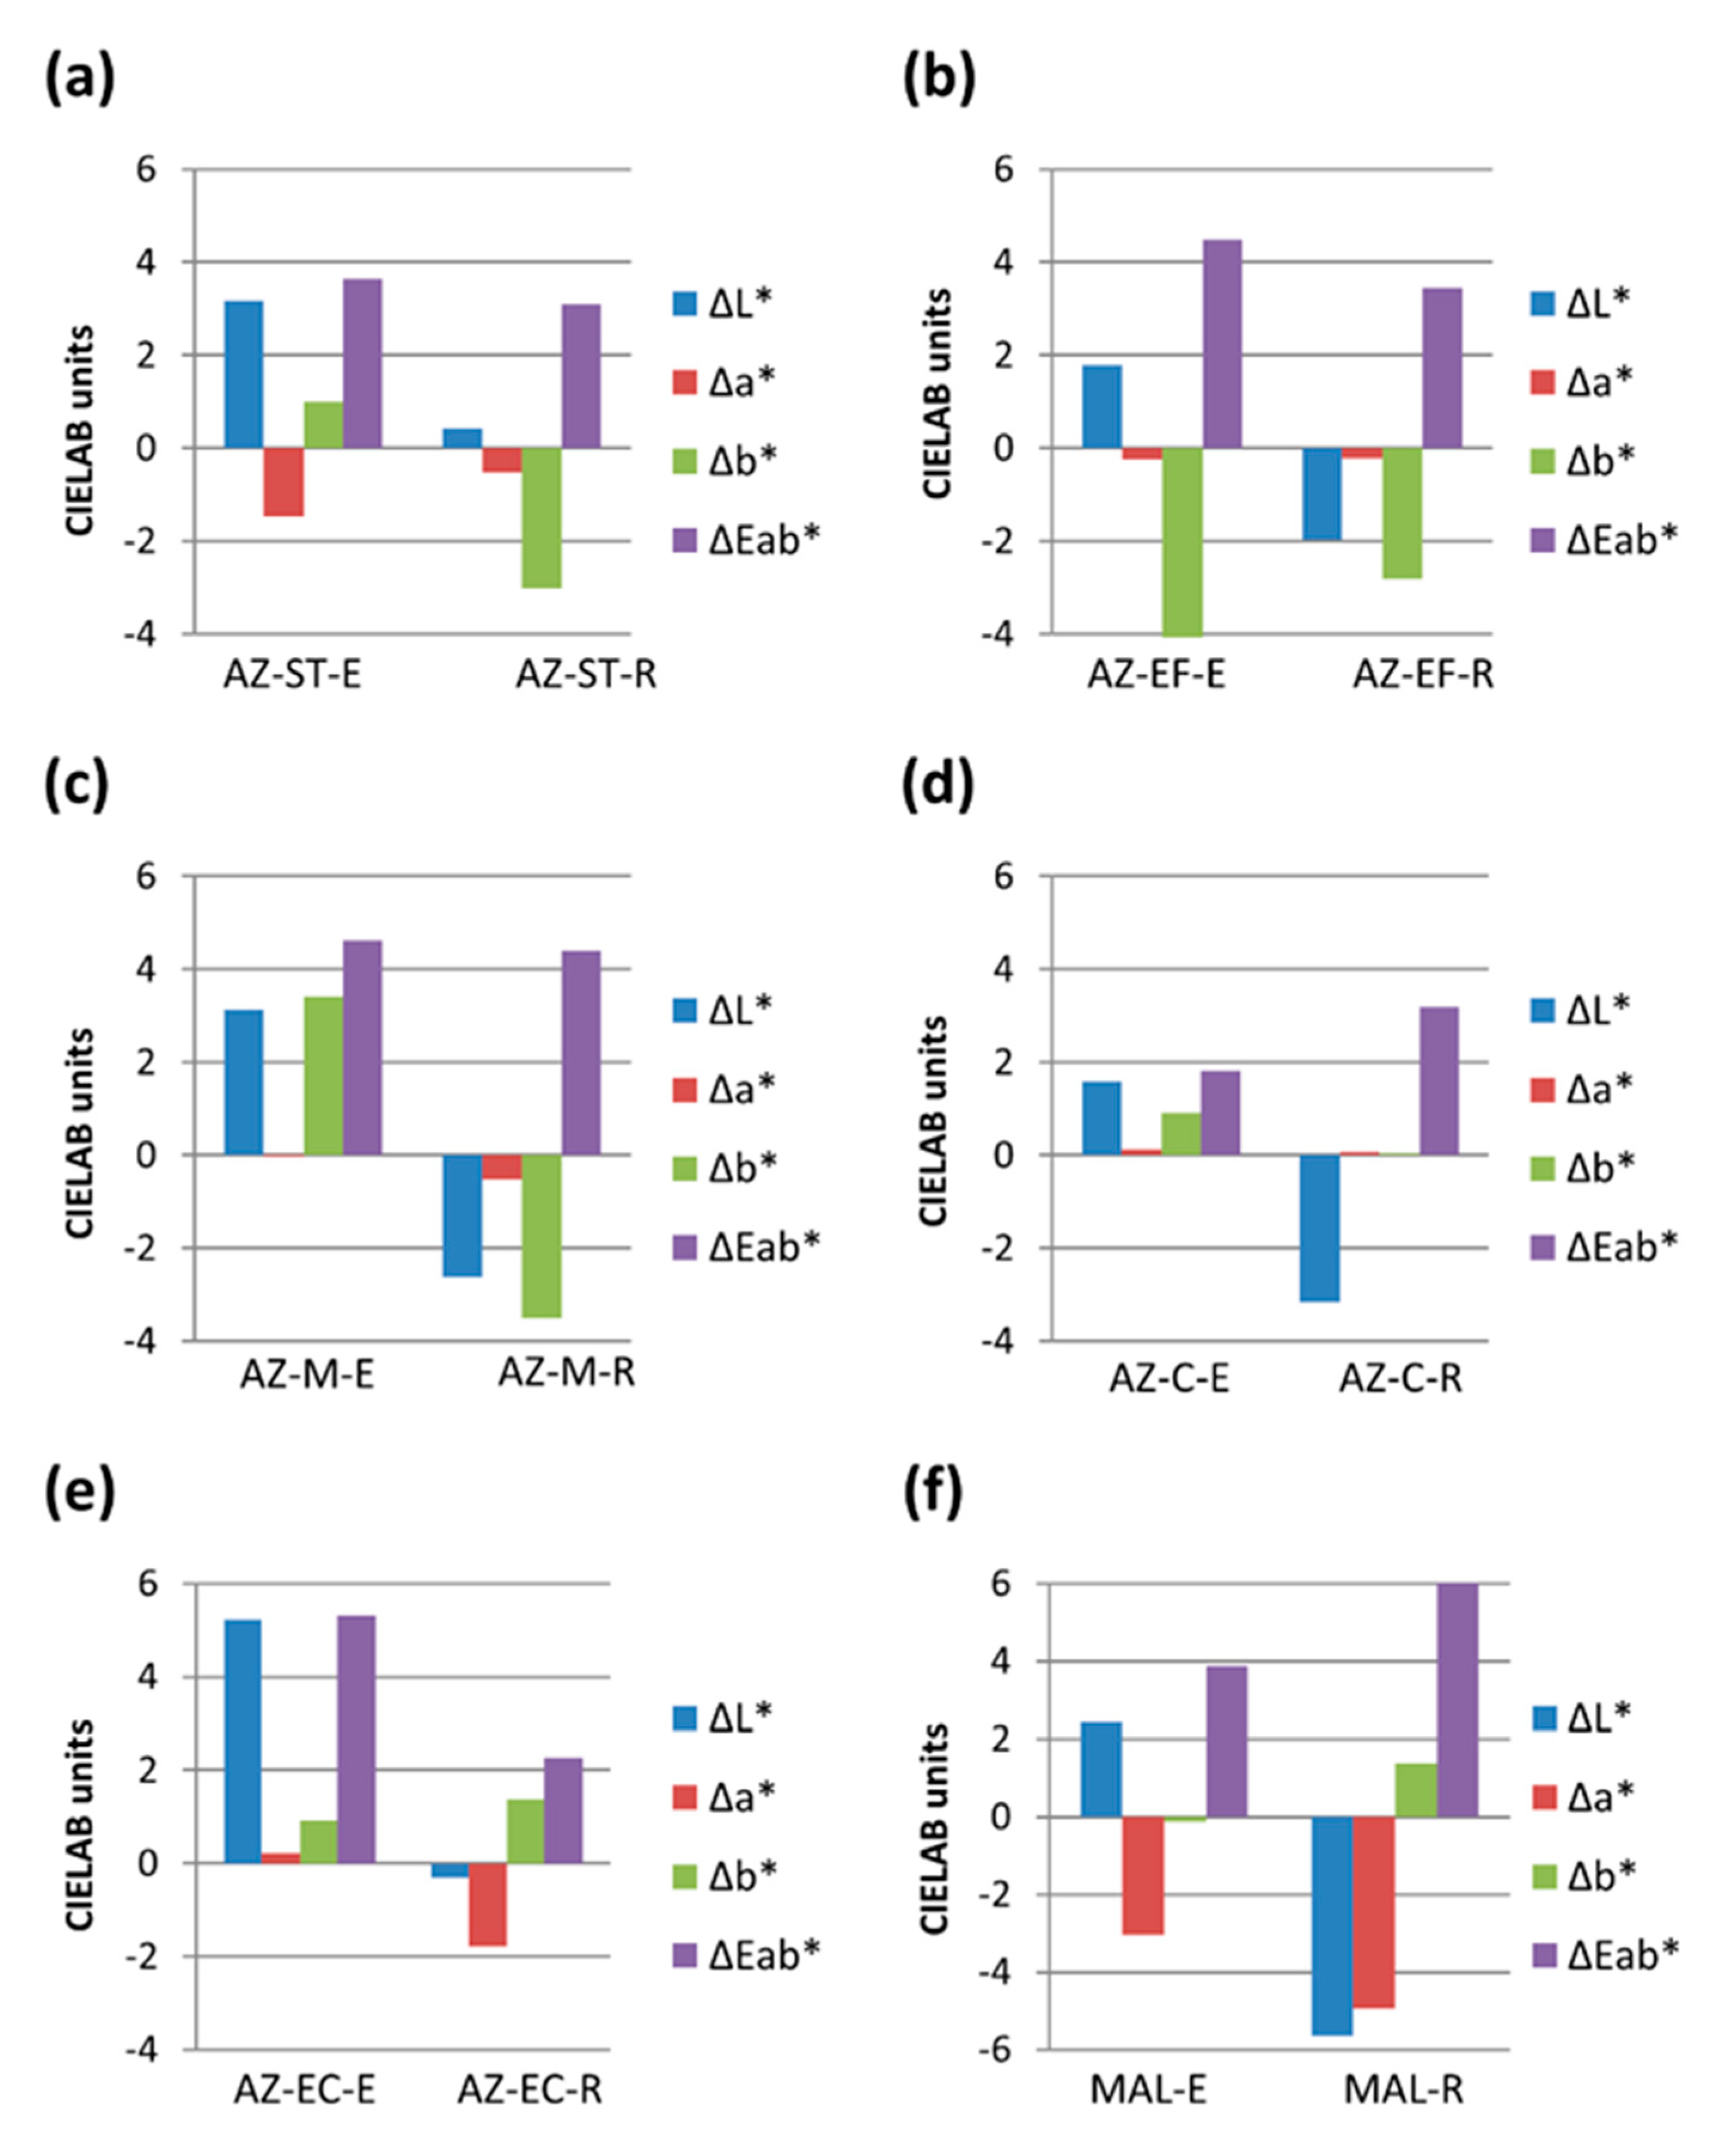
The spectrophotometry results showed that the color changes in SO2 aged AZ-based paints were slightly more intense in the paints made with egg yolk, except that made with AZ-C pigment (Figure 3). By contrast, in the MAL-based paints, ΔE*ab was higher in those made with rabbit glue. ΔE*ab was lower than 3.5 CIELAB units (and thus undetectable by an inexpert eye according to [47] in AZ-C-E and AZ-ST-R, AZ-EF-R, AZ-C-R, and AZ-EC-R paints. The fact that ΔE*ab < 3.5 were observed more frequently in R-based paints confirms that these paints were less affected by the SO2 exposure test than those made with egg yolk. This confirms the stereomicroscopy observations (see Figure 1) in that the change in the color of the E-based paints is slightly higher than that observed in their R-based counterparts.
The color parameters most affected by SO2 exposure varied from one paint mock-up to another (Figure 3).
(i) L* was the most affected color parameter for AZ-ST-E, AZ-C-E, AZ-C-R, AZ-EC-E, and MAL-R paints (Figure 3a,d–f). For E-based paints, L* increased (i.e., aged paints became lighter than fresh paints) whereas for R-based paints, L* decreased (i.e., surfaces became darker after SO2 exposure). In the E-based paints, the detected trend was opposite to that reported by Herrera et al. [10] for paints prepared with egg yolk mixed with either calcite or gypsum exposed to SO2.
(ii) The most affected parameter in AZ-EC-R and MAL-E paints (Figure 3e,f,) was a*, which decreased. This indicates that the paints became greener, although these changes were not noticeable in the stereomicroscope images. In calcite- and gypsum-based paints mock-ups prepared with either egg yolk or rabbit glue exposed to SO2, a* increases were negligible, as reported by Herrera et al. [10].
(iii) The most affected color parameter in AZ-ST-R, AZ-EF-E, AZ-EF-R, AZ-M-E, and AZ-M-R paints (Figure 3a–c) was b*, which decreased in all the paints except AZ-M-E paint. This decrease in b* indicates an increase in the bluish tone. Conversely, in AZ-M-E paint, the increase in b* indicates a loss of blue tone towards a yellowish coloration. Note that for E-based paints with the exceptions of AZ-EF-E and MAL-E paints, the b* increase showed a tendency to yellowish coloration, while for R-based paints, with the exceptions of AZ-C-R, AZ-EC-R, and MAL-R paints, the b* increases show a tendency to bluish color after the SO2 ageing. Herrera et al. [10] also found that yellowing after outdoor exposure to an urban environment was more intense in the case of egg yolk-based temperas than rabbit glue-based temperas.
If we look at the gloss value before and after the SO2 accelerated aging test (Table 3), although gloss values were less than 2.5 GU, E-based paints showed higher values than R-based paints. We also found that for fresh paints, the finer the grain size, the higher the gloss. The SO2 aging test caused negligible variations in gloss values compared to fresh paints in all mock-ups (Table 3). However, certain differences were detected, especially in the AZ-based paints. Firstly, for the AZ-EC- and AZ-C-based paints it was observed that: (i) the paints made with egg yolk showed an increase in the gloss value, albeit very small; this increase was greater in AZ-EC-E paint; (ii) the paints made with rabbit glue showed a smaller gloss variation, in this case, a slight decrease. In all the other azurite paints (AZ-M-, AZ-EF and AZ-ST-based paints), gloss values fell more sharply in those made with rabbit glue. The paints that underwent the greatest changes in gloss values were those made with the AZ-EF pigment, regardless of the binder. Gloss variation in MAL-based paints was negligible regardless of the binder used in the paint.
ΔRz (µm) (i.e., average maximum profile height) was the roughness parameter (Table 3) that varied most after the paints were exposed to SO2, and was therefore considered the most representative parameter for assessing the change in roughness. If we consider the Rz values according to the type of binder, the paint mock-ups made with egg yolk showed smoother surfaces (lower Rz) than those made with rabbit glue, with the exception of the MAL-based paints, where no statistically significant differences were detected. The highest Rz values were found in paints made with finer grain sizes, although when comparing the Rz values for the aged paints with the fresh paints, it was difficult to establish a relationship between the pigment grain size (in AZ-based paints) and the change in Rz.
A clear relationship was observed, however, between Rz and the type of binder. On the one hand, it was observed that Rz values (not exceeding 10 µm in depth) fell in AZ-EC-E, AZ-C-E, and AZ-M-E paints (i.e., egg yolk-based paints), whereas in those made with rabbit glue they increased, above all in AZ-M-R (40 µm) and AZ-EC-R (23 µm) paints. In these paints, there was no clear relationship between the change in roughness values and grain size. On the other hand, for the AZ-EF- and AZ-ST-based paints, we found that: (i) AZ-EF-based paints showed an increase in Rz, which was slightly higher in the R-based paints (i.e., AZ-EF-R); (ii), and there was a fall in roughness in AZ-ST-based paints, which was more noticeable in those made with egg yolk (i.e., AZ-ST-E). Note, however, that the differences between the roughness values for each paint were not statistically significant, except in AZ-M-E and AZ-M-R paints. Although these differences were not statistically significant, they can be used to make comparisons between the different paint mock-ups.
MAL-based paints experienced a decrease in the Rz parameter. This decrease was surprisingly higher in the E-based paints (MAL-E), since in aged MAL-E, no superficial changes were observed under the stereomicroscope. By contrast, pores and voids were formed in aged MAL-R paint. These pores should have caused an increase in the average height of the profile, although the variation in the Rz value in MAL-R paint was minimal. This mismatching could be due to a factor scale. The holes and pores identified in this paint, although numerous, were too big to allow roughness measurements to be taken.
Figure 4 shows the reflectance spectra of all fresh and aged paints mock-ups. The AZ-based paints have maximum reflectance in the blue region (455–492 nm), while in the MAL-based paints, maximum reflectance is in the green zone (492–577 nm). Generally, R-based paints showed higher reflectance than their counterparts made with egg yolk (Figure 4). In the spectra of fresh AZ-based paints, grain size did not seem to influence the shape of each spectrum but did change its intensity. Considering the highest intensity: (i) for E-based paints, similar intensities were identified for AZ-C- and AZ-M-based paints (Figure 4, panels a and c respectively) and (ii) for the R-based paints, AZ-C paint was clearly the one with the highest intensity (Figure 4b). Regarding the lowest intensity: (i) for E-based paints, similar levels were identified in AZ-EC-, AZ-EF-, and AZ-ST-based paints (Figure 4a,c), (ii) for R-based paints, the lowest level of intensity was identified in AZ-EC-based paint (Figure 4b). Therefore, a mismatch was detected with the findings of [48], since they reported that paints made with the finest grain sizes showed the highest reflectance. However, as was reported in [22], the presence of impurities, even in small amounts, the type of binder used in the paint and the pigment-binder interaction affect the intensity of the reflectance. On the other hand, Liang et al. [48] reported that in their model tempera paints the greatest variations in spectra were due to the type of binder, which changed the relative height between the peaks, although the spectral features were preserved.
In general, aged paints showed higher reflectance than fresh paints, except in AZ-C-R, AZ-M-R, and MAL-R paints (Figure 4). Hence, as was stated for color variation data, it is important to highlight that pigment-binder interaction is decisive in the reflectance behavior of tempera paints that are aged by exposure to SO2.
Figure 5 shows the FTIR spectra for several (representative) paint mock-ups. FTIR allowed the identification of the characteristic functional groups of binders and pigments. Typical bands assigned to egg yolk were identified in our AZ- and MAL-based temperas, i.e., 3264 cm−1 assigned to NH stretching, 2920 cm−1 assigned to CH2 stretching from long chain fatty acids, 2850 cm−1 due to CH2 stretching from long chain fatty acids, 1735 cm−1 assigned to ester C=O stretching band ascribable to triglyceride, 1620 cm−1 assigned to C=O stretching from amide I, and 1527 cm−1 bending from amide II [3,49]. For its part, the distinctive rabbit glue bands identified in our temperas were: a weak band at 2921 cm−1 assigned to CH2 stretching vibration, 1630 cm−1 assigned to C=O stretching from amide I, 1527 cm−1 associated to the CN stretching and NH bending from amide II, and bands ranging from 1400 to 1000 cm−1 associated to collagen absorption features attributed to CH2 wagging, CH3 deformation, C–N stretching, and C–OH stretching [21,50,51]. Note that the rabbit glue characteristic bands at 3300 cm−1 and 3100cm−1 assigned to NH stretching are not clearly seen in Figure 5. Instead a broad band is noticeable, which was attributed to the overlapping of the above bands with the key bands of azurite or malachite present in this region, as described below.
On the other hand, in the AZ-ST- and MAL-based paints (See Figure 5), the bands assigned to the binders were slightly relocated: (i) the egg yolk key band at 1527 cm−1 moved to 1487 cm−1 in the reference egg yolk-based paints AZ-ST-E-Ref and MAL-E-Ref paints, (ii) the (amide II) band at 1527 cm−1 in the R−based paints also moved to 1477 cm−1 in AZ-ST-R-Ref paint and to 1475 cm−1 in MAL-R-Ref paint. The shifts cited here were previously reported by Cardell et al. [21], who attributed them to the complexation of Cu2+ ions with the amide group; indeed, the attachment of heavier atoms reduces the frequency of the bending vibration of the C–N bonds [21,52]. The FTIR shifts described above could be due to the fact that the azurite standard (AZ-ST) and malachite standard (MAL) pigments have higher egg-yolk content than the other pigments we studied. As formerly mentioned, the commercial AZ-ST pigment had 10.5% more egg yolk than the other azurite pigments (AZ-EC, AZ-C, AZ-M, and AZ-EF contain less than 3.5 wt%) according to [21]. These authors also found that AZ-ST pigment contained more azurite than the other AZ pigments.
In the FTIR spectra of the analyzed temperas, the bands for azurite and malachite could also be identified (Figure 5). In the case of the reference AZ-based paints, the azurite bands correspond to: a low intense band at 3694 cm−1 and a sharp band at 3419 cm−1 assigned to the O–H stretching mode. Note that 3419 cm−1 band shift to 3410 cm−1 in the AZ-ST-R-Ref, and that it is hardly seen in AZ-C-E-Ref paint; bands in the spectral region extending from 1500 to 1400 cm−1 (ca. 1490, 1436, and 1400 cm−1) assigned to stretching vibration of CO32−; different bands in the range 1054–550 cm−1, specifically, 1054 cm−1, 943 cm−1, 811cm−1 and 769 cm−1 assigned to bending of CO32−, and finally, bands at 533 cm−1 and 445 cm−1, which were assigned to v(Cu–O) [53,54,55]. Malachite was recognized by the FTIR absorbance bands at 3390 cm−1 and 3310 cm−1 assigned to O–H stretching mode, bands at 1487 cm−1, 1370 cm−1, 1151 cm−1, and 1035 cm−1, assigned to stretching vibration of CO32−, bands assigned to bending of CO32− at wavenumbers below 860 cm−1, and bands at 561 cm−1, 495 cm−1, and 420 cm−1 assigned to v(Cu–O) [49,53,54,55].
After SO2 aging of the AZ-based paints, new bands in the FTIR spectra assigned to S–O bands at the range between 1050 and 1060 cm−1, and ca. 601 cm−1 (i.e., at 603 cm−1 in our paints) [49,56] confirm the precipitation of sulfated phases on the surface of the paints. However, no FTIR changes were identified in the spectra of the MAL-based paints, not even effects corresponding to the S–O group. Note that XRD detected bassanite and Na2Cu(SO4)2 on MAL-based mock-ups. The non-detection of sulfate salts by means of FTIR could indicate that the formation of sulfate compounds is not homogeneous throughout the entire paint, which would complicate their identification by the diverse analytical techniques, considering that different aliquots from scraped paint material taken from the glass slide were used for each applied technique.
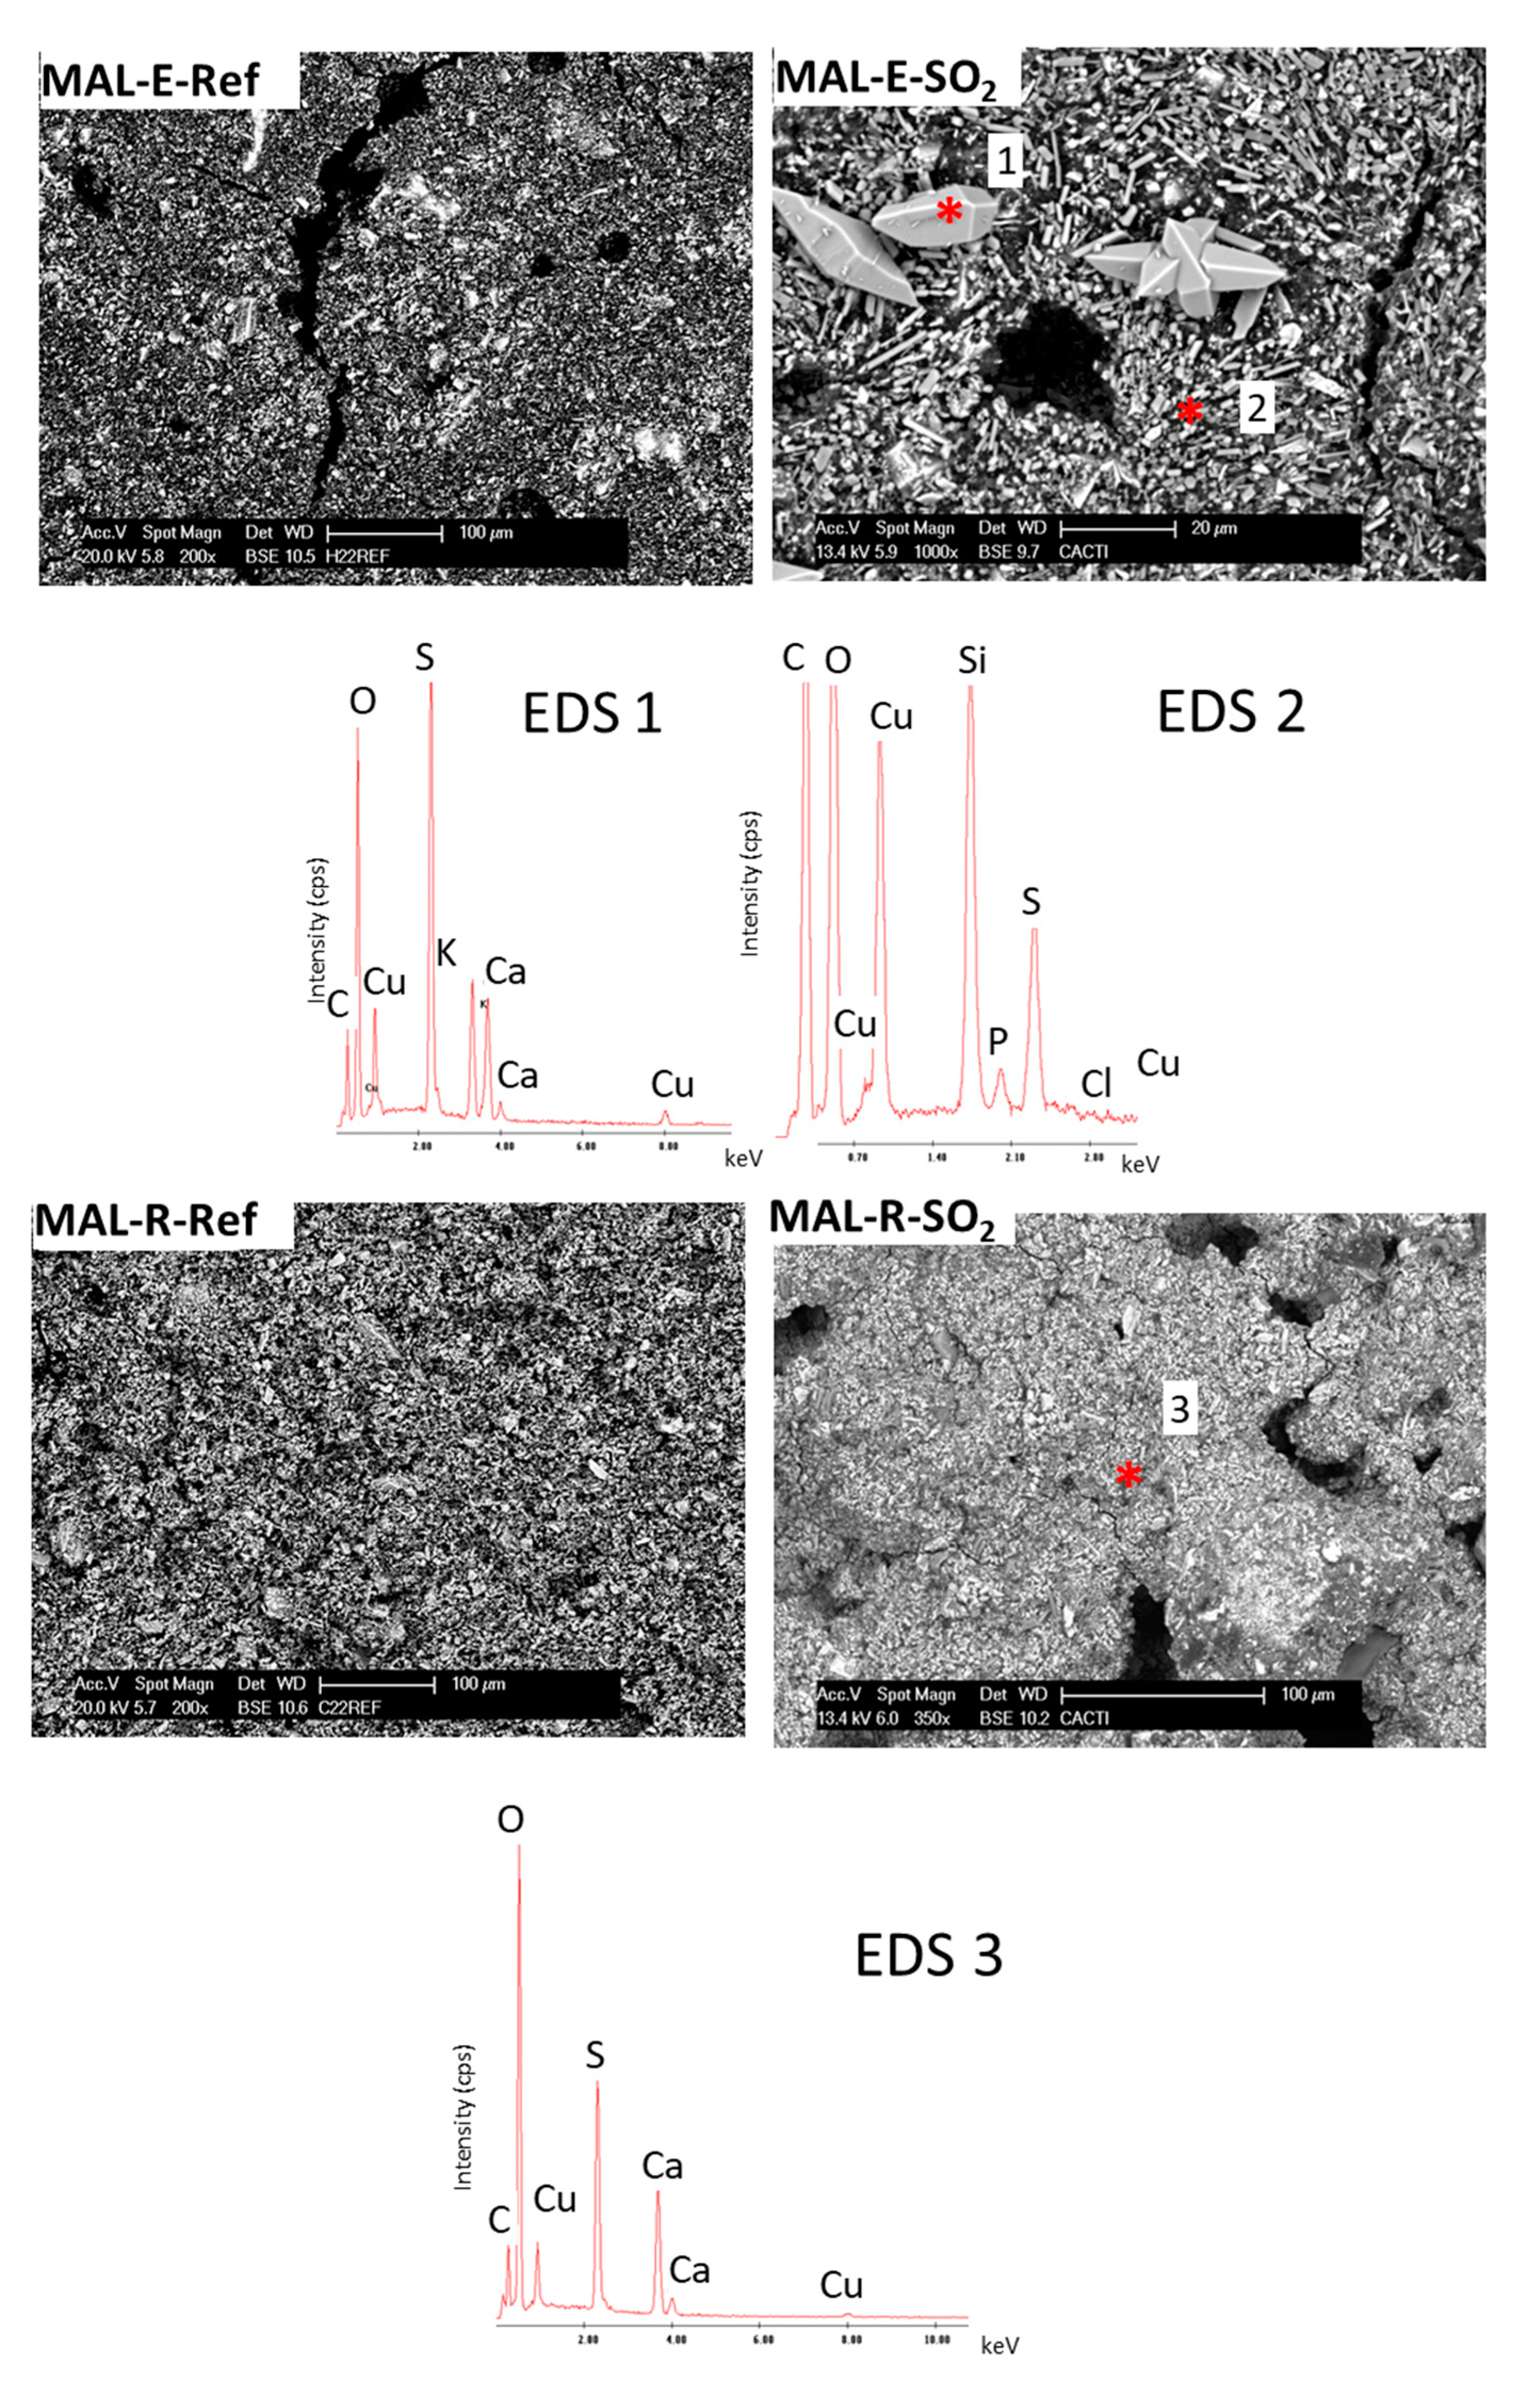
Figure 6 and Figure 7 show the surface aspect of some of the AZ- and MAL-based paints before and after SO2 exposure. Using SEM-EDS, azurite and malachite grains were identified embedded into the organic matrix of the binder. SEM highlighted texture differences between the paints made with egg yolk and those made with rabbit glue both before and after the SO2 aging test. Thus, in the fresh E-based paints, the pigment grains were well covered by the binder, which gave the paint a smooth surface with some cracks and voids, and a few grains protruding from the binder (Figure 6, AZ-C-E-Ref). Conversely, in the paints made with rabbit glue, the binder was less able to cover the pigment grains, and there were large empty spaces between the grains (Figure 6, AZ-C-R-Ref).
After SO2 exposure, SEM confirmed the precipitation of sulfur-rich neoformed minerals on the surface of the paint mock-ups. Three different types of mineral groups were identified according to their morphologies:
(1) Acicular-shaped crystals were observed on AZ-EC-, AZ-C-, AZ-M-, and AZ-EF-based paints irrespective of the binder present in the temperas (Figure 6, AZ-C-E-SO2, AZ-EC-R-SO2); however, the degree of coverage on the paint surface varied according to the binder. The deposits were more extensive on the E-based paints than on the R-based paints (Figure 6, AZ-C-E-SO2 and AZ-EC-R-SO2). In the AZ-E paints in addition to the acicular deposits that were mainly rich in copper (Cu) and sulfur (S) and to a lesser extent in phosphorus (P) (Figure 6 EDS1), dense plates rich in S, Cu, potassium (K), and calcium (Ca) (Figure 6 EDS 2) were identified.
(2) On AZ-ST-based paints with both binders, the sulfated crystals were tabular in shape and less than 10 µm long (Figure 6, AZ-ST-E-SO2). The salts were rich in S and Cu, and to a lesser extent, P, silicon (Si), aluminum (Al), and magnesium (Mg) (Figure 6, EDS 3);
(3) On the MAL-based paints made with egg yolk binder (Figure 7, MAL-E-SO2), interconnected prisms rich in S, Cu, K, and Ca (Figure 7, EDS 1) and acicula rich in Si, Cu, S, and P were detected (Figure 7, EDS 2). Instead, on the surface of the malachite R-based paint, enrichments of S and Ca were detected (Figure 7, MAL-R-SO2 and EDS 3).
All in all, SEM examination of the paints surfaces indicate that sulfated salts precipitated in larger amounts in E-based paints (mainly made with AZ-EC, AZ-C, AZ-M, and AZ-EF pigments) than in R-based paints.
The visualization of cross sections with PLM (Figure 8a–d) and SEM (Figure 8e,f and Figure 9) showed that in fresh E-based paints, pigment grains were well agglomerated by the binder while in R-based paints, the adherence between pigment grains and binder seemed to be lost. As a result, the surface of the E-based paints appeared smoother (Figure 8a,b) than the surface of the paints made with rabbit glue, a finding that is consistent with the lower Rz values found in E-based paints. Also, observations under PLM revealed the presence of grains with an intense green color in the AZ-based paints (Figure 8d). These grains could correspond to malachite; note that XRD results indicated higher malachite contents in the fresh AZ-E-based paints than in fresh AZ-R-based paints.
PLM examination of cross sections of SO2 aged paints confirmed a yellowing of the binders, with this effect being more intense in the egg yolk binder (Figure 8a–d). Therefore, the yellowing suffered by the binders could be the reason of the color changes of the temperas detected by spectrophotometry. In E-based paints—with the exceptions of AZ-EF-E and MAL-E paints—, a yellowing effect after SO2 exposure was detected. Conversely, in R-based paints—with the exceptions of AZ-C-R, AZ-EC-R and MAL-R paints—, a tendency to bluish tones was detected after ageing. Herrera et al. [10] also found an increase in b* in temperas made with calcite or gypsum mixed with either egg yolk or rabbit glue exposed to SO2 rich-atmospheres, as already mentioned.
In addition to the detection of large amounts of sulfate salts on the surface of the temperas, SEM confirmed the presence of sulfur in the interior of the paints (Figure 9). This fact, which was verified irrespective of the binder, would confirm that either an interaction between SO2 and the paints has occurred inside the paints or that sulfate-rich solutions have migrated towards the interior. It would be interesting to further knowledge of this interaction: whether SO2 diffuses into the paint and oxidizes inside the paint, or if it is only a penetration of dissolved salts that have previously precipitated onto the surface. Whatever the process is, it will have different consequences on the stability of the tempera paints: (1) the oxidation of SO2 to sulfate inside the paint will occur if water exists in its interior, which depends in turn on porosity and the degree of aggregation of pigment grains. The process of oxidation of SO2 to sulfates could chemically alter, by redox processes, the binder mixed with the pigment inside the paint, leading to its color change; (2) if sulfur content inside the paints comes from the penetration of sulfate rich solutions from the paint surface towards its interior through paint pores, the precipitation of the salts in the interior of the paint would also produce changes in tempera paint reflectance and color.
SEM results showed that larger amounts of sulfated phases precipitated onto the surfaces of the E-based paints versus R-based paints. In order to investigate why this happened, the static contact angles (SCAs) of the fresh tempera paints and on fresh mock-ups made solely with binders were measured (Table 4). In the case of the rabbit glue mock-up, it was impossible to obtain a contact angle value, since the drops, as soon as they were brought into contact with the surface of the binder, quickly dispersed, confirming the hydrophilic character of rabbit glue. The egg yolk mock-up, on the contrary, showed an SCA around 75° (most probably due to the fatty character of its lipid components). Consequently, it can be inferred that the hydrophilic nature of the rabbit glue binder hindered measuring the SCA in the rabbit glue mock-up. Surprisingly, R-based tempera paints showed higher SCA values than their counterparts made with egg yolk (Table 4). This could be related to the roughness displayed by the paints (Table 3), i.e., R-based paints being rougher than E-based paints, as was quantified by roughness measurements and illustrated via PLM (Figure 8a,b). Note that it is well known that surfaces with greater micro-roughness have higher contact angles [57,58].
SCA data, together with SEM observations, may explain why more salts precipitated in the E-based paints, and moreover, will clarify the yellowing of the egg yolk binder after the SO2 test. Firstly, the hydrophobic character of the R-based paints makes them less reactive to the wet deposition of SO2. This could explain the lower amount of saline deposits formed in these paints compared to the E-based paints. Note that R-based paints, although being less reactive to SO2 than the E-based paints, suffered from deterioration; indeed, our results indicate that pigments altered because Cu-based sulfates formed in the paints. On the other hand, the hydrophilic character of the E-based paints makes them more reactive against wet SO2 deposition. The wet SO2 deposition would affect the mock-ups all over their surface, leading, consequently, to a more intense salt deposit formation in these E-based paints. In addition, dissolved SO2 or sulfates will penetrate more easily inside the paint. Therefore, the possibility that the components of the tempera paint (i.e., pigment and binder mixture) will be affected by SO2 deposition processes would be higher in the interior of the E-based paints. The yellowing of the egg yolk (which hardly occurred in the rabbit glue binder) may be due to this fact.
This hypothesis, which should be proven by molecular techniques different to FTIR, is consistent with the dissimilar behavior of the egg yolk and rabbit glue binders during aging, and agrees with previous findings reported in the literature. Odlyha et al. [7] related the deterioration of egg yolk in azurite tempera mock-ups subjected to an artificial light aging test, to an oxidation process catalyzed by the copper of the azurite. Cardell et al. [21], working with azurite rabbit glue-based tempera mock-ups subjected to a UV-aging test, found that the paints made with the finer grained pigments displayed yellowing, which was related to modifications of the binder structure. Other works also proved that X-rays were able to deteriorate the lipids and proteins of egg yolk present in tempera mock-ups made with either azurite, malachite, or alizarin, affecting the cleavage of the C–N, C–O(H), and C=O bonds [59]. In our work, despite the fact that R-based paints exhibit a hydrophobic character, the binder loss in these paints was more significant than in the E-based paints. Although at first this result seems contradictory, it should be noted that the rabbit glue binder present in our paints remains more prone to dissolution in moist conditions (like those present in this SO2 test) than the egg yolk binder, which is more sensitive to irradiation [60].

4. Conclusions

The results obtained from this research allowed us to reach the following conclusions:
The fresh azurite- and malachite-based tempera mock-ups prepared with the two binders, i.e., egg yolk or rabbit glue, had certain physical-chemical differences that affected their capacity to withstand the accelerated aging test in which they were exposed to SO2. In particular, the distinctive crucial features were:
(i) The slightly higher amount of malachite detected in the azurite-based paint mock-ups made with egg yolk compared to those made with rabbit glue. Future studies conducted using paint mock-ups should check out first the mineralogy of the purchased azurite and malachite pigments, in order to ensure or discard possible interaction between them and the proteinaceous binder, i.e., egg yolk or rabbit glue during the curing of the tempera paint.
(ii) The mixture of azurite with egg yolk gives a slightly yellower tempera than if rabbit glue is used. Egg yolk proved to be a better agglutinant than rabbit glue. As a result, egg yolk-based paints had a smoother and less porous surface than rabbit glue-based paints, which showed more irregularities and pores, making the tempera more susceptible to future deterioration.
After the SO2 aging test, sulfate-rich salts were detected on the surface and also inside the paint layer of the tempera mock-ups, principally in those containing egg yolk. The presence of Cu-rich sulfate salts in the aged paint mock-ups proved that the azurite and malachite pigments were damaged by SO2 exposure, irrespective of the binder present in the tempera and the grain crystal size. Binders also deteriorated after the SO2 test: the egg yolk binder suffered yellowing but it did not show physical deterioration, although weak fissuring after the test affected the tempera. Conversely, cracks formed in the rabbit glue-based paints and important amounts of binder were lost. Despite the higher binding ability of the egg yolk and its greater physical stability during SO2 attack, the color change of the aged azurite egg yolk-based tempera was much greater than that of rabbit glue-based tempera, whose color remained almost unchanged. The greatest color variation in azurite egg yolk paints after SO2 exposure is a result of the combination of: (i) the greater amount of sulfate salt deposits on the paint surfaces, (ii) the disappearance of malachite impurities due to the acidic pH of the SO2 deposition environment, and (iii) the yellowing suffered by the egg yolk binder. Further studies should be performed on the evaluation of the chemical changes occurred in both binders in order to correlate them with physical changes, such as yellowing or cracks.
These results will help to understand the behavior of tempera paints exposed to SO2 rich atmospheres. Although SO2 concentration in urban environments was reduced following European guidelines, it should be noticed that the effect of this gas on temperas (as in other materials used in cultural heritage) has an accumulated character over time. The knowledge about the response of temperas exposed to SO2 can be useful in decision-making during the application of preventive conservation measures (e.g., through the placement of protective screens or the implementation of traffic regulation measures) or in selecting the appropriate paintings materials during reintegration interventions.

Author Contributions

Conceptualization, J.S.P.-A., C.C., and T.R.; methodology, J.S.P.-A., D.B., A.D., T.R., and C.C.; software, J.S.P.-A., T.R., and D.B.; validation, J.S.P.-A., T.R., and C.C.; formal analysis, J.S.P.-A., D.B., T.R., and C.C.; investigation, J.S.P.-A., D.B., A.D., T.R., and C.C.; resources, C.C., A.D., and T.R.; data curation, J.S.P.-A., D.B., T.R., and C.C.; writing—original draft preparation, J.S.P.-A., T.R., and D.B.; writing—review and editing, J.S.P.-A., T.R., C.C., and A.D.; visualization, J.S.P.-A., C.C., and T.R.; supervision, J.S.P.-A. and C.C.; project administration, C.C.; funding acquisition, T.R., C.C., and A.D. All authors have read and agreed to the published version of the manuscript.

Funding

This research was funded by Spanish Research Projects AERIMPACT (CGL2012-30729) and EXPOAIR (P12-FQM-1889), the European Regional Development Fund (ERDF) and the Andalusian Research Group RNM-179. J. Santiago Pozo-Antonio thanks the Spanish Ministry of Economy and Competitiveness (MINECO) for his “Juan de la Cierva-incorporación” (IJCI-2017-3277) post-doctoral contract.

Acknowledgments

The authors would like to thank Ana Mato and Lara de Villalobos for their help with the acquisition and curation of the data. They also acknowledge the support of the CERENA (strategic project FCT-UID/ECI/04028/2019). Analyses were performed in the CACTI (Centro de Apoyo a la Investigación) Research Support Centre at the University of Vigo. The accelerated SO2 aging tests were performed in the Instituto Superior Tecnico (Lisbon, Portugal).

Conflicts of Interest

The authors declare no conflicts of interest.

References

  1. Smith, G.D.; Clark, R.J.H. The role of H2S in pigment blackening. J. Cult. Herit. 2002, 3, 101–105. [Google Scholar] [CrossRef]
  2. Eremin, K.; Stenger, J.; Green, M.L. Raman spectroscopy of Japanese artists’ materials: The tale of Genji by Tosa Mitsunobu. J. Raman Spectrosc. 2006, 37, 1119–1124. [Google Scholar] [CrossRef]
  3. Mazzeo, R.; Prati, S.; Quaranta, M.; Joseph, E.; Kendix, E.; Galeotti, M. Attenuated total reflection micro FTIR characterization of pigment-binder interaction in reconstructed paint flims. Anal. Bioanal. Chem. 2008, 392, 65–76. [Google Scholar] [CrossRef] [PubMed]
  4. Vanmeert, F.; der Snickt, G.V.; Janssens, K. Plumbonacrite Identified by X-ray Powder Diffraction Tomography as a Missing Link during Degradation of Red Lead in a Van Gogh Painting. Angew. Chem. 2015, 54, 3607–3610. [Google Scholar] [CrossRef] [PubMed] [Green Version]
  5. Bacci, M.; Piccolo, M.; Porcinai, S.; Radicati, B. Tempera-painted dosimeters for environmental indoor monitoring: A spectroscopic and chemometric approach. Environ. Sci. Technol. 2000, 34, 2859–2865. [Google Scholar] [CrossRef]
  6. Bacci, M.; Piccolo, M.; Porcinai, S.; Radicati, B. Evaluation of the museum environmental risk by means of tempera-painted dosimeters. Thermochim. Acta 2000, 365, 25–34. [Google Scholar] [CrossRef]
  7. Odlyha, M.; Cohen, N.S.; Foster, G.M.; West, R.H. Dosimetry of paintings: Determination of the degree of chemical change in museum exposed test paintings (azurite tempera) by thermal analysis and spectroscopic. Thermochim. Acta 2000, 365, 53–63. [Google Scholar] [CrossRef]
  8. Edwards, R.D.; Lam, N.L.; Zhang, L.; Johnson, M.A.; Kleinman, M.T. Nitrogen dioxide and ozone as factors in the availability of lied from lead-based paints. Environ. Sci. Technol. 2009, 43, 8516–8521. [Google Scholar] [CrossRef]
  9. Machado, A.; Vilarigues, M. Blue enamel pigment—Chemical and morphological characterization of its corrosion process. Corros. Sci. 2018, 139, 235–242. [Google Scholar] [CrossRef]
  10. Herrera, A.; Cardell, C.; Pozo-Antonio, J.S.; Burgos-Cara, A.; Elert, K. Effect of proteinaceous binder on pollution-induced sulfation of lime-based tempera paints. Prog. Org. Coat. 2018, 123, 99–110. [Google Scholar] [CrossRef]
  11. Grosjean, D.; Whitmore, P.M.; de Moor, C.P.; Cass, R.; Druzik, J.R. Fading of Alizarin and related artists’ pigments by atmospheric ozone: Reaction products and mechanism. Environ. Sci. Technol. 1987, 21, 635–643. [Google Scholar] [CrossRef] [PubMed]
  12. Van den Brink, O.F.; Eijkel, G.B.; Boon, J. Dosimetry of paintings: Determination of the degree of chemical change in museum-exposed test paintings by mass spectroscopy. Thermochim. Acta 2000, 365, 1–23. [Google Scholar] [CrossRef]
  13. European Environment Agency. Air Pollution Fact Sheet 2013—Spain; European Environment Agency: Copenhagen, Denmark, 2013. [Google Scholar]
  14. Urosevic, M.; Yebra-Rodríguez, A.; Sebastián-Pardo, E.; Cardell, C. Black soiling of an architectural limestone during two-year term exposure to urban air in the city of Granada (S Spain). Sci. Total Environ. 2012, 414, 564–575. [Google Scholar] [CrossRef] [PubMed]
  15. Sabbioni, C. Contribution of atmospheric deposition to the formation of damage layers. Sci. Total Environ. 1995, 167, 49–55. [Google Scholar] [CrossRef]
  16. Brimblecombe, P.; Grossi, C.M. Aesthetic thresholds and blackening of stone buildings. Sci. Total Environ. 2005, 349, 175–189. [Google Scholar] [CrossRef]
  17. Rivas, T.; Pozo, S.; Paz, M. Sulphur and oxygen isotope analysis to identify sources of sulphur in gypsum-rich black crusts developed on granites. Sci. Total Environ. 2014, 482–483, 137–147. [Google Scholar] [CrossRef]
  18. Mayer, R. Materiales y Técnicas del Arte; Blume, H., Ed.; Mateu Cromo, S.A. Pinto: Madrid, Spain, 1985; p. 687. [Google Scholar]
  19. Price, M. A renaissance of color: Particle separation and preparation of azurite for use in oil painting. Leonardo 2000, 33, 281–288. [Google Scholar] [CrossRef]
  20. Gueli, A.M.; Bonfiglio, G.; Pasquale, S.; Sebastiano, O.T. Effect of particle size on pigments colour. Color Res. Appl. 2016, 42, 236–243. [Google Scholar] [CrossRef] [Green Version]
  21. Cardell, C.; Herrera, A.; Guerra, I.; Navas, N.; Simón, L.R.; Elert, K. Pigment-size effect on the physico-chemical behavior of azurite-tempera dosimeters upon natural and accelerated photo aging. Dyes Pigment. 2017, 141, 53–65. [Google Scholar] [CrossRef]
  22. Pozo-Antonio, J.S.; Barral, D.; Herrera, A.; Elert, K.; Rivas, T.; Cardell, C. Effect of tempera paint composition on their superficial physical properties- application of interferometric profilometry and hyperspectral imaging techniques. Prog. Org. Coat. 2018, 117, 56–68. [Google Scholar] [CrossRef]
  23. Pérez, M.; Castro, K.; Rodríguez, M.D.; Olazabal, M.A.; Madariaga, J.M. A critical analysis of commercial pigments. In Proceedings of the ART 2002, the 7th International Conference on Non-destructive Testing and Microanalysis for the Diagnostics and Conservation of the Cultural and Environmental Heritage, University of Antwerp, Antwerp-Wilrijk, Belgium, 2–6 February 2002; pp. 173–182. [Google Scholar]
  24. Elert, K.; Herrera, A.; Cardell, C. Pigment-binder interactions in calcium-based tempera paints. Dyes Pigment. 2018, 148, 236–248. [Google Scholar] [CrossRef]
  25. Han, K.; Nam, J.Y.; Ji, J.E.; Kang, D.; Lee, H.; Baek, N. Existence of nanoparticles in azurite and malachite pigments by Raman spectroscopy and X-ray diffraction studies. Dyes Pigment. 2016, 133, 232–237. [Google Scholar] [CrossRef]
  26. Rivas, T.; Pozo-Antonio, J.S.; Barral, D.; Martínez, J.; Cardell, C. Statistical analysis of colour changes in tempera paints mock-ups exposed to urban and marine environment. Meas. J. Int. Meas. Confed. 2018, 118, 298–310. [Google Scholar] [CrossRef]
  27. Eastaugh, N.; Walsh, V.; Chaplin, T.; Siddall, R. Pigment Compendium. A Dictionary of Historical Pigments; Butterworth-Heineman: Oxford, UK, 2004. [Google Scholar]
  28. Cardell, C.; Navarrete, C. Pigments and plasterworks analyses of Nasrid Polychromed Lacework Stucco in the Alhambra (Granada, Spain). Stud. Conserv. 2006, 51, 161–176. [Google Scholar] [CrossRef]
  29. Aru, M.; Burgio, L.; Rumsey, M.S. Mineral impurities in azurite pigments: Artistic or natural selection? J. Raman Spectrosc. 2014, 45, 1013–1018. [Google Scholar] [CrossRef]
  30. Smieska, L.M.; Mullett, R.; Woll, L.F.A.R. Trace elements in natural azurite pigments found in illuminatedmanuscript leaves investigated by synchrotron x-ray fluorescenceand diffraction mapping. Appl. Phys. A 2017, 123, 484. [Google Scholar] [CrossRef]
  31. Navas, N.; Romero-Pastor, J.; Manzano, E.; Cardell, C. Benefits of applying combined diffuse reflectance FTIR spectroscopy and principal component analysis for the study of blue tempera historical painting. Anal. Chim. Acta 2008, 630, 141–149. [Google Scholar] [CrossRef]
  32. Vink, B.W. Stability relations of malachite and azurite. Miner. Mag. 1986, 50, 41–47. [Google Scholar] [CrossRef]
  33. Dei, L.; Ahle, A.; Baglioni, P.; Dini, D.; Ferroni, E. Green degradation products of Azurite in wall paintings: Identification and conservation treatment. Stud. Conserv. 1998, 43, 80–88. [Google Scholar]
  34. Kotulanová, J.; Schweigstillová, S.; Švarcová, D.; Hradil, P.; Bezdička; Grygar, T. Wall painting damage by salts: Causes and mechanisms. Acta Res. Rep. 2009, 18, 27–31. [Google Scholar]
  35. Casoli, A.; Bierzioli, M.; Cremonesi, P. The Chemistry of Egg Binding Medium and Its Interactions with Organic Solvents and Water. Smithson. Contrib. Mus. Conserv. 2012, 3, 39–44. [Google Scholar]
  36. Edelstein, S. Food Science. In An Ecological Approach, 2nd ed.; Jones and Bartlett Learning: Burlington, MA, USA, 2013; p. 678. [Google Scholar]
  37. Papanastasiou, T.C.; Georgiou, G.C.; Alexandrou, A.N. Viscous Fluid Flow; CRC Press LLC.: Boca Raton, FL, USA, 2000; 413p. [Google Scholar]
  38. Pacheco, F. El arte de la Pintura; Cátedra: Madrid, Spain, 1990. [Google Scholar]
  39. Herrera, A.; Navas, N.; Cardell, C. An evaluation of the impact of urban air pollution on paint dosimeters by tracking changes in the lipid MALDI-TOF mass spectra profile. Talanta 2016, 155, 53–61. [Google Scholar] [CrossRef] [PubMed]
  40. Pozo-Antonio, J.S.; Rivas, T.; Dionísio, A.; Barral, D.; Cardell, C. Effect of a SO2 rich atmosphere on tempera paint mock-ups. Part 1: Accelerated aging of smalt and lapis lazuli-based paints. Minerals 2020, in press. [Google Scholar]
  41. European Environment Agency. Sulphur Dioxide (SO2): Annual Mean Concentrations in Europe. 2017. Available online: http://www.eea.europa.eu/themes/air/interactive/so2 (accessed on 20 January 2020).
  42. CIE Publication 15-2. Colorimetry; CIE Central Bureau: Vienna, Austria, 1986. [Google Scholar]
  43. CIE S014-4/E. Colorimetry Part 4: CIE 1976 L*a*b* Colour Space, Commission Internationale de l’eclairage; CIE Central Bureau: Vienna, Austria, 2007. [Google Scholar]
  44. UNE-EN ISO 4288. Geometrical Product Specifications (GPS). In Surface Texture: Profile Method, Terms, Definitions and Surface Texture Parameters; Asociación Española de Normalización y Certificación, AENOR: Madrid, España, 1999. [Google Scholar]
  45. BS EN 828-Adhesives. Wettability. In Determination by Measurement of Contact Angle and Surface Free Energy of Solid Surface; European Committee for Standardization, CEN: Brussels, Belgium, 2013. [Google Scholar]
  46. Doerner, M. Los Materiales de Pintura y su Empleo en el Arte; Reverté, S.A.: Barcelona, Spain, 1998; ISBN 84-291-1423-8. [Google Scholar]
  47. Mokrzycki, W.; Tatol, M. Color difference DeltaE-A survey. Mach. Graph. Vis. 2011, 20, 383–411. [Google Scholar]
  48. Liang, H.; Keita, K.; Peric, B.; Vajzovic, T. Pigment identification with optical coherence tomography and multispectral imaging in Proc. OSAV2008. In Proceedings of the 2nd Int. Topical Meeting on Optical Sensing and Artificial Vision, Saint Petersburg, Russia, 12–15 May 2008; p. 33. [Google Scholar]
  49. Nodari, L.; Ricciardi, P. Non-invasive identification of paint binders in illuminated manuscripts by ER-FTIR spectroscopy: A systematic study of the influence of different pigments on the binders’ characteristic spectral features. Heritage Sci. 2019, 7, 7. [Google Scholar] [CrossRef]
  50. Pellegrini, D.; Duce, C.; Bonaduce, I.; Biagi, S.; Ghezzi, L.; Colombini, M.P.; Tinè, M.R.; Bramanti, E. Fourier transform infrared spectroscopic study of rabbit glue/inorganic pigments mixtures in fresh and aged reference paint reconstructions. Microchem. J. 2016, 124, 31–35. [Google Scholar] [CrossRef]
  51. Wang, Q.; Sanad, W.; Miller, L.M.; Voigt, A.; Klingel, K.; Kandolf, R.; Stangl, K.; Baumann, G. Infrared imaging of compositional changes in inflammatory cardiomyopathy. Vib. Spectrosc. 2005, 38, 217–222. [Google Scholar] [CrossRef]
  52. Jhaumeer-Laulloo, S.; Bhowon, M.G.; Reddi, K. Synthesis and characterization of benzamide metal complexes. Asian J. Chem. 2000, 12, 1296–1300. [Google Scholar]
  53. Bruni, S.; Cariati, F.; Casadio, F.; Toniolo, L. Spectrochemical characterization by micro-FTIR spectroscopy of blue pigments in different polychrome works of art. Vib. Spectrosc. 1999, 20, 15–25. [Google Scholar] [CrossRef]
  54. Frost, R.L.; Martens, W.N.; Rintoul, L.; Mahmutagic, E.; Kloprogge, J.T. Raman spectroscopic study of azurite and malachite at 298 and 77 K. J. Raman Spectrosc. 2002, 33, 252–259. [Google Scholar] [CrossRef] [Green Version]
  55. Database of ATR-TIR. Available online: http://lisa.chem.ut.ee/IR_spectra/ (accessed on 1 October 2019).
  56. La Russa, M.F.; Ruffolo, S.A.; Barone, G.; Crisci, G.M.; Mazzoleni, P.; Pezzino, A. The Use of FTIR andMicro-FTIR Spectroscopy: An Example of Application to Cultural Heritage. Int. J. Spectrosc. 2009, 2009, 893528. [Google Scholar] [CrossRef] [Green Version]
  57. Patankar, N.A. Mimicking the Lotus Effect: Influence of Double Roughness Structures and Slender Pillars. Langmuir 2004, 20, 8209. [Google Scholar] [CrossRef] [PubMed]
  58. Feng, L.; Li, S.; Li, Y.; Li, H.; Zhang, L.; Zhai, J.; Song, Y.; Liu, B.; Jiang, L.; Zhu, D. Super-Hydrophobic Surfaces: From Naturalto Artificia. Adv. Mater. 2002, 14, 1857–1860. [Google Scholar] [CrossRef]
  59. Carrasco, E.; Oujja, M.; Sanz, M.; Marco, J.F.; Castillejo, M. X-ray and ion irradiation effects on azurite, malachite and alizarin pictorial models. Microchem. J. 2018, 137, 381–391. [Google Scholar] [CrossRef] [Green Version]
  60. Elert, K.; Benavides-Reyes, C.; Cardell, C. Effect of animal glue on mineralogy, strength and weathering resistance of calcium sulfate-based composite materials. Cem. Concr. Compos. 2019, 96, 274–283. [Google Scholar] [CrossRef]
Figure 1. Stereomicroscope micrographs of aged (SO2) and reference (Ref) azurite (AZ) and malachite (MAL) mock-ups based on egg yolk (E) and rabbit glue (R). EC: extra coarse grain size; C: coarse grain size; M: medium grain size; EF: extra fine grain size; ST: standard grain size.
Minerals 10 00424 g001
Figure 2. a*–b* polar plot of the fresh azurite (AZ) and malachite (MAL) egg yolk (E) and rabbit glue (R)-based paint mock-ups. EC = extra coarse grain size; C = coarse grain size; M = medium grain size; EF = extra fine grain size; ST = standard grain size.
Minerals 10 00424 g002
Figure 3. Color parameters variations (ΔL*, Δa*, and Δb*) and global color change (ΔE*ab) of paint mock-ups after SO2 exposure. (a) AZ-ST-based paints; (b) AZ-EF-based paints; (c) AZ-M-based paints; (d) AZ-C-based paints; (e) AZ-EC-based paints; (f) MAL-based paints. See Table 1 for more information about the paint labeling.
Minerals 10 00424 g003
Figure 4. Reflectance spectra of fresh (Ref in solid line) and aged (SO2 in dashed line) paint mock-ups with egg yolk–E-(a,c,e) and rabbit glue–R-(b,d,f). See Table 1 for paint labeling. (For interpretation of the references to color in the figures legend, the reader is referred to the web version of this article).
Minerals 10 00424 g004
Figure 5. ATR-FTIR (absorbance) spectra for reference (Ref) and aged (SO2) paint mock-ups. Please see Table 1 for paint labeling. (a) AZ-based paints; (b) MAL-based paints.
Minerals 10 00424 g005
Figure 6. SEM micrographs of reference (Ref) and aged (SO2) paint mock-ups made with azurite (AZ-ST, AZ-EC, AZ-C) mixed with egg yolk (E) or rabbit glue (R). Some of the micrographs are accompanied by EDS spectra (depicted through the number EDS). See Table 1 for the labeling of the paint mock-ups.
Minerals 10 00424 g006
Figure 7. SEM micrographs of the reference (Ref) and aged (SO2) paint mock-ups made with malachite (MAL) mixed with egg yolk (E) or rabbit glue (R). Some of the micrographs are accompanied by EDS spectra (depicted through the number EDS). See Table 1 for the labeling of paint mock-ups.
Minerals 10 00424 g007
Figure 8. Micrographs taken with PLM (plane polarized light) from cross sections of reference azurite-based paints made with egg yolk (a) and with rabbit glue (b); reference (c) and SO2 aged (d) AZ-M paints made with egg yolk (E). (e,f) are SEM micrographs of (c,d). Reference (Ref): fresh paints; Aged SO2 paint: SO2. See Table 1 for the labeling of paint mock-ups.
Minerals 10 00424 g008
Figure 9. Maps showing the distribution of chemical elements (Cu, Na, Si, Ca, and S) in an area of the cross section of the SO2 aged AZ-M-E paint obtained by scanning electron microscopy with microanalysis (SEM-EDS).
Minerals 10 00424 g009
Table 1. For each pigment, Kremer and author’s references, mineralogical composition (by means of XRD) and grain size (µm) according to Kremer supplier and to the authors [22], mineral phases identified in the mock-ups by XRD before and after SO2 exposure of the temperas. E: egg yolk-based paints and R: rabbit glue-based mock-ups. Mm: maximum grain size and r: grain size range.
Kremer ReferenceAuthors ReferenceKremer CompositionAuthors CompositionKremer Particle Size (µm)Authors Particle Size (µm)Author Composition before SO2 ExposureAuthor Composition after SO2 Exposure
E-PaintsR-PaintsE-PaintsR-Paints
Azurite MP
extra deep,
Intense dark blue.
Ref 10203
AZ-EC (extra coarse)AzuriteAzurite
Quartz
Malachite
100–80Mm = 90
r = 20–280
Azurite
Quartz
Malachite
Azurite
Quartz
Malachite
Azurite,
Cu2O·(SO4)
2CuSO4·Cu(OH)2·4H2O
Azurite,
Quartz
Cu2O·(SO4)
2CuSO4·Cu(OH)2·4H2O
CaSO3·1/2H2O
Azurite MP deep blue.
Ref 10204
AZ-C
(coarse)
AzuriteAzurite
Quartz
Malachite
80–63Mm = 70
r = 25–180
Azurite
Quartz
Malachite
Azurite
Quartz
Malachite
Azurite
Quartz
Malachite MgSO4·3Mg(OH)2·8H2O
2CuSO4·Cu(OH)2·4H2O
Azurite
Quartz
2CuSO4·Cu(OH)2·4H2O
Azurite MP Pale light blue.
Ref 10206
AZ-M
(medium)
AzuriteAzurite
Quartz
Malachite
63–38Mm = 45
r = 20–110
Azurite
Quartz
Malachite
Azurite
Quartz
Malachite
Azurite
Quartz
CaSO3·1/2H2O
Azurite
Quartz
Malachite
Cu2O·(SO4)
2CuSO4·Cu(OH)2·4H2O
Azurite MP
sky blue,
light greenish blue.
Ref 10207
AZ-EF
(extra-fine)
AzuriteAzurite
Quartz
Malachite
<38Mm = 25
r = 4–90
Azurite
Quartz
Malachite
Azurite
Quartz
Malachite
Azurite
Quartz
Malachite
Cu2O·(SO4)
2CuSO4·Cu(OH)2·4H2O
Azurite
Quartz
2CuSO4·Cu(OH)2·4H2O
Azurite standard,
Deep greenish blue.
Ref 10200
AZ-ST
(standard)
AzuriteAzurite
Quartz
Malachite
<120Mm = 22
r = 0.2–55
Azurite
Quartz
Malachite
Azurite
Quartz
Malachite
Azurite
Quartz
Malachite
2CuSO4·Cu(OH)2·4H2O
Azurite
Quartz
Malachite
2CuSO4·Cu(OH)2·4H2O
Malachite
Natural standard.
Ref 10300
MALMalachiteMalachite
Pseudomalachite
Quartz
<120Mm = 25
r = 0.2–112
Malachite
Pseudomalachite
Malachite
Quartz
Malachite
Pseudomalachite
Bassanite
Na2Cu(SO4)2
Malachite
Pseudomalachite
Bassanite
Na2Cu(SO4)2
Note: Azurite (AZ), Malachite (MAL), EC = extra coarse; C = coarse; M = medium; EF = extra fine; ST = standard. Pseudomalachite: Cu5(PO4)2(OH)4; Bassanite: CaSO4·1/2H2O.
Table 2. L* CIELAB parameter of reference (fresh) paint mock-ups made with azurite (AZ) or malachite (MAL) mixed with either egg yolk (E) or rabbit glue (R).
SampleEgg Yolk (E)Rabbit Glue (R)
L*L*
AZ-EC32.0833.29
AZ-C32.8034.65
AZ-M33.8036.28
AZ-EF38.8943.26
AZ-ST34.7738.23
MAL56.4360.03
Note: EC = extra coarse; C = coarse; M = medium; EF = extra fine; ST = standard.
Table 3. Gloss values (G), gloss variations (ΔG), average maximum profile height (Rz), and corresponding variation (ΔRz) between fresh (before SO2) and SO2 aged (after SO2) paint mock-ups. Standard deviations are also shown.
SampleGbefore SO2Gafter SO2ΔGRzbefore SO2Rzafter SO2ΔRz
AZ-EC-E1.60 ± 0.002.03 ± 0.060.43 ± 0.0641.90 ± 10.7135.17 ± 3.55−6.73 ± 11.29
AZ-EC-R0.50 ± 0.000.40 ± 0.00−0.1 ± 0.0047.03 ± 10.0270.70 ± 6.2023.67 ± 11.78
AZ-C-E0.70 ± 0.001.00 ± 0.000.30 ± 0.0044.60 ± 5.3737.43 ± 6.39−7.17 ± 6.70
AZ-C-R0.80 ± 0.000.73 ± 0.12−0.07 ± 0.1243.70 ± 3.0044.43 ± 5.180.73 ± 5.99
AZ-M-E2.43 ± 0.062.10 ± 0.00−0.33 ± 0.0651.87 ± 10.1943.07 ± 3.56−8.80 ± 10.80
AZ-M-R1.30 ± 0.000.50 ± 0.10−0.80 ± 0.3169.80 ± 2.07110.67 ± 11.1440.87 ± 11.33
AZ-EF-E2.10 ± 0.001.00 ± 0.00−1.10 ± 0.0078.13 ± 12.9181.47 ± 6.003.33 ± 12.24
AZ-EF-R1.80 ± 0.000.87 ± 0.12−0.93 ± 0.11107.30 ± 4.59116.30 ± 17.129.99 ± 17.73
AZ-ST-E1.53 ± 0.061.20 ± 0.10−0.33 ± 0.12113.23 ± 17.0488.77 ± 12.86−24.47 ± 21.35
AZ-ST-R1.20 ± 0.000.40 ± 0.00−0.80 ± 0.00132.40 ± 10.96126.53 ± 5.00−5.87 ± 12.05
MAL-E1.50 ± 0.001.40 ± 0.17−0.10 ± 0.1787.47 ± 44.2968.27 ± 10.83−19.20 ± 45.59
MAL-R0.80 ± 0.000.70 ± 0.00−0.10 ± 0.0069.37 ± 7.6668.73 ± 34.26−0.63 ± 35.11
Note: AZ = azurite; MAL = malachite; EC = extra coarse; C = coarse; M = medium; EF = extra fine; ST = standard. R = rabbit glue binder. E = Egg yolk binder.
Table 4. Static contact angle (SCA) of reference paint mock-ups. See Table 1 for paint sample labeling.
SampleEgg Yolk-Based Paints (E)Rabbit Glue-Based Paints (R)
Binder75.20 ± 1.04n.d.
AZ-EC73.35 ± 2.04113.76 ± 3.36
AZ-C72.84 ± 3.24103.83 ± 0.32
AZ-M80.62 ± 5.4996.42 ± 2.51
AZ-EF88.13 ± 4.17109.13 ± 3.50
AZ-ST92.56 ± 6.42108.98 ± 3.78
MAL83.67 ± 6.21121.49 ± 3.53
Note: AZ = azurite; MAL = malachite; EC = extra coarse; C = coarse; M = medium; EF = extra fine; ST = standard. n.d. = not detected.

