
Arid AREAS Water-Piled Photovoltaic Prevents Evaporation Effects Research

1
College of Hydraulic and Civil Engineering Xinjiang, Xinjiang Agricultural University, 311 Nongda East Road, Urumqi 830052, China
2
Xinjiang Water Conservancy and Hydropower Survey and Design Institute Co., Urumqi 830099, China
*
Author to whom correspondence should be addressed.
Water 2023, 15(21), 3716; https://doi.org/10.3390/w15213716
Submission received: 30 August 2023
/
Revised: 13 October 2023
/
Accepted: 20 October 2023
/
Published: 24 October 2023
(This article belongs to the Topic Advances in Hydro-Geological Research in Arid and Semi-Arid Areas)
Abstract
:(1) Background: In arid and semi-arid reservoirs, water surface evaporation is the main method of water dissipation in order to inhibit the evaporation of water and enhance economic efficiency. The evaporation inhibition rate of water-piled PV at different times of the year is derived from the anti-evaporation test of water-piled PV, and a new idea is proposed for water conservation in plains reservoirs in arid areas. (2) Methods: The test was conducted by dividing the area into groups A and B, with and without PV panel shading. In situ observation and numerical calculation were used to measure the atmosphere’s temperatures, test group, and PV module. The saturated water vapor pressure difference was then calculated according to Dalton’s principle to analyze the economic benefits of water saving. (3) Results: Based on the test results, it was found that the shading of PV panels had a cooling effect on the water body, the PV module, and the atmosphere. Group A showed a 44.2% decrease in the saturation water vapor pressure difference compared to Group B. The maximum evaporation suppression rate of 40.2% was observed in July, while the minimum rate of 12.2% was observed in January. The average evaporation suppression rate for the entire year was 29.2%. By utilizing the annual water savings for agricultural irrigation, it is possible to cover 38 hm2 of land and generate a revenue of 39,000 CNY. (4) Conclusions: The photovoltaic water cover can effectively reduce water evaporation and generate economic benefits.
1. Introduction
Climate change is a pressing issue that affects all of humanity. The greenhouse effect, caused by harmful emissions, has far-reaching consequences [1,2]. However, reducing these emissions is a crucial step in mitigating the effects of climate change. In 2015, 192 countries came together in France to sign the Paris Agreement, which aimed to address the issue of carbon emissions [3]. One promising solution is the development of alternative energy sources like wind, solar, and geothermal, which can help to reduce carbon dioxide emissions significantly. Solar photovoltaic power generation is an up-and-coming energy source that is strongly supported by many countries worldwide. By installing photovoltaic, corresponding policy subsidies are given, and the cost of building photovoltaic power plants has been reduced by 85% compared to 2010. In 2020, new solar photovoltaic power generation accounted for over 50% of annual new energy generation, making it the primary contributor to new energy generation [4]. Although land PV covers a vast area, cleaning it is not easy, and wind and sand reduce power generation. Conversely, waterborne photovoltaics can be an excellent solution to this problem, providing the advantages of saving land area, improving power generation, reducing water evaporation, and the ability to combine it with hydroelectric power generation to improve economic efficiency [5,6]. Waterborne photovoltaics (WPV) are divided into floating photovoltaic (FPV) and pile-based photovoltaic (PPV), and water-based pile-based PV is mainly applied in areas where the water depth does not exceed 3 m. Prefabricated pipe pile-type concrete is used as the pile foundation, which is suitable for small lakes, rivers, reservoirs, artificial fishponds, and other environments.
Research on water resource utilization in arid and semi-arid areas has been a topic of great interest. The connection between human activity and the natural watershed in these areas is crucial. The socio-ecological coupling system of human–water relations can be described by using nD [7]. Some scholars have investigated the allocation of water resources and ecological water supply [8]. Their findings suggest that vegetation in the terminal lake area depends heavily on ecological water use [9]. Additionally, the benefits of using an arid area’s ecology, landscape, and water resources can be evaluated and traded off. Predicting the evolution of lake boundaries can aid in protecting the arid area lake ecosystems [10]. Various methods have been proposed to address this concern, including utilizing palm fronds to cover the water surface. Full coverage of the water surface can reduce evaporation by up to 55%, while semi-coverage can decrease it by 26% [11]. Benzene sheets and other physical materials have also been tested for their efficacy in reducing evaporation rates. Results have shown that the more extensive the coverage, the more significant the reduction in evaporation [12]. Furthermore, studies have been conducted to examine the impact of land photovoltaic installation on evaporation. It has been observed that concentrated lighting reduces evaporation by 21%, while uniform lighting results in a 14% reduction. In contrast, no coverage leads to a 19% reduction in evaporation [13]. Currently, only a limited number of scholars have delved into the effects of FPV. Certain researchers have examined its influence on watersheds and formulated a mathematical model. Their findings indicate that as the coverage of FPV expands, so does the effectiveness of water conservation [14]. The installation of FPV in arid region reservoirs can increase power generation capacity by 58%, synergizing hydroelectric and photovoltaic power generation [15,16]. However, the studies mentioned above are solely based on theoretical models and have not been tested in the field. This raises concerns about the validity of the model as the installation environment and orientation of the reservoir can vary in different regions. Therefore, it is necessary to conduct field tests to verify the effectiveness of the model in real-world scenarios.
Floating photovoltaic (FPV) has been found to be an effective solution for reducing evaporation from water bodies. The rate of evaporation is influenced by temperature and inversely proportional to humidity levels, and through the adjustment of the angle of the photovoltaic (PV) tilt, it has been observed that a significant reduction in evaporation can be achieved. The implementation of single-axis tracking mechanisms or novel photosensitizers has the potential to induce varied levels of energy generation over the course of a year [17,18,19]. Despite the effectiveness of FPV, no relevant experiments have been conducted for waterborne photovoltaic (WPV), which holds practical and economic value in fishery–photovoltaic complementary fish ponds. In this study, we have analyzed and organized the results of experiments conducted on WPV. However, the mechanism of evaporation inhibition at different times has not been elaborated upon. This paper focuses on several research topics. Firstly, it aims to create a prototype observation model test. Then, it examines the primary factors that affect the temperature of water bodies due to PV panels, including the formation of saturated water vapor pressure difference and the day-to-day change process. Additionally, it briefly analyzes the evaporation inhibition rate of WPV on water bodies. Lastly, the paper explores the economic benefits of water saving with WPV technology.
2. Materials and Methods
2.1. Analysis of Solar Energy Resources at the Test Site
This testing site is located within the Tulufan Shengjintai Reservoir, situated in Xinjiang, China, at coordinates 42.50′36″ N for latitude and 89.15′50″ E for longitude. Meteonorm is a tool that provides information on rainfall, solar radiation, and more for a specific area. This region is representative of an arid area with a temperate continental climate characterized by an average annual precipitation of 150 mm. However, it receives an annual sunshine time of up to 3500 h, which is 1.25 times higher than that of Beijing at the same latitude. In Xinjiang, the total annual average solar radiation is 5800 MJ/m2, which is ranked second in the country after Tibet and is 10–15% higher than in similar areas [20]. Comparing the total annual average horizontal solar radiation between the Turpan and Beijing regions, it is evident from Figure 1 that the former receives a significantly higher amount of solar radiation. Specifically, Turpan receives an annual solar radiation of 6061.8 kWh/m2, while Beijing receives 5778.1 kWh/m2, both at the same latitude. This discrepancy is particularly noticeable during July, the summer month when Turpan receives a maximum of 804.6 kWh/m2 compared to Beijing’s 542.5 kWh/m2. During the winter season, the solar radiation levels in both regions are comparable. As Figure 2 exhibits, it is noteworthy that Turpan’s highest single-day radiation is 30.73 kWh/m2, compared to Beijing’s 28 kWh/m2. Consequently, the development of centralized PV and distributed PV in Turpan may prove beneficial [21].
2.2. PV Array Inclination and Azimuth
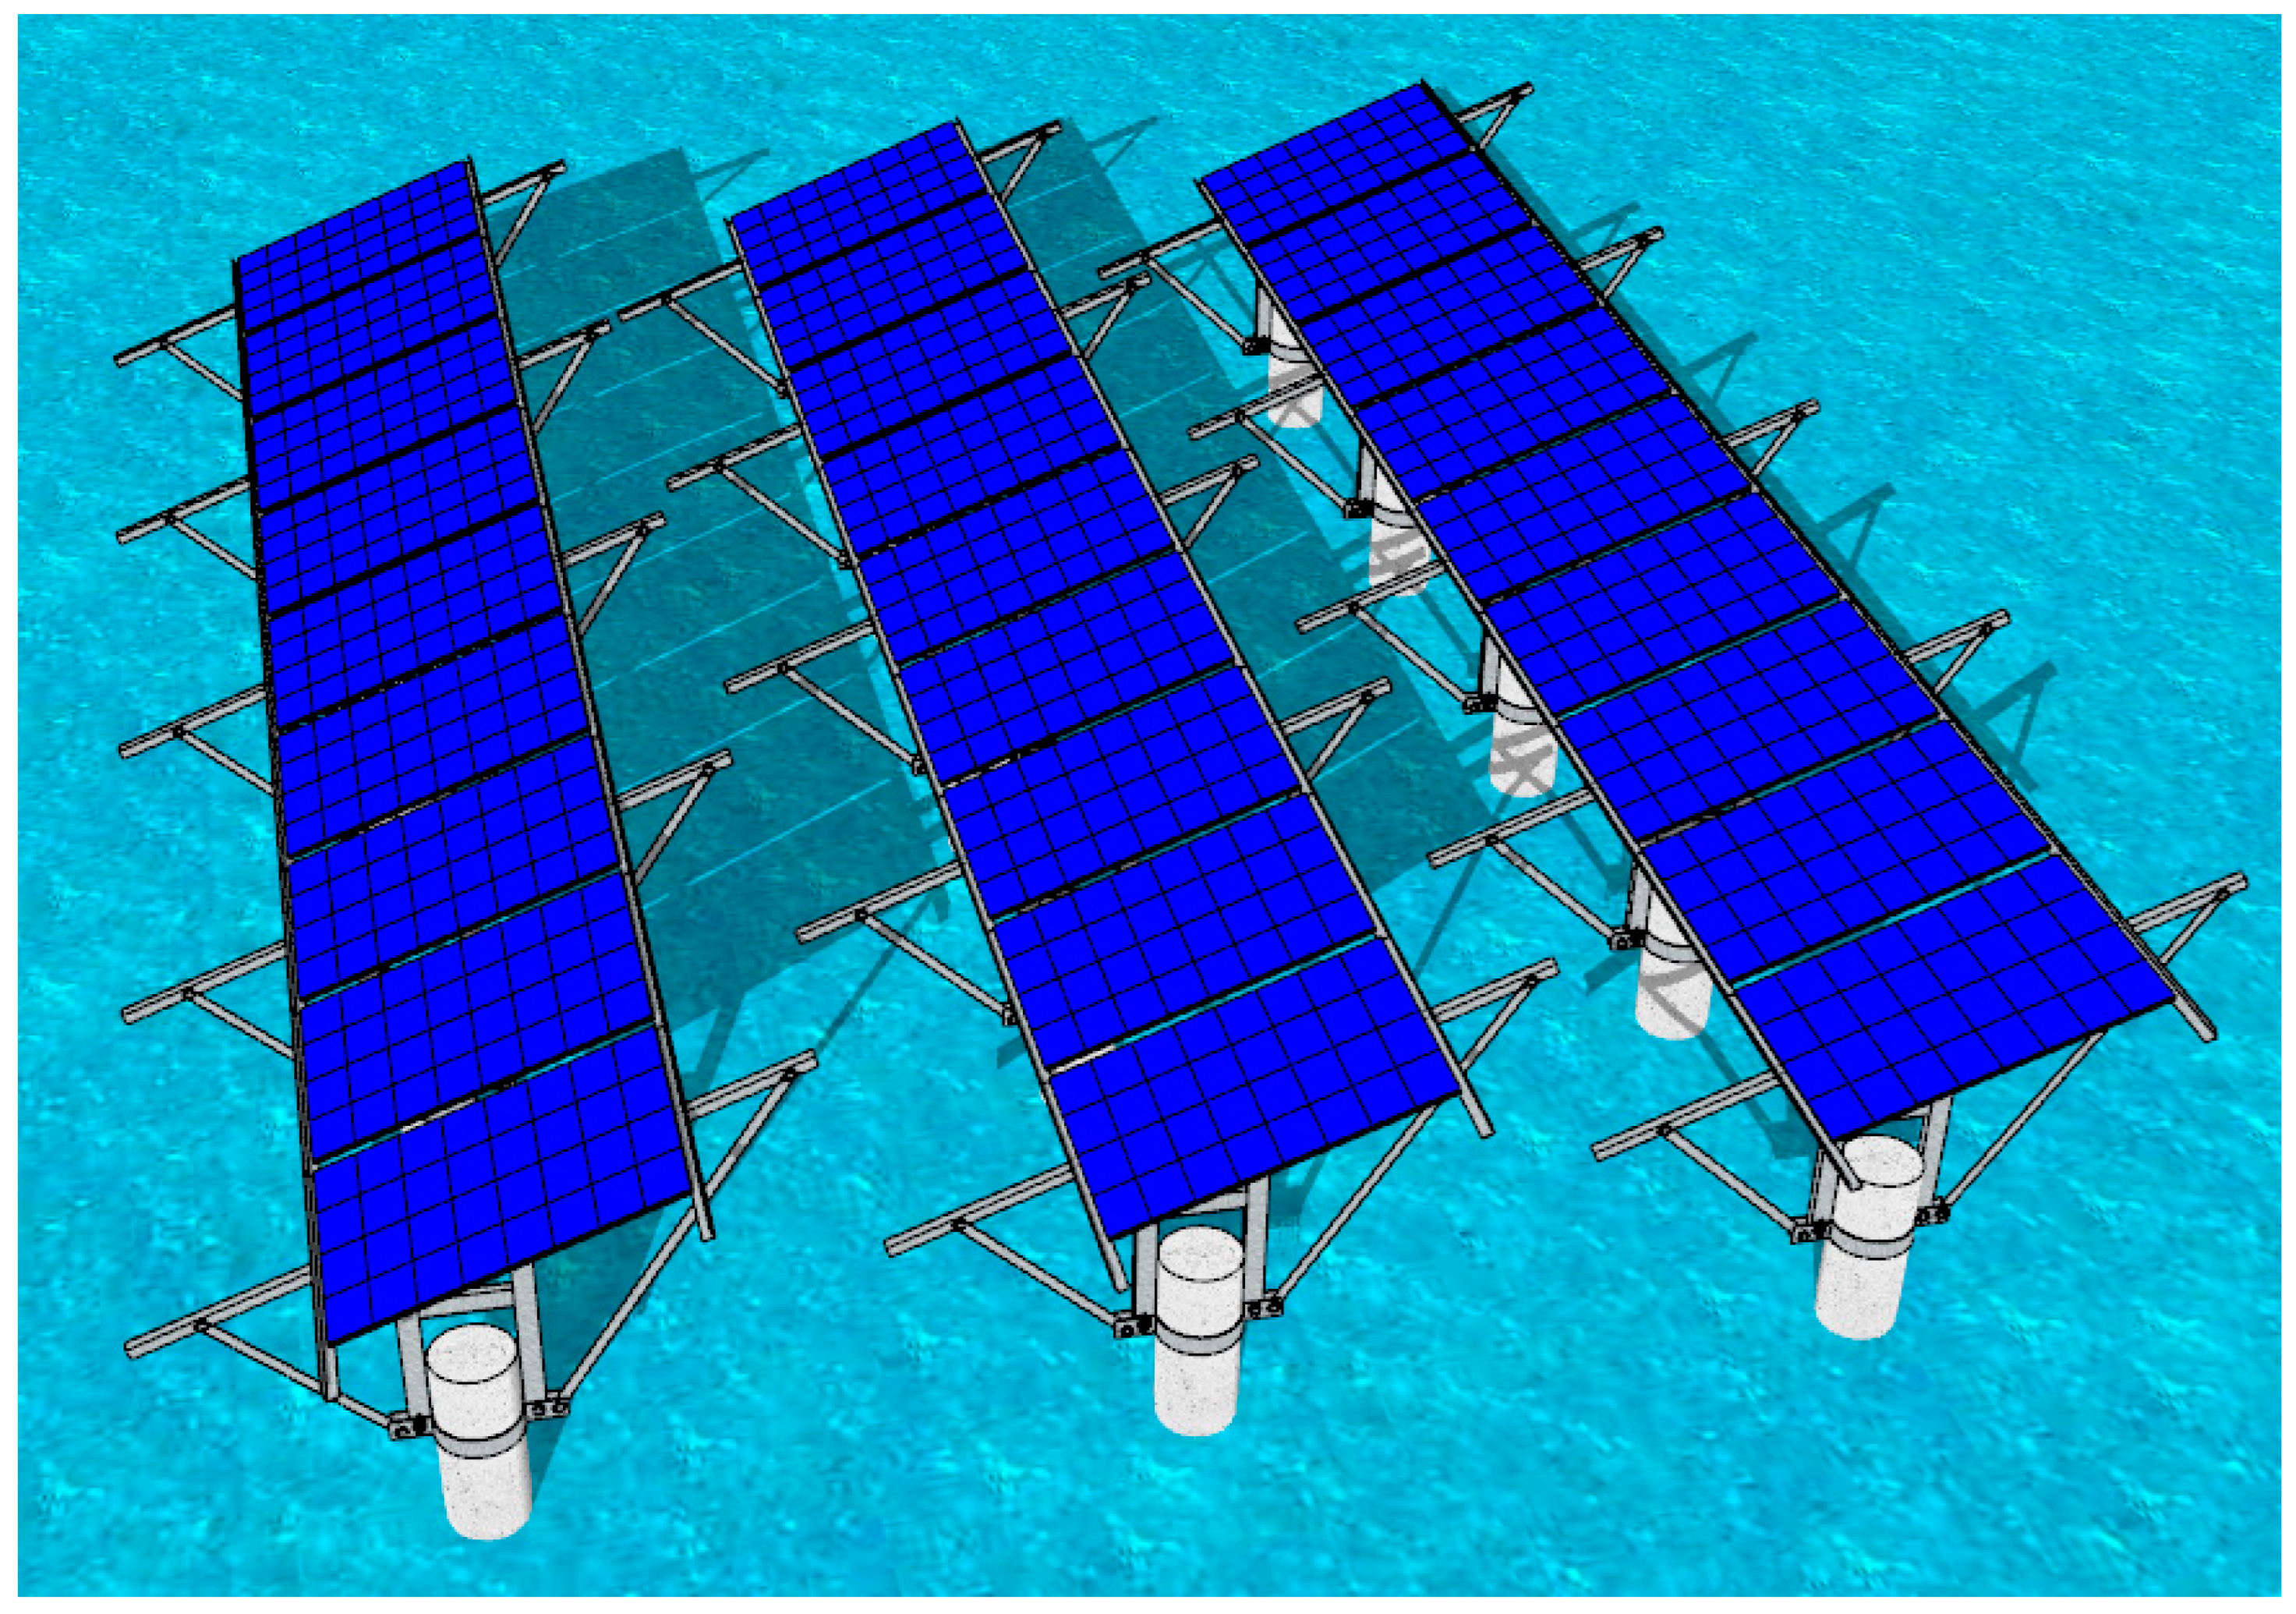
PV arrays require specific angles of azimuth and inclination to maximize solar radiation and power generation [22]. Solar PV arrays require a specific group spacing to prevent mutual shading, as shown in Figure 3. The time zone where the test site is located is East 8, and the shadows were modeled by Sketchup software, which allows for a group spacing of 2 m.
The test site is located in the northern hemisphere, and in order to maximize solar radiation, the PV array is fixed to face south. According to the photovoltaic system design aid software PVsyst, the optimal tilt angle for installing a photovoltaic system in this area is 36°, based on the principle of obtaining the minimum loss of solar radiation.
There are two main methods for calculating water surface evaporation from water bodies: the model calculation method and the in situ measurement method [23]. The current methods for calculating models include the Dalton model, Bowen ratio–energy balance method, Penman equation, water budget method, energy balance method, and Priestley–Taylor model. Measuring evapotranspiration in lakes and reservoirs is crucial for managing water balance in arid and semi-arid regions. The Dalton model, which is used to estimate evapotranspiration in open spaces, has a smaller error rate according to studies [24,25,26]; the calculation for this model is as follows:
where: E is the water surface evaporation; is the wind speed function; is the saturation water vapor pressure difference (VPD); is the water surface temperature corresponding to the saturation water vapor pressure; and is the saturation water vapor pressure in the air.
where: is the temperature of the air, is the water surface temperature corresponding to the saturation water vapor pressure, kPa, and is the temperature in the air.
where: is the saturated water vapor pressure in the air, kPa and RH is the relative humidity.
Therefore, we can obtain the following equation:
This paper quantifies the anti-evaporation effect of PPV on water using scale tests and actual measurement data, utilizing an in situ measurement method. The in situ measurement method was carried out using the E601 evaporator and was modified according to the test area [27,28,29]. The most commonly used method in China for measuring water surface evaporation is the evaporator pan, which is both economical and practical [27,28,29,30]. It is a cylindrical evaporator with a diameter of 20 cm and a height of 10 cm [31]. In this paper, the in situ measurement approach was employed to quantify the level of water evaporation from the designated site. The evaporation rate was monitored over the non-freezing period of one year in its natural state. As illustrated in Figure 4, the test configuration is showcased.
In accordance with the “Surface Water Resources Investigation and Statistical Analysis Technical Rules” test specification, the ideal method to measure water surface evaporation is by employing the E601 evaporator. Subsequently, the test data acquired from this measurement must be translated into the evaporation of the E601 evaporator. It is worth noting that the conversion coefficient may differ depending on the region. For this specific test area, the conversion coefficient utilized is 0.62 [32], and the calculation formula is as follows:
where k is the conversion factor; is the evaporation of large water bodies; and is the evaporation of evaporation pan evaporation.
For our research project, we meticulously selected two evaporator models that had measurements of 1.0 × 1.0 × 0.25 m. We designated these models as A and B, respectively. In order to obtain precise and reliable results, we allocated Group A as the test group, while Group B served as the control group. We ensured that there was no possibility of leakage by lining both evaporators with polypropylene tarpaulin. In addition, we covered the exterior of each evaporator with a heat-resistant blanket to safeguard against solar radiation. For Group A, we strategically positioned solar photovoltaic panels that measured 1.04 × 0.76 m above the evaporator. These panels were tilted at a 36° angle and oriented southward to optimize their exposure to sunlight. Conversely, Group B did not have any form of shading.
In order to determine fluctuations in water levels on a daily basis, the water level stylus method is employed, which boasts a precision of ±0.01 mm. The handheld weather station is utilized to document changes in atmospheric temperature, wind speed, and humidity. The probe of the environmental monitoring system is utilized to oversee fluctuations in water temperature within both evaporators A and B. Furthermore, the CENTER-309 thermometer is employed to gauge temperature changes on the surface of the PV panel, which is installed above both evaporators. The same temperature and humidity recorder is situated above both evaporators at a height of 5 cm.
3. Results
3.1. Temperature Variation
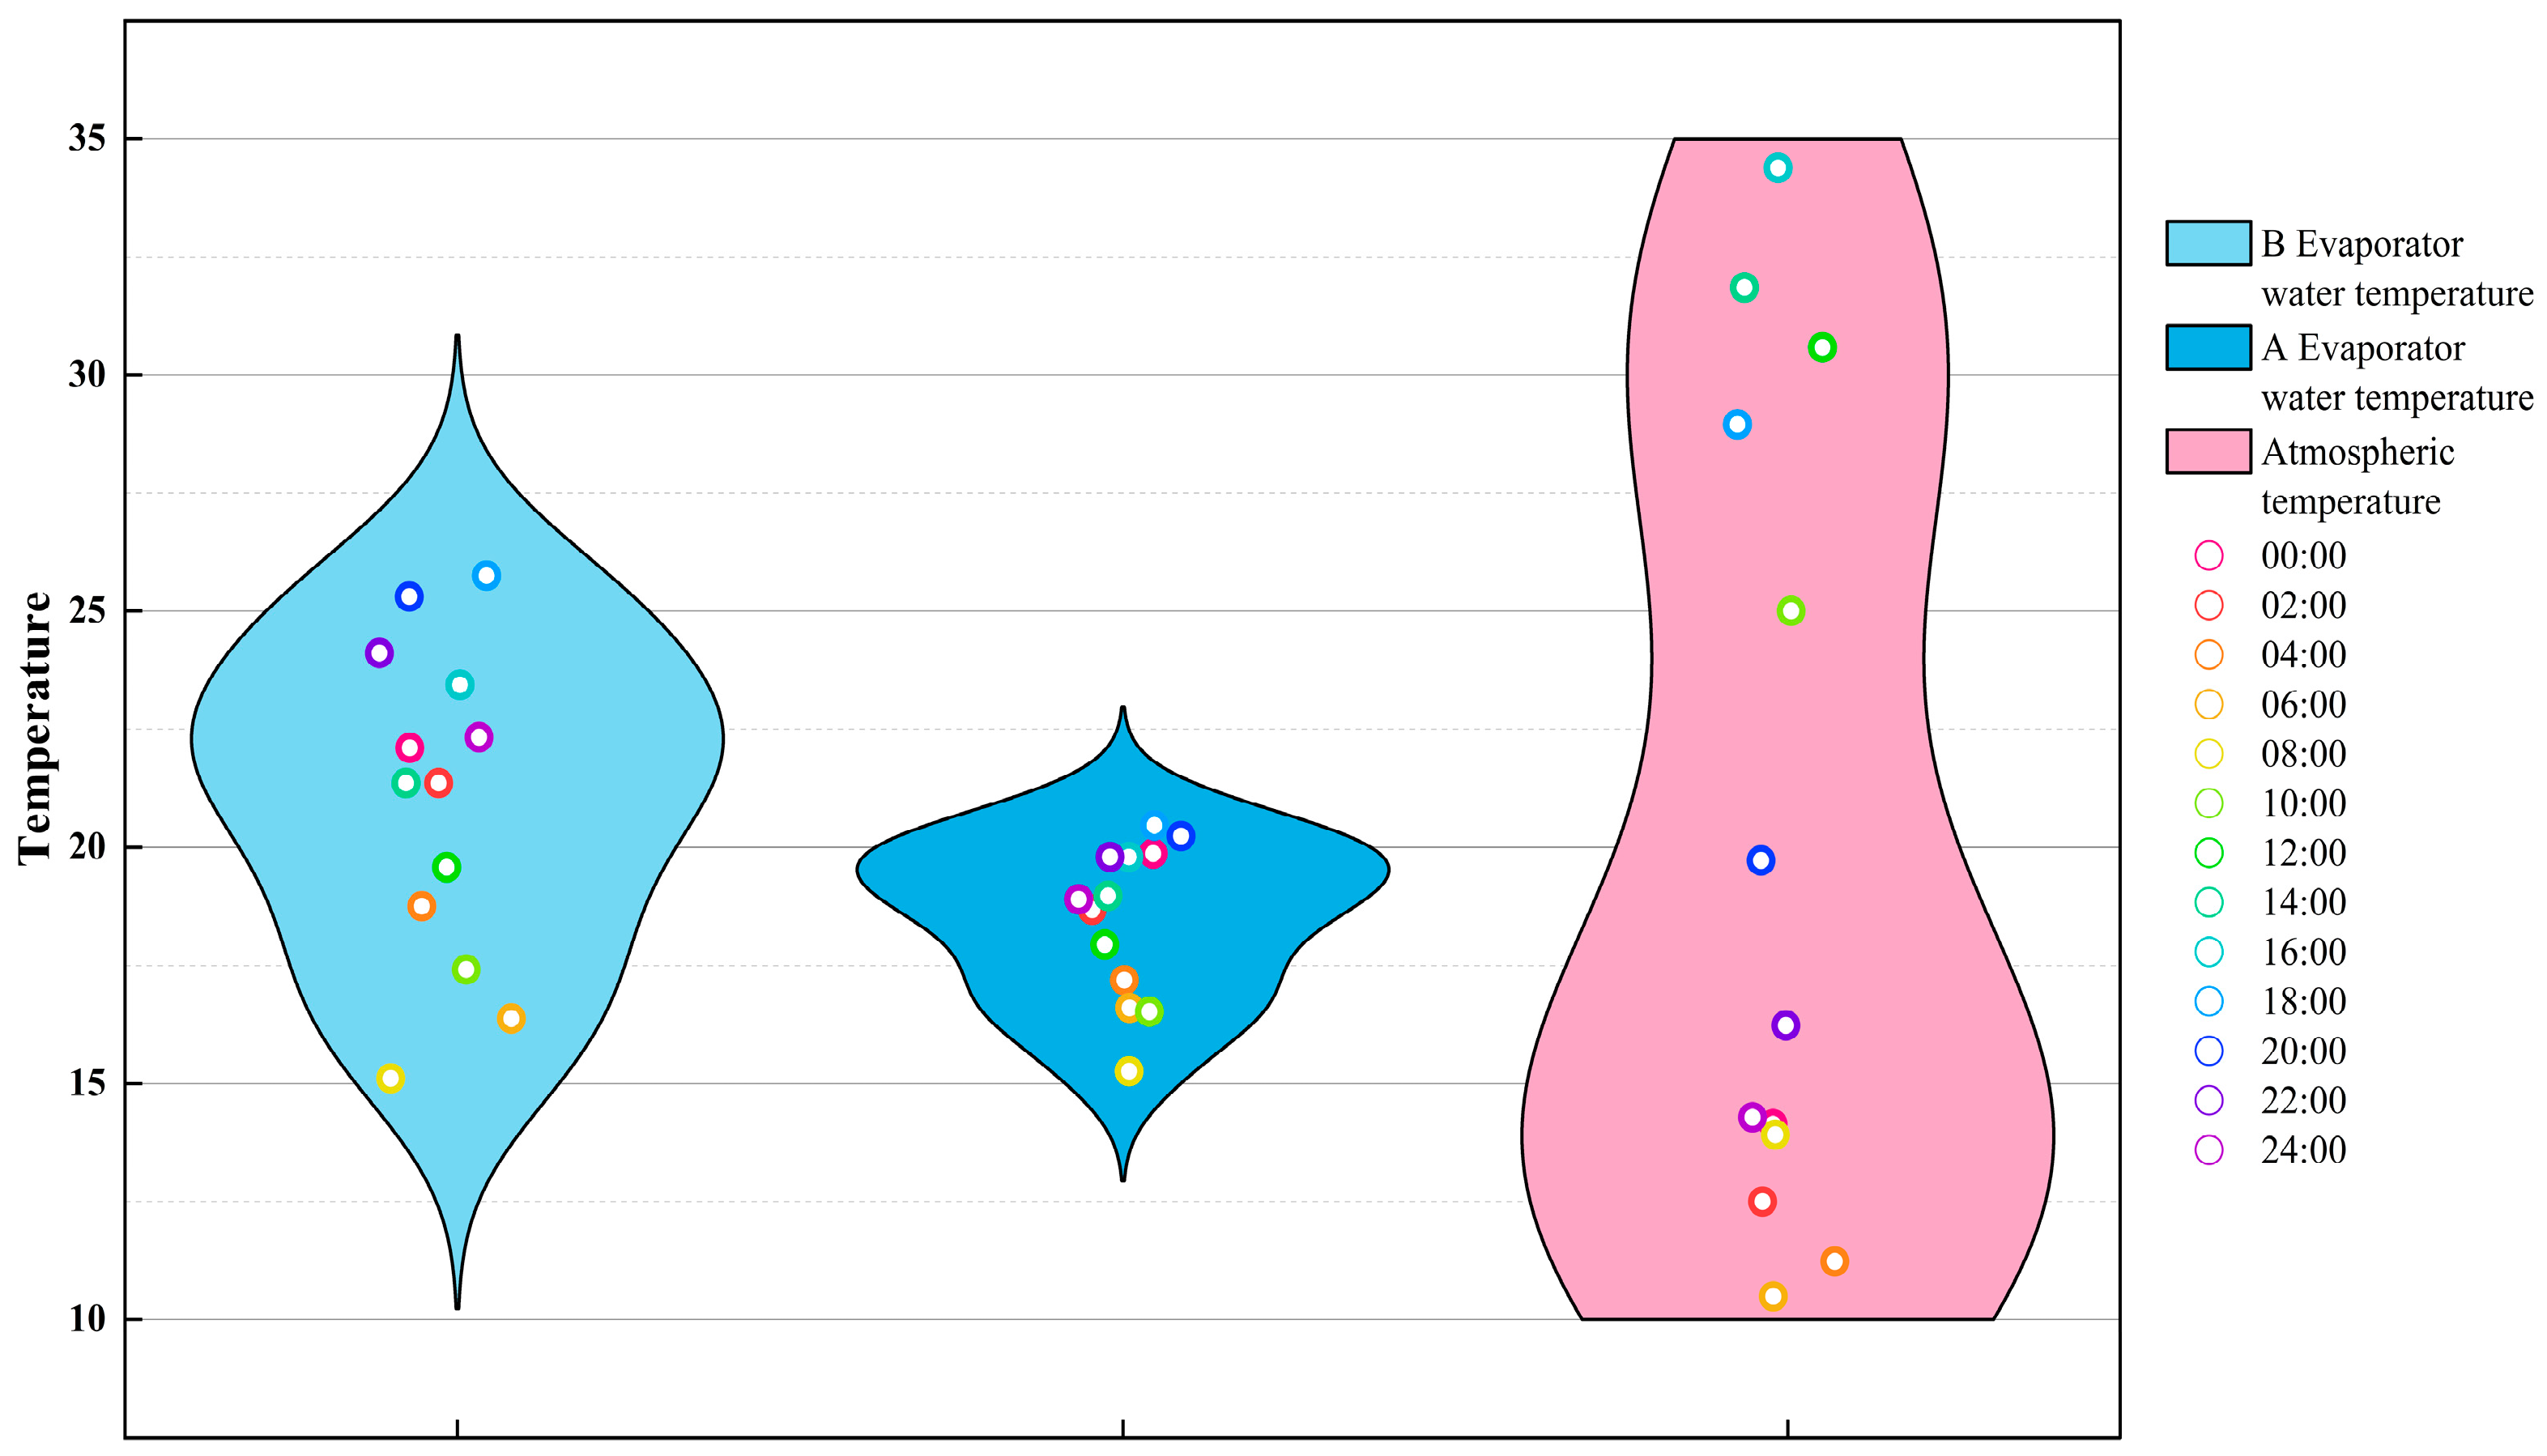
Throughout the course of our experiment, we conducted a thorough analysis of atmospheric temperature for a full day. Our investigative approach incorporated detailed observations of the temperature fluctuations exhibited by both evaporators A and B. Additionally, we carefully monitored the temperature changes that occurred in the water body and PV module of evaporator A, as demonstrated by Figure 5 and Figure 6. These findings have provided us with a comprehensive understanding of the various factors that contribute to atmospheric temperature and have allowed us to draw meaningful conclusions about the nature of these phenomena.
Based on the information presented in Figure 5, it can be inferred that evaporator A has a more concentrated water temperature than evaporator B, and there is a significant temperature difference between the morning and evening atmospheric temperatures. The temperature in the atmosphere increases slowly after 8:00 a.m. The temperature of both evaporators is lower than that of the atmosphere, with Evaporator A exhibiting the lowest water temperature due to the shading provided by photovoltaic panels. This shading reduces the effect of solar radiation on the water surface temperature, thereby slowing the rate of water temperature increase and ultimately minimizing water evaporation. At 18:00, the temperature difference between the two evaporators peaked at 5.3 °C. From 18:00 to 8:00 the following day, the atmospheric temperature remained lower than the temperature of the evaporator due to the hindrance provided by the evaporator and photovoltaic panels to heat dissipation, leading to a slower rate of water temperature reduction. The testing site, situated in a desert area with mostly gravel, experiences rapid heating during the day and cooling at night, resulting in a significant temperature disparity between day and night. Consequently, the atmospheric temperature at night is lower than the temperature of the two evaporators. In comparison to Evaporator B, Evaporator A exhibits an average temperature that is 2.5 °C lower. Figure 6 portrays the temperature variation of the surface of the PV module, revealing that the solar panel’s surface temperature is considerably higher than the water surface temperature inside Evaporator A. The temperature difference averages 6.1 °C, and the temperature difference can reach up to 29.3 °C at 14:00. The average surface temperature of the solar panel is 4.2 °C higher than the atmospheric temperature, with a maximum temperature difference of 16.2 °C. From 20:00 of the succeeding day to 8:00 of the following day, the surface temperature of the PV panel does not show a notable disparity from the atmospheric temperature. This is attributed to the primary components of PV panels, which are metal frames and monocrystalline silicon, resulting in a considerable temperature difference between the surface of the module during day and night due to quick rises and falls. Despite the high surface temperature of the PV panel, the water temperature inside the evaporator is not high. This is due to the absence of direct contact between the PV panel and the water surface. The heat mainly relies on air as a medium of transmission, and the heat transferred to the water surface only accounts for a part of this. The remaining heat is primarily dissipated into the atmosphere.
As previously explained, evaporation is influenced by various factors, with wind speed and saturated water vapor pressure difference being the primary ones. To determine the saturated water vapor pressure difference between the shaded conditions of test Group A’s evaporator and the unshaded conditions of blank control Group B’s evaporator, one can employ Equation (4). The calculation results are shown in Figure 7.
From 6:00 to 8:00, the saturated water vapor pressure difference between the shaded and unshaded groups was relatively similar. However, as the temperature rose between 8:00 and 18:00, the difference gradually increased due to greater evaporation from the water body. Furthermore, the presence of solar panels in the shaded group resulted in water vapor condensation between the photovoltaic panels and the water surface, further reducing the saturated water vapor pressure difference.
Between 18:00 and the following day at 6:00, the temperature decreased, and air humidity increased, leading to a gradual increase in the saturated water vapor pressure difference. By 18:00, the difference in saturated water vapor pressure between the sheltered and unsheltered groups had peaked, with the unsheltered group exhibiting a saturated water vapor pressure 1.12 kPa higher than that of the sheltered group. The daily averages of the saturated water vapor pressure difference between the evaporator in the sheltered Group A and the evaporator in the unsheltered Group B were 0.68 kPa and 1.22 kPa, respectively, and the saturated water vapor pressure difference in the sheltered group was reduced by 44.2% in comparison with that in the unsheltered group.
3.2. Calculation of Evaporation Volume
The tested test data are shown in Figure 8 below:
The evaporation suppression rate under solar PV panel shading is calculated as follows:
where k is the evaporation inhibition rate, %; EB is the evaporation volume of evaporator B, mm; and EA is the evaporation volume of evaporator A, mm.
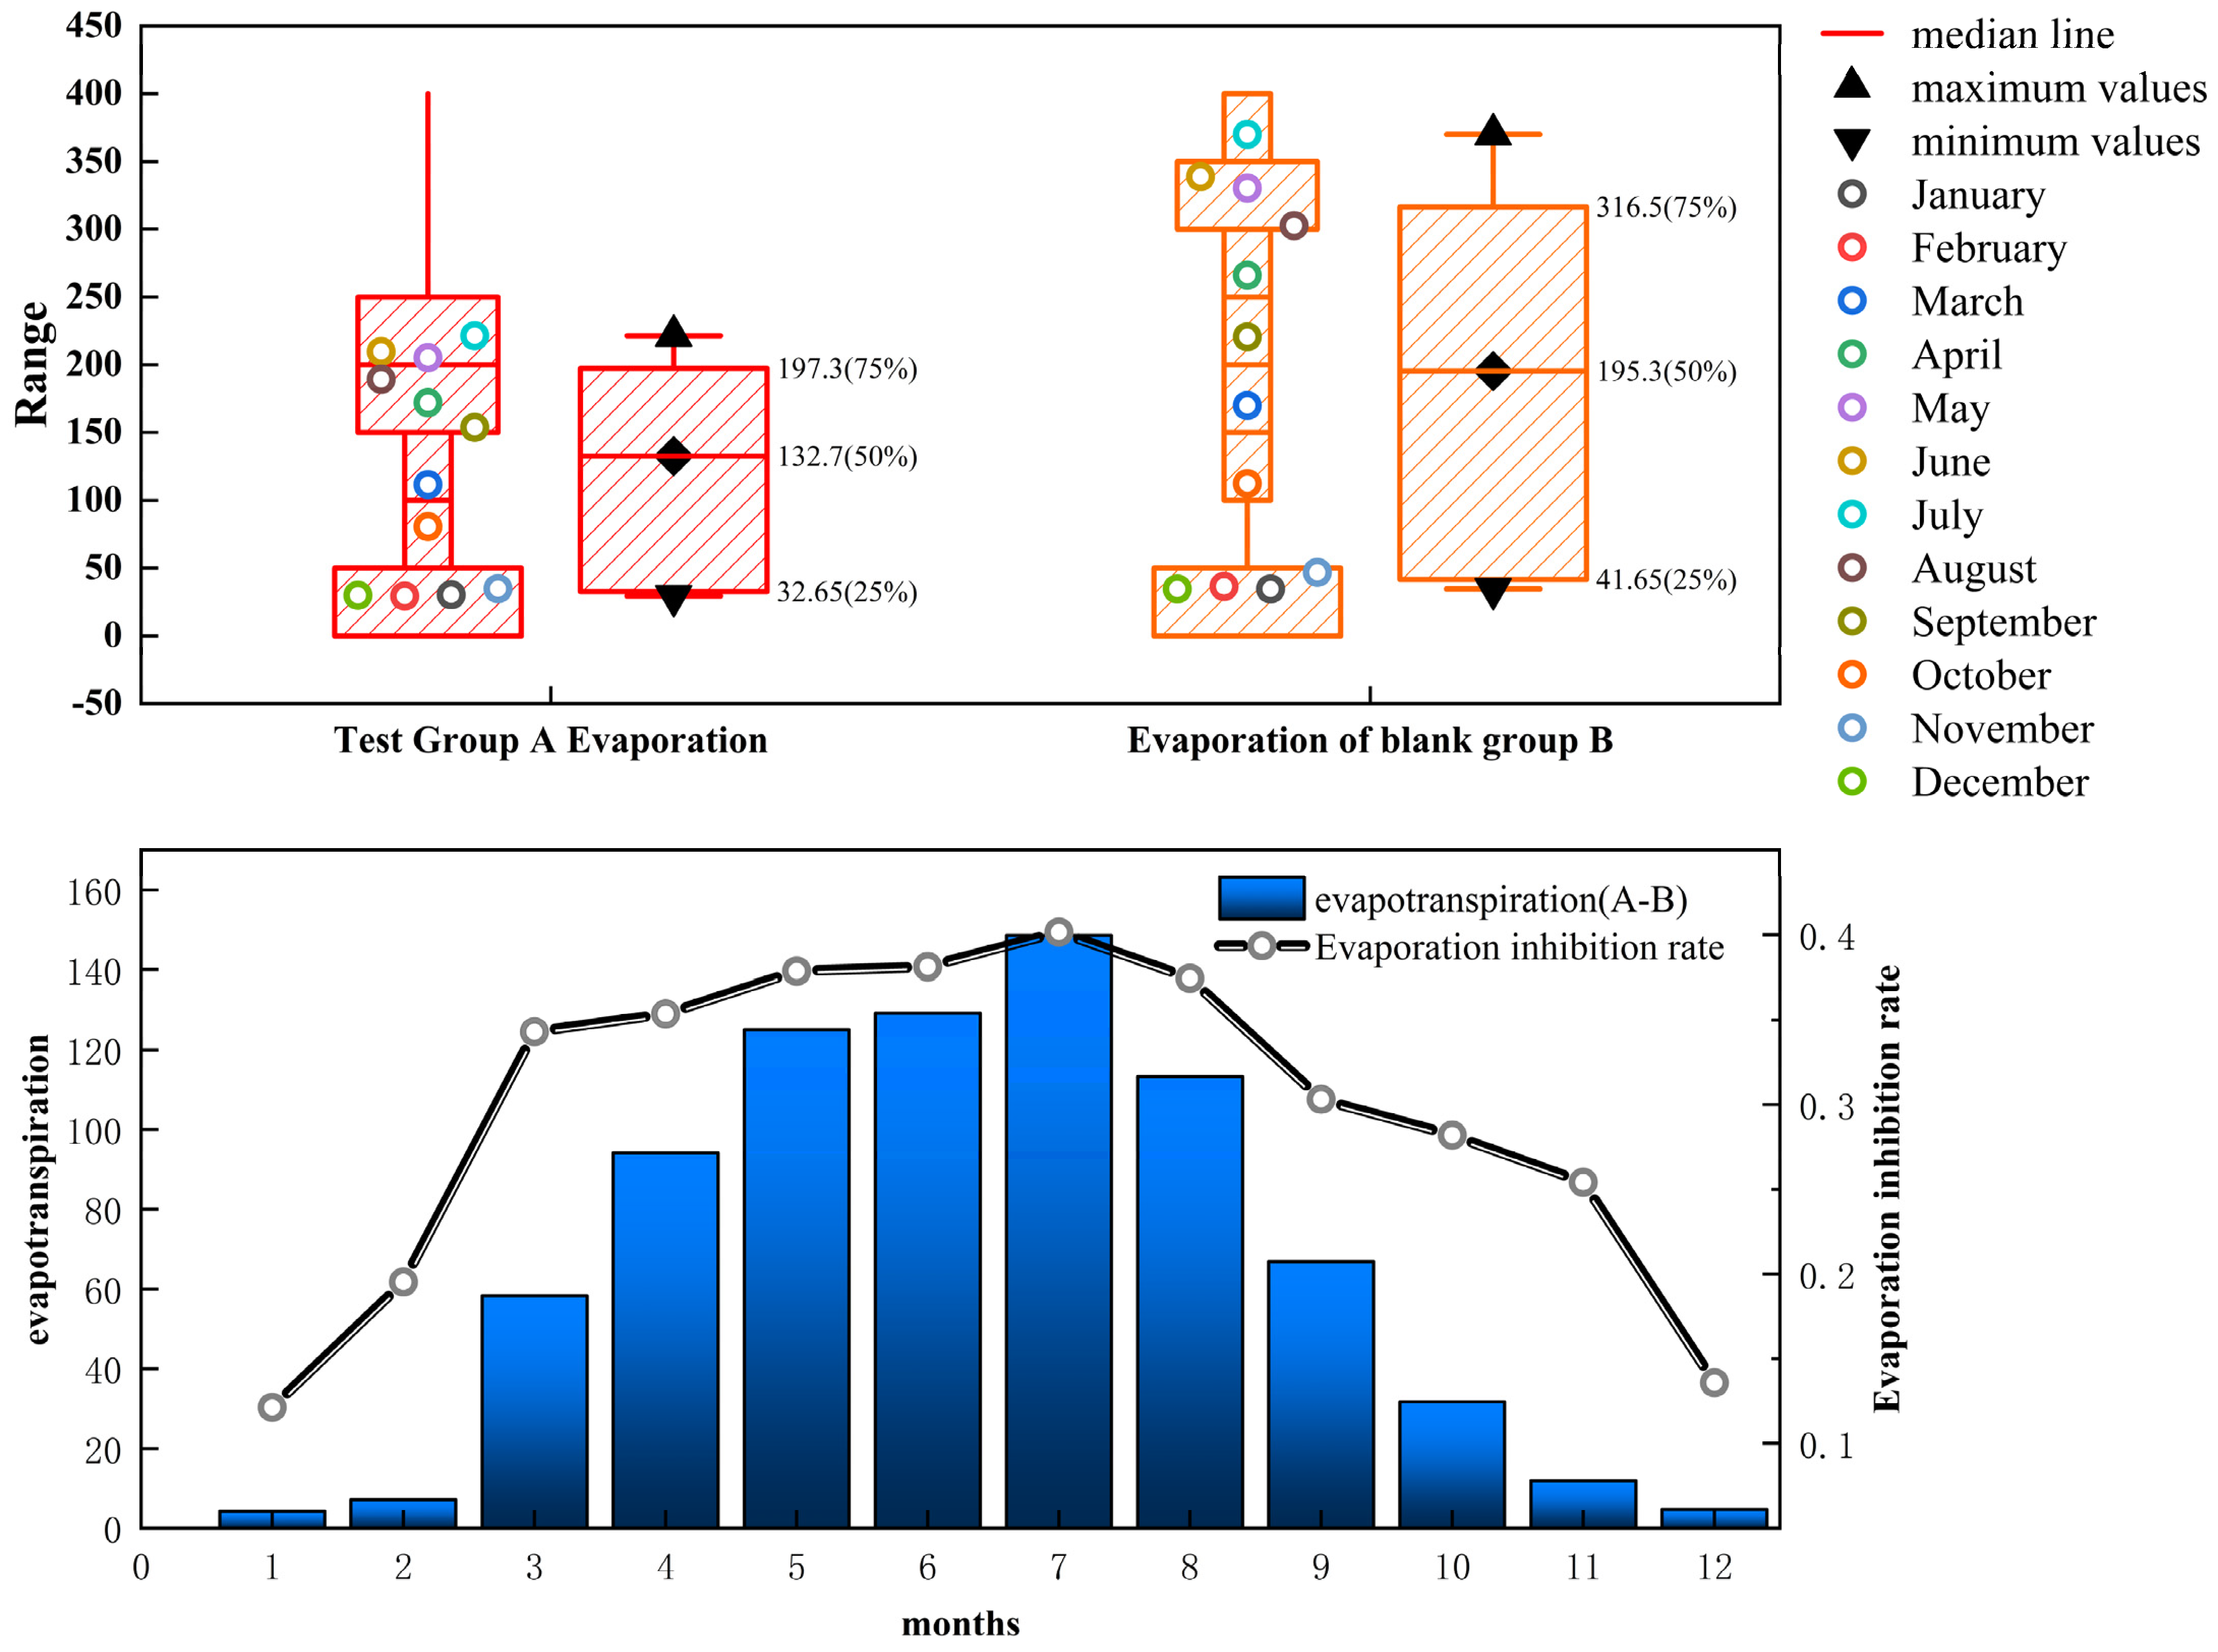
Figure 9 presents a detailed depiction of the evaporation process for evaporators A and B. The diagram showcases the monthly evaporation rates for both evaporators in the upper section. It highlights the difference between the monthly evaporation and the evaporation inhibition rates of A and B in the lower section.
The diagram shows that evaporator A has a more concentrated and consistent monthly evaporation rate than evaporator B, which is more prone to fluctuations caused by air temperature and wind speed. During the winter season, both evaporators A and B have similar evaporation rates due to the water surface freezing, and the photovoltaic panels have minimal impact on the evaporation process. The chart indicates that both evaporators A and B experience an increasing trend in evaporation volume, followed by a decreasing trend, with the maximum volume reached in July. Evaporator A has a total evaporation volume of 221 mm, while evaporator B has an evaporation volume of 370 mm. The evaporation inhibition rate varies in different periods. In July and January, the evaporation inhibition rate can reach a maximum of 40.2% and a minimum of 12.2%, respectively. The average evaporation inhibition rate for the entire year is 29.2%. The shading of photovoltaic panels in summer reduces the temperature of the water surface, which decreases the water vapor pressure difference. As a result, moist air is not replaced by dry air between the water surface and the atmosphere, inhibiting the evaporation of water bodies.
3.3. Economic Benefit Analysis
Based on the information provided about the project area, the reservoir has a total area of 31.6 hectares, making it a small irrigation-type reservoir. If the reservoir were completely covered with photovoltaic panels, it would be possible to calculate the economic benefits of water savings due to PV power generation and panel covering. Figure 10 shows a PPV system based on a reservoir. The specific parameters are shown in Table 1:
Based on the figure provided, the PV system produces DC power that can be utilized by DC loads, stored in batteries, or converted to AC power through an inverter for use by AC loads or a gas turbine. The PV panels used in the test have a power output of 160 w. With the coverage area shown in Table 1, a total of 388,285 PV panels can be installed. The photovoltaic panel used in the test was manufactured by model GHGN-150WDJBZ; each PV panel can generate 0.6 kWh of power per day (without considering losses from the inverter and other factors). This results in a daily power generation of 232,971 kWh, which translates to a revenue of 144,442 CNY per day.
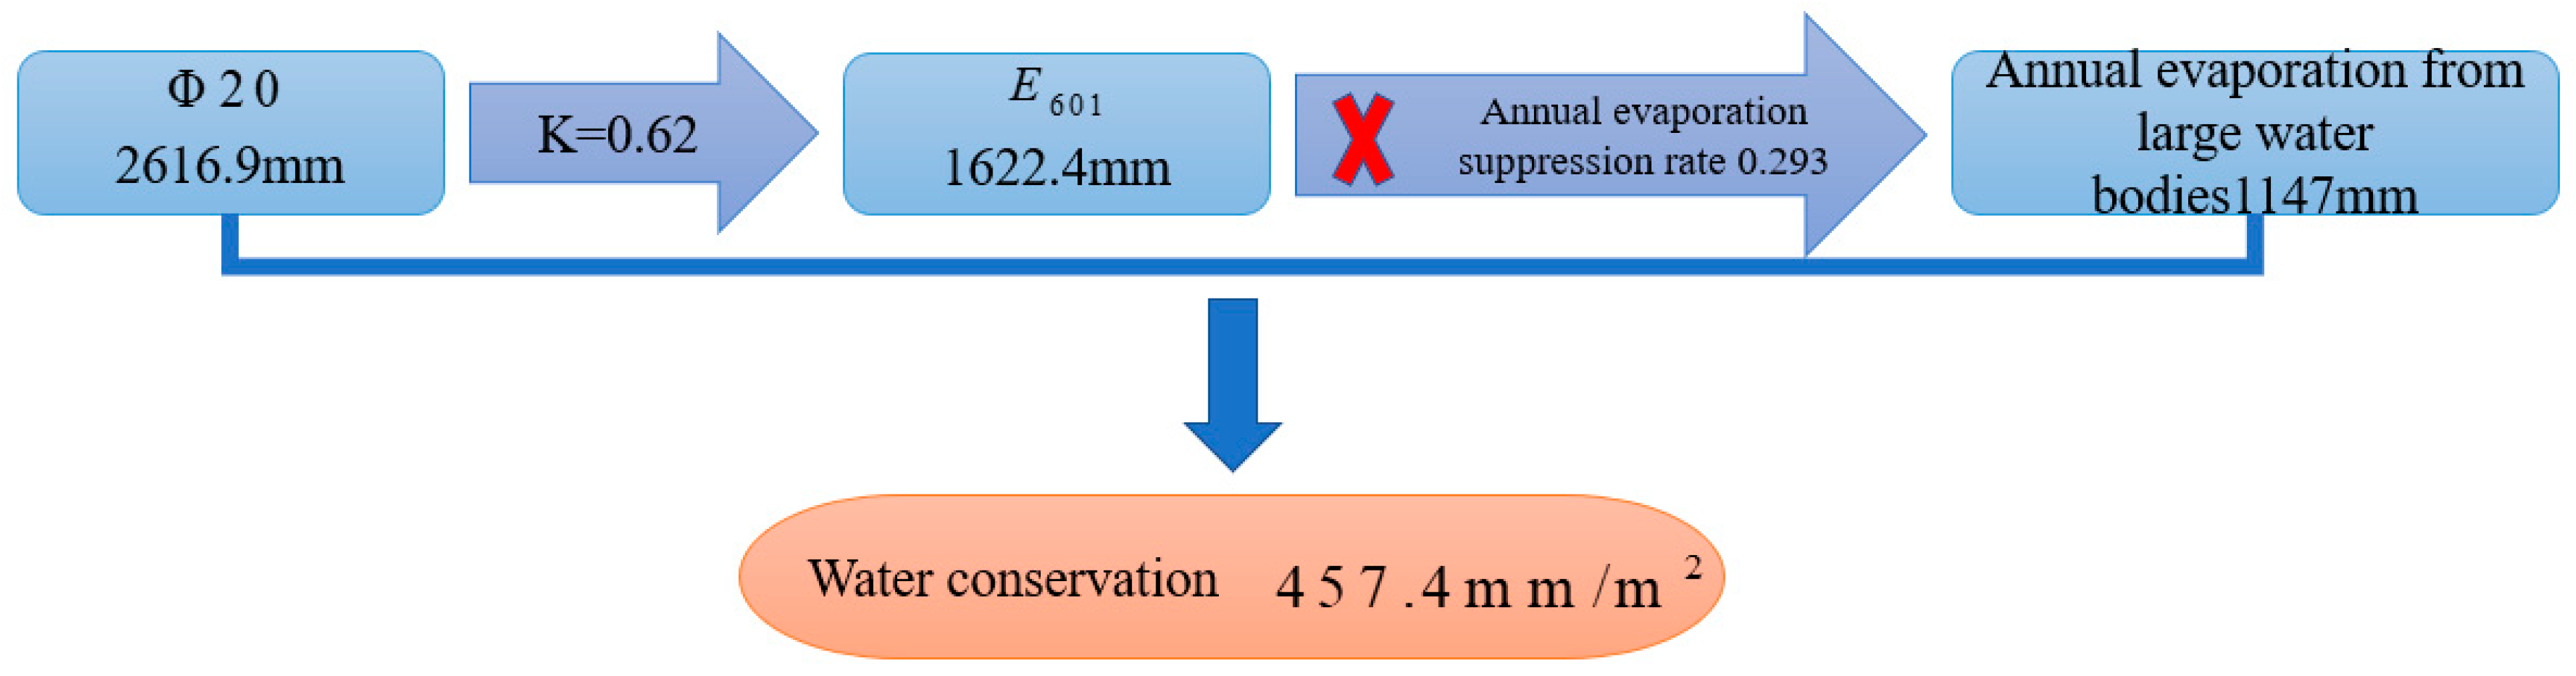
According to the parameters shown in the table above, the evaporation volume of the evaporation pan can be converted into the evaporation volume of the standard evaporator, as shown in Figure 11.
Based on the information provided above, the amount of evaporation varies for each month of the year due to the combined impact of wind speed, temperature, and relative humidity. This also affects the corresponding evaporation inhibition rate. By calculating the evaporation inhibition rate of evaporation panes for each month and converting it to the rate for large water bodies, we can determine the monthly evaporation amount for large water bodies. Please refer to Figure 12 for more details.
Referring to Figure 12, the implementation of a photovoltaic water structure in a vast water body can preserve up to 610.81 mm of water per square meter every year. By utilizing the PV coverage area outlined in Table 1, the corresponding installation area can conserve 166,018 cubic meters of water annually. This amount is equivalent to 14% of the entire capacity of the reservoir. In the surrounding area, the primary crop is grapes, the reservoir water should be utilized primarily for irrigation purposes, the reservoir governs an impressive 267 hectares of irrigation land, and the water saved can be directed toward agricultural purposes, effectively serving an area of 38 hectares and bolstering economic gains. The reservoir sources its water from groundwater, boasting excellent quality with a soluble solids content (TDS) of 519 mg/L. If utilized for drinking water, the tap water in the region is priced at 0.23 CNY/m3, providing an opportunity for revenue generation totaling 39,000 CNY.
4. Discussion
Land-based photovoltaics face the problems of extensive land area, wind and sand, and difficulty in cleaning [33,34], and the development of waterborne photovoltaics can effectively alleviate the increasingly tight land resources.
It has been found that using waterborne photovoltaic systems can effectively decrease water evaporation while increasing power generation capacity [15,35]. The principle of reducing water evaporation lies in the fact that PV panels block direct solar radiation and thus reduce the water surface temperature, which has been verified by different experimental and theoretical approaches [30,36]. However, the research approaches mentioned above did not systematically analyze the temperature of different layers of the water body, and future research directions could be aimed toward the continuous effect of water photovoltaic systems on the stratification effect of water temperature in large water bodies in different seasons. The above studies are based on floating photovoltaic systems but not on pile-based photovoltaic systems. Water-piled photovoltaic has a better spatial effect; the upper layer can implement photovoltaic power generation project, and the water surface can be combined with an anti-evaporation floating ball [37], which can achieve a better effect of preventing the evaporation of the water body, which has essential research value for arid areas.
In rural areas, an emerging trend is the combination of fishery and photovoltaic systems to generate additional income. By leveraging fish’s distinct habits and ability to adjust to water temperatures, a layered aquaculture approach can be achieved in water bodies. Studies have shown that installing aquatic photovoltaic systems on fish ponds can bring significant economic gains [38,39], particularly in implementing this technology within desert regions; it has proven to be effective in addressing concerns surrounding aquaculture in arid areas, mitigating water body evaporation, and providing supplementary benefits [40], but insufficient research exists regarding the integration of waterborne photovoltaics and aquaculture. Further exploration is necessary to establish effective farming techniques and management practices incorporating waterborne photovoltaics. This is attributed to the impact that waterborne photovoltaics may have on water temperature, which can adversely influence the ability of diverse fish species to flourish in the water column. To ensure the durability of photovoltaic panels, the outer layer is sealed with toughened glass. To prevent moisture from seeping in, it is important to properly treat the location of the junction box and wiring. With proper treatment, the panels can be directly cleaned with water, making it easier and more cost-effective to maintain them. In the future, there will be research carried out on self-cleaning photovoltaic systems.
Research has indicated that the implementation of aquatic photovoltaic systems yields a substantial carbon reduction effect, resulting in the reduction of emissions by an impressive 3.3 million tons annually [18]. It can reduce the eutrophication of water bodies and reduce the concentration of chlorophyll and nitrate in water bodies [17,40]. However, the method mentioned above does not entirely cover vast water surfaces, and some research is relatively uniform with a limited observation duration. As the deployment of solar photovoltaic panels is regional and spatial, diverse areas may have varying inclinations and outcomes based on different arrangements and densities, which have not been adequately explored. To investigate the influence of water-based photovoltaic installations on water quality under distinct conditions, further research can examine the placement and spacing of photovoltaic arrays in sizeable water bodies.
This study examines the anti-evaporation effect of PPV. The findings indicate that these devices can effectively lower water temperature and reduce evaporation. However, the study only used model tests, and further research is needed to test the impact of pile photovoltaics installed at different heights and changes in water quality. Future research can explore these areas to broaden our understanding of this technology.
5. Conclusions
This paper focuses on investigating the anti-evaporation effect of PPV on the water body. Specifically, the study analyzes the impact on the water temperature and PV module temperature. The Dalton model is used to calculate the saturation water vapor pressure difference of the water body. Finally, the research derives the evaporation inhibition rate of the water body by waterborne photovoltaics. The test results are presented below:
Based on the test conducted, it was observed that the water temperature in evaporator A was significantly lower than that of evaporator B and the atmospheric temperature. During summer, the maximum evaporation inhibition rate reached 40.16%, while the lowest rate was 12.14% during winter. On average, the evaporation inhibition rate for the entire year was 29.3%. Furthermore, the economic benefits of preventing water evaporation using water pile-based PV were analyzed. If the water body’s evaporation is used for agricultural irrigation, it can cover an area of 38 hm2. On the other hand, if it is used for drinking water, it can generate a revenue of 30,000 CNY.
These test results indicate that the PV module blocks most of the solar radiation and that water pile-based PV can effectively reduce the water body’s temperature, ultimately reducing the rate of evaporation. During summer, PPV had the highest evaporation inhibition rate, which was slightly lower during winter. Overall, the use of PPV in arid and semi-arid areas can help conserve water and produce good economic benefits.
Author Contributions
J.H.: Writing—original and final drafts, manipulating experiments, processing data, and analyses; K.S.: Supervising experiments, writing and revising papers; X.S.: Providing test equipment and software to guide data processing; G.H.: Data computation analysis, data collection; Y.Y.: Conducting a research and investigation process, specifically performing the experiments, data/evidence collection. All authors have read and agreed to the published version of the manuscript.
Funding
This research received no external funding.
Data Availability Statement
The data in the sub-paper were measured in personal experiments and are non-public.
Conflicts of Interest
The authors declare no conflict of interest.
References
- Semenov, S.M. Greenhouse Effect and Modern Climate. Russ. Meteorol. Hydrol. 2022, 47, 725–734. [Google Scholar] [CrossRef]
- He, Y.; Gao, X.; Wang, Y. Sustainable Financial Development: Does It Matter for Greenhouse Gas Emissions? Sustainability 2022, 14, 5064. [Google Scholar] [CrossRef]
- Zamarioli, L.H.; Pauw, P.; König, M.; Chenet, H. The climate consistency goal and the transformation of global finance. Nat. Clim. Chang. 2021, 11, 578–583. [Google Scholar] [CrossRef]
- UN Environment Programme. Renewables 2021 Global Status Report [EB/OL]. Available online: https://go.exlibris.link/MtSvJ6Zz (accessed on 1 January 2021).
- Liu, H.; Krishna, V.; Lun Leung, J.; Reindl, T.; Zhao, L. Field experience and performance analysis of floating PV technologies in the tropics. Prog. Photovolt. Res. Appl. 2018, 26, 957–967. [Google Scholar] [CrossRef]
- Liu, L.; Sun, Q.; Li, H.; Yin, H.; Ren, X.; Wennersten, R. Evaluating the benefits of Integrating Floating Photovoltaic and Pumped Storage Power System. Energy Convers. Manag. 2019, 194, 173–185. [Google Scholar] [CrossRef]
- Wu, B.; Quan, Q.; Yang, S.; Dong, Y. A social-ecological coupling model for evaluating the human-water relationship in basins within the Budyko framework. J. Hydrol. 2023, 619, 129361. [Google Scholar] [CrossRef]
- Qiu, D.; Zhu, G.; Bhat, M.A.; Wang, L.; Liu, Y.; Sang, L.; Lin, X.; Zhang, W.; Sun, N. Water use strategy of Nitraria tangutorum shrubs in ecological water delivery area of the lower inland river: Based on stable isotope data. J. Hydrol. 2023, 624, 129918. [Google Scholar] [CrossRef]
- Qiu, D.; Zhu, G.; Lin, X.; Jiao, Y.; Lu, S.; Liu, J.; Liu, J.; Zhang, W.; Ye, L.; Li, R.; et al. Dissipation and movement of soil water in artificial forest in arid oasis areas: Cognition based on stable isotopes. Catena 2023, 228, 107178. [Google Scholar] [CrossRef]
- Yin, L.; Wang, L.; Li, T.; Lu, S.; Yin, Z.; Liu, X.; Li, X.; Zheng, W. U-Net-STN: A Novel End-to-End Lake Boundary Prediction Model. Land 2023, 12, 1602. [Google Scholar] [CrossRef]
- Al Hassoun, S.A.; Al Shaikh, A.A.; Al Rehaili, A.M.; Misbahuddin, M. Effectiveness of using palm fronds in reducing water evaporation. Can. J. Civ. Eng. 2011, 38, 1170–1174. [Google Scholar] [CrossRef]
- Jiang, H.; Tang, K.; He, X. Experimental Studies on Reduction of Evaporation from Plain Reservoirs in Drought Areas by Benzene Board Covering Technology. J. Coast. Res. 2015, 73, 177–182. [Google Scholar] [CrossRef]
- Ali Abaker Omer, A.; Liu, W.; Li, M.; Zheng, J.; Zhang, F.; Zhang, X.; Osman Hamid Mohammed, S.; Fan, L.; Liu, Z.; Chen, F.; et al. Water evaporation reduction by the agrivoltaic systems development. Sol. Energy 2022, 247, 13–23. [Google Scholar] [CrossRef]
- Bontempo Scavo, F.; Tina, G.M.; Gagliano, A.; Nižetić, S. An assessment study of evaporation rate models on a water basin with floating photovoltaic plants. Int. J. Energy Res. 2021, 45, 167–188. [Google Scholar] [CrossRef]
- Gonzalez Sanchez, R.; Kougias, I.; Moner-Girona, M.; Fahl, F.; Jäger-Waldau, A. Assessment of floating solar photovoltaics potential in existing hydropower reservoirs in Africa. Renew. Energy 2021, 169, 687–699. [Google Scholar] [CrossRef]
- Elshafei, M.; Ibrahim, A.; Helmy, A.; Abdallah, M.; Eldeib, A.; Badawy, M.; AbdelRazek, S. Study of Massive Floating Solar Panels over Lake Nasser. J. Energy 2021, 2021, 6674091. [Google Scholar] [CrossRef]
- Abdelal, Q. Floating PV: An assessment of water quality and evaporation reduction in semi-arid regions. Int. J. Low-Carbon Technol. 2021, 16, 732–739. [Google Scholar] [CrossRef]
- Ravichandran, N.; Ravichandran, N.; Panneerselvam, B. Floating photovoltaic system for Indian artificial reservoirs—An effective approach to reduce evaporation and carbon emission. Int. J. Environ. Sci. Technol. 2022, 19, 7951–7968. [Google Scholar] [CrossRef]
- Zhang, J.; Zhong, A.; Huang, G.; Yang, M.; Li, D.; Teng, M.; Han, D. Enhanced efficiency with CDCA co-adsorption for dye-sensitized solar cells based on metallosalophen complexes. Sol. Energy 2020, 209, 316–324. [Google Scholar] [CrossRef]
- Feng, G.; Li, W.; Han, Y.; Zhang, Y.; Zhang, D. Solar Energy Resources and Zoning in Xinjiang. Renew. Energy 2010, 28, 133–139. [Google Scholar]
- Wei, G.; Jiapaer, G.; Hanmin, Y.; Liangliang, J.; Xiaofang, Z. Spatial and temporal distribution characteristic and division research of solar energy resources in southern Xinjiang. Arid. Zone Geogr. 2021, 44, 1665–1675. [Google Scholar]
- Wang, Z.; Fan, Y.; Wang, J.; Li, Q.; Cai, L.; Xue, J. Influence of tilt and azimuth on the characteristics of photovoltaic power generation in Zhangbei area. Acta Energiae Solaris Sin. 2022, 43, 73–79. [Google Scholar]
- Liu, X.; Yu, J.; Wang, P.; Zhang, Y.; Du, C. Lake Evaporation in a Hyper-Arid Environment, Northwest of China—Measurement and Estimation. Water 2016, 8, 527. [Google Scholar] [CrossRef]
- Abtew, W.; Obeysekera, J.; Iricanin, N. Pan evaporation and potential evapotranspiration trends in South Florida. Hydrol. Process. 2011, 25, 958–969. [Google Scholar] [CrossRef]
- Hojjati, E.; Ghorban, M.F.T.; Ozgur, K. Estimating evaporation from reservoirs using energy budget and empirical methods: Alavian dam reservoir, NW Iran. Ital. J. Agrometeorol./Riv. Ital. Agrometeorol. 2020, 34, 33. [Google Scholar]
- Wei, X.; Zhao, R.; Huang, D.; Zhao, Z. Water evaporation rate correlation based on Dalton model of enclosed space in frost-free refrigerator. Case Stud. Therm. Eng. 2021, 28, 101495. [Google Scholar] [CrossRef]
- Li, Z.; Chen, Y.; Shen, Y.; Liu, Y.; Zhang, S. Analysis of changing pan evaporation in the arid region of Northwest China. Water Resour. Res. 2013, 49, 2205–2212. [Google Scholar] [CrossRef]
- Shen, Y.; Liu, C.; Liu, M.; Zeng, Y.; Tian, C. Change in pan evaporation over the past 50 years in the arid region of China. Hydrol. Process. 2009, 24, 225–231. [Google Scholar] [CrossRef]
- Chen, D.; Gao, G.; Xu, C.; Guo, J.; Ren, G. Comparison of the Thornthwaite method and pan data with the standard Penman-Monteith estimates of reference evapotranspiration in China. Clim. Res. 2005, 28, 123–132. [Google Scholar] [CrossRef]
- Xing-Peng, S. Research on Anti-Evaporation and Water-Saving Efficiency of Floating Photovoltaic Power Generation Unit in Arid Area. Water Conserv. Sci. Technol. Econ. 2022, 28, 55–59. [Google Scholar]
- Han, K.; Shi, K.; Yan, X.; Lv, J.; Cheng, Y. Analysis of water saving efficiency of anti-evaporation in plain reservoirs in arid areas covered by PE floats. J. Basic Sci. Eng. 2020, 28, 376–385. [Google Scholar]
- Guo, J.; Chen, Z.; Xiao, F.; Wang, Y.; Yuan, L. Numerical analysis of wave loads on floating square array of photovoltaic power plant. Acta Energiae Solaris Sin. 2021, 42, 1–6. [Google Scholar]
- Yuan, W.; Lu, H.; Pan, T.; Ji, C.; Peng, X. Structural dynamics of floating photovoltaic power plants under the coupling effect of wind and waves. Eng. J. Wuhan Univ. 2021, 54, 7–13. [Google Scholar]
- Santos, F.R.D.; Wiecheteck, G.K.; Virgens Filho, J.S.D.; Carranza, G.A.; Chambers, T.L.; Fekih, A. Effects of a Floating Photovoltaic System on the Water Evaporation Rate in the Passaúna Reservoir, Brazil. Energies 2022, 15, 6274. [Google Scholar] [CrossRef]
- Majumder, A.; Innamorati, R.; Frattolillo, A.; Kumar, A.; Gatto, G. Performance Analysis of a Floating Photovoltaic System and Estimation of the Evaporation Losses Reduction. Energies 2021, 14, 8336. [Google Scholar] [CrossRef]
- Kewu, H.; Kebin, S.; Xinjun, Y.; Jianxun, L.; Yunpeng, Y. Study on evaporation inhibition rate of static water surface in plains reservoirs in arid areas under PE float coverage. J. Water Resour. Water Eng. 2017, 28, 235–239. [Google Scholar]
- Château, P.; Wunderlich, R.F.; Wang, T.; Lai, H.; Chen, C.; Chang, F. Mathematical modeling suggests high potential for the deployment of floating photovoltaic on fish ponds. Sci. Total Environ. 2019, 687, 654–666. [Google Scholar] [CrossRef]
- Zhang, J.; Liu, X.; Gu, Z.; Cheng, G.; Zhu, H. Ecological economic characteristics of fishery and light complementary and its development direction. J. Fish. China 2022, 46, 1525–1535. [Google Scholar]
- Vo, T.T.E.; Je, S.; Jung, S.; Choi, J.; Huh, J.; Ko, H. Review of Photovoltaic Power and Aquaculture in Desert. Energies 2022, 15, 3288. [Google Scholar] [CrossRef]
- Wang, Y.; Yu, H.; Yu, J. Factual analysis of observation of local ecological effects of PV on water surface. Acta Energiae Solaris Sin. 2022, 43, 38–44. [Google Scholar]
Figure 1.
Comparison of the total annual average horizontal solar radiation between Turpan and Beijing.
Figure 1.
Comparison of the total annual average horizontal solar radiation between Turpan and Beijing.

Figure 2.
Daily variation curves of solar radiation in Turpan and Beijing.

Figure 3.
Pile photovoltaics on the water under the sun.

Figure 4.
Water-based piled PV test diagram.

Figure 5.
Daily variation of evaporators A, B, and atmospheric temperature.

Figure 6.
Schematic diagram of temperature change of each component.

Figure 7.
A, B evaporator daily saturation water vapor pressure difference.

Figure 8.
Schematic diagram of evaporation and average annual solar radiation in evaporation panes.

Figure 9.
Evaporation and evaporation suppression rate under PV panel shading.

Figure 10.
System Diagram for PPV.

Figure 11.
Water savings per square meter for large water bodies.

Figure 12.
Schematic diagram of monthly evaporation from large water bodies.


Table 1.
Reservoir parameters and installation PV parameters.
| Total Storage Volume | Total Reservoir Area | Photovoltaic Coverage Area | Photovoltaic Uncovered Areas | Average Annual Evaporation Suppression Rate | Evaporation Pan Conversion Factor |
|---|---|---|---|---|---|
| 1186.6 million m3 | 31.6 hm2 | 27.18 hm2 | 4.46 hm2 | 29% | 0.62 |
Disclaimer/Publisher’s Note: The statements, opinions and data contained in all publications are solely those of the individual author(s) and contributor(s) and not of MDPI and/or the editor(s). MDPI and/or the editor(s) disclaim responsibility for any injury to people or property resulting from any ideas, methods, instructions or products referred to in the content. |
© 2023 by the authors. Licensee MDPI, Basel, Switzerland. This article is an open access article distributed under the terms and conditions of the Creative Commons Attribution (CC BY) license (https://creativecommons.org/licenses/by/4.0/).
Share and Cite
MDPI and ACS Style
Huang, J.; Shi, K.; Shi, X.; Hao, G.; Yang, Y. Arid AREAS Water-Piled Photovoltaic Prevents Evaporation Effects Research. Water 2023, 15, 3716. https://doi.org/10.3390/w15213716
AMA Style
Huang J, Shi K, Shi X, Hao G, Yang Y. Arid AREAS Water-Piled Photovoltaic Prevents Evaporation Effects Research. Water. 2023; 15(21):3716. https://doi.org/10.3390/w15213716
Chicago/Turabian StyleHuang, Jiamin, Kebin Shi, Xingpeng Shi, Guocheng Hao, and Yimin Yang. 2023. "Arid AREAS Water-Piled Photovoltaic Prevents Evaporation Effects Research" Water 15, no. 21: 3716. https://doi.org/10.3390/w15213716
Note that from the first issue of 2016, this journal uses article numbers instead of page numbers. See further details here.