
Developing the New Thermal Climate Zones of China for Building Energy Efficiency Using the Cluster Approach


1
College of Architecture and Civil Engineering, Xi’an University of Science and Technology, Xi’an 710054, China
2
State Key Laboratory of Green Building in Western China, Xian University of Architecture & Technology, Xi’an 710055, China
3
College of Architecture, Xi’an University of Architecture and Technology, Xi’an 710055, China
*
Author to whom correspondence should be addressed.
Atmosphere 2022, 13(9), 1498; https://doi.org/10.3390/atmos13091498
Submission received: 5 August 2022
/
Revised: 26 August 2022
/
Accepted: 12 September 2022
/
Published: 14 September 2022
(This article belongs to the Special Issue Building Energy Codes and Greenhouse Gas Mitigation)
Abstract
:Climate is a key element in building design. The determination of adequate climate zoning is crucial for achieving building energy efficiency and reduced carbon emissions. In this study, a cluster analysis method was applied to develop new thermal climate zones for building envelope thermal design in China. In total, three different cluster analysis methods, including k-means, average-linkage, and Ward’s clustering, were considered. The analysis indicated that the average-linkage clustering was more appropriate for this study, and the elbow method could not accurately determine the best number of categories of average-linkage clustering. Further analysis showed that the unsupervised cluster processes may generate an unavoidable redundancy category and, to obtain precise results, supervision may be necessary in some contexts. Finally, China was classified into 10 climate zones. The North China plain and Qinghai–Tibet plateau are classified into two independent climate zones, and Turpan and Bayanbulak were classified into two newly defined climate zones different from their surrounding area in the new definition. Quantitative analysis indicated that the new zones were more precise when compared to the current ones, which can provide more precise climate information and contribute to formulating more precise standards and policies related to the thermal design of building envelopes in the future.
1. Introduction
Upgrading living standards and developing the economy in China have resulted in greater building energy consumption and increased greenhouse gas emissions. Statistics presented by Huo et al. [1] showed that the energy consumption in the building sector rose from 301 to 814 million tons of standard coal equivalent, implying a 1.7× increase from 2000 to 2014. Unfortunately, this trend would continue if there were no stricter measures to control building energy use [2]. To help reverse the trend and reduce greenhouse gas emissions, a large number of building energy policies and mandatory building standards were implemented in recent decades. This is to ensure the building energy efficiency at the design stage. A building climate classification, named thermal climate zones, was formulated and published to help in implementing these policies and standards in China [3,4].
It is now clear that building energy consumption is affected by many factors, among which climate is one of the most important. Climate classification is a way of categorizing the country or region’s climate features according to a single or several climate parameters. Indeed, the concept can be traced back to the 4th century B.C. [5]. Numerous studies have shown that design with climate is amongst the first steps to achieving building energy efficiency [6,7,8].
Since the middle of the 20th century, climate classification has been applied in the area of architecture [9]. Nowadays, most countries or regions around the world have published or conducted studies on their building climate classification maps. For instance, according to the temperature, solar radiation, humidity, and cloudiness, Chile was di-vided into nine climate zones. The different requirements for building construction energy efficiency design were defined based on these climate zones [10]. Ali et al. defined five climate zones for India, which were adopted in the National Building Code of India and used for specifying energy efficiency requirements for building envelopes [11]. Ra-koto-Joseph et al. developed three passive design zones in Madagascar and analyzed the potential of passive solar design in each climate zone [12]. The U.S. Department of Energy defined five climate zones based on the Köppen’s climate classification system for energy-efficient residential building design [13]. Building climate classification provides a general guideline for architects and engineers to select appropriate strategies, construction methods, and materials for building energy efficiency design. Today, it is regarded as a rational way to understand the regional climate characteristics and a fundamental step towards building energy efficiency [14,15,16].
As climate classification plays an important role in formulating energy-saving policies for buildings and implementing the building standards, defining adequate climate zones is crucial for achieving building energy efficiency. Numerous studies have used a variety of climate data and parameters to define climate zones for buildings, agriculture, or other sectors. Several methods have been applied, such as the Köppen classification method [17], thermal climate zones of China [4], and ASHRAE climate classification for building energy codes and standards [18]. However, these methods are all accomplished following a common approach whereby the meteorological stations (or cities) in the country or region are classified into predetermined categories, such as hot-dry, warm-humid, temperate, and cold. The classifications are based on the values of the climate parameters characterizing these stations (or cities), and these predetermined categories were set by experts’ experience. The advantage of this approach is that it can directly and quantitatively specify the climate types, whereas the disadvantage is that the classification rules are subjectively formulated. To overcome this shortcoming, a cluster analysis method has been applied on climate classification in recent studies.
Clustering is an unsupervised learning technique classifying a set of observations into clusters. The observations categorized into one cluster should be as similar as possible. Likewise, the observations in one cluster should be as dissimilar as possible from observations in other clusters. Cluster analysis applied in climate classification has an inherent merit in that its basic objective is to identify the geographical districts possessing a similar climate feature. Kozjek et al. divided Slovenia into six climate regions based on cluster analysis methods and found that the new classification increased the degree of objectivity of the zone extents and border compared with previous studies [19]. Erell et al. defined a new climate map for building design in Israel by cluster analysis methods and showed that the new map could provide more precise and detailed information than the existing zoning [20]. Although these studies have shown that cluster analysis can explore more climate information and define more precise climate zones than the traditional approach, the application of cluster analysis in climate classification is not straightforward. Based on the difference-of-inclusion principle and difference-of-distance metric, clustering can be divided into different methods, such as the single linkage, average linkage, Ward’s and partitioning techniques methods [21,22]. Each cluster technique has its own advantages and disadvantages, and different outcomes can be obtained according to different techniques. Mahlstein et al. indicated that k-means clustering, belonging to partitioning techniques, is simple and inexpensive and can be obtained through a local optimum result [23]. Unal et al. found that Ward’s clustering is the most likely to obtain acceptable results in defining the climate zones of Turkey [24], whereas Kalkstein et al. showed that using average linkage clustering can produce more realistic and accurate results compared with Ward’s and centroid clustering [25]. It seems that a feasible cluster analysis method should firstly be decided when defining climate classification.
Although clustering has many merits, current climate zones for building energy efficiency in most countries, including China, are still mainly defined by the experience approach. In China, the thermal climate zones, which guide the building envelope thermal design, provide a framework for implementing current building energy efficiency standards. With the development of building energy efficiency design and climate change, researchers have recently pointed out that it cannot provide adequate climate information for energy-efficient design and it cannot present current climate characteristics of China comprehensively [26,27,28]. Recently, a lot of studies have tried to improve the current thermal climate zones by different aspects. Xiong et al. subdivided one of the primary zones in the thermal climate zones of China, i.e., the hot summer and cold winter zones, by hierarchical agglomerative clustering analysis, and the new definition of seven subzones improved the spatial resolution of heating and cooling loads [29]. Yang et al. quantitatively analyzed the difference between the current thermal climate zones and results developed by ANSI/ASHRAE standard 169 and suggested a new climate classification for building energy efficiency based on the cluster analysis and ANSI/ASHRAE standard 169 [16]. Wang et al. suggested a new performance-based classification matrix and redefined the cold climate zone of China [30]. Hao et al. identified the thermal climate zones of 40 marine islands by clustering analysis [31]. However, the way to improve the thermal climate zones remains unclear.
Therefore, the objective of this study is to develop thermal climate zones using a cluster analysis approach, revise and update the current zoning criteria to reveal the realistic climate characteristics, and explore more detailed climate information for building envelope thermal design. To achieve this, the three most frequently used cluster analysis methods, i.e., average-linkage, k-means, and Ward’s clustering, were selected to analyze their applicability in defining thermal climate zones.
The remainder of this paper is organized into five sections. The objective of this study is identified in Section 1. Section 2 presents general information about existing thermal climate zones. The meteorological data and mathematical method adopted in this research are described in Section 3. Section 4 reveals the main findings and presents the redefined thermal climate zones. Section 5 summarizes the study and provides conclusions.
2. Thermal Climate Zones
China is located in East Asia and its territory generally covers about 50 degrees of latitude and 62 degrees of longitude [32]. There is a great diversity of terrain and tremendous differences in latitude, longitude, and climate in China. The difference in air temperature between the North and South of China can reach up to 50 °C at any one time [33]. To specify the guidance for building envelope thermal design, the Ministry of Construction formulated and published thermal climate zones in 1993 [34]. At first, thermal cli-mate zones only contained five primary climate zones: severe cold zone (SCZ); cold zone (CZ); hot summer and cold winter zone (HSCWZ); hot summer and warm winter zone (HSWWZ); and mild zone (MZ). In 2016, with the update of the Thermal Design Code for Civil Building, thermal climate zones were updated according to the new climate data [4]. Eleven sub-zones were defined in the updated thermal climate zones, based on heating degree days base 18 °C—HDD 18 °C and cooling degree days base 26 °C—CDD 26 °C. Although the sub-zones were defined, the related building energy efficiency policies and standards were formulated and implemented according to the primary zone definition. Figure 1 shows the general geographical layout of the primary zones in thermal climate zones, and Table 1 presents the zoning criteria for the primary zones. It should be noted that those five climate zones were only defined by the main criteria, despite the zoning criteria including both the main and complementary criteria.
3. Method
3.1. Overview of Methodology
This study was aimed at finding an appropriate cluster analysis method and developing the thermal climate zones of China. To achieve this, the applicability of three different cluster analysis methods, including average-linkage, k-means, and Ward’s clustering, was first assessed by the root mean square deviation (RMSD). Then, the cluster result obtained by average-linkage clustering method was used to develop the new thermal climate zones. The differences between the new and current thermal climate zones were compared and discussed. Finally, a map of the new thermal climate zones was presented and their impact on current building energy efficiency design was considered.
3.2. Clustering Analysis Method
The partitioning technique minimizes a given clustering criterion by iteratively re-locating observations among categories until an optimal partition is reached, and k-means clustering is one of the most popular partition-based methods [21]. A hierarchical technique constructs the clusters by recursively partitioning the observations in either an agglomerative (bottom-up) or divisive (top-down) pattern. The hierarchical technique can be further divided into different methods, such as average-linkage and Ward’s clustering, according to the difference of their similarity measures or linkages. In average-linkage clustering, the distance among two categories is determined by the average distance from any observation of one category to any member of the other category. Ward’s clustering joins categories that minimize the within-cluster sum of squared distances [22]. At present, the aforementioned clustering methods are commonly applied in climate classification research. In this study, three selected clustering methods, including one partitioning technique, k-means clustering (KCM), and two hierarchical techniques, average-linkage (ACM) and Ward’s clustering (WCM), were applied to decide which was the optimum approach in developing the thermal climate zones.
3.2.1. Defining Distance
The object of clustering is to detect those observations which are similar and group them together into one category. To achieve this, the tool used to measure the distance or similarity between two objects must be defined. Considering climate variables, Euclidean distance was applied in this study as a distance tool. Considering a data matrix , in p-dimensional space, the Euclidean distance between two objects and can be written as follows:
where is the Euclidean distance between two objects and , and is the dimension number.
Before calculating the Euclidean distance, all of the climate variables used in this study were standardized to eliminate the scale effect.
3.2.2. Determining the Number of Categories
The optimal number of categories was decided by the elbow method. This method firstly plots the sum of squared error (SSE) as a function of the number of categories in a coordinate system and then picks the elbow of the curve as the optimal number of categories. The SSE can be calculated according to the following equation [35]:
where is the number of categories, is the set of observations in category , and is the vector mean of and it can be obtained by the following equation:
where is the number of instances belonging to .
3.2.3. Clustering Quality Metrics
As mentioned above, clustering aims to classify a set of observations into categories. The observations found in the same category should be as similar as possible. Otherwise, the observation in one category should be as dissimilar as possible from observations in other categories. For climate classification, similar means the value of climate variables of two different locations is close. In other words, similar means the value of a climate variable in two different locations has less deviation. Based on that, the root mean square deviation (RMSD) was introduced in this study to assess the quality of each clustering method. RMSD can be calculated by the following equation:
where is the number of observations, is the value of observation, and is the average value of t-dimensional space.
3.3. Meteorological Data Sources
The meteorological data adopted in this study was publish by China’s National Climate Center (CNCC) [36]. These data are daily observations calculated by using the arithmetic mean method with four recorded values daily. The data cover 603 weather stations in China, collected from 1981 to 2013. In this study, the zoning criteria of each city was calculated by the corresponding daily dry bulb temperature from this data set.
4. Results and Discussion
4.1. Determining the Optimum Cluster Method
Thermal climate zones are defined mainly according to and , which are selected as input clustering variables. In total, three commonly used clustering methods were considered in this research. The elbow method was applied to decide the best number of categories, and the analysis results are shown in Figure 2. The best number of categories for the k-means and Ward’s clustering methods was nine for both. However, average-linkage clustering statistically accrued “elbow” twice, corresponding to nine and 13 categories, respectively. To more comprehensively assess the quality of each cluster analysis method, both nine and 13 were considered as the best number of categories for average-linkage clustering in the following analysis.
The average value of RMSD of each category and climate variable in each method are shown by bar chart in Figure 3. The smaller value of RMSD means a lesser deviation in category, which means a better cluster result. According to Figure 3a, the average-linkage clustering suggests the best cluster result compared with other methods. In the average-linkage clustering results, the RMSD of and decreases by 0.5 and 0.2, respectively, from nine to 13 categories. This means that 13 categories is better. In Figure 3b, the average-linkage clustering with 13 categories generally shows the minimum RMSD in all cluster results. The RMSD of k-means clustering reached 10.4, which was dramatically higher than others in the seventh category. This indicates that k-means clustering does not thoroughly recognize the differences among these climate variables. Therefore, the average-linkage clustering is more appropriate for defining thermal climate zones according to the analysis results.
4.2. The Cluster Result Obtained by Average-Linkage Clustering Method
Determining the best number of categories is a critical step in clustering. As presented previously, “elbow” occurred twice in the average-linkage clustering results, corresponding to nine and 13 categories, respectively. To develop an accurate and reliable result, the difference between nine and 13 categories must be revealed.
Figure 4a–e presents the cluster process of average-linkage clustering from nine to 13 categories. Figure 4f reveals the decreasing trend of the SSE in each cluster step. At first, the SSE decreases by 48 when the category increases from eight to nine, and then, the SSE decreases by 11.6, five, and six when the category increases to 10, 11, and 12, respectively. Finally, the SSE decreases by 32.9 when the category increases from 12 to 13. The rapid reduction of SSE signifies that this clustering step effectively reduces the disordered state of the original data, and it is credible and accurate. According to Figure 4a–e, the new category is generally divided from the group with fewer observations or originally close spatial distance, whereas the 13th category is divided from one large group with extensive spatial extent at first. This is why the value of SSE shows a rapid reduction when the category increases from 12 to 13. The 13th category is indispensable, whereas other categories, including 10th, 11th, and 12th, do not need to be considered. This phenomenon also suggests that unsupervised clustering processes may inevitably generate redundant categories. Supervision may be necessary under some contexts to obtain accurate results. Therefore, the cluster result based on the average-linkage clustering is revised. The 13th category was divided manually on the basis of the nine categories’ result, and the final result is shown in Figure 5. In the new result, the raw climate data are classified into 10 categories.
4.3. Comparison with the Current Thermal Climate Zones
The cluster result based on average-linkage clustering is compared with the current thermal climate zones in Figure 6. The main differences are concentrated on the North-Eastern China plain, North China plain, and Qinghai–Tibet plateau, labelled in Figure 6b. In the cluster result, the region of the North China plain and Qinghai–Tibet plateau are classified into the independent climate zone. In the current thermal climate zones, parts of Qinghai–Tibet plateau and North-Eastern China plain are classified into the same zone, and other parts of the Qinghai–Tibet plateau are classified into the same zone as the North China plain. However, the climate characteristics and building design requirements of the Qinghai–Tibet plateau are very different in practice and from the previous research [37]. The clustering results seem more rational and accurate than the current ones. Another notable difference is that, in the clustering results, Turpan and Bayanbulak are classified into two independent climate zones, which are different from the cities they are immediately adjacent to.
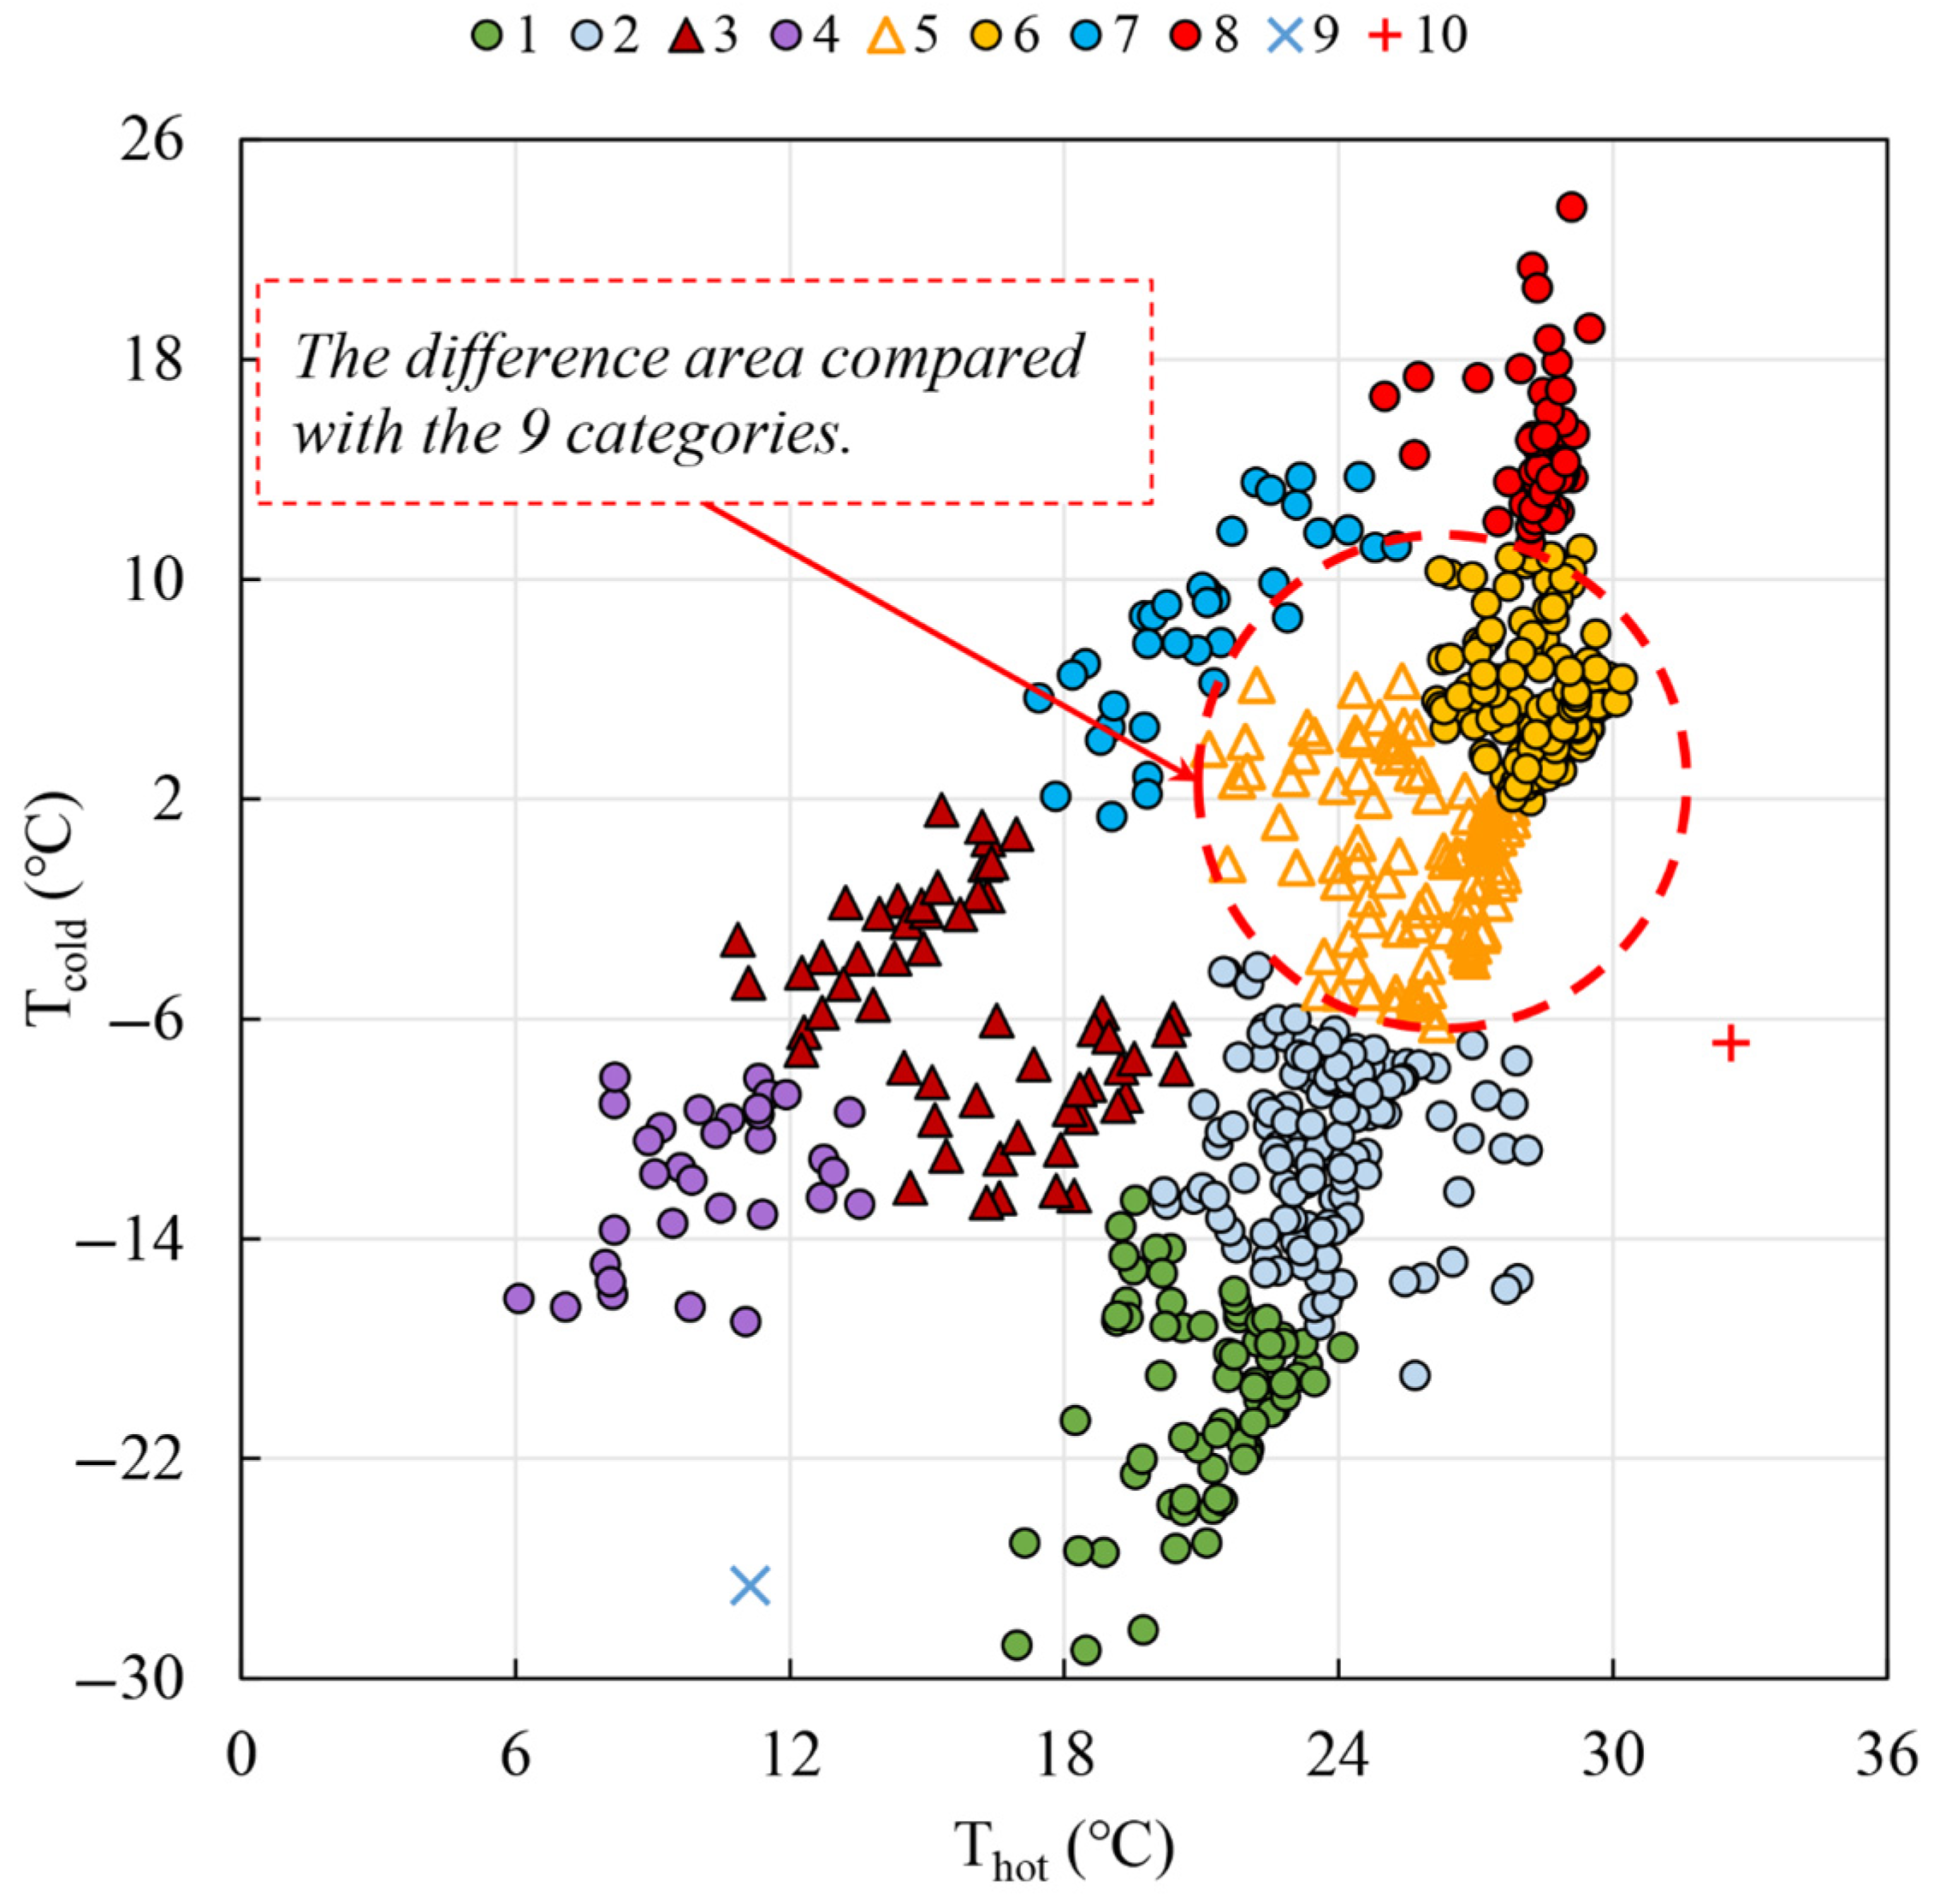
As shown in Figure 7, the values of and of 603 cities were plotted on a same rectangular plane coordinate system, to compare further differences between the clustering result and current thermal climate zones. is plotted on the x-axis and is plotted on the y-axis. The main difference is whether the SCZ and CZ in the current thermal climate zones should be reclassified. The 3rd and 4th categories are classified from the 2nd and 1st categories in the clustering results, respectively. Although the value scopes of of the 3rd and 4th categories is close to the 2nd and 1st categories, respectively, their value scopes of show a significant difference. For example, the value scope of of the 4th category is mainly below 14 °C, whereas the value scope of of the 1st category is mainly over 18 °C. This means that the city belonging to the 1st category has a relatively hotter summer than the one belonging to the 4th category.
The RMSD was also applied to quantitatively assess the difference between the clustering results and current thermal climate zones. As shown in Figure 8, the RMSD values of and in the clustering result decreases by 1.0 and 1.7, respectively, compared with the result of the current thermal climate zones. The cluster result is more rational and accurate compared with the current thermal climate zones. The clustering analysis method can explore more climate information than the traditional method.
4.4. Feature of New Thermal Climate Zones and Its Impact on Building Energy Efficiency Design
According to the clustering analysis result, the new thermal climate zones consist of 10 zones. To comprehensively explain the new climate characteristic of each zone, the daily air temperature bands in a year of each climate zone are calculated, as shown in Figure 9.
Climatic characteristics vary significantly between climate zones. The common feature of zones 1, 3, and 4 is that cooling is unnecessary as the highest air temperature during summer in these zones does not reach 25 °C. Therefore, heat mitigation in building design need not to be considered in these zones. The differences between three zones are concentrated in winter. During winter, the air temperature of zone 1 which can reach −30.9 °C is considerably lower than zones 3 and 4, and the air temperature of zone 4 is generally lower than zone 3. This indicates that the requirements of building insulation should be strict in these zones. During most months of the year, the air temperature of zones 3 and 4 does not reach 5 °C, which is the critical temperature for heating in China [38]. This means the required heating period in zones 3 and 4 is obviously longer than zone 1, though their air temperature during winter is relatively higher than zone 1.
In zone 2, the maximum air temperature during summer can reach 29.4 °C. The strict requirements of building insulation are necessary, and heat mitigation should be considered in building design in parts of these regions to prevent overheating. The comparative analysis of zones 5, 6, and 8 revealed that the climate is gradually warming from zones 5 to 8. The climatic feature of zone 5 is similar to zone 2, and its building insulation requirements and heat mitigation should both be considered in building design. The difference between these two zones is that the air temperature during winter in zone 2 is mainly around 0 °C, which is relatively warmer than zone 2. All air temperatures during winter in zone 6 are above 0 °C, whereas its air temperature during summer can reach 31 °C. Therefore, the heat mitigation strategies for buildings, such as shading, evaporative cooling, and nocturnal ventilation, should be considered in this zone. In zone 8, the air temperature is over 20 °C during most months of the year, and the minimum air temperature during winter can be over 10 °C. The heat mitigation strategies for buildings are necessary in this zone and heating can be ignored.
The climatic feature of zone 7 shows a significant difference compared with the other zones. The annual temperature range is narrow in zone 7. Its maximum air temperature does not reach 26 °C and its minimum air temperature is over 0 °C. In this zone, the air temperature is pleasant during most of the year, and heating is needed in just a small part of the year. According to Figure 5 and Figure 6b, zones 9 and 10 only contain one city each, named Bayanbulak and Turpan, respectively. Compared with zone 1, the climate of Bayanbulak is generally colder. Its minimum air temperature can reach −28.7 °C during winter, whereas the maximum air temperature in summer is not more than 11.7 °C. The strict requirements of building insulation are the only issue to be considered. Compared with zone 2, the air temperature during summer is higher in Turpan, reaching up to 33.2 °C, and heat mitigation should be given more attention in this region.
5. Conclusions
Climate is one of the key factors in building energy consumption and building energy efficiency design. Nowadays, climate classification has become a rational way of understanding regional climate characteristics and assisting in the implementation of building energy efficiency standards and polices. Defining appropriate climate zones is a basic step to achieving high building energy efficiency. The cluster analysis method was used as an objective approach to develop the thermal climate zones focused on in this study. In total, three cluster analysis methods, i.e., k-means, average-linkage, and Ward’s clustering, were considered to determine the optimum method to develop the new thermal climate zones. The analysis results, based on the RMSD, indicated that the average-linkage clustering method is more appropriate for developing the thermal climate zones of China. However, the elbow method cannot accurately determine the best number of categories in the average-linkage cluster result. Further analysis indicated that an unsupervised cluster process may inescapably generate redundant categories. Ten categories were identified as the best cluster number, which implies that the newly thermal climate zones comprise 10 zones.
Compared with the current thermal climate zones, the main differences were concentrated on the North-Eastern China plain, North China plain, and Qinghai–Tibet plateau. The North China plain and Qinghai–Tibet plateau were classified into two independent climate zones in the new definition. The requirements of building insulation were strictest in the North China plain, while the required heating period in Qinghai–Tibet plateau was longer than other regions of China. Turpan and Bayanbulak were classified into two independent climate zones, which are different from the cities they are immediately adjacent to, and each of these two climate zones contains only one city. In Bayanbulak, the strict requirements of building insulation were the only issue to be considered. However, in Turpan, heat mitigation during the summer should be given more attention compared with the cities around it. The RMSD analysis results indicated that the new thermal climate zones, developed by the cluster analysis method, were more rational and accurate compared with the current ones. More information of climate differences has been revealed by the newly defined thermal climate zones, which can contribute to formulate more precise standards and policies to achieve greater building energy efficiency in future.
The climate of China is diverse owing to the diversity of terrain and the tremendous differences in latitude and longitude. The climate data used in this study only included 603 cities, which cannot cover all of the climate types of China. More climate data should be considered in further research, and this study can provide a theoretical basis for future work.
Author Contributions
Conceptualization, L.B.; methodology, L.B. and B.S.; validation, L.B., B.S. and L.Y.; formal analysis, B.S.; writing—original draft preparation, L.B.; writing—review and editing, B.S.; supervision, L.Y.; project administration, L.B. and L.Y.; funding acquisition, L.B. and L.Y. All authors have read and agreed to the published version of the manuscript.
Funding
This work was supported by the financial support from the Opening Fund of State Key Laboratory of Green Building in Western China (LSKF202109), and the National Natural Science Foundation of China (No. 51838011).
Institutional Review Board Statement
Not applicable.
Informed Consent Statement
Not applicable.
Data Availability Statement
Not applicable.
Acknowledgments
The authors would like to thank China’s National Climate Center for offering meteorological data for this research.
Conflicts of Interest
The authors declare no conflict of interest.
References
- Huo, T.; Ren, H.; Zhang, X.; Cai, W.; Feng, W.; Zhou, N.; Wang, X. China’s energy consumption in the building sector: A Statistical Yearbook-Energy Balance Sheet based splitting method. J. Clean. Prod. 2018, 185, 665–679. [Google Scholar] [CrossRef]
- Peng, C.; Yan, D.; Guo, S.; Hu, S.; Jiang, Y. Building energy use in China: Ceiling and scenario. Energy Build. 2015, 102, 307–316. [Google Scholar] [CrossRef]
- Li, J.; Shui, B. A comprehensive analysis of building energy efficiency policies in China: Status quo and development perspective. J. Clean. Prod. 2015, 90, 326–344. [Google Scholar] [CrossRef]
- MOHURD. Code for Thermal Design of Civil Building (GB 50176-2016), 1st ed.; China Architecture & Building Press: Beijing, China, 2016; pp. 17–18.
- Zhou, S.; Zhang, R.; Zhang, C. Meteorology and Climatology, 3rd ed.; China Higher Education Press: Beijing, China, 1997; pp. 2–15. [Google Scholar]
- Givoni, B. Climate Consideration in Building and Urban Design, 1st ed.; John Wiley and Sons Inc.: New York, NY, USA, 1998; pp. 17–22. [Google Scholar]
- Olgyay, V. Design with Climate: Bioclimatic Approach to Architectural Regionalism, 1st ed.; Princeton University Press: New Jersey, NJ, USA, 1962; pp. 1–10. [Google Scholar]
- Szokolay, S.V. Introduction to Architectural Science the Basis of Sustainable Design, 1st ed.; Architectural Press: Burlington, VT, USA, 2004; pp. 34–40. [Google Scholar]
- Walsh, A.; Cóstola, D.; Labaki, L.C. Review of methods for climatic zoning for building energy efficiency programs. Build. Environ. 2017, 112, 337–350. [Google Scholar] [CrossRef]
- Verichev, K.; Carpio, M. Climatic zoning for building construction in a temperate climate of Chile. Sustain. Cities Soc. 2018, 40, 352–364. [Google Scholar] [CrossRef]
- Ali, S.; Sharma, M.R.; Maiteya, V.K. Climatic classification for building design in India. Archit. Sci. Rev. 1993, 36, 31–34. [Google Scholar] [CrossRef]
- Rakoto-Joseph, O.; Garde, F.; David, M.; Adelard, L.; Randriamanantany, Z.A. Development of climatic zones and passive solar design in Madagascar. Energy Convers. Manag. 2009, 50, 1004–1010. [Google Scholar] [CrossRef]
- Briggs, R.S.; Lucas, R.G.; Taylor, Z.T. Climate classification for building energy codes and standards: Part 1–Development process. ASHRAE Trans. 2003, 109, 109–121. [Google Scholar]
- Walsh, A.; Cóstola, D.; Labaki, L.C. Performance-based validation of climatic zoning for building energy efficiency applications. Appl. Energy 2018, 212, 416–427. [Google Scholar] [CrossRef]
- Tsikaloudaki, K.; Laskos, K.; Bikas, D. On the establishment of climatic zones in Europe with regard to the energy performance of buildings. Energies 2011, 5, 32–44. [Google Scholar] [CrossRef]
- Bai, L.; Yang, L.; Song, B.; Liu, N. A new approach to develop a climate classification for building energy efficiency addressing Chinese climate characteristics. Energy 2020, 195, 116982. [Google Scholar] [CrossRef]
- Kottek, M.; Grieser, J.; Beck, C.; Rudolf, B.; Rubel, F. World map of the Köppen-Geiger climate classification updated. Meteorol. Z. 2006, 15, 259–263. [Google Scholar] [CrossRef]
- Briggs, R.S.; Lucas, R.G.; Taylor, Z.T. Climate classification for building energy codes and standards: Part 2–Zone definitions, maps, and comparisons. ASHRAE Trans. 2003, 109, 122–130. [Google Scholar]
- Kozjek, K.; Dolinar, M.; Skok, G. Objective climate classification of Slovenia. Int. J. Climatol. 2017, 37, 848–860. [Google Scholar] [CrossRef]
- Erell, E.; Portnov, B.A.; Etzion, Y. Mapping the potential for climate-conscious design of buildings. Build. Environ. 2003, 38, 271–281. [Google Scholar] [CrossRef]
- Madhulatha, T.S. An Overview on Clustering Methods. IOSR J. Eng. 2012, 2, 719–725. [Google Scholar] [CrossRef]
- Murtagh, F.; Pedro, C. Methods of hierarchical clustering. arXiv 2011, arXiv:1105.0121. [Google Scholar]
- Mahlstein, I.; Knutti, R. Regional climate change patterns identified by cluster analysis. Clim. Dyn. 2010, 35, 587–600. [Google Scholar] [CrossRef]
- Unal, Y.; Kindap, T.; Karaca, M. Redefining the climate zones of Turkey using cluster analysis. Int. J. Climatol. A J. R. Meteorol. Soc. 2003, 23, 1045–1055. [Google Scholar] [CrossRef]
- Kalkstein, L.S.; Tan, G.; Skindlov, J.A. An evaluation of three clustering procedures for use in synoptic climatological classification. J. Appl. Meteorol. Climatol. 1987, 26, 717–730. [Google Scholar] [CrossRef]
- Zhang, H.; Fu, X. Further climatic zoning of building energy efficiency based on principal component analysis and cluster analysis. J. HV AC 2012, 42, 119–124. [Google Scholar]
- Fu, X.; Zhang, H.; Huang, G. Discussion of climatic regions of building energy efficiency in China. J. HV AC 2008, 38, 44–47. [Google Scholar]
- Bai, L.; Wang, S. Definition of new thermal climate zones for building energy efficiency response to the climate change during the past decades in China. Energy 2019, 170, 709–719. [Google Scholar] [CrossRef]
- Xiong, J.; Yao, R.; Grimmond, S.; Zhang, Q.; Li, B. A hierarchical climatic zoning method for energy efficient building design applied in the region with diverse climate characteristics. Energy Build. 2019, 186, 355–367. [Google Scholar] [CrossRef]
- Wang, R.; Lu, S. A novel method of building climate subdivision oriented by reducing building energy demand. Energy Build. 2020, 216, 109999. [Google Scholar] [CrossRef]
- Hao, Z.; Zhang, X.; Xie, J.; Wang, J.; Liu, J. Building climate zones of major marine islands in China defined using two-stage zoning method and clustering analysis. Front. Archit. Res. 2021, 10, 134–147. [Google Scholar] [CrossRef]
- Huang, Y.; Luo, X. Geography in China. Reshaping Econ. Geogr. East Asia 2008, 196, 196–217. [Google Scholar]
- Veeck, G.; Pannell, C.W.; Smith, C.J.; Huang, Y.Q. China’s Geography: Globalization and the Dynamics of Political, Economic, and Social Change; Rowman & Littlefield Publishers: Lanham, MD, USA, 2007; pp. 5–7. [Google Scholar]
- MOHURD. Thermal Design Code for Civil Building (GB 50176-93), 1st ed.; China Architecture & Building Press: Beijing, China, 1993; pp. 1–12.
- Wan, K.K.; Li, D.H.; Yang, L.; Lam, J.C. Climate classifications and building energy use implications in China. Energy Build. 2010, 42, 1463–1471. [Google Scholar] [CrossRef]
- National Climate Center (NCC). Available online: https://www.ncc-cma.net/ (accessed on 8 August 2022).
- Wang, X.; Mai, X.; Lei, B.; Bi, H.; Zhao, B.; Mao, G. Collaborative optimization between passive design measures and active heating systems for building heating in Qinghai-Tibet plateau of China. Renew. Energy 2020, 147, 683–694. [Google Scholar] [CrossRef]
- Tang, M.; Zuo, X. Critical temperature for energy-saving building in winter. J. Xi’an Univ. Arch. Technol. 2011, 33, 321–324. [Google Scholar]
Figure 1.
The geographical layout of the primary zones of thermal climate zones in China.

Figure 2.
Determining the best number of categories in each clustering algorithm according to the ‘elbow’ method.
Figure 2.
Determining the best number of categories in each clustering algorithm according to the ‘elbow’ method.

Figure 3.
Evaluating the quality of each cluster results by root mean square deviation (RMSD). (a) The average value root mean square deviation of climate variable in each method. (b) The average value root mean square deviation of each category in each method.
Figure 3.
Evaluating the quality of each cluster results by root mean square deviation (RMSD). (a) The average value root mean square deviation of climate variable in each method. (b) The average value root mean square deviation of each category in each method.

Figure 4.
The average-linkage clustering process from 9 categories to 13 categories and the variation in the sum of squared error. (a) The cluster group in 9 categories. (b) The cluster group in 10 categories. (c) The cluster group in 11 categories. (d) The cluster group in 12 categories. (e) The cluster group in 13 categories. (f) The variation in the sum of squared error from 8 categories to 14 categories.

Figure 5.
The revised cluster result obtained by average-linkage clustering.

Figure 6.
The thermal climate zones developed by difference approaches. (a) The result developed by the average-linkage clustering. (b) The clustering result overlaps the current thermal climate zones.
Figure 6.
The thermal climate zones developed by difference approaches. (a) The result developed by the average-linkage clustering. (b) The clustering result overlaps the current thermal climate zones.

Figure 7.
The main differences between the clustering result and current thermal climate zones.

Figure 8.
The quality of the clustering result compared with the current thermal climate zones, in which the blue histogram represents the root mean square deviation of clustering result, and the organ one represents the root mean square deviation of current thermal climate zones.
Figure 8.
The quality of the clustering result compared with the current thermal climate zones, in which the blue histogram represents the root mean square deviation of clustering result, and the organ one represents the root mean square deviation of current thermal climate zones.

Figure 9.
The daily air temperature band of each climate zone in the newly defined thermal climate zones, in which the black solid line represents the mean value of daily mean temperature of the cities belonging to the corresponding climate zone, and the blue band represents the variation range of daily mean temperature of the cities belonging to the corresponding climate zone.


Table 1.
The zoning criteria of building thermal climate zoning of China (Ref. [4]).
Table 1.
The zoning criteria of building thermal climate zoning of China (Ref. [4]).
| Zone Name | Zoning Criteria | |
|---|---|---|
| Main Criteria | Complementary Criteria | |
| Severe cold zone (SCZ) | ≤ −10 °C | ≥ 145 days |
| Cold zone (CZ) | = 0–−10 °C | = 90–145 days |
| Hot summer and cold winter zone (HSCWZ) | = 25–30 °C | = 40–110 days |
| Hot summer and warm winter zone (HSWWZ) | = 25–29 °C | = 100–200 days |
| Mild zone (MZ) | = 18–25 °C | = 0–90 days |
Note: means the average air temperature in the coldest month, °C; means the average air temperature in the hottest month, °C; means the number of days that the average temperature is below 5 °C, days; means the number of days that the average temperature is above 25 °C, days.
Publisher’s Note: MDPI stays neutral with regard to jurisdictional claims in published maps and institutional affiliations. |
© 2022 by the authors. Licensee MDPI, Basel, Switzerland. This article is an open access article distributed under the terms and conditions of the Creative Commons Attribution (CC BY) license (https://creativecommons.org/licenses/by/4.0/).
Share and Cite
MDPI and ACS Style
Bai, L.; Song, B.; Yang, L. Developing the New Thermal Climate Zones of China for Building Energy Efficiency Using the Cluster Approach. Atmosphere 2022, 13, 1498. https://doi.org/10.3390/atmos13091498
AMA Style
Bai L, Song B, Yang L. Developing the New Thermal Climate Zones of China for Building Energy Efficiency Using the Cluster Approach. Atmosphere. 2022; 13(9):1498. https://doi.org/10.3390/atmos13091498
Chicago/Turabian StyleBai, Lujian, Bing Song, and Liu Yang. 2022. "Developing the New Thermal Climate Zones of China for Building Energy Efficiency Using the Cluster Approach" Atmosphere 13, no. 9: 1498. https://doi.org/10.3390/atmos13091498
Note that from the first issue of 2016, this journal uses article numbers instead of page numbers. See further details here.