

Analysis of the Carbon Intensity of Container Shipping on Trunk Routes: Referring to the Decarbonization Trajectory of the Poseidon Principle


Abstract
:1. Introduction
2. Literature Reviews of Carbon Intensity for Shipping
3. Decarbonization Trajectory and Calculated Model
3.1. Reference Datum for Carbon Intensity
3.2. Model Design of Carbon Intensity for Container Shipping
4. Trunk-Route Setting and Pollutant Assessment Results
4.1. Containerized Trade on Major East–West Trunk Routes
4.2. Assessment Results of Carbon Intensity
5. Conclusions
Author Contributions
Funding
Institutional Review Board Statement
Informed Consent Statement
Data Availability Statement
Conflicts of Interest
References
- Principles, P. A Global Framework for Responsible Ship Finance, Version 3.0; Denmark, 2020. Available online: www.poseidonprinciples.org (accessed on 22 June 2020).
- Board, O.S. National Academies of Sciences, Engineering, and Medicine. In Negative Emissions Technologies and Reliable Sequestration: A Research Agenda; National Academies Press: Dulles, VI, USA, 2019; ISBN 0309484529. [Google Scholar]
- Buhaug, O.; Corbett, J.J.; Eyring, V.; Endresen, O.; Faber, J.; Hanayama, S.; Lee, D.S.; Lee, D.; Lindstad, H.; Markowska, A.Z.; et al. Prevention of Air Pollution from Ships—Second IMO GHG Study; International Maritime Organization: London, UK, 2009. [Google Scholar]
- UNCTAD. Review of Maritime Transport, 2020. 3. Performance Indicators, “2. Emissions by Vessel Type and Other Determinants”, See Figures 3.29 and 3.30; UNCTAD: Geneva, Switzerland, 2020; pp. 93–102. [Google Scholar]
- UNCTAD. Decarbonizing maritime transport: Estimating fleet renewal trends based on ship-scrapping patterns. In Transport and Trade Facilitation Newsletter; UNCTAD: Geneva, Switzerland, 2020; Volume 85. [Google Scholar]
- Li, R.; Jiang, H.; Sotnyk, I.; Kubatko, O.; Almashaqbeh, Y. The CO2 Emissions Drivers of Post-Communist Economies in Eastern Europe and Central Asia. Atmosphere 2020, 11, 1019. [Google Scholar] [CrossRef]
- Tai, H.H. A Comparative Study on Pollutant Emissions and Hub-Port Selection in Panama Canal Expansion. Marit. Econ. Logist. 2015, 17, 163–178. [Google Scholar]
- Tai, H.H.; Lin, D.Y. The Impact of Trunk Route Deployment Changes on Pollutant Emissions in International Container Shipping after Panama Canal Expansion. Int. J. Logist. Manag. 2016, 27, 335–352. [Google Scholar] [CrossRef]
- UNCTAD. Decarbonizing shipping: What role for flag States? In Transport and Trade Facilitation Newsletter; UNCTAD: Geneva, Switzerland, 2020; Volume 86. [Google Scholar]
- UNCTAD. Towards the decarbonization of international maritime transport: Findings from a method developed by ECLAC [Economic Commission for Latin America and the Caribbean] on shipping [carbon-dioxide] CO2 emissions in Latin America. In Transport and Trade Facilitation Newsletter; UNCTAD: Geneva, Switzerland, 2020; Volume 86. [Google Scholar]
- IMO. Initial IMO Strategy on Reduction of GHG [Greenhouse Gas] Emissions from Ships; MEPC 72/17/Add.1. Annex 11. April; The International Maritime Organization: London, UK, 2019. [Google Scholar]
- BIMCO; Cruise Lines International Association; International Association of Dry Cargo Shipowners; International Chamber of Shipping; Interferry, International Parcel Tankers Association; Intertanko, World Shipping Council. Reduction of Greenhouse Gas Emissions from Ships: Proposal to Establish an International Maritime Research and Development Board (IMRB); MEPC 75/7/4. 18 December; The International Maritime Organization: London, UK, 2019. [Google Scholar]
- Global Maritime Forum. Getting to Zero Coalition. 2020. Available online: www.globalmaritimeforum.org/getting-to-zerocoalition (accessed on 16 May 2020).
- Parry, I.; Heine, D.; Kizzier, K.; Smith, T. Carbon taxation for international maritime fuels: Assessing the options. In Working Paper; WP/18/203; International Monetary Fund: Washington, DC, USA, 2018. [Google Scholar]
- Environmental Defense Fund. Shipping’s Green $1trn Is a Profitable Investment, Not a Cost; Environmental Defense Fund; the International Maritime Organization: London, UK, 2020. [Google Scholar]
- Englert, D.; Losos, A. Zero-emission shipping: What’s in it for developing countries? World Bank Blogs, 24 February 2020. [Google Scholar]
- Rutherford, D.; Mao, X.; Osipova, L.; Comer, B. Limiting Engine Power To Reduce [carbon dioxide] CO2 Emissions from Existing Ships. In Working Paper 2020-10; International Council on Clean Transportation: New York, NY, USA, 2020. [Google Scholar]
- Pavlenko, N.; Comer, B.; Zhou, Y.; Clark, N.; Rutherford, D. The climate implications of using LNG [liquefied natural gas] as a marine fuel. In Working Paper 2020-02; International Council on Clean Transportation: New York, NY, USA, 2020. [Google Scholar]
- Song, D.P.; Xu, J. An operational activity-based method to estimate CO2 emissions from container shipping considering empty container repositioning. Transp. Res. Part D 2012, 17, 91–96. [Google Scholar] [CrossRef]
- Tai, H.H.; Chang, Y.H. Reducing pollutant emissions from vessel maneuvering in port areas. Marit. Econ. Logist. 2022, 24, 651–671. [Google Scholar] [CrossRef]
- Li, Y.; Zhang, Y.; Cheng, J.; Zheng, C.; Li, M.; Xu, H.; Wang, R.; Chen, D.; Wang, X.; Fu, X.; et al. Comparative Analysis, Use Recommendations, and Application. Atmosphere 2022, 13, 1224. [Google Scholar] [CrossRef]
- Tai, H.H.; Wang, Y.M. Influence of vessel upsizing on pollution emissions along Far East–Europe trunk routes. Environ. Sci. Pollut. Res. 2022, 29, 65322–65333. [Google Scholar] [CrossRef] [PubMed]
- Tezdogan, T.; Incecik, A.; Turan, O.; Kellett, P. Assessing the impact of a slow steaming approach on reducing the fuel consumption of a containership advancing in head seas, 6th Transport Research Arena 18–21 April 2016. Transp. Res. Procedia 2016, 14, 1659–1668. [Google Scholar] [CrossRef]
- Dere, C.; Deniz, C. Load optimization of central cooling system pumps of a container ship for the slow steaming conditions to enhance the energy efficiency. J. Clean. Prod. 2019, 222, 206–217. [Google Scholar] [CrossRef]
- UNCTAD. Review of Maritime Transport, “1. International Maritime Trade and Port Traffic”, See Table 1.9; UNCTAD: Geneva, Switzerland, 2021; p. 15. [Google Scholar]
- Alphaliner Monthly Monitor. Available online: https://public.alphaliner.com/resources/Alphaliner_Terms.pdf (accessed on 1 June 2022).


| Container Ship (TEU Convert to GT) | 2012 Median EEOI/AER | 2019 AER Trajectory Value | 2020 AER Trajectory Value | 2021 AER Trajectory Value | |
|---|---|---|---|---|---|
| 0–999 TEU | 34.60 | 21.40 | 18.10 | 17.70 | 17.20 |
| 1000–1999 TEU | 31.60 | 18.80 | 15.90 | 15.50 | 15.10 |
| 2000–2999 TEU | 24.70 | 12.65 | 10.70 | 10.40 | 10.20 |
| 3000–4999 TEU | 21.30 | 10.52 | 8.90 | 8.70 | 8.40 |
| 5000–7999 TEU | 20.50 | 9.94 | 8.40 | 8.20 | 8.00 |
| 8000–11,999 TEU | 17.90 | 8.47 | 7.20 | 7.00 | 6.80 |
| 12,000–14,500 TEU | 13.20 | 5.87 | 5.00 | 4.80 | 4.70 |
| 14,500 TEU + | 13.20 | 5.87 | 5.00 | 4.80 | 4.70 |
| Symbol | Explanation |
|---|---|
| The sum of all CO2e (including CO2, CH4, N2O) by a vessel under different speeds and during berthing, unit: ton. | |
| Total pollution of CO2e generated during sailing, unit: ton. | |
| Total pollution of CO2e generated during the maneuvering stage when the container ship slows down upon approaching the port, unit: ton. | |
| Total pollution of CO2e by a container ship docked and loading/unloading stage at a port, unit: ton. | |
| Time for a container ship to sail from Port i to Port j (unit: hours). Calculated by dividing Di~j by V. | |
| Time required by a container ship to maneuver its way into a port, including waiting time for a berth. Port authorities estimate each vessel to spend approximately 2–5 h maneuvering at each port, unit: hours. | |
| Operation time while berthing at each port, which is determined by the operation efficiency of each port. | |
| Distance from Port i to Port j (unit: nautical mile). | |
| Vessel speed (unit: knot, nm per hour). Vessel speed is determined by power from the propeller, but actual speed may be affected by many factors. The optimum speed for the entire voyage is set from V = 15 to V = 20 knots. | |
| Total operation volume (TEU) at Port i, including loading/unloading. The estimated volume is based on the proportion of ship capacity. | |
| Operational efficiency at Port i. According to port authorities, most port operators use four or more gantry cranes to handle a trunk-route ship. The hub ports such as Shanghai and Singapore can handle 160 TEU per hour; other ports can handle 135 TEU per hour on average. | |
| Fuel economy: including various fuels used by the main engine, such as heavy diesel (HO) and generator oil (DO). t denotes the vessel type. The authors of [22] show the below values: The F value of HO: F = 0.5489×e0.107*V for large containerships (t = above 10,000 TEU; R2 = 0.9970), F = 0.4614×e0.1025*V for containerships (t = 3800–9999 TEU; R2 = 0.9959), and F = 0.3501×e0.1115*V for containerships (t = 999–3799 TEU; R2 = 0.9983). The F value of DO: F = 0.063 tons/per hour (t = above 10,000 TEU), F = 0.087 tons/per hour (t = 3800–9999 TEU), and F = 0.091tons/per hour (t = 999–3799 TEU). | |
| Emission factor (unit: ton/fuel type-ton weight) emitted during sailing (KHO = 2.6617 tons; KDO = 2.5212 tons), maneuvering (KHO = 2.6829 tons; KDO = 2.6743 tons), or berthing (KDO = 2.6743 tons). o refers to the type of fuel (HO/DO), n refers to sailing, maneuvering, and berthing [22]. |
| Capacity of Global Container Alliance and Carriers (TEUs) | On Asia–Europe Weekly Capacity (A/E) | On Asia–North America Weekly Capacity (T/P) | ||
|---|---|---|---|---|
| Global Capacity of Containerships deployed (TEUs) | 25,215,883 | 100.00% | 100.00% | 100.00% |
| 2 M Alliance (Maersk+MSC) | 8,599,614 | 34.10% | 36% | 25% |
| OCEAN Alliance (EMC+CMACGM+COSCO) | 7,725,128 | 30.64% | 36% | 37% |
| THE Alliance (Hapag-Lloyd+YML+HMM+ONE) | 4,752,193 | 18.85% | 26% | 23% |
| Other shipping carriers | 4,138,948 | 16.41% | 2% | 15% |
| Averaged TEU Size Range of Ships before Oct 2020. | 13,000–24,000 | 4000–14,000 | ||
| Averaged TEU Size Range of Ships after June 2022. | 10,000–24,000 | 1700–16,000 | ||
| Port | Route A: Asia–Europe Trunk Routes | Route B: Asia–USWC Trunk Routes | Route C: Asia–USEC Trunk Routes |
|---|---|---|---|
| 1 | Busan | Singapore | Singapore |
| 2 | Qingdao | Yantian | Yantian |
| 3 | Shanghai | Shekou | Xiamen |
| 4 | Ningbo | Xiamen | Ningbo |
| 5 | Hong Kong | Hong Kong | Shanghai |
| 6 | Xiamen | Ningbo | Qingdao |
| 7 | Shekou | Shanghai | Busan |
| 8 | Yantian | Qingdao | Colon |
| 9 | Singapore | Busan | Savannah |
| 10 | Port Kelang | Tacoma | NY/NJ |
| 11 | Piraeus | LA/LB | |
| 12 | Hamburg | ||
| 13 | Rotterdam | ||
| Scenario changes | Ship-size Range: Route A | Ship-size Range: Route B | Ship-size Range: Route C |
| 11,300–24,000 TEU | 8194–16,020 TEU | 4398–13,092 TEU | |
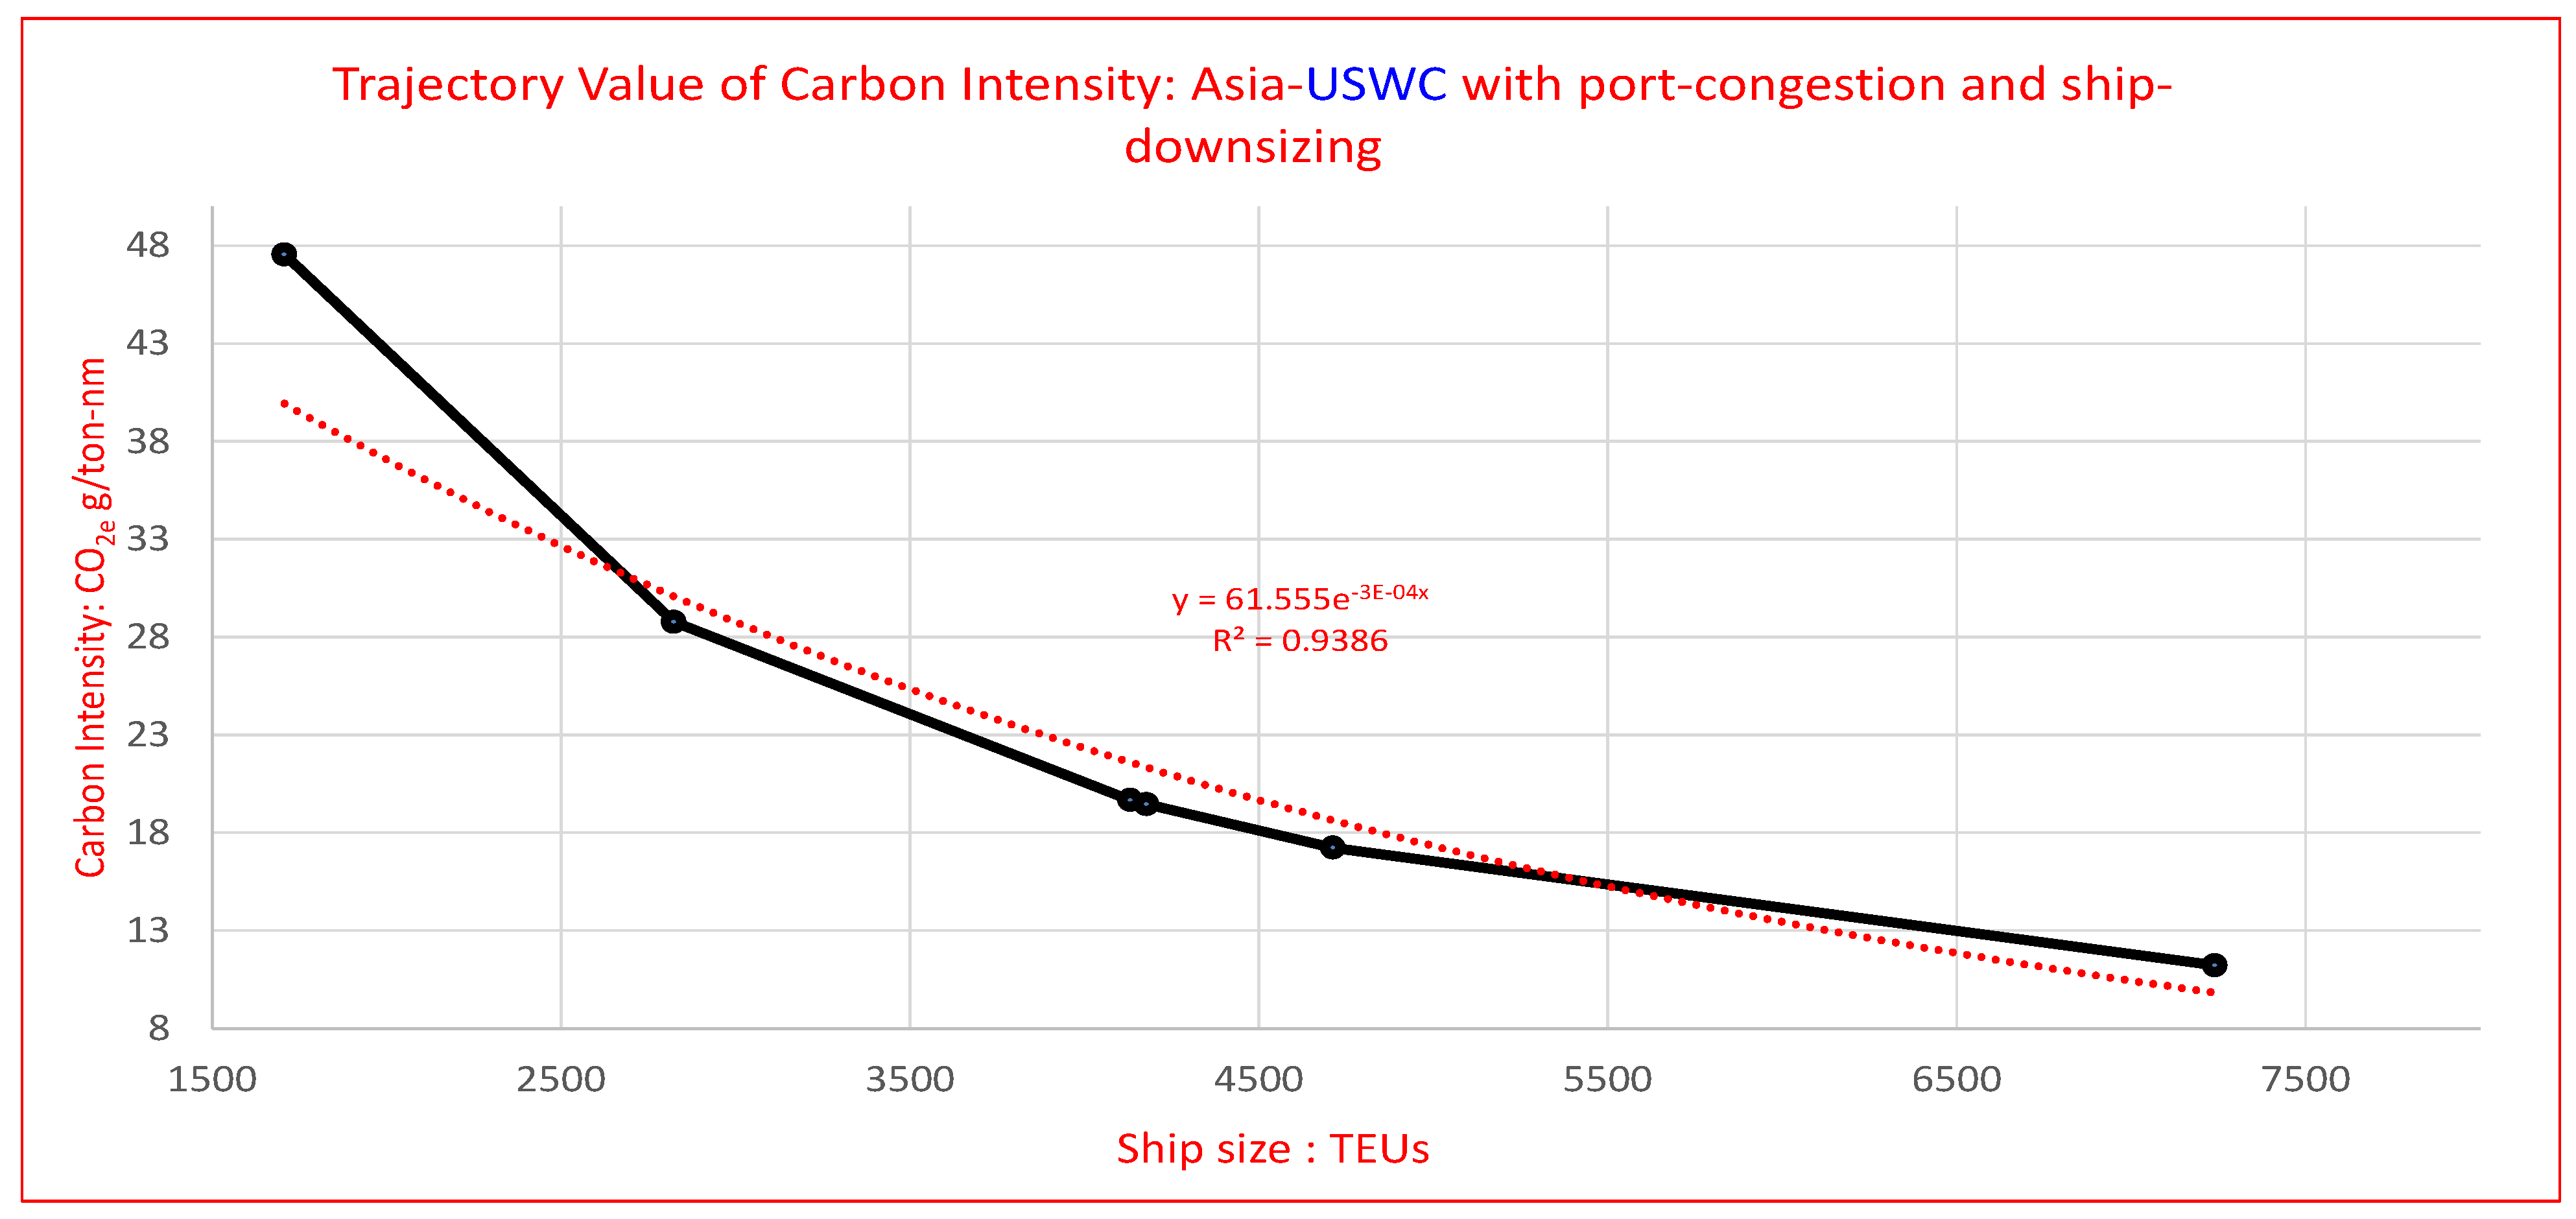
| None | 1708–7241 TEU for scenario changes: Route B-1/Route B-2/Route C-1 | ||
| Route A | Route B | Route B-1 | Route B-2 | Route C | Route C-1 | ||||||
|---|---|---|---|---|---|---|---|---|---|---|---|
| Ship-Size | Value * | Ship-Size | Value * | Ship-Size | Value * | Ship-Size | Value | Ship-Size | Value * | Ship-Size | Value |
| 11,300 | 6.48 | 8194 | 9.88 | 8194 | 9.92 | 1708 | 47.56 | 4398 | 18.34 | 1708 | 47.20 |
| 13,300 | 5.50 | 8850 | 9.15 | 8850 | 9.19 | 2824 | 28.77 | 5466 | 14.76 | 2824 | 28.55 |
| 13,800 | 5.31 | 8888 | 9.11 | 8888 | 9.15 | 4132 | 19.66 | 5527 | 14.59 | 4132 | 19.52 |
| 14,000 | 5.23 | 9962 | 8.13 | 9962 | 8.16 | 4178 | 19.45 | 6724 | 12.00 | 4178 | 19.30 |
| 15,300 | 4.79 | 10,036 | 8.07 | 10,036 | 8.10 | 4713 | 17.24 | 6845 | 11.78 | 4713 | 17.11 |
| 17,800 | 4.12 | 10,888 | 7.44 | 10,888 | 7.47 | 7241 | 11.22 | 6966 | 11.58 | 7241 | 11.14 |
| 18,000 | 4.07 | 11,008 | 7.36 | 11,008 | 7.39 | 7024 | 11.48 | ||||
| 19,400 | 3.78 | 11,388 | 7.11 | 11,388 | 7.14 | 8189 | 9.86 | ||||
| 20,500 | 3.58 | 12,118 | 6.68 | 12,118 | 6.71 | 8501 | 9.49 | ||||
| 22,000 | 3.34 | 13,568 | 5.97 | 13,568 | 5.99 | 9466 | 8.52 | ||||
| 22,690 | 3.24 | 14,812 | 5.47 | 14,812 | 5.49 | 11,008 | 7.33 | ||||
| 23,000 | 3.19 | 15,000 | 5.40 | 15,000 | 5.42 | 12,118 | 6.66 | ||||
| 24,000 | 3.06 | 16,020 | 5.06 | 16,020 | 5.08 | 13,092 | 6.17 | ||||
Publisher’s Note: MDPI stays neutral with regard to jurisdictional claims in published maps and institutional affiliations. |
© 2022 by the authors. Licensee MDPI, Basel, Switzerland. This article is an open access article distributed under the terms and conditions of the Creative Commons Attribution (CC BY) license (https://creativecommons.org/licenses/by/4.0/).
Share and Cite
Tai, H.-H.; Chang, Y.-H.; Chang, C.-W.; Wang, Y.-M. Analysis of the Carbon Intensity of Container Shipping on Trunk Routes: Referring to the Decarbonization Trajectory of the Poseidon Principle. Atmosphere 2022, 13, 1580. https://doi.org/10.3390/atmos13101580
Tai H-H, Chang Y-H, Chang C-W, Wang Y-M. Analysis of the Carbon Intensity of Container Shipping on Trunk Routes: Referring to the Decarbonization Trajectory of the Poseidon Principle. Atmosphere. 2022; 13(10):1580. https://doi.org/10.3390/atmos13101580
Chicago/Turabian StyleTai, Hui-Huang, Yun-Hua Chang, Chin-Wei Chang, and Yu-Meng Wang. 2022. "Analysis of the Carbon Intensity of Container Shipping on Trunk Routes: Referring to the Decarbonization Trajectory of the Poseidon Principle" Atmosphere 13, no. 10: 1580. https://doi.org/10.3390/atmos13101580