
Regional Differences in Control Operations during the 2019–2021 Desert Locust Upsurge


1
Epidemiology and Modelling Group, Department of Plant Sciences, University of Cambridge, Downing Street, Cambridge CB2 3EA, UK
2
Department of Civil and Environmental Engineering, University of Strathclyde, Glasgow G1 1XJ, UK
3
Food and Agriculture Organization of the United Nations, Viale delle Terme di Caracalla, 00153 Rome, Italy
*
Authors to whom correspondence should be addressed.
Agronomy 2021, 11(12), 2529; https://doi.org/10.3390/agronomy11122529
Submission received: 30 October 2021
/
Revised: 4 December 2021
/
Accepted: 7 December 2021
/
Published: 13 December 2021
(This article belongs to the Special Issue How to Manage Migratory Pests and Potential Food Crises: Locusts Plagues in the 2020’s)
Abstract
:The desert locust remains a major threat to global food security. Control operations are a crucial tool to manage crisis; this research investigated the nature of control operations conducted between 2019–2021. Historical data on desert locust and control operations were obtained from the survey reports at the FAO Locust Hub and analysed with respect to survey reports, land cover types, cropland/rangeland extent and crop productivity data. We found that 16.1% of the grid cells with locust presence and 14.9% of the grid cells with control operations had a proportion of rangeland higher than 0.75; while 13.3% of the grid cells with locust presence and 13.2% of the grid cells with control operations had a proportion of croplands higher than 0.75, highlighting that locust presence and control operations were reported in both rangeland and cropland. Control operations continue to be used both to reduce overall locust numbers and to protect crops. Furthermore, through identifying which crops were most at risk, our analyses indicate that wheat production was under the highest strain during periods of increased locust infestations.
1. Introduction
Desert locusts (Schistocerca gregaria) continue to pose one of the most severe threats to agricultural and rangeland crops, making their control a priority to food security in many regions [1]. Timely and precise early warning, and rapid response can be achieved through sustaining monitoring efforts [2], orienting surveys towards historical hotspots [3], increasing the areas accessed by field teams [4], integrating the roles of stakeholders [5], and by more efficient monitoring and control techniques [1]. Symmons [6] outlines three strategies in desert locust control: control during the upsurge for plague prevention, eliminating a plague through destroying all desert locusts, and allowing the plague to continue but protecting crops. The method of control applied and intensity of the control operation varies in accordance with the aim of the control operation and the stage in the desert locust outbreak in which it is applied. The United Nations Food and Agriculture Organisation (FAO) coordinates preventative and reactive control strategies through locust surveys and control operations, and providing early warning [7,8,9,10,11,12].
Prior to 1965, plagues of desert locust were common in East and West Africa, the Middle East and parts of Pakistan and India [13]. The availability of effective pesticides, together with an integrated programme for surveillance, monitoring and control, developed and advocated by FAO, has prevented local outbreaks and more widespread upsurges from developing into plagues in many regions since 1965 [14,15]. Pesticide application using ultra low volume (ULV) spraying formulations, originally developed in the 1950s and 1960s, remains one of the most extensive control methods [6,16]. Three types of sprayer platforms are utilised in a field, with each having specific control related characteristics: portable ULV sprayers (slow work rate and up to 10 ha target size), vehicle-mounted sprayers (medium work rate and 1–100 ha target size), and aircraft-mounted sprayers (fast work rate and over 25 ha target size) [17]. The dispersal of the pesticide into small droplets for ULV application ensures efficient use of the pesticide and effective dispersal on the wind. Restrictions of resource and availability of aerial spraying mean that handheld and especially vehicle-mounted spraying to control desert locust remain common.
However, the control of desert locusts can have negative ecological consequences on non-target organisms [18,19,20]. Organophosphates and carbamates have historically been the most commonly used insecticides as they are fast acting and relatively non-persistent [16]. The non-persistence minimises their impact on non-target insects as they do not remain biologically active for long after application. Nevertheless, organophosphate and carbamate insecticides are broad spectrum compounds, exhibiting toxic effects on other arthropods that risk causing unintended ecological damage. Biopesticides represent an alternative method for the control of desert locusts, providing specific control [19]. For example, Metarhizium anisopliae var. acridum is a biopesticide specific to the family Acrididea, containing desert locusts [20]. However, despite the benefits in minimising the ecological consequences of desert locust control, Metarhizium anisopliae is often not used due to slow action, variable locust mortality and challenges in its production and storage [16]. Nevertheless, good results were achieved in Somalia where it was used exclusively during the 2019–2021 upsurge. Whilst pesticides with adverse ecological consequences remain in use, monitoring and managing the extent and location of control operations will be an important method in minimising negative ecological consequences for non-target insects.
In May and October 2018, the tropical cyclones Mekunu and Luban caused heavy rainfall and intense precipitation events in the Arabian peninsula, which provided suitable environmental conditions for breeding, multiplication and gregarization of the desert locust [21,22]. In January 2019, desert locust swarms spread to Yemen, Saudi Arabia and Iran, eventually crossing the Red Sea to East Africa [23]. From June 2018 to June 2020, desert locust swarms were observed in more than 22 countries [23].
The current research was designed to investigate the nature of control operations conducted during the 2019–2021 desert locust upsurge. The work is part of wider project, designed to evaluate the potential for epidemiological models, coupled with meteorological models for swarm dispersal, to optimise the deployment of control in order to minimise the impacts of desert locust on agricultural crops and rangeland. Here we describe an empirical analysis of control practices. Specifically, we investigate properties of control operations under the following aspects: survey reports, land cover types, cropland/rangeland presence and crop productivity. The primary objective is to assess the extent to which control occurs on crop and pastureland (i.e., control aimed directly at desert locusts to minimise economic loss) compared with bare ground and shrubs (i.e., control aimed directly at desert locusts and indirectly at preventing economic loss and hardship). Our analysis indicates that control operations in East Africa, the Middle East and an Eastern Region (comprising, Iran, Pakistan, India and Nepal) were qualitatively different in terms of the type of control used for locust management and how desert locust infestations affected the livelihoods of the communities in these regions.
2. Materials and Methods
2.1. Data
Historical data on desert locust presence and control operations were obtained from survey reports and archives at the FAO Locust Hub website [24]. We have extracted the records dated between 1 January 2019 and 1 June 2021.
We used land cover classification from Copernicus global map of land cover at 100 m resolution data (CLC100) [25,26]. Maps of an area fraction that represent the percentage of the pixel occupied by cropland and rangeland at 1 km resolution were downloaded from EU Science Hub [27]. The global crop production statistics data for 2010 [28] and data in Sub-Saharan Africa for 2017 [29] (mapSPAM) were obtained from the International Food Policy Research Institute.
2.2. Analysis
We extracted Locust Hub reports for three regions: East Africa, the Middle East and the Eastern Region. East Africa region included Ethiopia (ET), Kenya (KE), Somalia (SO), Eritrea (ER), Djibouti (DJ), Uganda (UG), Tanzania (TZ), Sudan (SD&SU), South Sudan (SS), Egypt (EG) and D.R. Congo (CG). The country codes correspond to the “COUNTRYID” column in the Locust Hub database.
The Middle East region included Oman (OM), Saudi Arabia (SA), United Arab Emirates (AE&MU&TC), Yemen (YM&YE), Iraq (IQ), Jordan (JO), Bahrein (BH), Israel (IS), Kuwait) (KU&KW), Lebanon (LE) and Syria (SY).
The Eastern Region included India (IN), Pakistan (PK& PA), Iran (IR), and Nepal (NP). Our classification for the Eastern Region is based on observations that during recessions and even during upsurges, desert locust circulate between Iran, Pakistan and India. Only in a few situations do locusts invade the Eastern Region countries from outside, e.g., from Saudi Arabia to Iran, from Yemen/Somalia to India/Pakistan. This was also true during the current upsurge.
For each control report we extracted the country where it was applied and the type of control used. To align control data with ‘Swarm’ and ‘Band’ datasets from [24], we searched for reports that were reported within a 1 km radius and up to two days before the control operation. There remained a significant number of control reports within the criteria that did not correspond with the normal targets for control of ‘Swarm’ or ‘Band’ but with observations of the solitarious classifications, ‘Adult’ or ‘Band’. It is likely that the observations of solitarious desert locusts may be inflated by misclassification of the remnants of former swarms and bands and by multiple reporting of the same insects, a common problem of crowd-sourced reporting of data. Accordingly control operations that were not matched to ‘Swarms’ and ‘Bands’ were assigned to a ‘Not Assessed’ (‘NA’) category.
Land cover type corresponding to the reported location of the control operation was extracted from CLC100 [25].
To align control reports with crop and pastureland maps, we calculated the number of control reports within each 1 km × 1 km grid cell for cropland/rangeland analysis and 10 km × 10 km grid cell for crop production analysis. All analysis and map preparations were performed using R Statistical Software (version 4.1.0; R Foundation for Statistical Computing, Vienna, Austria).
3. Results
3.1. Temporal Distribution of Locust Reports and Control Operations
The compiled dataset comprised more than 75,000 desert locust records with 42.5% reported in East Africa, 23.3% reported in the Middle East, and 34.2% reported in Eastern Region (Figure 1). Desert locusts can be either in solitarious (hoppers and adults) or gregarious (bands of hoppers and swarms) phases. In addition, remnant locusts from control operations against hopper bands and swarms were sometimes reported as gregarious hopper and adult individuals or groups. This is not unusual during upsurges. In terms of the types of desert locust classified within the reports, 19.7% were swarms, 14.3% were bands, 39.4% were solitarious adults and 26.6% were solitarious hoppers. There was a high degree of temporal heterogeneity in the numbers of reports. The highest weekly number of swarm reports (855) was reported in East Africa on the week commencing the 26 January 2021, the highest number of band reports (802) was also reported in East Africa on the week commencing the 9 June 2020. This coincides with the breeding periods.
The number of control operations performed in 2019–2021 reflects the enormous scale of the desert locust upsurge and deployment of resources to manage it (Figure 2). Overall, more than 39,000 control operations were conducted with 28.7% reported in East Africa, 23.8% reported in the Middle East and 47.5% reported in the Eastern Region. These consisted of 66.9% vehicle based control, 8.5% air based control and 4.8% handheld based control. About 19.8% of control reports were classified as “Unknown”. This is likely to be control by teams using digital tools that report only basic information, e.g., control = Yes/No without indicating control method.
An increasing trend in the application of aerial control operations can be seen, with the peak reaching around 100 weekly aerial operations in November 2020 and February 2021. Most of the aerial control operations (86.2%) were conducted in East Africa. Further, within East Africa, 64.8% of aerial operations were conducted in Ethiopia, 4.7% in Kenya and 19.9% in Somalia. Overall, Kenya had the largest number of control reports (92.4%) classified as “Unknown”.
The intensity of control operations differed amongst the regions (Figure 2). In all regions, the peaks correspond to breeding periods and are a result of an increase in locust numbers. In East Africa, the peak of control operations was in July 2020 (around 500 weekly control operations), followed by an approximately constant number of control operations (around 100 per week) from October 2020 till April 2021. In the Eastern Region, there were two peak periods reaching around 600 weekly operations in September–November 2019 and 700 weekly operations in May–August 2020. The desert locust situation was brought under control in the Eastern Region in Iran, Pakistan, and India in September 2020 [30]. In the Middle East, the intensity of control operations varied, a few periods (June 2019, January 2020, and May 2020) reached 300 operations.
In terms of pesticides applied during control operations, Malathion was frequently used in East Africa (18.5% of the reports) and the Eastern Region (65.8% of the reports). Malathion is an organophosphorus compound with a high kill rate for desert locust [31]. Malathion has low persistence in the environment as it breaks down quickly due to hydrolysis, photolysis and biodegradation [32]. The most frequently used pesticides in the Middle East were Deltamethrin (38.3% of the reports) and Fenitrothion (35.8% of the reports). Deltamethrin is a synthetic pyrethroid having low toxicity to birds and mammals [33]. Fenitrothion is an organophosphate, which has been shown to have a strong and long-lasting effect on non-target insect taxa [34]. Metarhizium, which is a biopesticide and can induce high mortality in S. gregaria [35], has been extensively applied in Somalia and used to treat at least 76.5% of all controlled area. Pesticide usage was ranked as follows according to area treated. In East Africa: Malathion (28.5%), Chlorpyrifos (17.5%), Metarhizium (6.0%), Fenitrothion (3.2%), Teflubenzuron (1.2%), Deltamethrin (0.3%), Triflumuron (<0.01%), Lambda-cyhalothrin (<0.01%). In the Eastern Region: Malathion (40.7%), Deltamethrin (38.8%), Lambda-cyhalothrin (11.3%), Fenitrothion (0.8%), Diflubenzuron (0.05%), Metarhizium (0.02%), Chlorpyrifos (<0.01%). In the Middle East: Fenitrothion (48.1%), Deltamethrin (33.8%), Malathion (10.4%), Chlorpyrifos (2.7%), Lambda-cyhalothrin (1.9%), Diflubenzuron (0.5%), Triflumuron (0.05%), Teflubenzuron (0.05%), Metarhizium (0.03%).
We found high correlations between the weekly number of desert locust reports and the weekly number of control operations: 0.94 in East Africa, 0.88 in the Middle East and 0.98 in the Eastern Region (Figure 3). However, there were differences between the three regions when we calculated the correlation coefficient between the number of swarm reports and control operations: 0.62 in East Africa, −0.02 in the Middle East and 0.74 in the Eastern Region. In East Africa, the highest correlation between the weekly number of different types of desert locust was between hopper reports and band reports (0.88). Low correlations between swarm reports and band reports were observed in all three regions: 0.01 in the Middle East region, 0.18 in East Africa and 0.27 in the Eastern Region.
3.2. Land Cover Characteristics
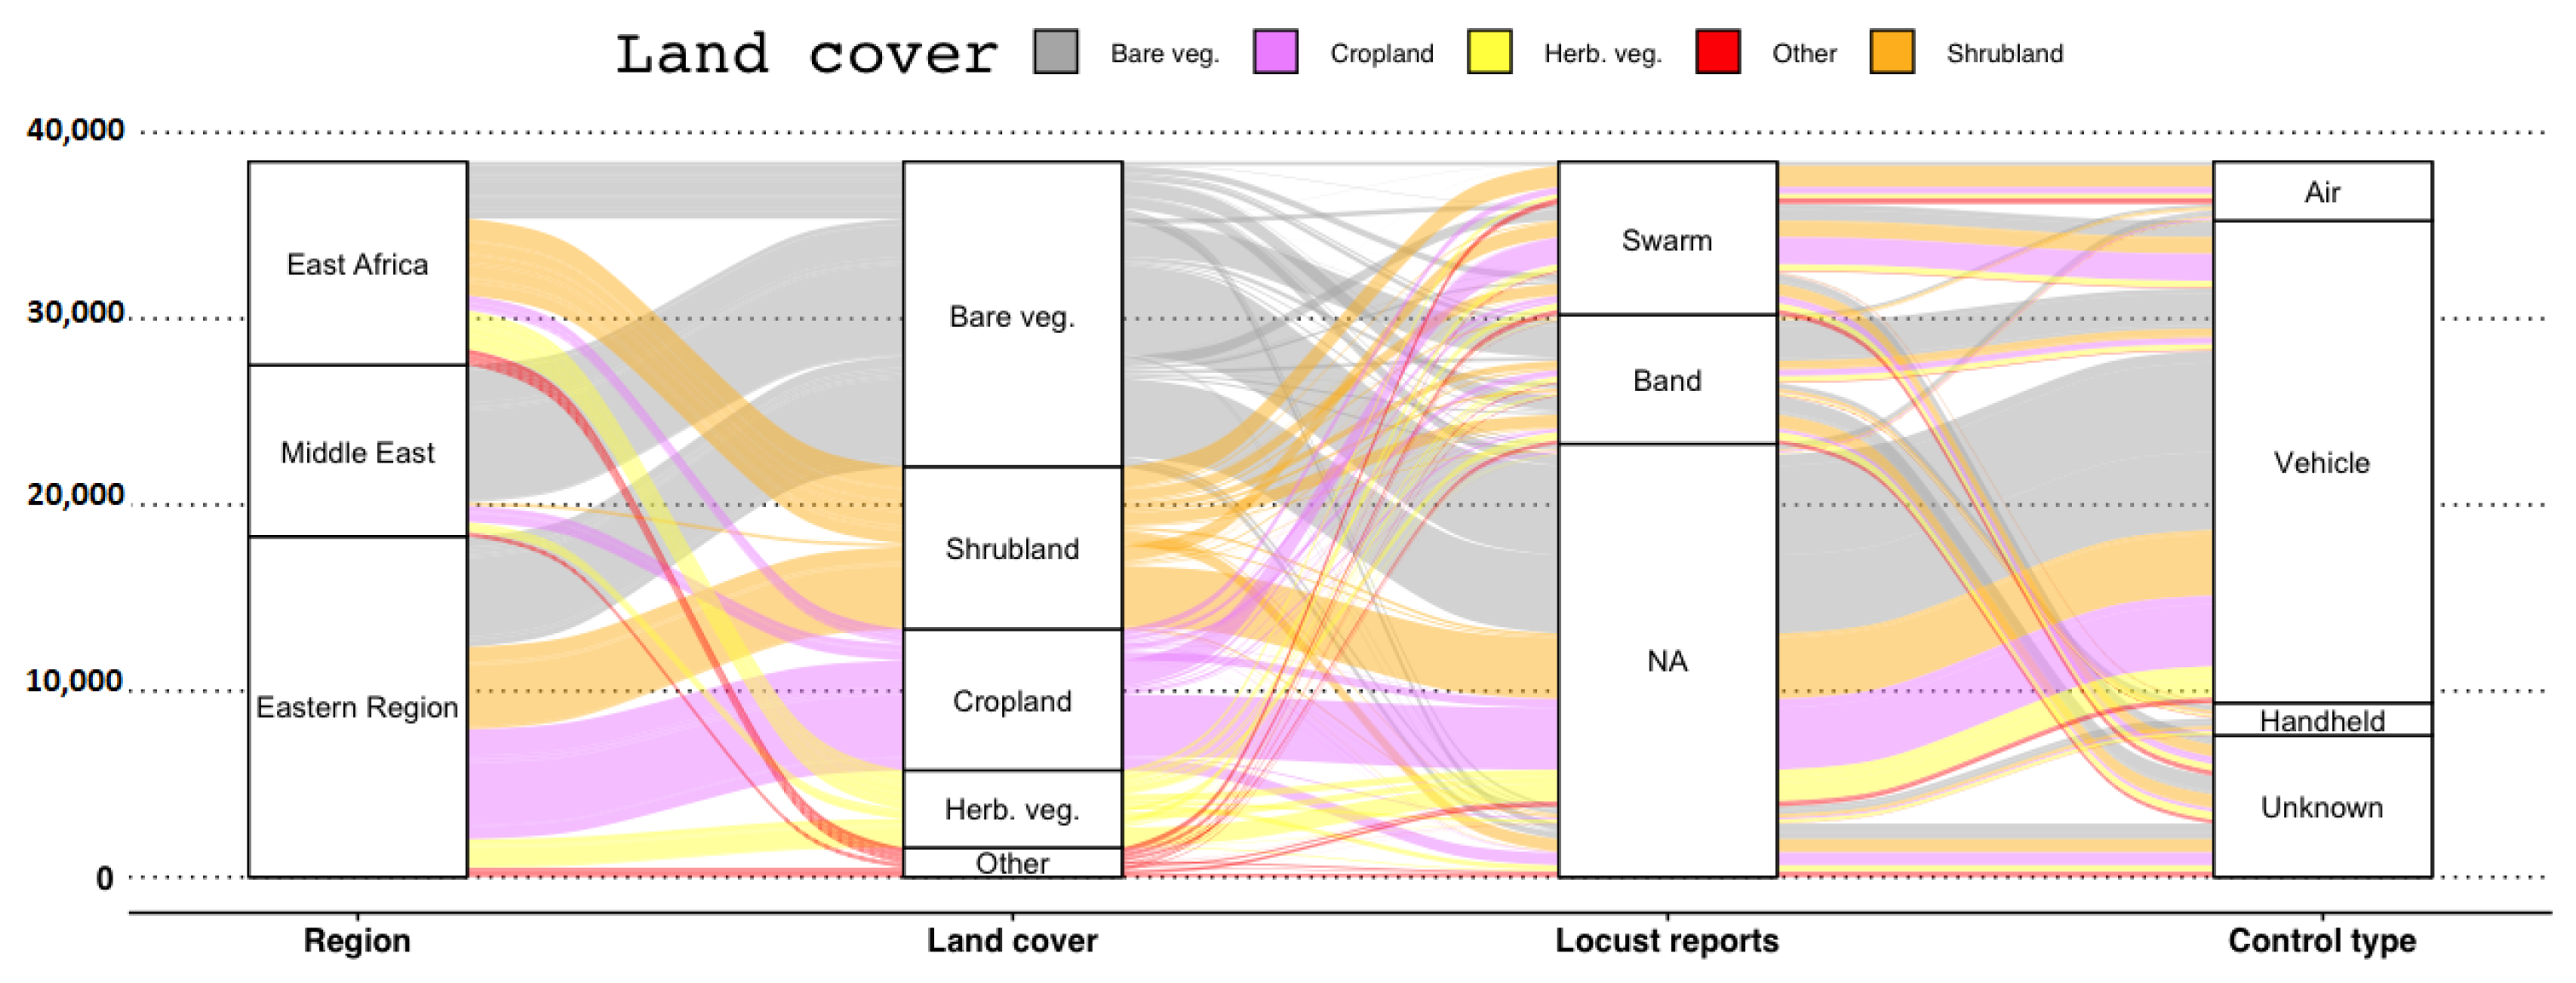
Figure 4 shows the frequency of land cover types for all regions and types of control. Bare parse vegetation, shrubs, cropland and herbaceous vegetation accounted for 96% of pixels with control operations. Bare/sparse vegetation is classified as lands with exposed soil, sand, or rocks and lands which never has more than 10% vegetated cover during any time of the year. Shrubs are classified as woody perennial plants with persistent and woody stems, or without any defined main stem, being less than 5 m tall [25].
The majority of vehicle based operations in the Middle East were reported over bare/sparse vegetation (83%), this is to be expected given that most of the region is desert. In the Eastern Region, a similar proportion of vehicle based control operations were reported over bare/sparse vegetation, shrubs and cultivated vegetation. In East Africa, 46% of aerial control were reported over land classified as shrubs, 20% over bare/sparse vegetation, and 14% over croplands. Overall, croplands (i.e., cultivated and managed vegetation/agriculture) accounted for 19% of the locations of control operations.
We could match 39.4% of control operations to swarm or band reports. The proportion of control operations that were not matched to swarms or bands (classified as ‘NA’ in Figure 4), could be explained by matching the control operations to solitarious locust reports (i.e., adult and hopper reports within a 1 km radius and up to two days before the control operation). This could be caused by erroneous classification of reports (for example, reporting remnant gregarious locusts from control operations as adults), as the standard operational procedure is that no sites with solitarious locust presence are subjected to control operations.
In East Africa, swarm reports preceded 35% of aerial operations conducted over bare/sparse vegetation, 65% of aerial operations conducted over shrubland, and 58% of aerial operations conducted over cropland.
3.3. Damage to Crop and Pasture Areas
We mapped the locations of control operations and desert locust reports against two of the factors determining livelihood: the proportion of grid cell area used as cropland and the proportion of grid cell area used as rangeland. We found that 13.3% of the grid cells with desert locust presence and 13.2% with control operations had a proportion of croplands higher than 0.75 (Figure 5). Similarly, 16.1% of the grid cells with desert locust presence and 14.9% with control operations had a proportion of rangeland higher than 0.75 (Figure 5).
To identify which crops are at the highest risk due to the desert locust upsurge, we used the data from the 2010 Spatial Production Allocation Model (mapSPAM) [28] to estimate crop production for the pixels with control operations. In East Africa, sugarcane (854 kt), other root crops (601 kt), maize (588 kt), sorghum (473 kt) and wheat (306 kt) were the five most vulnerable crops in terms of frequency of reported swarms and bands. In the Middle East, the top two crops potentially affected by desert locust were vegetables (1720 kt) and wheat (666 kt). In the Eastern Region, Wheat (4360 kt) and sugarcane (3923 kt) were the two most infested crops. Overall, wheat production would be under the highest strain (5151 kt) due to desert locust infestations.
We used mapSPAM data for Sub-Saharan Africa (v2 2017) [29] to investigate crops that were at risk from desert locust presence in East Africa at a national level. In Ethiopia, the top five crops affected were other roots (451 kt), sorghum (437 kt), maize (418 kt), wheat (354 kt) and other cereals (339 kt). In Kenya, the largest effect was on maize (267 kt), vegetables (186 kt) and potato crops (143 kt). In Somalia, the most affected crops were sorghum (8 kt), maize (8 kt) and groundnut (5 kt). Overall, in the three countries, maize (694 kt), sorghum (454 kt) and other roots (453 kt) were the top three crops at the highest risk.
4. Discussion
Desert locust surveys and control operations are two management actions that have direct influence on desert locust dynamics [15]. More than 73,000 desert locust records and more than 38,000 control operations have been reported during the 2019–2021 desert locust upsurge. We found high correlation (0.92–0.98) between the weekly number of desert locust reports and the weekly number of control operations.
Control operations in the three regions were qualitatively different in terms of the type of control used for locust management. In East Africa 25.8% of control operations were aerial and 21.5% were vehicle based, while a variety of pesticides were used as control with the most frequent being Malathion (18.5%). In the Middle East 89.5% of control operations were executed by vehicle, and most frequently used pesticides were Deltamethrin (38.3% of the reports) and Fenitrothion (35.8% of the reports). In the Eastern Region 84.5% of control operations were vehicle based, and Malathion was most frequently used pesticide (65.8% of the reports).
Desert locust behaviour and dispersal patterns are complex processes that depend on environmental factors such as temperature [36], precipitation [22,37], the condition of vegetation [38,39,40], soil moisture [41,42], soil composition [41] and the wind [36]. These factors can create either stimulatory or inhibitory conditions for gregarisation, desert locust migration and breeding. For example, low-level wind-field convergence and concentration within the preferred habitat of desert locusts can affect the rate of gregarisation [43,44], whilst sandy soil is required for female desert locusts to breed [41]. Our analysis shows that the majority of control operations (79% in the Middle East, 28% in East Africa and 24% in the Eastern Region) were conducted over bare/sparse vegetation; this land type has high potential for the sufficient sand and clay content required for breeding. It is also the typical habitat of desert locust, which differentiates them from typical pests found in crops.
Despite improvements in both preventative control techniques and international collaboration in desert locust prevention, the desert locust remains a major threat to sustainable agriculture and rural livelihoods [7]. Desert locust infestations can aggravate food shortage situations [45]. We found that 13.3% of the grid cells with desert locust presence and 13.2% of the grid cells with control operations had a proportion of croplands higher than 0.75. We found that maize, sorghum and other roots were the top three crops at the highest risk in Ethiopia, Kenya and Somalia. Overall, our analysis of the Locust hub data indicate that wheat production is under the highest strain due to desert locust invasions in the 2019–2021 upsurge. This is in agreement with the estimate of a 12% decline in productivity of wheat due to the current desert locust upsurge in India [46].
Rangeland damage by desert locusts is also a threat to rural livelihoods. Rangelands provide local rural communities with natural resources for livestock production as grazing areas, as well as contributing to their livelihoods with fuel wood, poles, medicinal plants and wild foods. For example, for the most recent data available in 2019, Somalia was the largest producer of camels in East Africa, with the total number of camels recorded 7,243,792 [47], and a mean increase in camel population of 1.77%/year [48]. Rangelands also deliver important ecosystem services such as maintaining biodiversity and storing large amounts of carbon [49]. We found that 16.1% of the grid cells with desert locust presence and 14.9% of the grid cells with control operations had a proportion of rangeland higher than 0.75. Therefore, our analysis confirms that control operations continue to be used both in the reduction of desert locust populations and protection of crops to limit damage. Further work is required, however, to assess the cost effectiveness of surveillance and deployment of chemical control in reducing the increase and spread of locust populations during an upsurge, and also in managing agricultural and rangeland losses. It is possible that optimal deployment strategies of where to survey and where to apply chemical control may differ for minimising crop and other losses, compared with minimising insect dispersal. Moreover, the relative cost-effectiveness and availability of aerial, vehicle-based and hand-held control needs to be assessed as does the environmental and human health impacts of different pesticide options relative to the obvious needs for food security.
Pest outbreaks can strongly affect local economies with invasive insects costing an estimated minimum of US$70billion per year globally [50]. Epidemiological modelling has been regularly used as a tool to evaluate different strategies for crop protection from pests and diseases [51]. Typically, model development requires the partition of spatial data into layers such as ‘host/habitat layer’, ‘environment layer’, ‘pest layer’, and ‘control layer’ [52]. A spatially explicit model of pest entry and dispersal can be combined with these heterogeneous layers to identify the outcome of alternative control strategies. Furthermore, control strategies can incorporate time-varying economic constraints [53] or human and social dimensions [54]. We anticipate that the present study will help to develop a novel epidemiological modelling framework incorporating optimal control theory for deployment of scarce resources [55,56] to inform the surveillance and management of desert locust infestations.
Author Contributions
Conceptualization, R.R., R.G.K.H. and C.A.G.; methodology, R.R. and C.A.G.; software, R.R.; formal analysis, R.R.; investigation, R.R., R.G.K.H., K.C. and C.A.G.; resources, C.A.G.; data curation, K.C. and R.R.; writing—original draft preparation, R.R., R.G.K.H., K.C. and C.A.G.; writing—review and editing, R.R., R.G.K.H., K.C. and C.A.G.; visualization, R.R.; funding acquisition, C.A.G. All authors have read and agreed to the published version of the manuscript.
Funding
This research was funded by The UK Foreign, Commonwealth and Development Office. CAG also acknowledges support from the Bill and Melinda Gates Foundation.
Institutional Review Board Statement
Not applicable.
Informed Consent Statement
Not applicable.
Data Availability Statement
All data are publicly available from the sources listed in Materials and Methods.
Acknowledgments
The authors gratefully acknowledge Alexandre V. Latchininsky (FAO, Plant Production and Protection Division (NSP), Rome) for critical reading of the manuscript and his comments.
Conflicts of Interest
The authors declare no conflict of interest. The funders had no role in the design of the study; in the collection, analyses, or interpretation of data; in the writing of the manuscript, or in the decision to publish the results.
References
- Zhang, L.; Lecoq, M.; Latchininsky, A.; Hunter, D. Locust and Grasshopper Management. Annu. Rev. Entomol. 2019, 64, 15–34. [Google Scholar] [CrossRef]
- Meynard, C.N.; Lecoq, M.; Chapuis, M.P.; Piou, C. On the relative role of climate change and management in the current desert locust outbreak in East Africa. Glob. Chang. Biol. 2020, 26, 3753–3755. [Google Scholar] [CrossRef]
- Gay, P.E.; Trumper, E.; Lecoq, M.; Piou, C. Importance of human capital, field knowledge and experience to improve pest locust management. Pest Manag. Sci. 2021, 77, 5463–5474. [Google Scholar] [CrossRef]
- Gay, P.E.; Lecoq, M.; Piou, C. The limitations of locust preventive management faced with spatial uncertainty: Exploration with a multiagent model. Pest Manag. Sci. 2020, 76, 1094–1102. [Google Scholar] [CrossRef]
- Gay, P.E.; Lecoq, M.; Piou, C. Improving preventive locust management: Insights from a multi-agent model. Pest Manag. Sci. 2018, 74, 46–58. [Google Scholar] [CrossRef]
- Symmons, P. Strategies to combat the desert locust. Crop Prot. 1992, 11, 206–212. [Google Scholar] [CrossRef]
- Lecoq, M. Desert locust threat to agricultural development and food security and FAO/International role in its control. Arab J. Plant Prot. 2003, 21, 188–193. [Google Scholar]
- Lecoq, M. Desert locust management: From ecology to anthropology. J. Orthoptera Res. 2005, 14, 179–186. [Google Scholar] [CrossRef] [Green Version]
- Cressman, K. Chapter 4.2—Desert Locust. In Biological and Environmental Hazards, Risks, and Disasters; Shroder, J.F., Sivanpillai, R., Eds.; Academic Press: Boston, MA, USA, 2016; pp. 87–105. [Google Scholar]
- FAO. Standard Operating Procedures (SOP) for Desert Locust Ground Survey; FAO: Rome, Italy, 2021; Available online: http://www.fao.org/ag/locusts/common/ecg/359/en/SOPSurveyENv2021.pdf (accessed on 1 August 2021).
- FAO. Standard Operating Procedures (SOP) for Desert Locust Ground Control; FAO: Rome, Italy, 2021; Available online: http://www.fao.org/ag/locusts/common/ecg/359/en/SOPControlE.pdf (accessed on 1 August 2021).
- FAO. Standard Operating Procedures (SOP) for Desert Locust Aerial Survey and Control; FAO: Rome, Italy, 2021; Available online: http://www.fao.org/ag/locusts/common/ecg/359/en/SOPAerialE.pdf (accessed on 1 August 2021).
- Pedgley, D. Desert Locust Forecasting Manual (Volume 1 of 2); Centre for Overseas Pest Research: London, UK, 1981. [Google Scholar]
- Lecoq, M. Recent progress in Desert and Migratory Locust management in Africa. Are preventative actions possible? J. Orthoptera Res. 2001, 10, 277–291. [Google Scholar] [CrossRef] [Green Version]
- Magor, J.I.; Lecoq, M.; Hunter, D.M. Preventive control and Desert Locust plagues. Crop Prot. 2008, 27, 1527–1533. [Google Scholar] [CrossRef]
- Dobson, H.M. Desert Locust Guidelines Control; Food and Agriculture Organization of the United Nations: Rome, Italy, 2001. [Google Scholar]
- Dobson, H.M. Desert Locust Guidelines 4. Control; FAO: Rome, Italy, 2001; Available online: https://www.fao.org/ag/locusts/common/ecg/347_en_DLG4e.pdf (accessed on 1 August 2021).
- Eriksson, H.; Wiktelius, S. Impact of chlorpyrifos used for desert locust control on non-target organisms in the vicinity of mangrove, an ecologically sensitive area. Int. J. Pest Manag. 2010, 57, 23–34. [Google Scholar] [CrossRef]
- Matthews, G.A. New Technology for Desert Locust Control. Agronomy 2021, 11, 1052. [Google Scholar] [CrossRef]
- Githae, E.W.; Kuria, E.K. Biological control of desert locust (Schistocerca gregaria Forskål). CAB Rev. Perspect. Agric. Vet. Sci. Nutr. Nat. Resour. 2021, 16, 13. [Google Scholar] [CrossRef]
- Salih, A.A.M.; Baraibar, M.; Mwangi, K.K.M.; Artan, G. Climate change and locust outbreak in East Africa. Nat. Clim. Chang. 2020, 10, 584–585. [Google Scholar] [CrossRef]
- Wang, L.; Zhuo, W.; Pei, Z.; Tong, X.; Han, W.; Fang, S. Using Long-Term Earth Observation Data to Reveal the Factors Contributing to the Early 2020 Desert Locust Upsurge and the Resulting Vegetation Loss. Remote Sens. 2021, 13, 680. [Google Scholar] [CrossRef]
- Showler, A.; Ebbe, M.O.; Lecoq, M.; Maeno, K.O. Early intervention against desert locusts: Current proactive approach and the prospect of sustainable outbreak prevention. Agron. J. 2021, 11, 312. [Google Scholar] [CrossRef]
- FAO Locust Hub. Available online: https://locust-hub-hqfao.hub.arcgis.com/ (accessed on 1 August 2021).
- Buchhorn, M.; Lesiv, M.; Tsendbazar, N.E.; Herold, M.; Bertels, L.; Smets, B. Copernicus Global Land Cover Layers—Collection 2. Remote Sens. 2020, 12, 1044. [Google Scholar] [CrossRef] [Green Version]
- Copernicus Global Land Cover Layers: CGLS-LC100 Collection 3. Available online: https://developers.google.com/earth-engine/datasets/catalog/COPERNICUS_Landcover_100m_Proba-V-C3_Global (accessed on 1 August 2021).
- Perez-Hoyos, A.; Udias, F.; Rembold, F.; Kerdiles, H.; Gallego, J. Integrating multiple land cover maps through a multi-criteria analysis to improve agricultural monitoring in Africa. Int. J. Appl. Earth Obs. Geoinf. 2020, 88, 1020642. [Google Scholar] [CrossRef]
- Yu, Q.; You, L.; Wood-Sichra, U.; Ru, Y.; Joglekar, A.K.B.; Fritz, S.; Xiong, W.; Lu, M.; Wu, W.; Yang, P. A cultivated planet in 2010: 2. the global gridded agricultural production maps. Earth Syst. Sci. Data Discuss. 2020, 12, 3545–3572. [Google Scholar] [CrossRef]
- International Food Policy Research Institute. Spatially-Disaggregated Crop Production Statistics Data in Africa South of the Sahara for 2017; Harvard Dataverse, V2; International Food Policy Research Institute: Washington, DC, USA, 2020. [Google Scholar] [CrossRef]
- Sultana, R.; Kumar, S.; Samejo, A.A.; Soomro, S.; Lecoq, M. The 2019–2020 upsurge of the desert locust and its impact in Pakistan. J. Orthoptera Res. 2021, 30, 145–154. [Google Scholar] [CrossRef]
- Ahmed, H.; Gardiner, B.G. Activation of Malathion by the Locust Bodywall. Nature 1968, 17, 776–777. [Google Scholar] [CrossRef]
- Tchounwou, P.B.; Patlolla, A.K.; Yedjou, C.G.; Moore, P.D. Environmental Exposure and Health Effects Associated with Malathion Toxicity. In Toxicity and Hazard of Agrochemicals; InTech: Vienna, Austria, 2015. [Google Scholar]
- Samways, M.J. Can Locust Control be Compatible with Conserving Biodiversity? In Grasshoppers and Grassland Health; NATO Science Series (Series 2. Environment Security); Lockwood, J.A., Latchininsky, A.V., Sergeev, M.G., Eds.; Springer: Dordrecht, The Netherlands, 2000; Volume 73. [Google Scholar]
- Peveling, R.; Rafanomezantsoa, J.J.; Razafinirina, R.; Tovonkery, R.; Zafimaniry, G. Environmental impact of the locust control agents fenitrothion, fenitrothion esfenvalerate and triflumuron on terrestrial arthropods in Madagascar. Crop Prot. 1999, 18, 659–676. [Google Scholar] [CrossRef]
- Blanford, S.; Thomas, M.B. Adult Survival, Maturation, and Reproduction of the Desert Locust Schistocerca gregaria Infected with the Fungus Metarhizium anisopliae var acridum. J. Invertebr. Pathol. 2001, 78, 1–8. [Google Scholar] [CrossRef] [PubMed] [Green Version]
- FAO. Standard Operating Procedures (SOP) Desert Locust Biology and Behaviour; FAO: Rome, Italy, 2021; Available online: http://www.fao.org/ag/locusts/common/ecg/359/en/SOPBiologyENv2021.pdf (accessed on 1 August 2021).
- Tratalos, J.; Cheke, R.; Healey, R.; Stenseth, N. Desert locust populations, rainfall and climate change: Insights from phenomenological models using gridded monthly data. Clim. Res. 2010, 43, 229–239. [Google Scholar] [CrossRef]
- Pekel, J.F.; Ceccato, P.; Vancutsem, C.; Cressman, K.; Vanbogaert, E.; Defourny, P. Development and Application of Multi-Temporal Colorimetric Transformation to Monitor Vegetation in the Desert Locust Habitat. IEEE J. Sel. Top. Appl. Earth Obs. Remote Sens. 2011, 4, 318–326. [Google Scholar] [CrossRef]
- Renier, C.; Waldner, F.; Jacques, D.M.; Ebbe, M.A.B.; Cressman, K.; Defourny, P. A Dynamic Vegetation Senescence Indicator for Near-Real-Time Desert Locust Habitat Monitoring with MODIS. Remote Sens. 2015, 7, 7545–7570. [Google Scholar] [CrossRef] [Green Version]
- Maeno, K.O.; Ould Ely, S.; Ould Mohamed, S.; Jaavar, M.E.H.; Ould Babah Ebbe, M.A. Adult Desert Locust Swarms, Schistocerca gregaria, Preferentially Roost in the Tallest Plants at Any Given Site in the Sahara Desert. Agronomy 2020, 10, 1923. [Google Scholar] [CrossRef]
- Ellenburg, W.E.; Mishra, V.; Roberts, J.B.; Limaye, A.S.; Case, J.L.; Blankenship, C.B.; Cressman, K. Detecting Desert Locust Breeding Grounds: A Satellite-Assisted Modeling Approach. Remote Sens. 2021, 13, 1276. [Google Scholar] [CrossRef]
- Gomez, D.; Salvador, P.; Sanz, J.; Rodrigo, J.F.; Gil1, J.; Casanova, J.S. Prediction of desert locust breeding areas using machine learning methods and SMOS (MIR SMNRT2) Near Real Time product. J. Arid. Environ. 2021, 194, 104599. [Google Scholar] [CrossRef]
- WMO/FAO. Weather and Desert Locusts, World Meteorological Organization and Food and Agriculture Organization of the United Nations; World Meteorological Organization (WMO): Geneva, Switzerland, 2016. [Google Scholar]
- Huis, A.V.; Cressman, K.; Magor, J.I. Preventing desert locust plagues: Optimizing management interventions. Entomol. Exp. Appl. 2007, 122, 191–214. [Google Scholar] [CrossRef]
- Baro, M.; Deubel, T.F. Persistent hunger: Perspectives on vulnerability, famine, and food security in sub-Saharan Africa. Annu. Rev. Anthropol. 2006, 35, 521–538. [Google Scholar] [CrossRef]
- Chatterjee, S. How Hard Did That Sting? Estimating the Economic Costs of Locust Attacks on Agricultural Production. Appl. Econ. Perspect. Policy 2020, 1–26. [Google Scholar] [CrossRef]
- FAOSTAT. 2021. Available online: http://www.fao.org/faostat/en/#data (accessed on 1 August 2021).
- Faye, B. How many large camelids in the world? A synthetic analysis of the world camel demographic changes. Pastoralism 2020, 10, 25. [Google Scholar] [CrossRef]
- Milton, S.; Barnard, P. Tenure, livelihoods and sustainable development- rangelands as systems for multiple land use and livelihood support. Afr. J. Range Forage Sci. 2003, 20, 202–209. [Google Scholar]
- Bradshaw, C.; Leroy, B.; Bellard, C. Massive yet grossly underestimated global costs of invasive insects. Nat. Commun. 2016, 7, 12986. [Google Scholar] [CrossRef]
- Cunniffe, N.J.; Gilligan, C.A. Use of mathematical models to predict epidemics and to optimise disease detection and management. Emerg. Plant Dis. Glob. Food Secur. 2020, 12, 239–266. [Google Scholar]
- Cunniffe, N.J.; Koskella, B.; Metcalf, C.J.; Parnell, S.; Gottwald, T.R.; Gilligan, C.A. Thirteen challenges in modelling plant diseases. Epidemics. Epidemics 2015, 10, 6–10. [Google Scholar] [CrossRef] [PubMed] [Green Version]
- Forster, G.A.; Gilligan, C.A. Optimizing the control of disease infestations at the landscape scale. Proc. Natl. Acad. Sci. USA 2007, 104, 4984–4989. [Google Scholar] [CrossRef] [Green Version]
- Therville, C.; Anderies, J.M.; Lecoq, M.; Cease, A. Locusts and People: Integrating the Social Sciences in Sustainable Locust Management. Agronomy 2021, 11, 951. [Google Scholar] [CrossRef]
- Rowthorn, R.E.; Laxminarayan, R.; Gilligan, C.A. Optimal control of epidemics in metapopulations. J. R. Soc. Interface 2009, 6, 1135–1144. [Google Scholar] [CrossRef] [PubMed] [Green Version]
- Klein, E.; Laxminarayan, R.; Smith, D.L.; Gilligan, C.A. Economic incentives and mathematical models of disease. Environ. Dev. Econ. 2007, 12, 707–732. [Google Scholar] [CrossRef]
Figure 1.
The weekly numbers of desert locust reports. Surveys are categorised as swarms, bands, adults or hoppers. Data from [24] (LocustHub).
Figure 1.
The weekly numbers of desert locust reports. Surveys are categorised as swarms, bands, adults or hoppers. Data from [24] (LocustHub).

Figure 2.
The weekly number of control operations. Control operations are categorised according to region: East Africa, the Middle East and the Eastern Region. Data from [24] (Locust Hub).
Figure 2.
The weekly number of control operations. Control operations are categorised according to region: East Africa, the Middle East and the Eastern Region. Data from [24] (Locust Hub).

Figure 3.
Correlation matrices between the weekly number of control operations and desert locust reports. Colour intensity and the size of the circle are proportional to the correlation coefficients. Data from [24] (Locust Hub).
Figure 3.
Correlation matrices between the weekly number of control operations and desert locust reports. Colour intensity and the size of the circle are proportional to the correlation coefficients. Data from [24] (Locust Hub).

Figure 4.
Relationship between control type, locust reports and land cover in the three regions. Y axis corresponds to the number of reported control operations. The most frequent land cover types are given by bare/sparse vegetation (Bare veg.), cropland, herbaceous vegetation (Herb. veg.) and shrubland. Locust reports refer to the gregarious categories ‘Swarm’ and ‘Band’ that were matched to reports of control (i.e., reports within a 1 km radius and up to two days before the control operation in the Locust Hub dataset [24]. The ‘NA’ (‘Not Assessed’) category refers to control operations that could not be matched to the gregarious classes.

Figure 5.
The fraction of land used as cropland and rangeland for pixels with locust reports and control operations. It should be noted that timing of locust infestations with crop production and pasture availability are not reflected in the above maps.
Figure 5.
The fraction of land used as cropland and rangeland for pixels with locust reports and control operations. It should be noted that timing of locust infestations with crop production and pasture availability are not reflected in the above maps.

Publisher’s Note: MDPI stays neutral with regard to jurisdictional claims in published maps and institutional affiliations. |
© 2021 by the authors. Licensee MDPI, Basel, Switzerland. This article is an open access article distributed under the terms and conditions of the Creative Commons Attribution (CC BY) license (https://creativecommons.org/licenses/by/4.0/).
Share and Cite
MDPI and ACS Style
Retkute, R.; Hinton, R.G.K.; Cressman, K.; Gilligan, C.A. Regional Differences in Control Operations during the 2019–2021 Desert Locust Upsurge. Agronomy 2021, 11, 2529. https://doi.org/10.3390/agronomy11122529
AMA Style
Retkute R, Hinton RGK, Cressman K, Gilligan CA. Regional Differences in Control Operations during the 2019–2021 Desert Locust Upsurge. Agronomy. 2021; 11(12):2529. https://doi.org/10.3390/agronomy11122529
Chicago/Turabian StyleRetkute, Renata, Rebekah G. K. Hinton, Keith Cressman, and Christopher A. Gilligan. 2021. "Regional Differences in Control Operations during the 2019–2021 Desert Locust Upsurge" Agronomy 11, no. 12: 2529. https://doi.org/10.3390/agronomy11122529
Note that from the first issue of 2016, this journal uses article numbers instead of page numbers. See further details here.