Article

Validation of a Key Performance Indicator Framework Demonstrating Economic Benefits Gained through Resolving Nautical Bottlenecks on Selected Sections of the Danube

by
Bianca Duldner-Borca
1,*,
Edwin van Hassel
2 and
Lisa-Maria Putz-Egger
1
1
Department of Logistics, University of Applied Sciences Upper Austria, Wehrgrabengasse 1-3, 4400 Steyr, Austria
2
Department of Transport and Regional Economics, University of Antwerp, Prinsstraat 13, 2000 Antwerp, Belgium
*
Author to whom correspondence should be addressed.
Sustainability 2023, 15(24), 16742; https://doi.org/10.3390/su152416742
Submission received: 31 October 2023 / Revised: 27 November 2023 / Accepted: 4 December 2023 / Published: 11 December 2023
(This article belongs to the Special Issue Sustainable Transport Using Inland Waterways)

Abstract

:
Addressing nautical bottlenecks is crucial for optimizing the utilization of inland waterways and maximizing the economic benefits of transports. To maximize economic benefits, a study was conducted to validate a key performance indicator (KPI)-based framework. This framework offers a structured approach to assessing the impact of resolved nautical bottlenecks on the economic benefits of inland waterway transport (IWT). To validate the applicability of the KPI framework, interviews with eleven experts were conducted. The goal was to prioritize each KPI based on their insights. The results of the interviews shed light on the relevance and coherence of both the individual KPIs and the overall KPI framework. The experts confirmed the importance of measures related to transportation efficiency, such as reduced transit times, increased vessel throughput, and enhanced reliability. The validated KPI-based framework serves as a valuable tool for policymakers, industry stakeholders, and researchers. It enables the assessment of the effects of resolving nautical bottlenecks in inland waterway systems. Future research should focus on quantifying the multifaceted impacts, making this framework even more useful for decision-making processes concerning investments in infrastructure upgrades and maintenance.

1. Introduction

In 2019, the European Green Deal was introduced as a response to global warming and climate change. Its objective is for Europe to become the first climate-neutral continent by 2050, aligning with science-based targets for decarbonization [1]. To achieve the decarbonization targets, the emphasis is placed on the transportation sector, which contributes to around 25% of Europe’s greenhouse gas emissions [2]. To specify the objectives and measures for the European transport sector, the Sustainable and Smart Mobility Strategy was published in late 2020. One of the major areas with potential for emission reduction is a modal shift to inland waterway transport (IWT), which mitigates the negative effects of road transport, such as CO2 emissions, noise, and odour, as well as congestion. Compared to road transport, IWT saves up to 70% of CO2 emissions per tonne transported and has a lower accident rate and limited noise pollution [2,3,4,5].
European IWT faces specific challenges, which must be mitigated to support a feasible modal shift. To strengthen inland navigation, continuous and resilient infrastructure is necessary, which means achieving a minimum fairway width and depth [6]. Natural inland waterways, e.g., rivers, being a natural resource, exhibit irregular riverbeds, resulting in varying fairway depths along the river’s course and throughout different seasons of the year [7]. Establishing minimum parameters, such as a consistent fairway depth throughout the year, is crucial for ensuring smooth and economically sustainable inland waterway transportation [6,8]. Sections that cannot meet the minimum parameters are referred to as nautical bottlenecks. Complete removal of bottlenecks has proven difficult and is associated with high costs, although their removal provides numerous benefits, including increased transport capacity, improved economic efficiency, reduced CO2 emissions per tonne transported, lower vessel resistance, reduced fuel consumption, and higher sailing speeds [6,9,10].
To facilitate decision making and incentivize the removal of under-maintained bottlenecks, it is crucial to quantify the performance gains in inland waterway transport. Quantitative benefit evaluation serves as a basis for investment decisions, particularly in complex economic evaluations. Although economic evaluations are time-consuming and expensive, they play a vital role in strategic planning for various sectors, including transport and infrastructure projects [11,12,13,14]. However, the challenge lies in selecting appropriate key performance indicators (KPIs) that can quantify the benefits for each specific use case [15]. The identification of KPIs helps us understand the underlying elements of a transport system affected by nautical bottlenecks and their interconnections [16].
This article aims to validate a literature-based framework [17] for understanding the economic effects of resolving nautical bottlenecks on inland waterways by means of in-depth qualitative expert interviews. Furthermore, the individual KPIs will be ranked according to their importance as a method of evaluating the economic benefits of resolving nautical bottlenecks. Even though there are several aspects hampering IWT, we understand nautical bottlenecks as a low fairway depth within this paper, as this is a major challenge, particularly on the Danube. The research questions guiding the following study are:
(RQ1) How can the theoretical framework to quantify the economic benefits of removing a nautical bottleneck be validated?
(RQ2) What are the most relevant KPIs for modelling the economic benefits of the removal of nautical bottlenecks?
This article follows a structured approach for the validation of a developed KPI framework originally based on literature research and the prioritization of individual KPIs. Section 2 consists of a theoretical background and the presentation of the initial KPI framework. Section 3 describes the methodology and the interview partners. Section 4 showcases the results and discusses them, and Section 5 concludes the paper and provides a detailed outlook regarding this research.

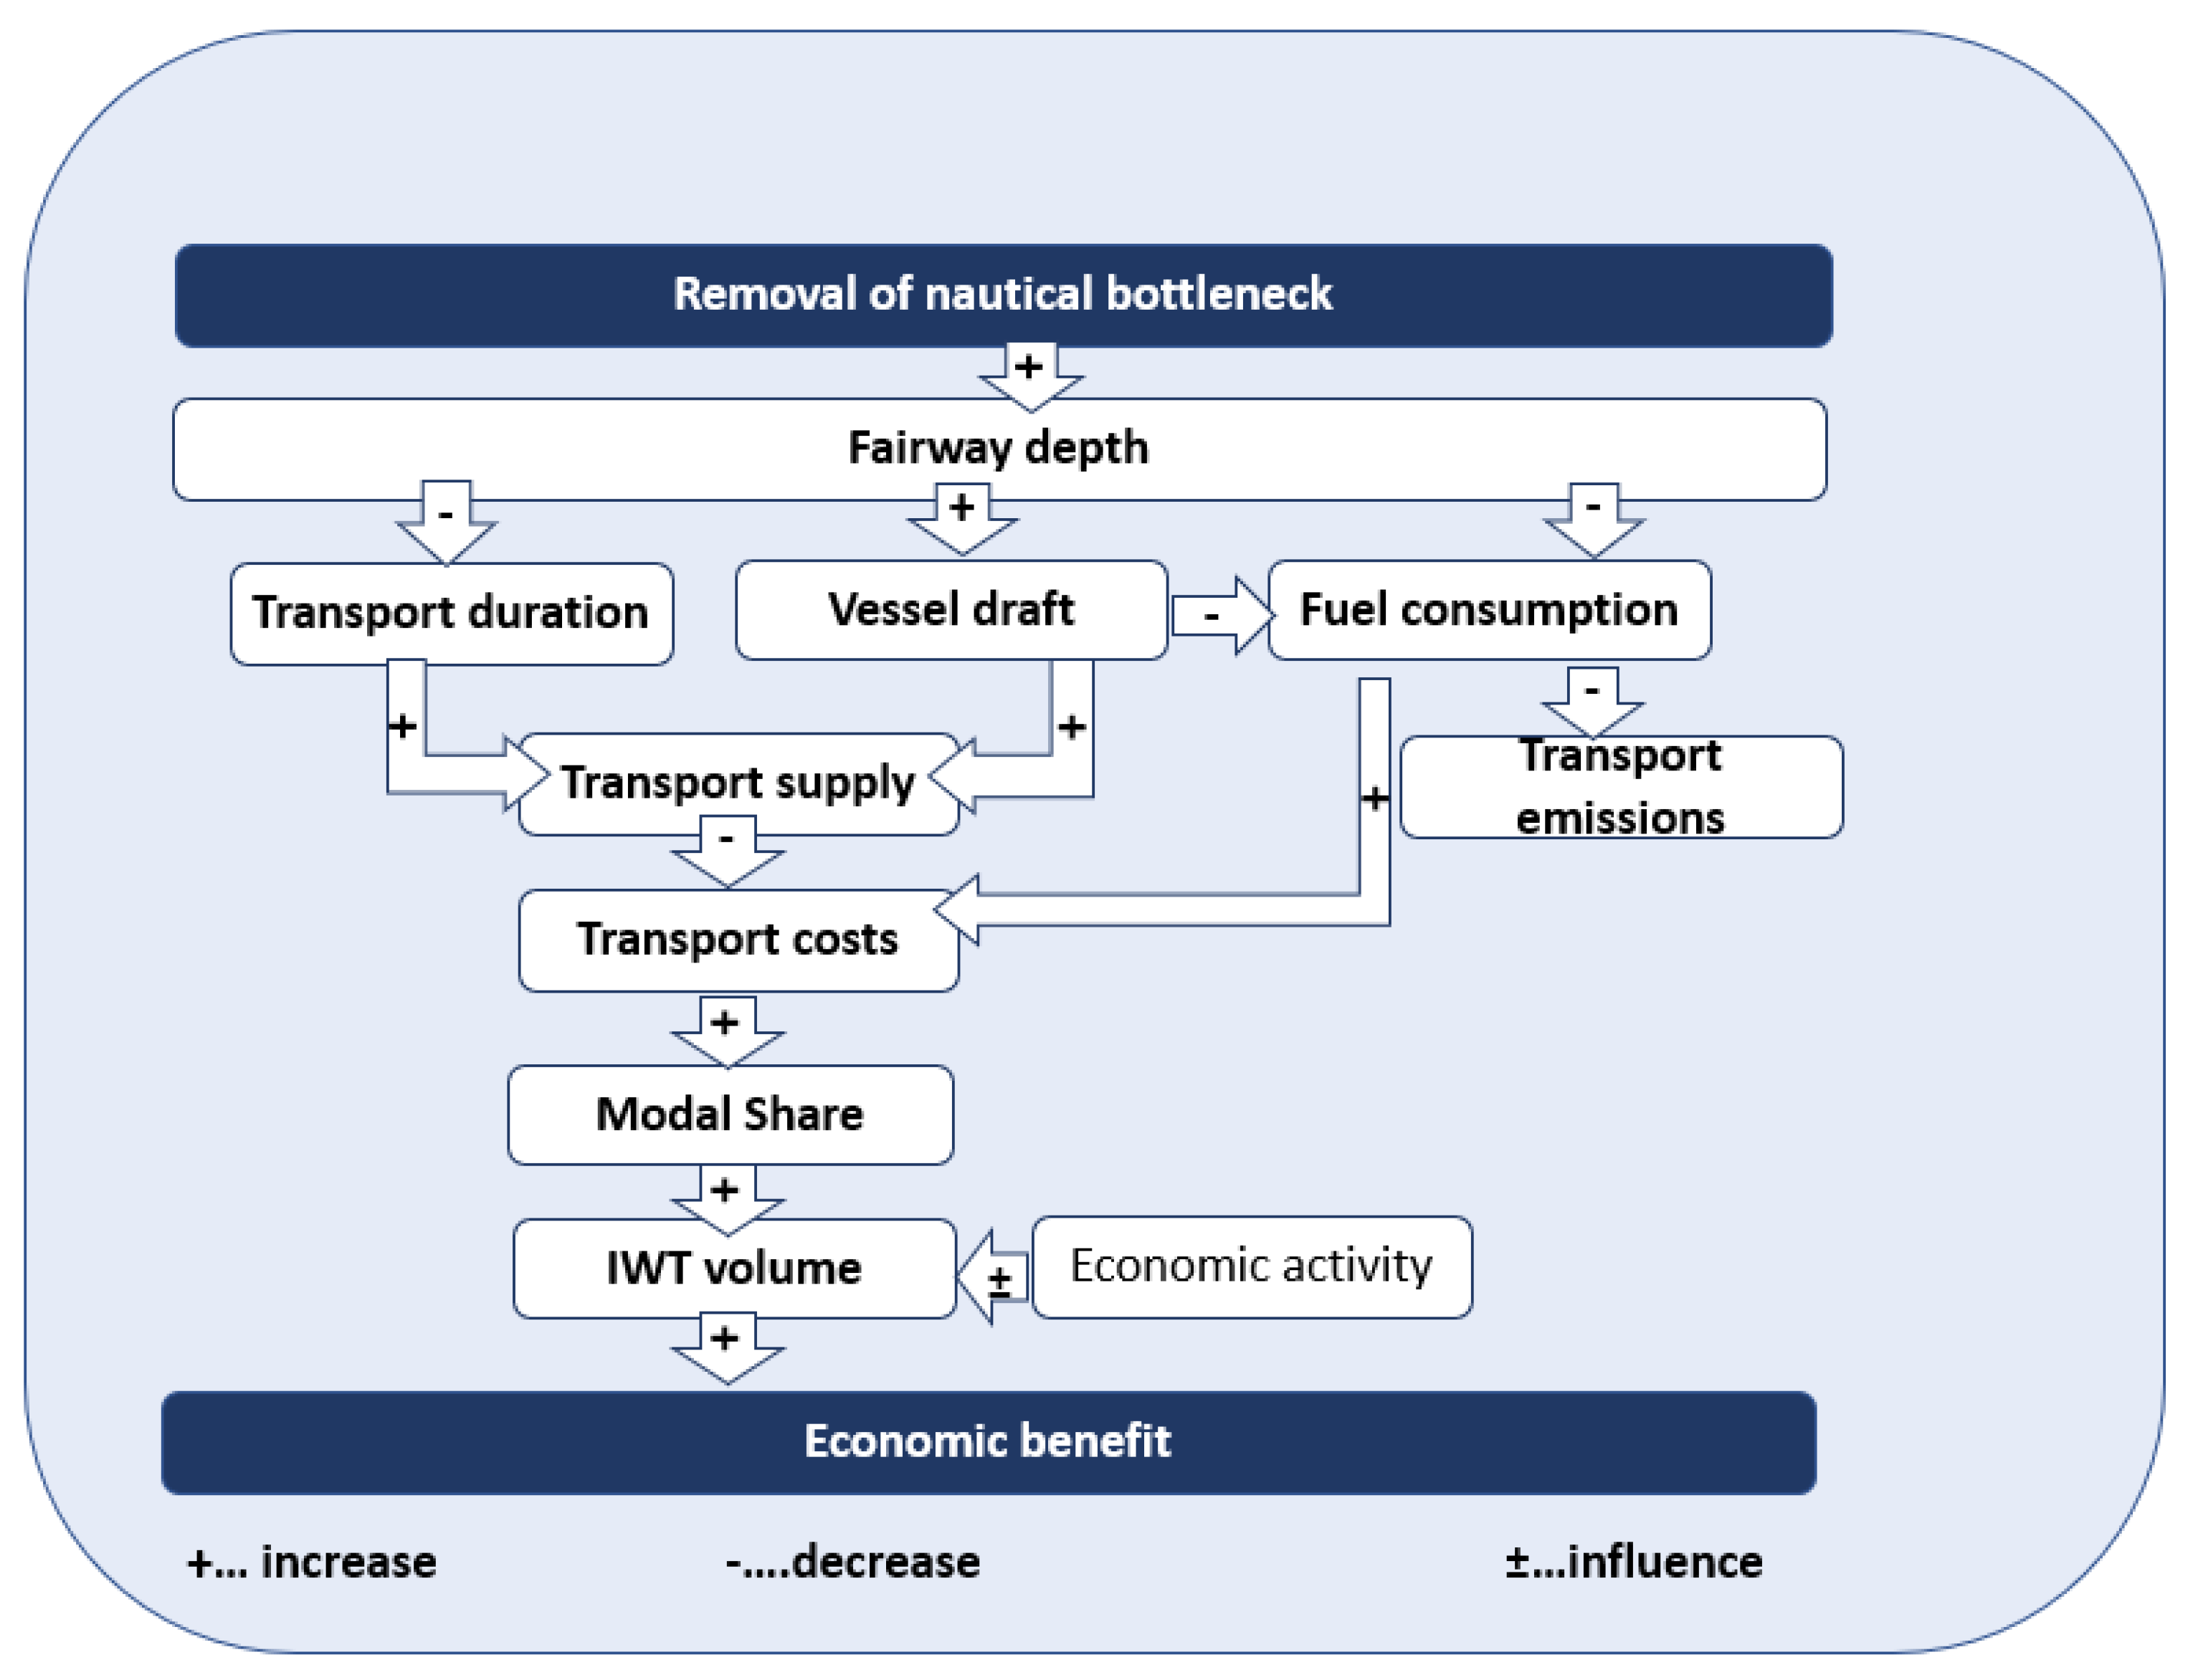
2. Theoretical Background: Development of the KPI Framework

Identifying relevant KPIs and quantifying them is crucial for assessing the economic benefits of a project. The identification of KPIs facilitates the understanding of the elements of the transport system underlying nautical bottlenecks and the interconnections between them. KPIs can be used to measure the benefits of resolving nautical bottlenecks, which are subsequently translated into quantified economic benefits [16]. However, identification is challenging as there is currently no framework for selecting appropriate KPIs for a project, and the measurement of KPIs may vary for each specific investment project [15]. This lack of standardization of KPI measurement can make it challenging to effectively identify and measure the performance indicators for a given project. The more such indicators there are, the more complex the economic evaluation becomes, as both the quantification of indicators and their interconnections need to be determined [18].
Duldner-Borca et al. [17] developed a KPI framework based on a systematic literature review which supports the understanding of the interconnections between key measures to describe the economic effects of resolving nautical bottlenecks. The basis of this KPI framework lies in nine KPIs that were discovered through the systematic literature research process. Main statements were extracted from the literature, allowing the identification of interconnections between the KPIs and their visualization within the framework, as shown in Figure 1.
The primary objective in addressing nautical bottlenecks is to enhance fairway depth. Following successful maintenance or rehabilitation efforts, the fairway depth on the Danube should be maintained at a minimum of 2.5 m [6]. A deeper fairway allows vessels to have a greater draft, enabling inland vessels to carry heavier loads—up to an additional 85 tonnes of cargo for every 10 cm increase in draft [9]. Furthermore, the overall transportation duration is reduced, as inland vessels can navigate more swiftly without being hindered by nautical bottlenecks [19].
The extent of the improvement in transportation time is contingent on whether the river is free-flowing or regulated. These two factors, namely transportation duration and vessel draft, are intertwined with an amplified overall transport capacity [20,21]. With each inland vessel having an augmented loading capacity and the decreased transportation duration, the total number of feasible trips with the existing fleet of vessels increases. This heightened transport capacity results in lower transport costs, as vessels can be utilized more efficiently, leading to a cost reduction per tonne of cargo transported [10].
Maintaining an adequate fairway depth also translates to reduced fuel costs, as inland vessels require less engine power to attain a given speed when the fairway depth meets the required standards [22]. The decrease in fuel costs directly contributes to an overall reduction in transportation expenses [21]. Lower transport costs have the potential to stimulate an upswing in transport demand and, consequently, a rise in modal share. The diminished financial burden on shipping companies enables them to offer more appealing transport services to customers [10].
An increased modal share contributes to a higher overall inland waterway transportation (IWT) volume—representing the total tonnage of cargo transported on inland waterways. This enhanced IWT volume, influenced in part by current economic activity, directly contributes to the economic advantages derived from addressing nautical bottlenecks. The increase in transported tonnes generates financial benefits for the inland navigation sector [8].
This paper aims to validate the framework and to prioritize the individual KPIs using expert interviews. The methodology used, results, and discussion will be presented in the next sections.

3. Research Approach

To validate the KPI-based framework, we used a qualitative research approach. This method allows an open discussion with experts from the field, in which the experts can share their personal assessment of the KPIs and their interconnections. Thus, problem-centred and semi-structured expert interviews according to Mayring [23] were carried out for collecting the information.
Problem-centred interviews are characterized by their open format, enabling the interviewee to provide responses without being limited to predefined answer choices. The approach of Mayring [23] allowed us to gain valuable insights into the individual’s personal perspective regarding the specific problem under investigation. Additionally, the interviews followed a semi-structured approach, meaning that there was an interview guideline in place to help maintain focus on the problem at hand [23]. Figure 2 summarizes the methodological approach of Mayring [23] used in this paper.
The interview guideline was divided into four parts. The first part included demographic questions, followed by framework validation questions in the second part (e.g., does a higher fairway depth lead to an increased vessel draft?). Subsequently, in the third part, the prioritization of the individual KPIs took place, where the KPIs could be ranked from 1 to 7 according to their importance. In the fourth and final part, we asked whether, according to the experts, there are any additional, non-economic values that should be considered when determining the economic benefits of the rehabilitation of nautical bottlenecks. The interviews were carried out between January and February 2023 with different experts in the field of inland navigation, originating from different Danube riparian countries. As we aimed to obtain different aspects and opinions, we interviewed experts from various fields (i.e., IWT operators, shipbuilding engineers) and countries of origin. As the answers of the experts were quite similar, despite their different countries of origin and IWT carriers, we decided to conduct not more than eleven interviews; the interview partners are listed in Table 1. The interviews were carried out virtually using MS Teams or in person.
The interviews were captured and subsequently transcribed. To analyse the interviews, we utilized the MAXQDA2020 software, which enables us to code the transcriptions. MAXQDA offers the option to extract the coded and summarized information from the transcriptions into an MS Excel file. This Excel file proved useful in conducting a qualitative content analysis based on the approach of Mayring [23]. The content analysis followed a summative approach, which was beneficial for making comparisons and deriving key statements. A category system was essential for evaluating the content. The interview guideline was organized into categories (i.e., question blocks), which allowed us to synthesize the crucial aspects of the expert interviews. These categories were employed for the category system in the content analysis and to structure the Section 4 of this paper.

4. Results and Discussion

In the following sub-sections, the contents of the expert interviews are analysed in summary form according to Mayring [23] and essential statements are extracted. Section 4.1. contains the validation of the KPIs determined by means of literature research and their interconnections, Section 4.2. presents the evaluation of the individual KPIs regarding their relevance for the calculation of the economic benefit of the rehabilitation of nautical bottlenecks, and Section 4.3. discusses other, non-economic KPIs that still need to be supplemented.

4.1. Validation of the KPI Framework

All experts interviewed considered the KPI fairway depth to be equally important for an economic evaluation of the rehabilitation of nautical bottlenecks and confirmed that the fairway depth generally increases because of the rehabilitation of bottlenecks (cf. IP 8, 2, 1, 5, 3). A direct goal in the rehabilitation of bottlenecks is the creation of a higher fairway depth to improve navigability on the inland waterway. On the Danube, a fairway depth of 2.5 m is prescribed; a fairway depth that is too shallow means that ships cannot be loaded at full capacity, or, in drastic cases, navigation must be stopped because a bottleneck is no longer passable (cf. IP 11). Maintenance measures, such as dredging, are temporarily equally effective at preserving a consistent fairway depth as permanent river engineering solutions. To eliminate a nautical bottleneck in the long term, river engineering measures are indispensable (cf. IP 6). Besides maintenance measures and river engineering measures, fairway depths are significantly influenced by meteorological water conditions (cf. IP 9). Nautical bottlenecks are particularly visible at low water levels (cf. IP 10). Maintenance measures and river engineering measures have a less positive effect on navigability when the water conditions on the inland waterway are unfavourable. This generally means that during periods of low water, navigability is negatively affected despite maintenance measures and river engineering measures (cf. IP 7). Moreover, IP 4 points out that the rehabilitation of nautical bottlenecks on the Danube and thus the increase in fairway depth improves the situation on the Danube regarding navigability to a certain extent, but hardly eliminates all challenges. For example, the width of the inland waterway plays an important role, as the width is limited to approx. 12 m by a lock in Germany. Furthermore, objects such as sunken barges constitute nautical bottlenecks that should not be overlooked (cf. IP 4).
According to the experts interviewed, the unloading depth of inland vessels is an essential KPI for the economic evaluation of the rehabilitation of nautical bottlenecks (cf. IP 3, 7, 8, 4, 9, 5). Nautical bottlenecks mean that vessels can be utilized less; i.e., their capacity can only be used to a limited extent, which is detrimental to the economic efficiency of transports (cf. IP 6). An unloading depth of 2.5 m is already sufficient for economic transport (cf. IP 11). Especially for inland vessels that navigate the entire Danube instead of short stretches, the unloading depth is an essential parameter, because the cargo is then limited by the unloading depth that is the shallowest nautical bottleneck to be passed (cf. IP 10). IP 2 points out that the type of goods transported is decisive for the relevance of the unloading depth. For goods with a low specific density, such as containers, the unloading depth is less important than for bulk goods, such as ores or coal, as bulk goods have a high specific density and thus require a higher unloading depth to be transported in an economically viable manner (cf. IP 2).
The KPI transport time brought divided opinions, especially regarding its relevance. According to the identified literature, nautical bottlenecks affect transport time as captains reduce speed when crossing nautical bottlenecks as significant amounts of power and fuel are required to reach maximum speed. In addition, captains generally navigate more cautiously as less space is available (cf. [8,22]). Some experts state that these effects do exist but are so marginal that they are hardly significant in practice (cf. IP 8 1, 3). IP 10, meanwhile, confirms the results of the literature research and adds that a fairway depth that is too high, i.e., high water for inland navigation, brings negative effects. Ideal navigation conditions prevail at medium water depth. IP 4 confirms that inland vessels can generally travel faster at higher fairway depths. At lower fairway depths, there is a suction effect when crossing, which increases as speed increases. In order not to sink further, it is particularly important here to navigate more slowly than usual (cf. IP 5). Regarding the relevance of the transport time, it is important to consider whether the transport takes place on the free-flowing or regulated Danube. On free-flowing stretches, a difference becomes noticeable due to the current. On the stretch between Gabcikovo (Slovakia) and Iron Gate 1 (Romania), saving up to one day in time is possible. On canalized lock stretches, such as that through Austria, the change in transport time is of little relevance due to the almost non-existent flow (cf. IP 9).
IP 6 points out another reason for a considerable increase in transport time. According to IP 6, inland vessels that pass serious nautical bottlenecks, such as in the area Zimnicea/Romania, whose location is presented in Figure 3, are forced to uncouple the barges transported on the motor cargo vessel and then transport them individually across the bottleneck. In the case of the bottleneck in Zimnicea, this takes between three and ten days, because depending on the congestion situation, waiting times occur, which extends the total transport time by whole days. In addition, the transport time can be extended if the bottleneck in Calarasi (Romania) becomes acute, because in this case, inland waterway vessels divert via the Borcea Arm in the direction of Constanta, which extends the transport distance by 100 km. This means a longer transport time.
Lightering, i.e., the transshipment of goods onto trucks or onto several barges to reduce the unloading depth of barges at low fairway depths, plays an important role in the transport time, as lightering can take one to two days (cf. IP 5, 11). In addition, the transport time is influenced if inland navigation is forced to stop operations due to a very low fairway depth (cf. IP 2).
The correlation between the rehabilitation of nautical bottlenecks and the fuel consumption of inland vessels was confirmed by the experts interviewed. However, the experts’ answers to the question regarding the relevance of fuel consumption for the economic evaluation of the rehabilitation of nautical bottlenecks differed greatly in some cases. Likewise, the decrease in transport emissions due to decreasing fuel consumption was confirmed. In principle, inland vessels need more fuel when crossing stretches with unfavourable fairway depths (cf. IP 9). Fuel consumption decreases after bottleneck rehabilitation, as inland vessels can generally navigate more efficiently at mid-water; moreover, inland vessels can take on more cargo at mid-water, which means that fuel consumption or transport emissions per tonne decreases (cf. IP 3, 10). Often, the overall fuel consumption increases because more cargo is transported. However, the increased load reduces fuel consumption per tonne (cf. IP 5, 6). Fuel costs account for about 30% of transport costs. In principle, fuel consumption depends on several factors, such as the depth of the fairway and the captain’s driving technique (cf. IP 7) or the design of the inland vessel or the engine used (cf. IP 11). In addition, the speed and resistance of the inland vessel are important variables that should not be disregarded when considering the KPI fuel consumption (cf. IP 4). IP 8 points out that fuel consumption or the relevance of fuel consumption is different for uphill and downhill navigation. More fuel is consumed when travelling uphill than when travelling downhill, as the current can be used when travelling downhill (cf. IP 8). According to IP 1 and 2, fuel consumption is only relevant when the nautical bottleneck is so severe that another transport vessel is needed for further transport. By addressing a nautical bottleneck, a reduction in fuel consumption can be achieved using fewer transport vessels.
The experts confirmed that a higher unloading depth of inland vessels and a shorter transport duration increase the KPI transport supply (cf. IP 3, 11, 5, 8, 9). Transport supply is understood as the total freight capacity availability on the inland waterway (cf. IP 1). A higher freight capacity availability arises because more cargo can be transported per inland waterway vessel due to a higher fairway depth (cf. IP 6) and due to a higher travel speed (cf. IP 7). However, a higher availability of cargo capacity will lead to a reduction in the freight rates, which makes the sector more attractive. Nevertheless, cargo capacity alone will not be sufficient to increase the number of users of inland waterway transport, as customers see the biggest challenge as the lack of reliability of the mode of transport (cf. IP 4). It is therefore first and foremost essential to increase the market, i.e., to win customers; only then will the higher availability of freight capacity bring advantages for the inland navigation operators. Currently, there is an oversupply of ships, which sometimes even means that inland navigation vessels must be discontinued (cf. IP 10).
The correlation between higher transport supply or freight capacity availability and falling transport prices was confirmed (cf. IP 5, 3, 1, 7, 8, 9). The affordability of transportation is attributed to both the greater availability of freight capacity and the reduced transport time, leading to lower personnel costs and reduced diesel consumption. Thus, if barges can be fully loaded, the transport price is lower than if the barges are partially loaded (cf. IP 6). If relatively few tonnes can be loaded due to low fairway depth, inland navigation operators sometimes charge customers with low-water surcharges, which increases the transport price (cf. IP 11). In principle, the more tonnes transported, the lower the transport price (cf. IP 4). According to IP 10, lower transport prices are hardly noticeable in the short term.
The increase in the KPI modal share through the remedying of nautical bottlenecks or ultimately by means of falling transport prices was largely confirmed (cf. IP 7, 5, 9, 4, 8). However, some experts noted that falling transport prices are only a factor of limited relevance. To increase the modal share, it is above all important to guarantee the security of supply or reliability of the mode of transport, which is often not the case today due to nautical bottlenecks (cf. IP 11, 6). Regarding reliability, IP 10 cites the example of Straubing (see Figure 3). The market between Hungary and Rotterdam has developed negatively due to the nautical bottleneck, and shippers are now increasingly using rail or truck (cf. IP 10). Furthermore, an increase in the modal share of inland navigation depends on the overall development of traffic (cf. IP 3). It may even be that the volume of goods transported by inland waterway increases, but the modal share decreases. The change in modal share is dependent on general economic performance and the overall transport industry development, which is why the KPI modal share is less suitable to show the benefit derived from the rehabilitation of nautical bottlenecks (cf. IP 1).
The interview partners considered the KPI transport volume to be much more important than the KPI modal share and confirmed that an increase in transport volume on inland waterways can result from the rehabilitation of nautical bottlenecks and the associated effects (e.g., increase in freight space availability, reduction in transport prices.) (cf. IP 6, 7, 8, 4, 9, 10). The current economic development and the attractiveness of the mode of transport for shippers (cf. IP 1, 2) must also be considered when analysing the increase in transport volume. Increasing the transport volume increases the economic benefit for the inland navigation sector; this connection was confirmed by all the experts interviewed.
In the last question from the question block “Validation of the KPI framework”, the experts were asked about KPIs that, in their opinion, should be added to the KPI framework. IP 3 mentioned the cost side regarding the rehabilitation of nautical bottlenecks. In addition to the market-related KPIs, it is essential to include cost-related KPIs, as the maintenance measures or river engineering measures needed for the rehabilitation of nautical bottlenecks reduce the economic benefit of the rehabilitation actions. Regarding the development of costs, it is important to distinguish between continuous maintenance, for example, through regular dredging, and permanent river engineering measures. While regular dredging causes continuous costs to compensate for the nautical bottleneck, river engineering measures cause one-off costs. According to IP 3, it is often economically advisable to invest in river engineering measures, as the measures pay off in the medium term. Accordingly, the KPI maintenance and rehabilitation costs was added to the KPI framework.
As a second additional KPI, the delivery service level was added, which reflects the reliability of inland waterway transports (cf. IP 1). Due to nautical bottlenecks, delays are frequent, especially during periods of low water. Delays sometimes affect the entire supply chain and have a negative impact on reliability (cf. IP 6). The often-low reliability of inland navigation results in customers tending to opt for other modes of transport, such as rail and truck. The experts interviewed are certain that higher reliability is essential for generating customers (cf. IP 6, 11, 4). A delivery service level of 90% would be sufficient to meet the reliability of the transport mode (cf. IP 1).
The KPIs identified through the literature research of Duldner-Borca et al. [17] are therefore correct according to the experts interviewed, and the correlations between the different KPIs match. In addition, two relevant KPIs were added—maintenance costs and the KPI delivery service level. The revised KPI framework is shown below in Figure 4.
Comparing the updated KPI framework to the original framework in Figure 1, a total of three changes were made, including two additions and the exclusion of one KPI. The delivery service level, which is intended to describe the reliability of the mode, was added as an important KPI. A higher fairway depth makes the inland waterway mode more reliable, so the delivery service level increases. A higher delivery service level increases the transport volume, as the inland waterway becomes more attractive for shippers due to increased reliability. In addition, the KPI maintenance and rehabilitation costs was added. This reflects the costs arising from the rehabilitation and maintenance of nautical bottlenecks. A higher fairway depth leads to increased costs, and costs in turn have a negative impact on the economic benefit of the rehabilitation of nautical bottlenecks. The KPI modal share was removed because, depending on the overall development of traffic, an increase in transport volume is not necessarily accompanied by an increase in the modal share. This means that the KPI modal share is not very meaningful regarding the economic evaluation of nautical bottlenecks and was thus excluded from the KPI framework.

4.2. Prioritization of KPIs According to Relevance for IWT

While validating the KPIs, the relevance of individual KPIs was discussed with the experts interviewed. The statements previously detailed in Section 4.1. already indicate tendencies in the relevance assessment of the individual KPIs. The evaluation itself was performed on a 7-point Likert scale, from 1 (not at all relevant) to 7 (very relevant), as illustrated in Table 2.
The average per KPI was calculated from the individual ratings of the interview partners. This average value served as the basis for prioritization. According to this, the three most important KPIs are the fairway depth (value: 6.5), followed by the unloading depth and transport costs (both value: 6.4). In the medium relevance range are the KPI transport volume (value: 5.8) and the KPI transport supply (value: 5.7), while the KPI fuel consumption (value: 4.5), transport duration (value: 4.1), and transport emissions (value: 3.3) are the least relevant for the economic evaluation of nautical bottlenecks according to the experts.

4.3. Supplemented, Non-Economic KPIs

In addition to the economic indicators, the actual water flow, i.e., the amount of water available in the river, is an important aspect regarding the rehabilitation of nautical bottlenecks. Nautical bottlenecks occur more frequently at low water, i.e., at low water flow. In most areas, however, the water flow is well above mean water flow, in some cases reaching high water flow. For the economic evaluation of the rehabilitation of nautical bottlenecks, it is quite relevant how often a bottleneck occurs or whether it exists permanently. This is because the more frequently it occurs, the greater the economic benefit of remediation is. Accordingly, the KPI availability of a water supply is included. The KPI “water availability” is already monitored by viadonau and expresses the percentage of the water supply that could be made available.
According to IP 4, ship design itself should be included as a factor in the economic evaluation of the rehabilitation of nautical bottlenecks. Vessels that are designed for the Danube as an inland waterway usually operate relatively efficiently even at lower fairway depths. Today, however, hardly any vessels are built; many vessels on the Danube are acquired second-hand and were originally built for the Rhine. Vessels built for voyages on the Rhine require a draft of 3.5 m for full utilization. A draft of 3.5 m is generally not feasible for the Danube and in particular not on sections with nautical bottlenecks. Therefore, less economical transport is carried out on the Danube. Thus, the ship design used plays a significant role in generating significant benefits from the rehabilitation of nautical bottlenecks.

5. Conclusions

This article intends to verify the applicability of a literature-derived KPI framework developed by Duldner-Borca et al. in 2023 [17] for determined the economic benefits of resolving nautical bottlenecks on inland water routes, i.e., on the Danube. This validation was achieved through 11 comprehensive qualitative expert interviews. Additionally, it aims to prioritize key performance indicators (KPIs) based on their significance in assessing the economic advantages of resolving nautical bottlenecks. The following KPIs were part of the initial KPI framework: fairway depth, transport duration, vessel draft, fuel consumption, transport emissions, transport supply, transport costs, modal share, and IWT volume. Through the expert interviews, we determined that the KPI modal share was of lesser significance in evaluating the benefits. Consequently, it was excluded from the framework, while the KPIs service level and costs of maintenance were introduced as additions. The service level reflects the reliability of the transport mode. Reliability is an important issue in inland navigation, as customers often choose other modes of transport rather than inland navigation due to a lack of reliability. By eliminating nautical bottlenecks, reliability is increased, which makes inland waterway transport more attractive for customers and can consequently lead to an increase in the transport volume of inland waterway transport.
The KPIs incorporated into the framework and their interconnections were accurately delineated considering the experts’ expertise. In terms of relevance, the KPIs fairway depth, unloading depth, and transport costs were rated as the most important, while the KPI transport emissions was rated as the least relevant.
This research provides both scientific and managerial implications. The successful validation of the KPI framework enhances our understanding of the intricate relationships and interconnections among factors influencing inland waterway transport (IWT) performance on the Danube. Researchers can build upon this framework to conduct further investigations and studies concerning inland waterways and transportation efficiency. Furthermore, the validation process lends credibility to the KPI framework, establishing it as a reliable and evidence-based tool for assessing the effects of resolving nautical bottlenecks in inland waterway systems. This increased credibility boosts confidence in the research findings and enhances their impact for the scientific community. Moreover, the validated KPI framework serves as a solid foundation for future research in the field of IWT and transportation. It can be utilized as a reference for designing experiments, gathering data, and evaluating the impacts of different interventions and enhancements in waterway infrastructure.
Considering managerial implications, utilizing the KPI framework, managers can gain the ability to pinpoint critical areas that require attention and allocate resources with precision. By prioritizing the rehabilitation of nautical bottlenecks and implementing targeted measures, managers can achieve significant enhancements in the utilization and overall performance of inland waterway transport. Furthermore, the KPI framework can become a facilitator of seamless communication and collaboration among diverse stakeholders, encompassing government agencies, private sector entities, and environmental organizations. With a shared language and objective metrics, stakeholders can evaluate and discuss the outcomes of potential projects and initiatives in a cohesive manner. Subsequently, enriched with insights from the KPI framework on the impacts of resolving nautical bottlenecks, managers can be empowered to foster sustainable development within inland waterway transport. This involves promoting eco-friendly transportation methods, reducing emissions, and optimizing the responsible use of natural resources.
Now that we have successfully validated the KPI framework for inland waterway transport, several research possibilities arise. Firstly, further studies can focus on quantifying the specific impacts of resolving nautical bottlenecks and implementing measures based on the framework. Comparative analysis can be conducted to assess the effectiveness of different strategies in optimizing inland waterway transport. Long-term performance assessment allows for the evaluation of sustained impacts and challenges over time. Overall, further research after the validation of the KPI framework can deepen our understanding of the potential benefits of resolving nautical bottlenecks and provide valuable guidance for optimizing the sustainable development and utilization of inland waterways.

Author Contributions

Conceptualization, B.D.-B.; methodology, B.D.-B.; software, B.D.-B.; validation, B.D.-B.; formal analysis, B.D.-B., E.v.H. and L.-M.P.-E.; investigation B.D.-B.; resources, B.D.-B.; writing—original draft preparation, B.D.-B.; writing—review and editing, B.D.-B., E.v.H. and L.-M.P.-E.; visualization, B.D.-B.; supervision, E.v.H. and L.-M.P.-E.; project administration, L.-M.P.-E.; funding acquisition, B.D.-B. and L.-M.P.-E. All authors have read and agreed to the published version of the manuscript.

Funding

This research is part of the research cooperation “REWWay—Research and Education in Inland Waterway Transport” funded by viadonau (Austria).

Institutional Review Board Statement

Not applicable.

Informed Consent Statement

Not applicable.

Data Availability Statement

Data sharing is not applicable to this article.

Conflicts of Interest

The authors declare no conflict of interest.

References

  1. European Commission. Communication from the Commission to the European Parliament, the European Council, the Council, the European Economic and Social Comittee and the Comittee of the Regions: The European Green Deal. 2019. Available online: https://eur-lex.europa.eu/resource.html?uri=cellar:b828d165-1c22-11ea-8c1f-01aa75ed71a1.0002.02/DOC_1&format=PDF (accessed on 15 March 2023).
  2. Greene, S.; Lewis, A. Global Logistics Emissions Council Framework for Logistics Emissions Accounting and Reporting, Amsterdam. 2019. Available online: https://www.feport.eu/images/downloads/glec-framework-20.pdf (accessed on 8 August 2022).
  3. Hofbauer, F.; Putz, L.-M. External costs in inland waterway transport: An analysis of external cost categories and calculation methods. Sustainability 2020, 12, 5874. [Google Scholar] [CrossRef]
  4. Beil, D.; Putz-Egger, L.-M. Modal shift measures to increase the use of eco-friendly transport modes: A literature review. In Transport Research Arena (TRA) Conference; Elsevier: Amsterdam, The Netherlands, 2023. [Google Scholar]
  5. Fastenbauer, M.; Filz, F.; Grath, B.; Hartl, S.; Hartl, T.; Herkel, A.; Kneifel, J.; Kusebauch, G.; Maierbrugger, G.; Bettina Matzner, B.; et al. Manual on Danube Navigation, 4th ed.; Via Donau: Wien, Austria, 2019. [Google Scholar]
  6. Hoffmann, M.; Haselbauer, K.; Haberl, A.; Blab, R.; Simoner, M.; Hartl, T. Performance based Waterway Management—Transport Market and Competitiveness. In Life-Cycle of Structural Systems: Design, Assessment, Maintenance and Management; Furuta, H., Frangopol, D.M., Akiyama, M., Eds.; CRC Press: Boca Raton, FL, USA, 2014; pp. 365–366. ISBN 9781138001206. [Google Scholar]
  7. Beuthe, M.; Jourquin, B.; Urbain, N.; Lingemann, I.; Ubbels, B. Climate Change Impacts on Transport on the Rhine and Danube: A multimodal approach. Transp. Res. Part D Transp. Environ. 2014, 27, 6–11. [Google Scholar] [CrossRef]
  8. Haselbauer, K.; Haberl, A.; Hoffmann, M.; Blab, R.; Simoner, M.; Hartl, T. Performance based Waterway Management—Maintenance Strategies and LCC Optimization of Measures. In Life-Cycle of Structural Systems: Design, Assessment, Maintenance and Management; Furuta, H., Frangopol, D.M., Akiyama, M., Eds.; CRC Press: Boca Raton, FL, USA, 2014; pp. 364–365. ISBN 9781138001206. [Google Scholar]
  9. Riquelme-Solar, M.; van Slobbe, E.; Werners, S.E. Adaptation Turning Points on Inland Waterway Transport in the Rhine River. J. Water Clim. Chang. 2015, 6, 670–682. [Google Scholar] [CrossRef]
  10. Hekkenberg, R.G. Technological Challenges and Developments in European Inland Waterway Transport. In Transport of Water versus Transport over Water; Ocampo-Martinez, C., Negenborn, R.R., Eds.; Springer International Publishing: Cham, Switzerland, 2015; pp. 297–313. ISBN 978-3-319-16132-7. [Google Scholar]
  11. Mahmoudzadeh, A.; Khodakarami, M.; Ma, C.; Mitchell, K.N.; Wang, X.B.; Zhang, Y. Waterway maintenance budget allocation in a multimodal network. Transp. Res. Part E Logist. Transp. Rev. 2021, 146, 102215. [Google Scholar] [CrossRef]
  12. European Commission. Guide to Cost-Benefit Analysis of Investment Projects: Economic Appraisal Tool for Cohesion Policy 2014–2020; European Commission: Bruxelles, Belgium, 2014; Available online: https://ec.europa.eu/regional_policy/sources/docgener/studies/pdf/cba_guide.pdf (accessed on 27 March 2023).
  13. Ustaoglu, E.; Williams, B. Cost-Benefit Evaluation Tools on the Impacts of Transport Infrastructure Projects on Urban Form and Development. In Smart Urban Development; Bobek, V., Ed.; IntechOpen: London, UK, 2020; ISBN 978-1-78985-041-3. [Google Scholar]
  14. Siciliano, G.; Barontini, F.; Islam, D.M.Z.; Zunder, T.H.; Mahler, S.; Grossoni, I. Adapted cost-benefit analysis methodology for innovative railway services. Eur. Transp. Res. Rev. 2016, 8, 23. [Google Scholar] [CrossRef]
  15. Wang, Y.; Bilegan, I.C.; Crainic, T.G.; Artiba, A. Performance Indicators for Planning Intermodal Barge Transportation Systems. Transp. Res. Procedia 2014, 3, 621–630. [Google Scholar] [CrossRef]
  16. Sierpiński, G.; Macioszek, E. Decision Support Methods in Modern Transportation Systems and Networks; Springer International Publishing: Cham, Switzerland, 2021; ISBN 978-3-030-71770-4. [Google Scholar]
  17. Duldner-Borca, B.; van Hassel, E.; Putz-Egger, L.-M. Understanding the effects of resolving nautical bottlenecks on the Danube: A KPI-based conceptual framework. Eur. Transp. Res. Rev. 2023, 15, 23. [Google Scholar] [CrossRef]
  18. Li, Z.-C.; Wang, M.-R.; Fu, X. Strategic Planning of Inland River Ports under Different Market Structures: Coordinated vs. independent operating regime. Transp. Res. Part E Logist. Transp. Rev. 2021, 156, 102547. [Google Scholar] [CrossRef]
  19. Du, Q.; Kim, A.M.; Zheng, Y. Modeling Multimodal Freight Transportation Dcenarios in Northern Canada under Climate Change Impacts. Res. Transp. Bus. Manag. 2017, 23, 86–96. [Google Scholar] [CrossRef]
  20. Jonkeren, O.; Rietveld, P.; van Ommeren, J.; Te Linde, A. Climate Change and Economic Consequences for Inland Waterway Transport in Europe. Reg. Environ. Chang. 2013, 14, 953–965. [Google Scholar] [CrossRef]
  21. Meißner, D.; Klein, B.; Ionita, M. Development of a Monthly to Seasonal Forecast Framework Tailored to Inland Waterway Transport in Central Europe. Hydrol. Earth Syst. Sci. 2017, 21, 6401–6423. [Google Scholar] [CrossRef]
  22. Hekkenberg, R.G.; van Dorsser, C.; Schweighofer, J. Modelling sailing time and cost for inland waterway transport. Eur. J. Transp. Infrastruct. Res. 2017, 17, 508–529. [Google Scholar] [CrossRef]
  23. Mayring, P. Qualitative Content Analysis: Theoretical Foundations, Basic Procedures and Software Solutions; Social Science Open Access Repository: Berlin, Germany, 2014. [Google Scholar]
Figure 1. Framework based on the identified literature [17].
Sustainability 15 16742 g001
Figure 2. Methodological approach of this paper (according to Mayring [23]).
Sustainability 15 16742 g002
Figure 3. Course of the Danube with important ports [5].
Sustainability 15 16742 g003
Figure 4. Updated KPI framework.
Sustainability 15 16742 g004
Table 1. Interviewed partners with position and country.
Interview Partner (IP)PositionCountry
Interview partner 1 (IP1)Head of Division W2 ShippingAustria
Interview partner 2 (IP2)Senior Expert in Waterway ManagementAustria
Interview partner 3 (IP3)Team Leader River Engineering ProjectAustria
Interview partner 4 (IP4)Naval architectSerbia
Interview partner 5 (IP5)CEO—company 1Austria
Interview partner 6 (IP6)External consultantRomania
Interview partner 7 (IP7)Head of the European Programmes and Projects DepartmentBulgaria
Interview partner 8 (IP8)Officer in the WSC Unit in Waterway PlanningGermany
Interview partner 9 (IP9)CEO—company 2Austria
Interview partner 10 (IP10)Fleet managerAustria
Interview partner 11 (IP11)CEOHungary
Table 2. Prioritization of individual KPIs.
Interview Partner No.1234567891011AverageRanking
KPI fairway depth777577477776.51
KPI vessel draft777777375676.42
KPI transport costs777547667776.42
KPI transport volume IWT666546656775.83
KPI transport supply77454754-775.74
KPI fuel consumption335627444754.55
KPI transport duration3335375273-4.16
KPI transport emissions115-2 445353.37
Disclaimer/Publisher’s Note: The statements, opinions and data contained in all publications are solely those of the individual author(s) and contributor(s) and not of MDPI and/or the editor(s). MDPI and/or the editor(s) disclaim responsibility for any injury to people or property resulting from any ideas, methods, instructions or products referred to in the content.

