

Modeling Management-Relevant Urban Forest Stand Characteristics to Optimize Carbon Storage and Sequestration

1
School of Environmental Sustainability, Loyola University Chicago, Chicago, IL 60660, USA
2
Office of Sustainability and Climate, USDA Forest Service, St. Paul, MN 55108, USA
*
Author to whom correspondence should be addressed.
Forests 2023, 14(11), 2207; https://doi.org/10.3390/f14112207
Submission received: 20 October 2023
/
Revised: 4 November 2023
/
Accepted: 6 November 2023
/
Published: 7 November 2023
(This article belongs to the Special Issue Urban Green Infrastructure and Urban Landscape Ecology)
Abstract
:Urban forests are an essential part of adaptation and mitigation solutions for climate change. To understand the relationship between carbon storage, sequestration, and stand density in the most heavily-managed aspect of the urban forest—street trees—we modified the parameters and algorithms of a rural forest dynamics model, the perfect plasticity approximation (PPA), to reflect urban street tree conditions. The main changes in the new street tree PPA are the maintenance of a prescribed stand density via management of recruitment, the possibility of crown-roof overlap, and increased mortality rates. Using the street tree PPA, we explored overall productivity, crown allometry relative to stem diameter, and mortality rate to test each mechanism’s impact on urban street tree carbon storage and sequestration across a gradient of prescribed stand density, with the goal of finding conditions in which street tree carbon storage and sequestration are optimized. We compared the qualitative trends in storage from the street tree PPA to those found in the U.S. Forest Service’s Urban Forest Inventory Analysis data. We found that carbon storage and sequestration increase with prescribed density up to a point where carbon storage and sequestration saturate. Optimized carbon storage and sequestration result from a stand with high productivity, maximized crown allometry relative to stem diameter, and a low mortality rate. These insights can be used to inform urban street tree maintenance strategies that effectively increase carbon storage and sequestration within a given city, such as focusing afforestation campaigns on adequate areas with the lowest street tree densities.
1. Introduction
Trees are commonly planted throughout cities and towns along streets, in parking lots, in parks, and in yards. These city trees, along with naturally-occurring trees in urban areas, are collectively known as the urban forest [1,2,3,4]. The urban forest provides numerous beneficial ecosystem services to the communities surrounding it, including air pollution reduction, the absorption of stormwater, the mitigation of heat island effects, and mental health improvements [1,5]. In addition to these services, urban trees also sequester and store carbon as they grow, contributing to reductions in atmospheric carbon dioxide. Carbon storage and sequestration are important contributors to climate change mitigation and adaptation [6,7].
The canopy cover of urban forests accounts for approximately 35% of the land surface in U.S. cities [8], and on average they sequester 25.6 million tonnes C year−1 (SE = 1.0 million) and store 643 million tonnes C (SE = 23.8 million) [1]. Although these large numbers are expected to increase as the proportion of urban land in the U.S. grows from 3.1% in 2000 to an estimated 8.1% by 2050, such growth may come via the displacement of existing carbon storage [9]. Depending on the magnitude of the loss and the strategies employed to establish new urban forests, the net result in terms of atmospheric carbon dioxide may be negative, neutral, or positive. The goal of this research is to understand the impacts of tree planting density in order to optimize the carbon sequestration and storage of both existing and newly established urban forests, with a focus on the aspect of the urban forest most clearly within the purview of municipal management: street trees.
Street trees are unique among urban forest trees, as they are municipally managed, rather than controlled by residential or commercial owners. Their location, spacing, and growing conditions can be specifically chosen and regulated to improve ecosystem service delivery if a city chose to do so. Despite only making up a relatively small percentage of the overall urban forest by number, street trees are often planted with plenty of space to expand into, thus allowing them to grow large and comprise a high proportion of the urban forest’s total canopy area. In Chicago, McPherson et al. [10] found that street trees made up only 10% of the city’s total tree population, but, due to large crown sizes, they contributed 24% of the total leaf surface area. The large crowns of street trees also provide shade in warm months and reduction in wind in cold months, which lowers household energy consumption and costs [5,10,11]. The presence of street trees also increases the property value of the homes surrounding it by, in some cases, thousands of dollars [12]. The large crowns of street trees can also store and sequester a sizeable portion of an urban forest’s carbon. Carbon storage and sequestration are two ecosystem services that are especially important in regard to combatting climate change and have the potential to increase with strategized street tree management. Although the relationship between stand density and carbon storage and sequestration has not been extensively studied in urban areas [13], stand density appears to have some impact on the carbon sequestration and storage of forests outside of urban population centers [14,15]. As may be expected due to the conflation between age and density, the results from experiments in mixed-age stands vary considerably in regard to the relationship between density and carbon storage [16,17,18]. In contrast, the more mechanistically insightful results of experiments with even-aged stands appear to be in better agreement. The results of these even-aged studies show a generally positive relationship between density and carbon storage and sequestration: as stand density increases, stand-level carbon storage tends to increase as well [19,20,21,22]. Despite this relationship, there are tradeoffs associated with maximizing density for carbon, including higher susceptibility to fire, pests, diseases, and drought [23,24,25,26,27]. With more trees planted closer together, carbon sequestration and storage may be increased, but the higher density allows easier spread of fire, insects, and pathogens between individual trees [24,25]. Additionally, a denser forest stand competes more strongly for resources like water, which leaves them at higher risk during periods of low rainfall [23,25]. Tradeoffs such as these are important to consider in order to optimize—rather than maximize—density for carbon sequestration and storage.
Relevant Similarities and Differences between Urban Forests and Rural Forests
All of the relationships between density, carbon sequestration, and carbon storage described above derive from forests that are remote from urban population centers. The unique and highly human-managed conditions in which urban street trees grow create key differences between various aspects of urban and rural forests, including growth rates, mortality patterns, and density [13,28]. First, mature urban street trees appear to have higher growth rates than rural trees, potentially as a result of higher light availability and carbon dioxide levels in open-grown city conditions [13]. Second, urban street trees appear to have much higher mortality rates than rural forest trees once they reach the sapling stage [13,28]. The pattern of mortality also differs between the two, as rural trees typically experience decreasing mortality rates with increasing size or age, whereas urban street trees appear to experience higher mortality rates at both small and large sizes relative to intermediate sizes [13]. High mortality rates at both young and old ages in urban street trees are likely a result of the stressful conditions of urban environments. Young, newly planted trees must establish roots in compacted soil with limited underground space and water availability. As street trees grow larger, their risks for mortality shift toward encountering obstacles such as buildings and power lines, as well as environmental threats such as storm damage, pests, diseases, and anthropogenic removal due to safety concerns or construction projects. Older, larger street trees are at an increased risk of removal by the city, as they present more potential for interference with infrastructure or harm to city residents or property.
Street trees are typically planted in cities and towns in a way that is thought to be most aesthetically pleasing—often as rows of all one species or several different species evenly distributed according to some locally regulated standard. This standard is usually determined by the estimated mature crown size of the trees being planted or by an aesthetically pleasing design rule, such as planting one tree in front of every building. These planting standards are developed and implemented at the city level, which means that the spacing of trees can vary from one city to another. For example, the city of Chicago requires that trees along parkways and in parking lots must be placed no less than 25 linear feet apart [29], whereas Oakland, California regulates the tree spacing based on the species’ predicted mature canopy size, so spacing can range from 20 to 35 feet apart and there should be at least one tree per lot [30]. The primary concern is that the trees have enough space to grow uniformly. The growing conditions that may increase carbon sequestration and storage, such as density, were not taken into account in the planning of the urban forest. Carbon sequestration and storage may have the potential to increase if street trees within the urban forest are planted with factors such as density in mind.
The model developed in this study offers an interesting new perspective in which we can approximate future ecosystem services across a range of growing conditions for street trees rather than only quantifying the values of the current state of an urban forest. This type of model allows urban forest managers to adapt management practices to promote the development of an urban street tree stand that produces the most desirable future outcomes in terms of ecosystem service delivery.
2. Materials and Methods
To determine the relationship between urban street tree density and carbon sequestration and storage, we modified the perfect plasticity approximation (PPA) model of forest structure and dynamics [31] to suit urban growing conditions. The PPA scales up individual-level demographic parameters (i.e., growth rates, mortality rates, and fecundity rates) via allometry and the space-filling characteristics of forests to predict future characteristics of a rural forest. The scaling is spatially implicit. By deriving demographic rates from forest inventory data, the PPA is adaptable to any rural forest. Given a set of parameters, the model can be used to simulate and predict how the trees of the stand will grow and interact over time, providing insights about forest structure and composition. Given its favorable balance between simplicity and realism, the PPA is widely used [32,33,34,35,36,37,38,39,40,41,42,43,44,45,46,47,48].
Here, the PPA is the basis for “in silico” simulation experiments involving urban street tree planting densities. The model incorporates urban tree growth rates, mortality rates, allometry, and crown interactions. Together, the information provided by these parameters is used in simulation experiments to track the development of the urban street trees from saplings to mature trees under the assumption that, unlike natural regeneration in a rural forest, urban managers take control of regeneration after mortality events.
2.1. Background: The Rural PPA
The rural PPA simulation approximates the seasonal cycle of a forest: each year trees grow, die, and reproduce during the growing season. The state of the forest at the end of one growing season is the state of the forest at the beginning of the next growing season. In each cycle, the following parameters are calculated on both the individual and stand levels: Z*, carbon sequestration and storage, the number of new seedlings produced, tree mortality, and the growth of the stem diameter, height, and crown area of each tree. Z* is a context-dependent height that separates individuals that receive direct sunlight, which are classed in the canopy, versus those that grow in the shade, which are classed in the understory [49]. This value changes as the trees in the stand grow and fill the habitat area. Next, carbon storage is found by determining the total dry-weight biomass of each individual tree based on stem diameter and species-specific allometric parameters. Carbon sequestration is simply the new carbon storage minus the previous year’s carbon storage. New seedlings are added to the understory each year, and their number is proportional to the abundance of each species in the stand. Mortality rates are dependent on the canopy status, as the smaller understory trees have a higher probability of dying in a given year than the established canopy trees in the sun. Finally, each tree must grow its stem diameter, height, and crown area. Stem diameter growth is a function of the sunlit crown area of a tree, as trees with more sunlit, productive crowns create more biomass and therefore a greater increase in stem diameter. The new diameter is used to calculate the corresponding new height of each tree. Lastly, both the sunlit and shaded crown areas grow according to the methods and parameters found in Purves et al. [49]. The simulated states at the end of a given year are then used as the starting values of the next year and the entire process repeats.
2.2. Modifying the Rural PPA for Urban Street Trees
Although much of the rural model continues to work identically in the urban street tree modification, there are three key areas where major changes are required: fecundity, roof interference, and mortality. The process in which regeneration is determined in the rural forest model no longer applies in the urban street tree version. Whereas naturally growing trees reproduce and create new seedlings relative to the species abundance within the stand, urban trees along streets and in parks and yards are closely managed and do not regenerate via their own reproductive effort. Instead, new trees in these managed urban areas are planted at a set density, often in the place of a tree that has recently died and been removed. This is reflected in the urban model—the number of trees that die in one timestep is the same as the number of new saplings that are planted. The density is thus prescribed and remains constant over time. Rather than beginning as tiny seedlings, the new trees enter the stand at a larger size reflective of planting sizes of trees in urban areas, with a 5 cm diameter (sd = 2.5). Although urban forests also include naturally occurring trees, the regeneration calculations, as well as other areas of the urban street tree PPA, focus primarily on the dynamics of the planted and regularly maintained urban street trees.
The second change required to modify the rural forest PPA to an urban street tree model is to introduce buildings. This is completed by creating a new “roof area” in which the crown can grow once conditions are met. This roof area is additional sunlit growing area that is added to the ground habitat area. Two new parameters are set for the urban street tree stand: the distance from the stems to the buildings and the height of the buildings. Once a tree has a crown area that is taller than the roof height and a crown radius that is larger than the distance from the stem to the building, that tree has a “roof crown area”. All crown area that is classified as “roof” is sunlit, on the assumption that there will be no overlap or shading of crowns over the roof. It is also assumed that each crown is adjacent to one and only one roof. Roof crown area is added into the calculations of carbon storage and sequestration so that the entire tree is represented.
Finally, mortality rates of mature street trees within urban forests are significantly higher than those of mature trees growing in a rural forest [13], likely as a result of the harsh conditions found in the urban environment. To reflect this in the model, the urban modification uses mortality rates that are three times larger than those used in the rural-PPA model from Purves et al. [32]. The choice to multiply both the canopy and understory mortality rates by three in the urban model is based on the differences between the Purves et al. [32] rural forest rates and the urban rates from Smith et al. [13], which shows the urban values as approximately three times larger. For example, Acer rubrum, the species used in the following experiment, has a rural mortality rate of 0.0604 in the understory and 0.0128 in the canopy [32] on hydric soil, while its urban mortality rate is 2.86 ± 0.62 (% stems yr−1) [13]. Further details about the model and equations used can be found in the Appendix A, Appendix B, Appendix C and Appendix D.
2.3. Empirical Tuning of Crown Area to Stem Diameter Allometry in Chicago
We used observations of stand density and crown area cover in the urban landscape of Chicago to adjust the rural crown area to stem diameter allometry for use in an urban setting. We implemented ArcGIS Pro software (version 2.9.4; Esri Inc., Redlands, CA, USA) [50] to measure real urban crown areas from satellite images, then ran the urban street tree PPA at the same densities to generate the corresponding predicted crown area values.
Through this comparison, we found that increasing the species-specific maximum potential crown radius parameters by a factor of 1.78 from their rural forest values [49] best fit the urban data. These alterations are reflected in the following experiment. Appendix C provides a detailed procedure and analysis of this subsection.
2.4. Factorial Experiment
We designed a full factorial simulation experiment to test how three mechanisms influence the relationship between carbon storage, carbon sequestration, and density. In this experiment, (1) overall productivity, (2) crown allometry relative to the stem diameter, and (3) mortality rate were implemented either at their baseline values or at double or half their baseline values to provide qualitative insights into their influences. Baseline values for each of the three mechanisms were sourced from the literature. First, overall productivity is approximated via wood net primary productivity (NPP). At a baseline level, wood NPP is 0.13 kg C m−1 yr−1 [51], and the artificially elevated value is twice the baseline, 0.26 kg C m−1 yr−1. Second, we altered the crown allometry. We used both the baseline value, which reflects the adjustments determined from the GIS tuning exercise, and a halving of the baseline. [49]. Finally, we doubled the baseline mortality rate by multiplying both the understory and canopy mortality rates by two [32]. All eight combinations of these values were run through ten replicates of a 100-year simulation across an exponential gradient of prescribed densities that spans those observed in cities: 10, 20, 40, 80, 160, 320, and 640 stems per hectare. The average size of the initial trees in the stand is a set parameter with a given standard deviation, so the model randomly determines the starting size of trees. The carbon storage and sequestration of the stand was stored at four points for each prescribed density: years 12, 25, 50, and 100. Every simulation used a single species, Acer rubrum, in order to control for any species-related differences that might influence the results and obscure the impact of prescribed density. Acer rubrum (red maple) was chosen due to its unusually wide adaptability as a species [52]. Overall, we ran 560 individual simulations (2 productivity levels × 2 crown allometry levels × 2 mortality levels × 7 densities × 10 replicates = 560) for 100 years each.
Within each of the eight factorial treatments, there was some combination of density and time for which storage or sequestration were maximized. We implemented a one-way analysis of variance (ANOVA) test to determine which other combinations of density and year were not statistically significantly different from a given maximum. ANOVA tests compare the within-group and between-group variability in a response to determine the probability of collecting a given set of data, assuming there are no true differences in the means between the groups. If that probability (p-value) is low, it indicates there may be a true difference between the means of the groups. The levels of the ANOVA consisted of the 28 combinations of density and year at which the carbon storage or sequestration value was calculated (7 densities × 4 year points = 28 levels). The ANOVA indicated that some treatments (i.e., combinations of density and year) were statistically significantly different but did not identify which combinations those were. We used the Tukey honest significant difference (HSD) post hoc test to identify which treatments were or were not statistically significantly different from each other. We then recorded the treatments with the highest storage or sequestration values that were not statistically significantly different from each other.
2.5. Urban Forest Inventory Analysis Data
We used data from the Forest Service’s Urban Forest Inventory Analysis (FIA) (U.S. Department of Agriculture, Forest Service 2021) to qualitatively compare the relationships found in the urban street tree PPA simulation experiment to real-world trends. The urban FIA database was sourced from ten U.S. cities and includes a wide range of information about each tree, such as diameter, height, and species. In order to create analogous plots to those of the urban street tree PPA experiments, we calculated the density and carbon storage of each plot in the urban FIA database.
We found the density of the plots by dividing the total number of trees within a plot by the plot area in hectares. All urban FIA plots are circular with an area of 0.0672 hectares, and typically include several types of urban trees. For example, a plot that includes a street tree will most likely also include trees in yards or parks, as well as the open space surrounding them. Plots also often include urban natural areas, so the density values of each plot best reflect the overall density of the area, rather than only street tree density. We used the same methods from the urban street tree PPA to calculate the carbon storage of the urban FIA data in kg/m2.
Due to the nearly universal lack of sufficiently repeated measurements across the urban FIA plots, we were unable to calculate carbon sequestration. To avoid pseudo replication, we omitted the limited number of repeated measurements that do exist from the graphs of carbon storage versus density.
The trend found in the results of the urban street tree PPA simulations as well as several of the urban FIA cities was that carbon storage increases at low densities up until a point where the storage saturates as density continues to increase. We have named this point the “optimization point” (Figure 1).
Urban forest stands vary in both the values at which carbon storage and sequestration saturate and the optimization point at which this saturation begins. The optimization point coincides with canopy closure and is influenced by stand characteristics, as discussed in the following sections.
3. Results
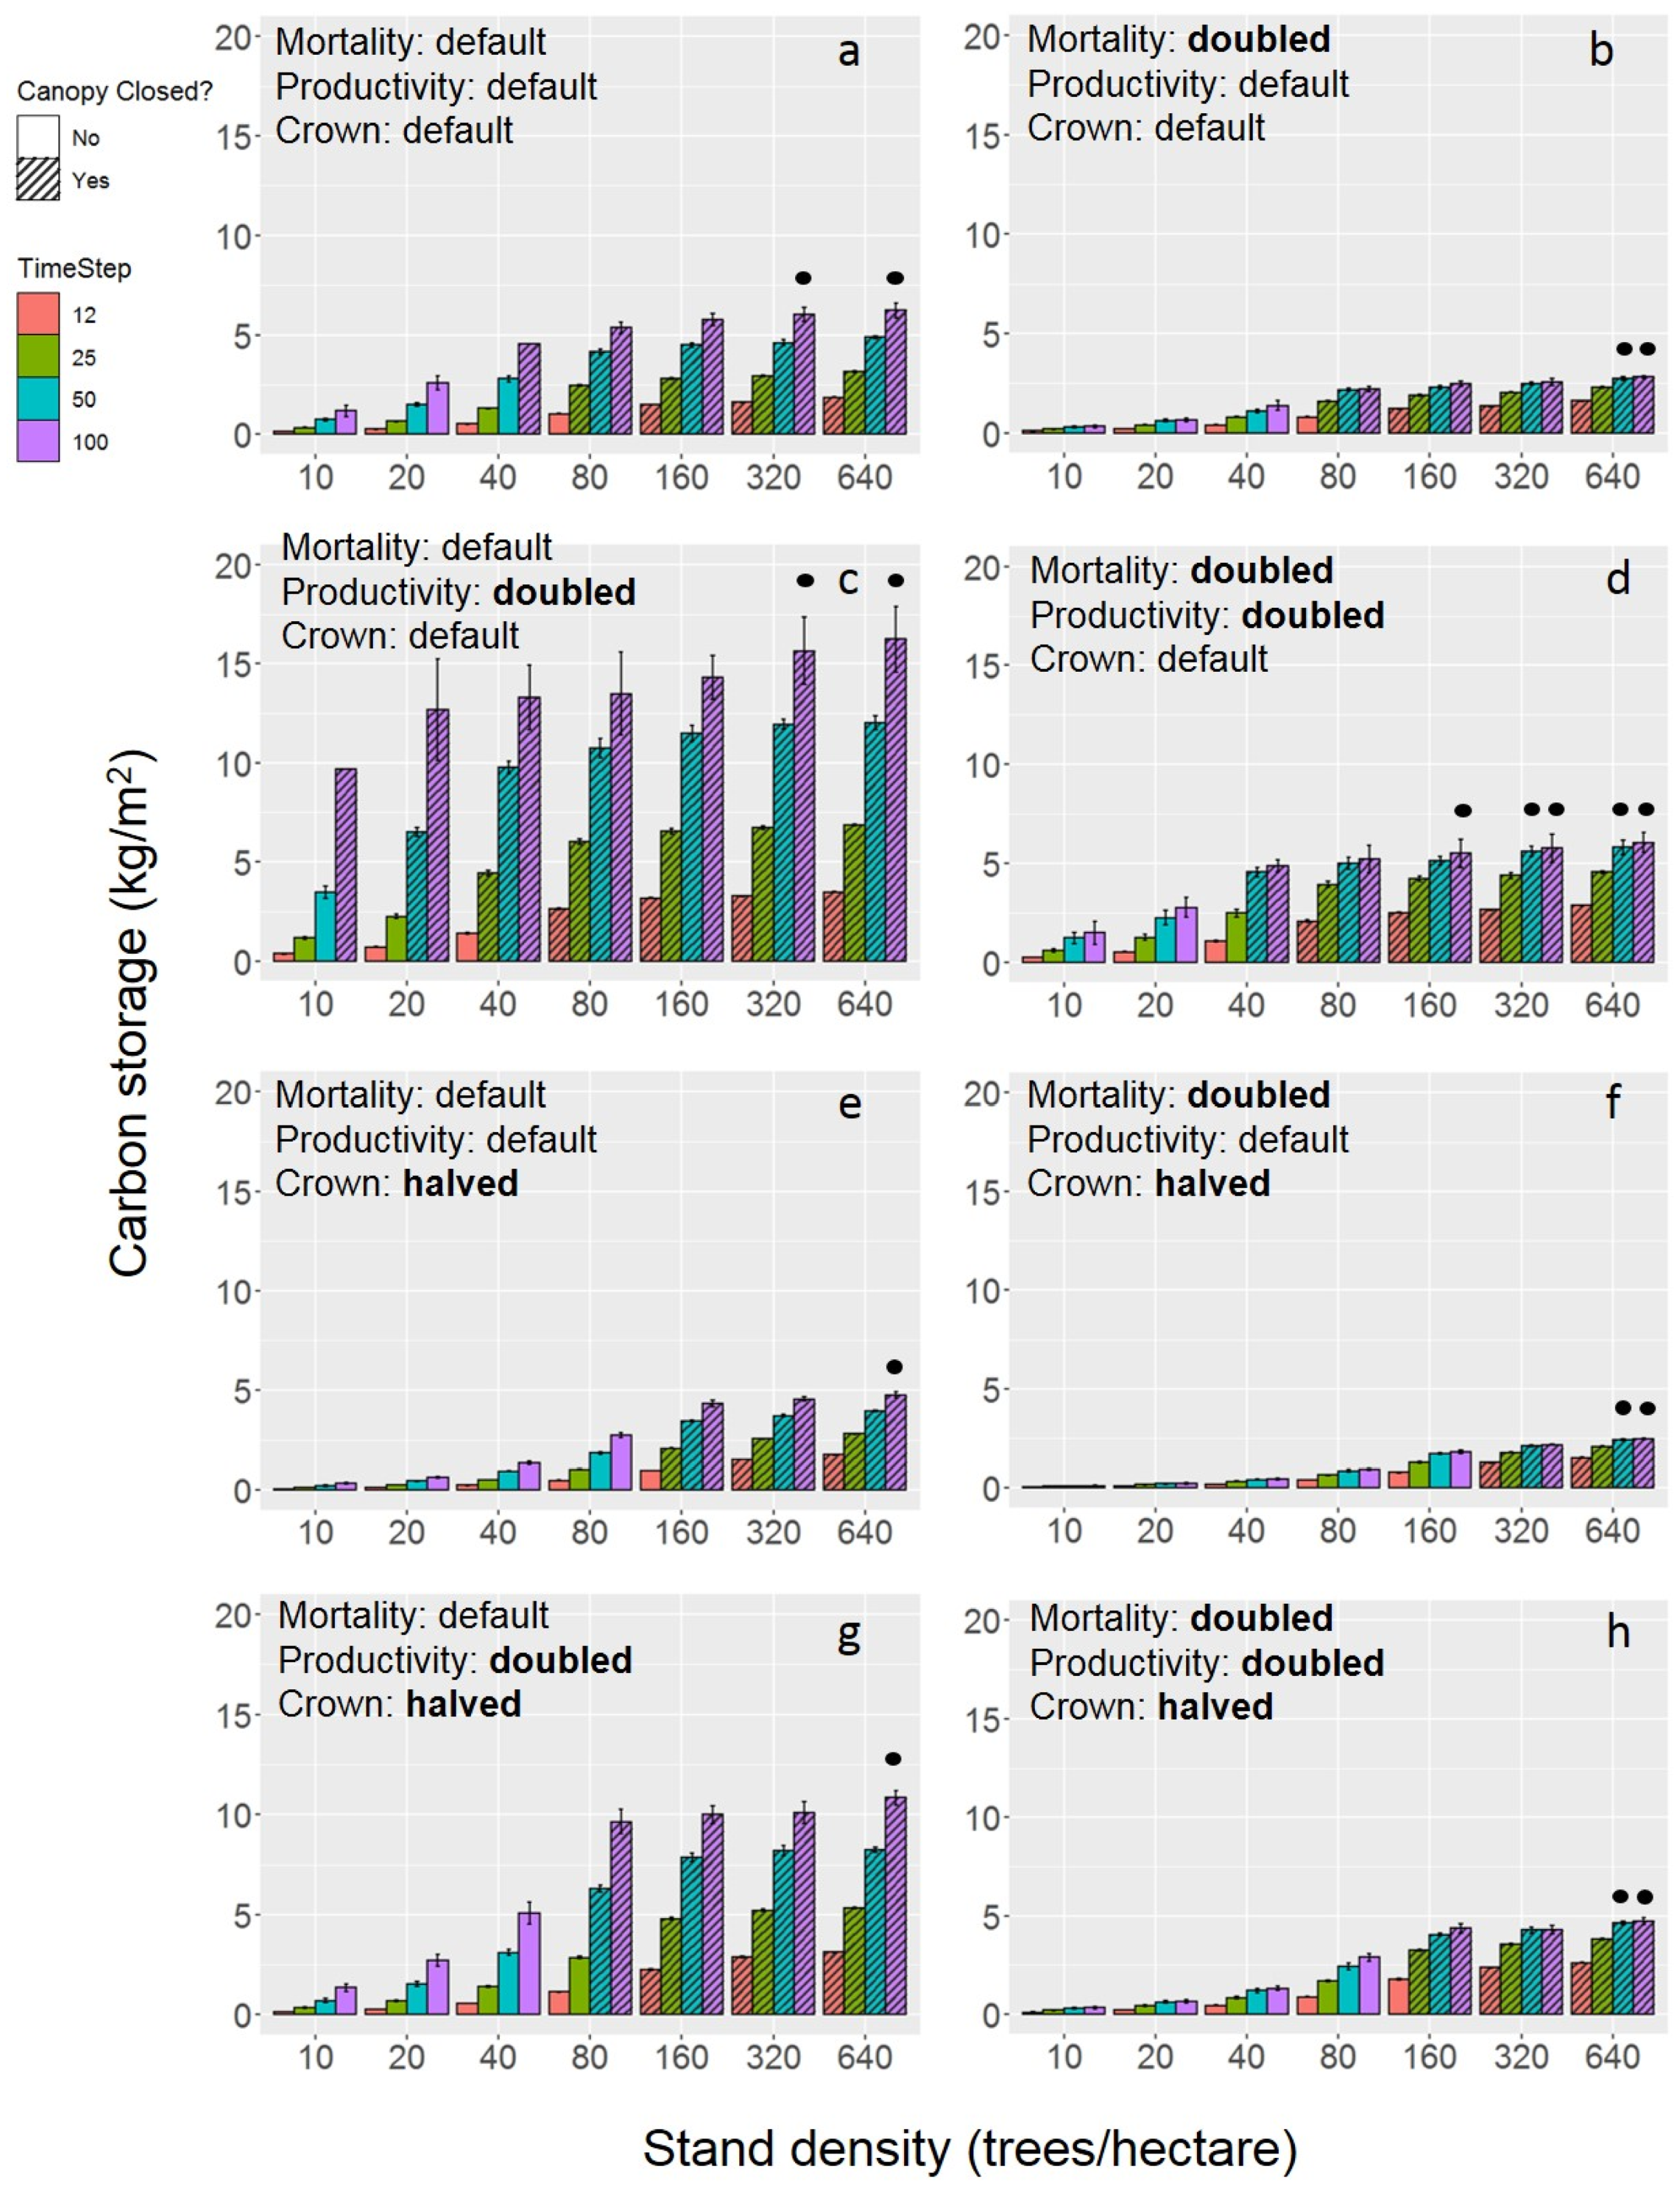
Qualitatively, we found the overarching result from the eight simulation experiments to be that storage and sequestration both increase with the prescribed density of street trees in an urban forest stand up to an optimization point where the storage and sequestration values saturate (Figure 2 and Figure 3). The optimization point coincides with the closure of the canopy.
We also found a saturating relationship between carbon storage and density in an analysis of urban FIA plot measurements from ten U.S. cities (Figure 4).
Although this trend was present in several cities, such as Kansas City, Springfield, and Houston, carbon storage appears to drastically increase as prescribed density increases in cities such as Portland.
The three mechanisms of interest—overall productivity, crown allometry in relation to stem diameter, and mortality rate—all impacted the total carbon storage and sequestration across prescribed densities. The qualitative changes in carbon storage and sequestration were very similar across mechanism combinations and prescribed densities. Thus, the following results and discussion generally group carbon storage and sequestration together in terms of general trends.
Doubling productivity alone resulted in increased overall carbon storage and sequestration across prescribed densities, with a more exaggerated increase in the higher prescribed densities (Figure 2a,c and Figure 3a,c). At the baseline level across mechanisms, the carbon storage saturates at approximately 6 kg/m2 (Figure 2a), but with productivity doubled, the carbon storage saturates at approximately 16 kg/m2 (Figure 2c). The year and prescribed density at which these carbon storage values were reached also changed with productivity. At 100 years, the baseline simulation reached the optimization point (Figure 1) at 40 trees/hectare, whereas the simulation with the doubled productivity had an optimization point of 20 trees/hectare at 100 years (Figure 2a,c and Figure 3a,c). The optimization point coincides with the closure of the canopy. When all three mechanisms are at the baseline level, the first instance of canopy closure is at year 100 within prescribed density of 40 trees/hectare (Figure 2a and Figure 3a). With the productivity doubled and all else remaining at the baseline, the canopy closed earlier within the 40 trees/hectare prescribed density (year 12) (Figure 2c and Figure 3c). Additionally, the canopy closed within a lower prescribed density, 10 trees/hectare, at year 100 (Figure 2c and Figure 3c). Trends of carbon sequestration follow closely to those of carbon storage, though there were typically smaller differences in sequestration among years of the same prescribed density. The baseline simulation had a 100-year saturation at a sequestration rate of 0.22 kg/m2/year, and the simulation with doubled productivity saturated at a rate of 0.62 kg/m2/year after 100 years (Figure 3a,c). The optimization point for carbon sequestration is the same as that of carbon storage.
The halved crown allometry values produced a decrease in carbon storage and an increase in the optimization point. Although the change in the saturating value of carbon storage is relatively small—from 6 to 4.75 kg/m2—the change in the 100-year optimization point is sizable (Figure 2a,e and Figure 3a,e). At the baseline, the optimization point is 40 trees/hectare, whereas the optimization point with halved crown allometry parameters is 160 trees/hectare (Figure 2a,e and Figure 3a,e). This change in optimization point from the halved crown allometry coincides with the large impact on canopy closure. Whereas the baseline’s lowest density canopy closure was 40 trees/hectare at year 100, the halved crown allometry simulation had a closed canopy at 160 trees/hectare at year 25 (Figure 2a,e and Figure 3a,e). Trends and changes in carbon sequestration align with those of carbon storage. The halved crown allometry simulation decreased the 100-year saturation value of sequestration from 0.22 kg/m2/year to 0.16 kg/m2/year and had the same changes in optimization point as described for carbon storage (Figure 3a,e).
Similarly, doubling the mortality rate caused a decrease in total carbon storage and sequestration across prescribed densities (Figure 2 and Figure 3). The higher prescribed densities showed this decrease in carbon storage and sequestration most prominently. At the baseline level across mechanisms, the carbon storage saturates at approximately 6 kg/m2, but with mortality doubled, the carbon storage saturates at approximately 2.75 kg/m2 (Figure 2a,b). Increased mortality also caused the canopy to close slightly later than the baseline mortality rate. With all three mechanisms at their baselines, the canopy first closes at year 100 of the prescribed density of 40 trees/hectare. Doubling the mortality rate resulted in the first occurrence of canopy closure at year 25 of the 80 trees/hectare density. This shift in canopy closure impacted the density at which carbon storage and sequestration saturate, with the baseline optimization point of 40 trees/ha and the doubled mortality optimization point of 80 trees/ha (Figure 2a,b and Figure 3a,b). For the doubled mortality simulations, the saturation value of carbon sequestration after 100 years decreased from 0.22 kg/m2/year to 0.18 kg/m2/year (Figure 3a,b).
In the urban FIA analysis, the range of stand densities varied widely among cities, as well as both the magnitude and the trends of carbon storage. For example, the carbon storage of San Diego, CA, remains relatively constant across densities with values below 10 kg/m2 (Figure 4i), whereas Portland, OR, has a relatively constant storage value at low densities, then a sharp increase in carbon storage at around 100 trees/ha, and values as high as 50 kg/m2 at higher densities (Figure 4j). Overall, the storage value tended to increase as plot density increases, up until a point at which the carbon storage saturates across increasing densities. The presence of this type of relationship in several cities suggests a similarity between the qualitative results of both the urban street tree PPA and the urban FIA data. In addition, the carbon storage values of the urban FIA cities are generally consistent with the storage values found in the urban street tree PPA.
4. Discussion
We created an urban modification of the perfect plasticity approximation (PPA) model of rural forest dynamics [31] to better understand the mechanisms that determine urban street tree carbon storage and sequestration response to prescribed stand density over time. The urban street tree modification takes the same individual-level parameters as the rural model concerning allometry and rates of growth and mortality to scale up and predict stand-level characteristics and dynamics. Importantly, the urban street tree PPA includes considerations unique to urban street trees, including lack of natural regeneration, the possibility that trees may overtop roofs, and a different mortality pattern.
We investigated three mechanisms of interest that vary across cities: overall productivity, crown allometry relative to stem diameter, and mortality rate. Each of the three mechanisms had a baseline level with parameter values taken from the literature and an altered level, and the simulation experiment consisted of all eight possible combinations of those values (i.e., a full-factorial design). We conducted multiple 100-year simulations across an exponentially increasing range of prescribed densities spanning those observed in urban forests (Figure 2 and Figure 3). We limited the simulations to a single species of tree to better isolate the effects of the three mechanisms.
Consistent with data from urban forests (Figure 4), the results suggest that carbon storage and sequestration follow the same trend: both increase as prescribed density increases up to a point which we termed the optimization point (Figure 1). The optimization point corresponds with canopy closure and is thus also partly a function of time at intermediate prescribed densities. At prescribed densities greater than the optimization point, carbon storage and sequestration saturate. The implications for urban street tree management include the insight that a given city’s productivity, typical crown area relations, and mortality regime will generate a unique optimization point. Across treatments, the optimization point ranges from 20 to 160 trees/ha, though it most commonly occurs between 80 and 160 trees/ha at 100 years. Areas of a given city that are below its optimization point may be dramatically under-delivering carbon storage and sequestration.
4.1. Productivity
Productivity is an integrative measure of the growth of the trees composing a forest stand. All other things being equal, productivity increases with anything that promotes tree growth and health, such as a favorable climate, a long growing season, light availability, nutrient and water availability, space for growth both above and below ground, healthy soil, and lack of pests and diseases. In the urban street tree PPA, we used wood net primary productivity (NPP) as a relevant proxy of overall productivity.
When productivity is doubled and all other parameters remain constant, there are noticeable changes in the relationship between density and carbon storage and sequestration (Figure 2a,c and Figure 3a,c). Doubling the productivity increases carbon storage and sequestration across prescribed densities, and the increases become more exaggerated with time. Similarly, a positive relationship between carbon storage and productivity has been documented for rural forests [53,54,55]. This relationship, however, may vary by climate, as Keeling et al. [56] found that the relationship between productivity and biomass saturates with the addition of a wider range of forest types, particularly high-productivity tropical forests.
Compared with results under the baseline productivity, canopy closure occurs both earlier within a given prescribed density and at lower prescribed densities overall when productivity is doubled. This occurs because the more productive trees can grow and fill the habitat more quickly than the baseline trees. As a result, doubling productivity decreases the optimization point, since the density at which the canopy closes is now lower. An urban forest with favorable growing conditions and optimized maintenance strategies will be able to expand more quickly and deliver ecosystem services such as carbon storage and sequestration both faster and with greater magnitude.
4.2. Crown Allometry
Crown allometry broadly describes the size and shape of a tree’s canopy—how it spreads and fills the space in relation to the stem diameter.
The most successful estimations of urban crown allometry occur when maximum crown areas are used to reflect open-grown forest dynamics [57]. The urban street tree PPA reflects this type of growing condition with the allometries from Purves et al. [49], which uses open-grown trees as the basis for potential crown sizes. Therefore, the crown allometries we used in the urban street tree PPA remain accurate predictors of urban street trees, along with the 3.15-times increase in crown area (i.e., 1.78-times increase in radius) we determined from the empirical tuning using ArcGIS Pro [50].
In the simulation experiment, the larger default value of crown allometry in relation to the stem diameter caused an increase in carbon storage and sequestration, with the largest increases occurring in the later years within a given simulation (Figure 2a,e and Figure 3a,e). The larger crown area corresponds with greater leaf area. As leaf area is responsible for fixing carbon, increasing it translates to more biomass added to each tree at a given stem diameter. The doubled crown area also results in the canopy closing faster and in lower density stands, since the larger crowns take less time and fewer trees to fill the habitat area than the baseline crowns. As a result of this change in canopy closure, there is a drastic decrease in the optimization point at which carbon storage and sequestration saturates. Once the canopy is closed, the stand carbon storage and sequestration remain relatively constant (Figure 2a,e and Figure 3a,e).
We used inventory data from the Urban Forest Inventory Analysis (U.S. Department of Agriculture, Forest Service 2021) to compare the urban street tree PPA simulations to data. The variation present among the carbon storage of cities in the urban FIA (Figure 4) may, in part, be a result of the different dominant species in each region. For example, most cities have trees of similar size and shape, with genera such as Quercus, Acer, and Ulmus featuring prominently across cities. San Diego, California, is a notable exception, with palms and relatively small trees dominating the urban forest. These tree species have relatively small crown areas in relation to the stem, which may explain the unusually low levels of carbon storage found in San Diego (Figure 4i). In contrast, Portland, which exhibits very high carbon storage (Figure 4j), is dominated by large species, which can, in some cases, grow to be well over 100 feet tall. The prominence of such massive species with expansive crowns in Portland is likely influential in elevating the total carbon storage of that urban forest. The differences in both dominant species and carbon storage between Portland and San Diego highlight the major role that the crown allometry of various species plays in determining carbon storage potential.
4.3. Mortality Rate
Mortality rate is defined as the probability of a tree dying at a given point in time. In the urban context, causes and contributors to mortality include a wide variety of harsh growing conditions such as compacted soil, lack of available root space, proximity to obstacles such as power lines or buildings, as well as environmental threats including storm damage, drought, removal due to safety concerns or construction projects, pests, and diseases [28,58].
The results of the simulation experiment show that when mortality rate is doubled and all else is constant, carbon storage and sequestration decreases across all densities and the decrease is more exaggerated as time goes on (Figure 2a,b and Figure 3a,b). When each tree has a higher likelihood of dying prematurely, fewer trees survive, and thus fewer individuals of older ages and larger sizes comprise the urban forest’s street trees. Although the urban street tree PPA replaces dead individuals with saplings, it is not enough to make up for the loss of larger individuals, and the overall carbon storage of the stand decreases. The differences between baseline and doubled mortality carbon storage over time and density become less pronounced at prescribed densities greater than the optimization point. When the mortality is doubled, there is a slight increase in the time to canopy closure, though not enough to noticeably affect the optimization point. It will take longer for the canopy to fill in and reach the point where carbon storage and sequestration saturates when the trees are less likely to survive.
4.4. Simulation Experiment
The simulation experiment results indicate that stands with higher prescribed density store more carbon than those with lower prescribed densities, when controlling for other variables, until the stand reaches its optimization point, and the value of carbon storage saturates. Empirical studies of both even and uneven stand age often found a similar relationship [18,21,59,60], suggesting that a denser stand of many generally smaller trees is more effective at storing carbon than a less dense stand of fewer but larger trees. However, studies in other forest types have found the inverse to be true [16,17]. The optimization point of the stand coincides with the point of canopy closure. At that point, the stand is not able to increase sequestration rates much more because the surface area available for carbon fixation is maximized, apart from small contributions from the understory. Due to the optimization point phenomenon, the differences in carbon storage appear more significant between the lower prescribed densities than the higher prescribed densities. For example, there is a larger difference in storage between 20 and 40 trees/ha than between 320 and 640 trees/ha. At the higher prescribed densities, both stands have closed their canopies, whereas the canopies of the lower prescribed density stands are not yet closed.
The effect of time on carbon storage and sequestration follows similar patterns to those described above for prescribed density. Within a single prescribed density, carbon storage increases in the early years, then reaches an analogous optimization point in later years. Over time, the canopy progresses toward closure and the amount of carbon the stand can sequester and store saturates as a result. Hudiburg et al. [61] find a similar stabilizing relationship between live biomass and stand age in several rural ecoregions of Oregon and Northern California, supporting the idea that a stand’s carbon storage levels off over time. This is supported by trends in NPP over time from He et al. [62], where NPP increases rapidly in a stand’s early years, then levels off over time, particularly in deciduous broadleaf forest. In some forest types, such as some evergreen needleleaf and mixed forests, advanced stand ages even experienced a decline in NPP. One benefit of this simulation is that it allows us to control for density in this relationship between stand age and carbon storage and sequestration, rather than having it as a confounding factor as other estimations might.
In order to create analogous plots to those from the urban street tree PPA, we calculated both the density and carbon storage of each plot in ten U.S. cities. The resulting overall trend is that carbon storage increases as stand density increases, up until a certain point where the storage reaches an asymptote and remains relatively constant (Figure 4). The presence and strength of an optimization point varies among cities, with some cities not showing this relationship at all (Figure 4). Saint Louis, Springfield, Kansas City, Houston, and Austin appear to have reached saturating levels of carbon storage (10, 10, 8, 8, and 7 kg/m2, respectively). All five of these cities appear to reach this point at around 160 trees/ha, or about 25 feet apart along a street. Washington, D.C. shows a steep increase and the start of a potential saturation at 20 kg/m2. Several cities have carbon storage values that continue to increase as density increases with no sign of saturating. Portland, Oregon exhibits the most drastic increase; Chicago, Illinois continues to a lesser degree than Portland; and San Antonio, Texas shows a slight increase in carbon storage at higher densities. San Diego remains relatively constant across densities, at about 1 kg/m2.
4.5. Limitations of the Model
Several aspects of the urban street tree PPA should be noted as possible limitations to the applicability of the results. First, we included only a single species in the model simulations. This monoculture condition is not reflective of real-world urban forests and may have an effect on the trends of carbon storage and sequestration found from the model. Additionally, the urban street tree PPA starts with a stand of saplings. Real urban forests are a mixture of developmental stages and do not all begin their lifespan at the same time. Dynamics of canopy closure, carbon storage, and sequestration are influenced by the starting conditions of the stand. We used allometric equations created for rural forests in the urban street tree PPA, despite the apparent dissimilarity in the shape of urban and rural canopies due to their different growing conditions. Open-grown trees, such as urban street trees, typically have larger, more complex crowns than rural trees growing in a forest stand, which creates differences in the overall shape of the tree and how it distributes its biomass [63]. McHale et al. [64] show a lack of consistency in the accuracy of predicting biomass of urban trees using rural allometric equations, with both under- and over-estimations possible. In the case of this experiment, the GIS tuning ensured accurate crown areas and modest changes in the quantitative allometries are unlikely to affect the qualitative trends that are the takeaways of this study. Other limitations may come from the PPA model from which the urban street tree PPA is derived, which relies on particular assumptions and mechanisms to simulate forest dynamics. First, the PPA is spatially implicit. Although this is beneficial in that it can be applied to forest inventories in any location, it may also omit explicit spatial dynamics that are influential to stand development. Next, gaps created from dead trees are filled as soon as the simulation cycles to the next year, which is not necessarily reflective of true rural or urban forests, where it may take several years for a new tree to fill that space. Despite the limitations, the PPA, with its main assumption of very flexible crown areas, creates more realistic forest simulations that improve upon older models such as SORTIE, with their rigid cylindrical crowns [31].
4.6. Implications for Urban Forest Management
The results of the simulation experiment and data comparisons can inform urban forest management and planning by relating urban street tree planting characteristics such as density to carbon storage and sequestration. Although there is the general trend of a saturating relationship between density and carbon storage across cities (Figure 4), there is a large range of carbon storage both within a given city and between different cities in the urban FIA data. This may be a result of differences in cities’ climates, growing conditions, species compositions, and/or forest maturity. Climate plays a large role in determining the size and rate at which trees can grow, which dictates the tree species that can be planted and survive there. Species identity influences mortality rate [32], productivity [51], and crown allometry [49], all of which contribute to differences in carbon storage and sequestration among tree species [17,59]. Optimal maintenance strategies will vary among cities depending on the unique characteristics of a given urban forest.
Due to the saturation of carbon storage and sequestration at greater prescribed densities, cities with low average density would benefit most from large-scale tree plantings. Increasing overall density in a city with very few trees would have a larger impact on carbon storage than focusing efforts on planting more trees in high-density cities. This is due to the fact that cities with high average densities may be close to or already past their optimization point, whereas low density cities have the potential to increase carbon storage and sequestration significantly with more trees added. For example, Chicago, Austin, and San Antonio (Figure 4) show a sharper increase in carbon storage at higher-density plots, though confidence in this trend is limited by a lack of data points. Assuming that there is sufficient moisture and nutrients to support more trees, an increase in plantings would benefit these cities by creating higher overall density, and, as a result, carbon storage. Portland and Washington, D.C. have dramatic increases in carbon storage between 160 and 640 trees/ha (approximately 25-foot tree spacing and 13-foot tree spacing, respectively), meaning that the higher density plots may be near their optimization point in these cities. As typical street tree spacings tend to fall between 25 and 40 feet, this range extends from about average into densities that are considerably higher than a standard city street. Cities such as Saint Louis, Kansas City, and Houston (Figure 4) show relatively stable relationships between density and storage at higher levels, which is indicative of areas that have reached their optimization point. These high-density urban forests may benefit more from an increased focus on maintenance, such as pruning, pest detection, and watering, for the trees that are already present to ensure their health and longevity, rather than on tree planting campaigns.
Despite the apparent benefits of high-density urban forests, it is important to note that there are tradeoffs. Cities with more trees will require more maintenance of both living and dead trees. Typical urban forest maintenance practices require numerous types of machinery that use fossil fuels, which causes a net decrease in the stand’s carbon sequestration, and over long time periods it is even possible that the high levels of carbon that the stand is taking in are cancelled out by the amount emitted to maintain it [65]. Simply limiting maintenance efforts does not solve this issue, as it has been found that a lack of maintenance has negative impacts of tree health and lifespan [65,66]. There appears to be an optimum level of maintenance activity, such as pruning, watering, and monitoring for pests and diseases, to produce the healthiest urban forest. Carbon emissions are an inescapable aspect of urban tree care that must be considered as a tradeoff to increased stand density. Other tradeoffs are possible as well, such as increased vulnerability to drought, pests, diseases, and wildfires [25]. High-density urban stands are less able to withstand these types of threats, which can lead to increased mortality and therefore reductions in stand-level carbon storage and sequestration. For example, a city with closely planted trees that experiences a drought could face higher tree mortality, as competition for water is much greater than in a city with lower density. Additionally, the financial and social aspects of planting more street trees is often an obstacle. The cost of not only bringing in many new trees to be planted, but also regularly maintaining them is unrealistic for many communities. In a study performed in Detroit by Carmichael et al. [67], city residents were surveyed about urban tree plantings, and many responses indicated that although they had positive opinions about trees, they were not supportive of new plantings due to the lack of upkeep and cooperation by the city government. Many noted that if more trees were planted, few would survive, and the costs would outweigh the benefits. Other studies have found that tree plantings may lead to neighborhood changes through developers and gentrification, thus changing the affordability of an area for residents [68]. If a city were to only focus their urban forestry goals on increasing carbon storage and sequestration as much as possible by planting trees at a high density, it would overlook and exacerbate other ecological, financial, and social issues as a result. A balance is necessary to ensure that increased carbon storage and sequestration are not coming at the cost of the health and resources of the urban forest or community.
The saturating relationship between density and carbon storage and sequestration aids in balancing these tradeoffs. If there is a stand density after which storage and sequestration stop increasing, then there is not much benefit from surpassing this density. Managing street trees to be around the optimization point would allow for maximum carbon storage and sequestration with minimized costs of planting and caring for additional trees. Planting just above the optimization point would ensure that stands reach their highest storage and sequestration values at the lowest possible density, which lowers the amount of emissions released from urban forest management practices. As shown in the urban FIA plots (Figure 4), cities are heterogeneous in density, so the most effective policy would be to focus efforts first on a city’s less-dense areas in order to maximize carbon storage and sequestration impacts. In terms of street trees, these less-dense priority areas could be neighborhoods with few to no trees lining roadways, as well as public spaces such as parking lots, parks, and planting strips. As street tree plantings are typically dictated by local spacing guidelines, such as one tree per lot or every certain distance, areas that are already planted are more difficult to change.
Prioritizing low-density areas within a city would not only strongly impact carbon storage and sequestration, but also work to combat the urban canopy inequality that is present in many cities. In cities worldwide, significant evidence has been found of urban forest inequity based on income [69,70,71,72,73,74]. In addition to income, several of these studies also found a relationship between race and urban forest density, where areas with fewer trees corresponded to areas with higher minority populations [70,72,73,74], although this relationship was typically not as strong as the one found between income and density. By focusing tree planting and maintenance efforts on the lower-density areas of cities, maximum impact would be made not only in terms of increasing carbon storage and sequestration, but also in combating unequal ecosystem service delivery. However, it is important to note that this approach assumes that the residents of these areas are accepting of new trees in their communities, which is not always the case, as shown by Carmichael et al. [67].
5. Conclusions
The relationship found in the simulation experiment and suggested by several cities from the urban FIA indicates that there is an optimization point at which carbon storage and sequestration stop increasing with density and instead begin to saturate. Overall productivity, crown area relative to stem diameter, and mortality rate all impact the values of maximum carbon storage and sequestration, as well as the optimization point. Urban street tree stands with high productivity, increased crown area, and low mortality rates produce the highest carbon storage and sequestration values as well as the lowest optimization point. The concept of an optimization point can be used to inform urban street tree management strategies in order to increase carbon storage and sequestration. Assuming that acceptable conditions for additional trees can be met by the environment and community, planting urban street tree stands around the optimization point would allow for the optimal amount of carbon to be stored and sequestered while also minimizing the number of trees that must be planted and maintained. These results can be considered along with other factors in decision-making for urban forests such as forest health, aesthetics, maintenance, and financial considerations.
Supplementary Materials
The following supporting information can be downloaded at: https://www.mdpi.com/article/10.3390/f14112207/s1, File S1: Urban Street Trees Carbon Capture Script; File S2: Control Script.
Author Contributions
J.D.: Conceptualization, methodology, software, validation, formal analysis, investigation, data curation, writing—original draft, visualization. L.B.: Writing—review & editing. Y.W.: Writing—review & editing. R.D.: Conceptualization, methodology, software, validation, investigation, supervision, writing—review & editing, visualization. All authors have read and agreed to the published version of the manuscript.
Funding
This research received no external funding.
Data Availability Statement
The data presented in this study are available in the Supplementary Materials and on request from the corresponding author.
Conflicts of Interest
The authors declare no conflict of interest. The funders had no role in the design of the study; in the collection, analyses, or interpretation of data; in the writing of the manuscript; or in the decision to publish the results.
Appendix A. Description of Loop Calculations
The PPA forest simulation approximates the seasonal cycle of a forest: each year trees grow, die, and reproduce during the growing season. The state of the forest at the end of one growing season is the state of the forest at the beginning of the next growing season. In each cycle, the following parameters are calculated on both the individual and stand levels: Z*, carbon sequestration and storage, the number of new seedlings produced, tree mortality, and the growth of the stem diameter, height, and crown area of each tree. The procedure for each of these parameter calculations is described below, followed by a section detailing the specific modifications made to the rural PPA calculations to reflect urban growing conditions.
Appendix A.1. Canopy Height, Z*
Z* is a context-dependent height that separates individuals classed in the canopy versus those classed in the understory [49]. Trees with heights above Z* are classified as canopy trees, as they have at least a portion of their crown area exposed to direct sunlight. Trees that are not taller than Z* are growing in the shade and are classified as understory. Some forests will have a low Z* and some forests will have a high Z* depending on the separate demographic rates of individuals in the canopy and understory. It is important to note that a canopy tree does not need to have its entire crown exposed. As long as any portion of the crown gets direct sunlight, the tree is in the canopy class. Trees in this class will generally have both shaded and sunlit crown area.
Another way to define Z* is that it is the lowest height at which the canopy is closed. If a stand has a closed canopy, that means that the total sunlit crown area of all the trees together is equal to the total ground area of the habitat. This is the condition in which Z* can effectively be calculated. A closed canopy creates an understory that is completely shaded by the crowns of the taller trees. Without a closed canopy, sunlight is able to reach through the gaps down to smaller trees. An “open canopy” Z* of zero indicates that every tree in the stand has its crown in the light, thus classifying every tree as a canopy tree and eliminating the understory.
The PPA algorithm begins by ordering all of the trees in the stand according to height, from tallest to shortest. To determine if the canopy is closed, the crown areas of the trees are added cumulatively from tallest to shortest until the total is equal to the habitat area. Once this occurs, it indicates that the canopy is closed. The Z* value can be no larger than the height of the last tree added to the sum (the shortest canopy tree).
If the sunlit crown area is found to be less than the habitat area, the canopy is not closed. In this case, the Z* is zero. If the crowns of all the trees in a stand are spaced widely enough that every individual has at least some portion of its crown area exposed to direct sunlight, then Z* will remain at zero until the crowns grow closer together. If it is not the case that every tree gets sunlight, then the value of Z* will move up a bit from zero as a result of the few trees that are completely shaded.
Appendix A.2. Carbon Storage and Sequestration
The amount of carbon stored and sequestered by each tree is based on biomass. The following allometric equations from Jenkins et al. (2003) [75] relate a tree’s biomass to its stem diameter:
where exp is the exponential function, β0abv, β1abv, β0bg, and β1bg, are taxa-specific parameters, dbh is diameter at breast height, and ln() is the natural logarithm. As carbon accounts for approximately half of a tree’s dry weight biomass, final calculations are divided by two to determine a tree’s carbon storage. Carbon sequestration is the difference between the previous year’s carbon storage and the current year’s value. Stand-level carbon storage and sequestration are the respective sums of each individual tree’s carbon storage and sequestration.
Appendix A.3. Fecundity
The fecundity component determines how many new seedlings are created in each timestep. This is achieved by multiplying the fecundity rate per crown area [32] by the total sunlit crown area of each species. This makes the number of seedlings that are produced of a given species proportional to the abundance of that species within the canopy of the stand: species with more sunlit crown area produce more seedlings, and vice versa. All new seedlings begin in the understory and are included in the same calculations as previously established trees, such as crown area and carbon storage and sequestration.
Appendix A.4. Mortality
For each iteration of the loop, any given tree has a certain probability of dying. This probability is dependent upon the tree’s canopy status. Understory trees are growing in the deep shade and therefore lack the benefits of direct sunlight that the canopy trees have, which translates to a higher mortality rate. Canopy trees are generally in more favorable carbon balance due to their exposed crown areas, resulting in a mortality rate that is lower than that of the understory trees. This is reflected in the mortality rates from Purves et al. (2008) [32].
Appendix A.5. Stem Diameter, Height, and Crown Area Growth
Once information about the stand’s Z*, carbon storage and sequestration, and population size changes are calculated and recorded, each tree in the stand grows its stem diameter, height, and crown area before the loop iterates back to the beginning for the next timestep.
In contrast to the approaches used by others [31,32,49], which ascribe a stem diameter growth rate based solely on canopy class, we determined stem diameter growth rate based on a tree’s sunlit crown area together with published rates of wood productivity [51]. This approach ensures that trees of the same canopy class (canopy or understory) do not all grow at the same rate—some canopy trees may only have a very small sunlit portion whereas others are nearly fully exposed. Trees with more sunlit crown add more biomass than trees with little or no sunlit crown area.
This method of determining stem diameter growth works by finding the amount of biomass the tree added in a given year, then calculating how much diameter growth corresponds with that amount of new biomass. The first step in determining the new stem diameter value is to multiply per-ground area wood carbon net primary productivity (NPP)—the annual rate of change in the amount of carbon allocated to wood production—[51] by 2 to convert it to biomass, following the allometry from Jenkins et al. (2003) [75]. The rate of total wood biomass added per year is then multiplied by the sunlit crown area of the tree to find the total annual change in aboveground biomass (kg/m2/year).
For trees without any sunlit crown area, the shaded crown area is used instead, and it is multiplied with a small fraction (3%) of the biomass to reflect the lower productivity of shade-grown trees [51].
Next, the equation for aboveground carbon described previously is rearranged to solve for dbh.
The aboveground biomass component of this equation is found by adding the change of aboveground biomass to the previous total aboveground biomass. Therefore, the final equation is as follows:
The result is the dbh size that can be created for each tree based on the amount of biomass that tree’s crown area can capture.
The new height of each tree is calculated next, using the newly determined dbh. Species-specific height parameters (α and β) come from Purves et al. (2008) and are used in the following equation [32]:
The final step in the growth calculations is determining each tree’s new crown area, which is split into sunlit and shaded portions. The methods used to calculate the crown areas, as well as all the parameters, come from Purves et al. (2007) [49], which details crown interactions within the PPA. Determining the sunlit and shaded crown areas begins by calculating , which represents the effective canopy height and is calculated for each tree individually. It is a modification of the Z* value that factors in the depth bias (Vbias) of each species involved. A depth bias can be positive or negative, meaning that a species tends to begin its crown above or below the Z* height, respectively. It is also possible for a tree species to have a depth bias of zero, where the crown begins at the Z* height. By including depth bias into its calculation, allows for a more realistic determination of a tree’s sunlit and shaded crown areas. Trees with a positive depth bias have smaller crown areas than a prediction using only Z* would approximate, whereas a negative depth bias results in a larger potential crown area.
is found in two steps. First, a new individual-level Z* prediction () is made based on the previously calculated stand-level Z* (hereby denoted as Zq) and the depth bias of the individual tree (Vbias). The Vbias value is added to Zq, which shows the true height at which the individual tree’s crown begins. The model uses the equation , which chooses the larger value of the following: the stand-level Z* guess (Zq) plus the depth bias, or zero. This ensures that no trees have crowns that begin at negative heights, which would represent an unrealistic situation where the crown begins below the surface of the soil.
Second, the from the first step is carried over into the second equation, . This step determines the effective canopy height to be the larger of the two values: the height from step one () or the original stand-level Z* guess (Zq) that does not include depth biases. By choosing the larger of the two values, the height of the sunlit crown is kept within realistic boundaries: the effective canopy height of an individual canopy tree cannot be shorter than Zq, but it is possible to be taller than the stand-level cutoff point. The two steps can be condensed into one step via the following equation.
The next important variable to determine is Rmax, the maximum radius of an individual tree’s crown. This is the largest possible distance from the center of the crown to the end of the farthest potential branch. It is calculated using:
where R0 and R40 are set parameters [49] representing the species-specific maximum potential crown radius of a tree with dbh 0 and 40 cm, respectively. As described below, we modified the rural forest values for R0 and R40 given by Purves et al. [49] so that the crown radius to stem diameter allometry fits observations made in an urban setting.
Once and Rmax are known, the sunlit portion of the total crown area is calculated. This is the fraction of the total crown of the tree that is fully exposed to the sun. As this is generally not the complete crown, the first step is to find the fraction of crown height in the light. The parameter Mj is used in this step. Mj measures the ratio of a tree’s crown height to its total height. In this model, Mj is set to 0.95, as in Purves et al. [49]. This translates to potentially 95% of a tree’s height being crown, a condition that is realized in many tree species in open-grown conditions. To determine the fraction of crown height in the light, the model compares tree height times Mj and tree height minus . The smaller of the two values is chosen to be the fraction of the crown in the light.
Next, the radius of this sunlit crown must be calculated. To do so, the original Rmax value is used to scale the sunlit radius based on how much of the crown is in the light and how the particular tree species tends to arrange its crown. The following equation is the term that acts as a modifier to the original Rmax values.
Bj is a parameter that modifies the shape of the crown based on species—this is where, for example, the cone-like shape of a typical conifer is differentiated from the more globe-like broadleaf trees. The modifier is then multiplied by Rmax to find the radius of sunlit portion. The crown area of the sunlit portion is calculated using the equation for the area of a circle, pi*radius2. The shaded crown area portion is the maximum total crown area (where the radius is Rmax) minus the sunlit portion.
Appendix B. Modifying the Rural PPA to Reflect Urban Conditions
Roof Crown Area
The roof crown area is determined by calculating the area of the chord of the tree’s crown area that is over the roof. In this process, it is possible that the predicted crown area of a tree grows into the area in which a building would be—in other words, the crown radius is larger than the distance from stem to building, but the crown is not yet taller than the roof height. In this case, it would be impossible for the tree to grow into that space, so any portion of the crown that would be growing where a building is located is removed from the total crown area. Mathematically, this is achieved by finding the area of the crown that is overlapping the building and subtracting that chord area from the total crown area. This calculation is performed separately for shaded and sunlit crowns so the totals for each category remain accurate. The area of the sunlit chord that overlaps buildings is found via the equation:
where r is the radius of the sunlit portion and is found by calculating the inverse cosine of the distance from stem to building divided by r. This area is subtracted from the total sunlit crown area to find the true sunlit area.
The true shaded crown area is found next. The area of shaded crown that is overlapping a building is calculated with the same chord area equation as above. However, in this case r represents Rmax and is the arccosine of the distance from stem to building divided by Rmax. Because this calculation occurs only when Rmax is larger than the stem to building distance, the resulting area corresponds to the overlapping crown only. To find the true shaded crown area, this chord area as well as the true sunlit crown area are subtracted from the total crown area:
These steps ensure that all urban forest crown area measurements remain accurate with the addition of buildings that often interfere with crown growth.
Appendix C. Empirical Tuning of Crown Area to Stem Diameter Allometry in Chicago
We used observations of stand density and crown area cover in the urban landscape of Chicago to adjust the rural crown area to stem diameter allometry for use in an urban setting. We implemented ArcGIS Pro software [50] to complete this procedure. First, we randomly selected 15 points in Chicago to serve as the center of each 10-hectare circular plot. To best facilitate the canopy area calculations, the circular plots were then converted to rectangular plots. The new rectangular shapes completely envelop the previous circular area, resulting in final plots with an area of approximately 13 hectares.
Two different areas are needed from each plot: the habitat area and the canopy area. The habitat area is comprised of any ground space that has the potential to be canopy area. This includes areas such as parks, yards, and space overhanging sidewalks and streets. Area taken up by buildings or large expanses of impermeable surfaces are not included in the habitat area. Calculating habitat area in this way rather than using the entire area of the plot mirrors the definition of habitat area used in the urban street tree PPA, which ensures that the observations from the GIS plots can be compared to the model predictions. Canopy area is the total area that tree crowns occupy. To find the two areas of interest, we georeferenced the satellite view of each plot using the UTM Zone 16 N reference system, then we classified the plot into a binary raster where tree canopy or habitat area is represented in black and everything else has no color. To do so, we reclassified the range of pixel values that corresponded to our areas of interest (canopy or habitat) to become black and the rest to become colorless. We used two different cutoff values to select for habitat and canopy area (Figure A1).
Habitat area with its various terrains covers a broader range of colors than canopy area. Therefore, it has a lower cutoff value so that more colors are included as “black”. Canopy area is more selective and has a higher cutoff value so as to only include the darkest pixels—the tree crowns. Any unwanted areas, such as dark cars or buildings, that were classified along with the habitat or crown area were cleaned up using the Pixel Editor (v2.3). The final areas were found by multiplying the pixel area by the number of black pixels, which cover either the habitat or canopy. Pixels were 1 m2, so the number of pixels was equal to the area in square meters, which was divided by 10,000 to convert into hectares. Finally, we counted the number of trees in each plot to determine the stand density.
Figure A1.
Screenshots of one plot in ArcGIS Pro. Panel (a) shows the initial, full-color plot image. Panel (b) is the grayscale of the initial image using only band 3. Panel (c) represents the canopy area of the plot, and panel (d) shows the habitat area.
Figure A1.
Screenshots of one plot in ArcGIS Pro. Panel (a) shows the initial, full-color plot image. Panel (b) is the grayscale of the initial image using only band 3. Panel (c) represents the canopy area of the plot, and panel (d) shows the habitat area.

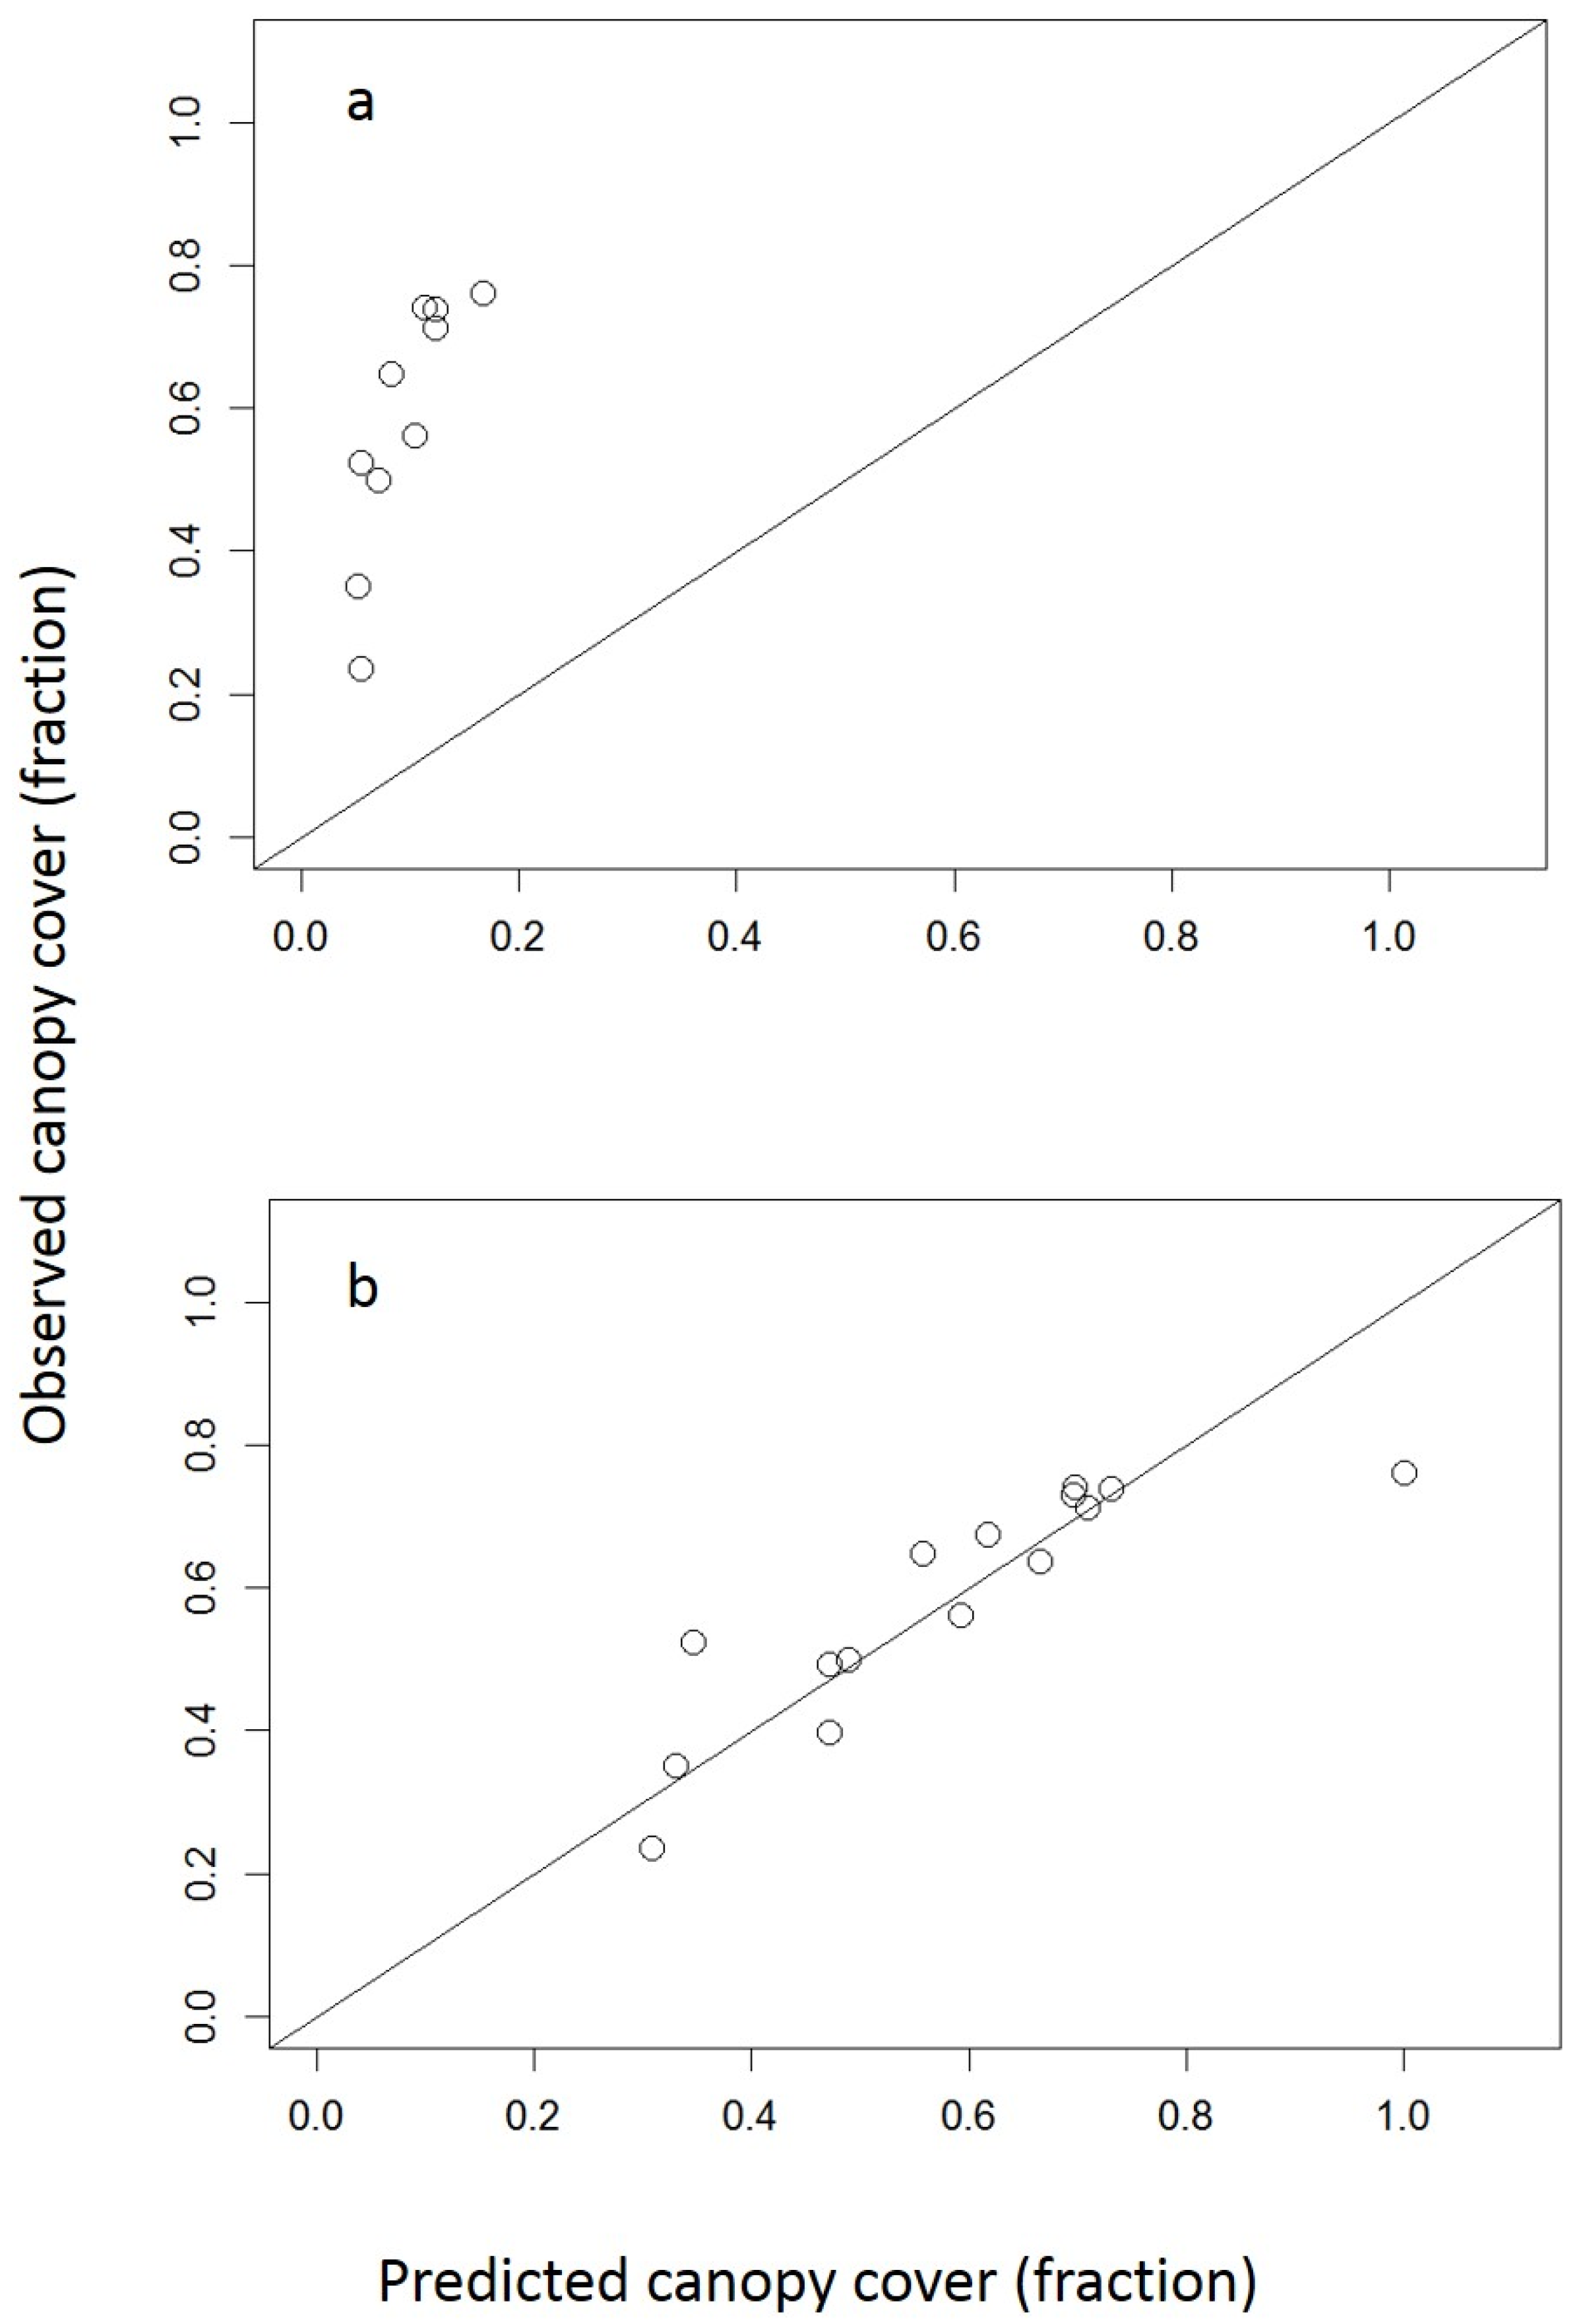
With the habitat area, canopy area, and density of each plot observed, we were able to compare the observed and predicted values for the fraction of habitat area covered by the canopy at a given density to tune the allometry. We constructed a predicted versus observed plot to pair the two sets of values together and analyze the relationship (Figure A2).
Figure A2.
Observed versus predicted plot. Observed values were calculated by using ArcGIS Pro to determine the fraction of habitat area that is covered by tree canopy in satellite images of 13-hectare plots within the city of Chicago. Predicted values were found by running the urban PPA at the same stand density as the corresponding plot and recording the fraction of canopy cover. Panel (a) shows the predicted canopy cover values from the model with the original maximum radius parameters from the literature and the ideal 1:1 fit. Panel (b) depicts the urban PPA’s predicted values following the modification of the parameter values to best fit the 1:1 line, in which the maximum radius value is multiplied by 1.78, thus creating a tree canopy that is 3.15 times larger than the original (1.782 ≈ 3.15).

We found that increasing the R0 and R40 parameters by a factor of 1.78 from their rural forest values [49] best fit the urban data. These alterations are reflected in the following experiment.
Appendix D. Urban Forest Inventory Analysis Data
Species-Related Adjustments
The equations used to determine carbon storage pull parameter values from the Ideal Tree Distribution (ITD) data [49]. Although many species from the urban FIA data were already present in the ITD data, there were instances where species found in the urban FIA were missing from ITD. In these cases, parameter values from related species in the ITD were copied onto the missing species. This method was not able to be implemented with palms due to the lack of related species in the ITD data. Palm allometry follows a unique equation because palms grow taller without growing wider over time, so diameter is no longer a factor. Therefore, the following equation from the Forest Service’s Urban Tree Database and Allometric Equations [76] is used to calculate the proper allometry for palm dry weight biomass:
To convert dry weight biomass to carbon, the value is multiplied by 0.5.
References
- Nowak, D.J.; Greenfield, E.J.; Hoehn, R.E.; Lapoint, E. Carbon Storage and Sequestration by Trees in Urban and Community Areas of the United States. Environ. Pollut. 2013, 178, 229–236. [Google Scholar] [CrossRef]
- Nowak, D.J.; Hoehn, R.E.I.; Bodine, A.R.; Crane, D.E.; Dwyer, J.F.; Bonnewell, V.; Watson, G. Urban Trees and Forests of the Chicago Region; U.S. Department of Agriculture, Forest Service, Northern Research Station: Newtown Square, PA, USA, 2013; p. NRS-RB-84.
- Schmitt-Harsh, M.; Mincey, S.K.; Patterson, M.; Fischer, B.C.; Evans, T.P. Private Residential Urban Forest Structure and Carbon Storage in a Moderate-Sized Urban Area in the Midwest, United States. Urban For. Urban Green. 2013, 12, 454–463. [Google Scholar] [CrossRef]
- Nowak, D.J.; Noble, M.H.; Sisinni, S.M.; Dwyer, J.F. People and Trees: Assessing the U.S. Urban Forest Resource. J. For. 2001, 99, 37–42. [Google Scholar]
- Turner-Skoff, J.B.; Cavender, N. The Benefits of Trees for Livable and Sustainable Communities. Plants People Planet 2019, 1, 323–335. [Google Scholar] [CrossRef]
- IPCC Global Warming of 1.5 °C. 2018. Available online: https://www.ipcc.ch/sr15/ (accessed on 19 March 2021).
- Le Quéré, C.; Andrew, R.M.; Friedlingstein, P.; Sitch, S.; Pongratz, J.; Manning, A.C.; Korsbakken, J.I.; Peters, G.P.; Canadell, J.G.; Jackson, R.B.; et al. Global Carbon Budget 2017. Earth Syst. Sci. Data 2018, 10, 405–448. [Google Scholar] [CrossRef]
- Nowak, D.J.; Greenfield, E.J. Tree and Impervious Cover in the United States. Landsc. Urban Plan. 2012, 107, 21–30. [Google Scholar] [CrossRef]
- Nowak, D.J.; Walton, J.T. Projected Urban Growth (2000–2050) and Its Estimated Impact on the US Forest Resource. J. For. 2005, 103, 383–389. [Google Scholar]
- McPherson, E.G.; Nowak, D.; Heisler, G.; Grimmond, S.; Souch, C.; Grant, R.; Rowntree, R. Quantifying Urban Forest Structure, Function, and Value: The Chicago Urban Forest Climate Project. Urban Ecosyst. 1997, 1, 49–61. [Google Scholar] [CrossRef]
- McPherson, E.G.; Simpson, J.R. Potential Energy Savings in Buildings by an Urban Tree Planting Programme in California. Urban For. Urban Green. 2003, 2, 73–86. [Google Scholar] [CrossRef]
- Donovan, G.H.; Butry, D.T. Trees in the City: Valuing Street Trees in Portland, Oregon. Landsc. Urban Plan. 2010, 94, 77–83. [Google Scholar] [CrossRef]
- Smith, I.A.; Dearborn, V.K.; Hutyra, L.R. Live Fast, Die Young: Accelerated Growth, Mortality, and Turnover in Street Trees. PLoS ONE 2019, 14, e0215846. [Google Scholar] [CrossRef] [PubMed]
- Janowiak, M.; Connelly, W.J.; Dante-Wood, K.; Domke, G.M.; Giardina, C.; Kayler, Z.; Marcinkowski, K.; Ontl, T.; Rodriguez-Franco, C.; Swanston, C.; et al. Considering Forest and Grassland Carbon in Land Management; U.S. Department of Agriculture, Forest Service, Washington Office: Washington, DC, USA, 2017; p. WO-GTR-95.
- Tsamir, M.; Gottlieb, S.; Preisler, Y.; Rotenberg, E.; Tatarinov, F.; Yakir, D.; Tague, C.; Klein, T. Stand Density Effects on Carbon and Water Fluxes in a Semi-Arid Forest, from Leaf to Stand-Scale. For. Ecol. Manag. 2019, 453, 117573. [Google Scholar] [CrossRef]
- Khan, M.N.I.; Shil, M.C.; Azad, M.S.; Sadath, M.N.; Feroz, S.M.; Mollick, A.S. Allometric Relationships of Stem Volume and Stand Level Carbon Stocks at Varying Stand Density in Swietenia Macrophylla King Plantations, Bangladesh. For. Ecol. Manag. 2018, 430, 639–648. [Google Scholar] [CrossRef]
- Kirby, K.R.; Potvin, C. Variation in Carbon Storage among Tree Species: Implications for the Management of a Small-Scale Carbon Sink Project. For. Ecol. Manag. 2007, 246, 208–221. [Google Scholar] [CrossRef]
- Rahman, M.M.; Kabir, M.E.; Jahir Uddin Akon, A.S.M.; Ando, K. High Carbon Stocks in Roadside Plantations under Participatory Management in Bangladesh. Glob. Ecol. Conserv. 2015, 3, 412–423. [Google Scholar] [CrossRef]
- Anderson, S.; Knapp, B.O.; Kabrick, J.M. Stand-Density Effects on Aboveground Carbon Dynamics in Secondary Pinus and Quercus Forests of Central USA. For. Sci. 2023, 69, 213–227. [Google Scholar] [CrossRef]
- Schaedel, M.S.; Larson, A.J.; Affleck, D.L.R.; Belote, R.T.; Goodburn, J.M.; Page-Dumroese, D.S. Early Forest Thinning Changes Aboveground Carbon Distribution among Pools, but Not Total Amount. For. Ecol. Manag. 2017, 389, 187–198. [Google Scholar] [CrossRef]
- Pretzsch, H. Density and Growth of Forest Stands Revisited. Effect of the Temporal Scale of Observation, Site Quality, and Thinning. For. Ecol. Manag. 2020, 460, 117879. [Google Scholar] [CrossRef]
- Dybala, K.E.; Steger, K.; Walsh, R.G.; Smart, D.R.; Gardali, T.; Seavy, N.E. Optimizing Carbon Storage and Biodiversity Co-Benefits in Reforested Riparian Zones. J. Appl. Ecol. 2019, 56, 343–353. [Google Scholar] [CrossRef]
- D’Amato, A.W.; Bradford, J.B.; Fraver, S.; Palik, B.J. Effects of Thinning on Drought Vulnerability and Climate Response in North Temperate Forest Ecosystems. Ecol. Appl. 2013, 23, 1735–1742. [Google Scholar] [CrossRef]
- Ferrenberg, S. Landscape Features and Processes Influencing Forest Pest Dynamics. Curr. Landsc. Ecol. Rep. 2016, 1, 19–29. [Google Scholar] [CrossRef]
- Gleason, K.E.; Bradford, J.B.; Bottero, A.; D’Amato, A.W.; Fraver, S.; Palik, B.J.; Battaglia, M.A.; Iverson, L.; Kenefic, L.; Kern, C.C. Competition Amplifies Drought Stress in Forests across Broad Climatic and Compositional Gradients. Ecosphere 2017, 8, e01849. [Google Scholar] [CrossRef]
- Latham, P.; Tappeiner, J. Response of Old-Growth Conifers to Reduction in Stand Density in Western Oregon Forests. Tree Physiol. 2002, 22, 137–146. [Google Scholar] [CrossRef]
- Negrón, J.F.; Fettig, C.J. Mountain Pine Beetle, a Major Disturbance Agent in US Western Coniferous Forests: A Synthesis of the State of Knowledge. For. Sci. 2014, 60, 409–413. [Google Scholar] [CrossRef]
- Hilbert, D.; Roman, L.; Koeser, A.; Vogt, J.; Van Doorn, N. Urban Tree Mortality: A Literature Review. Arboric. Urban For. 2019, 45, 167–200. [Google Scholar] [CrossRef]
- Guide to the Chicago Landscape Ordinance; City of Chicago Office of the Mayor: Chicago, IL, USA, 2000.
- Specifications for Street Tree Planting; City of Oakland, Oakland Public Works Department: Oakland, CA, USA, 2015.
- Strigul, N.; Pristinski, D.; Purves, D.; Dushoff, J.; Pacala, S. Scaling from Trees to Forests: Tractable Macroscopic Equations for Forest Dynamics. Ecol. Monogr. 2008, 78, 523–545. [Google Scholar] [CrossRef]
- Purves, D.W.; Lichstein, J.W.; Strigul, N.; Pacala, S.W. Predicting and Understanding Forest Dynamics Using a Simple Tractable Model. Proc. Natl. Acad. Sci. USA 2008, 105, 17018–17022. [Google Scholar] [CrossRef] [PubMed]
- Dybzinski, R.; Farrior, C.; Wolf, A.; Reich, P.B.; Pacala, S.W. Evolutionarily Stable Strategy Carbon Allocation to Foliage, Wood, and Fine Roots in Trees Competing for Light and Nitrogen: An Analytically Tractable, Individual-Based Model and Quantitative Comparisons to Data. Am. Nat. 2011, 177, 153–166. [Google Scholar] [CrossRef] [PubMed]
- Dybzinski, R.; Farrior, C.E.; Pacala, S.W. Increased Forest Carbon Storage with Increased Atmospheric CO2 despite Nitrogen Limitation: A Game-Theoretic Allocation Model for Trees in Competition for Nitrogen and Light. Glob. Change Biol. 2015, 21, 1182–1196. [Google Scholar] [CrossRef]
- Lichstein, J.W.; Pacala, S.W. Local Diversity in Heterogeneous Landscapes: Quantitative Assessment with a Height-Structured Forest Metacommunity Model. Theor. Ecol. 2011, 4, 269–281. [Google Scholar] [CrossRef]
- Bohlman, S.; Pacala, S. A Forest Structure Model That Determines Crown Layers and Partitions Growth and Mortality Rates for Landscape-Scale Applications of Tropical Forests. J. Ecol. 2012, 100, 508–518. [Google Scholar] [CrossRef]
- Strigul, N.; Florescu, I.; Welden, A.R.; Michalczewski, F. Modelling of Forest Stand Dynamics Using Markov Chains. Environ. Modell. Softw. 2012, 31, 64–75. [Google Scholar] [CrossRef]
- Farrior, C.E.; Tilman, D.; Dybzinski, R.; Reich, P.B.; Levin, S.A.; Pacala, S.W. Resource Limitation in a Competitive Context Determines Complex Plant Responses to Experimental Resource Additions. Ecology 2013, 94, 2505–2517. [Google Scholar] [CrossRef] [PubMed]
- Farrior, C.E.; Dybzinski, R.; Levin, S.A.; Pacala, S.W. Competition for Water and Light in Closed-Canopy Forests: A Tractable Model of Carbon Allocation with Implications for Carbon Sinks. Am. Nat. 2013, 181, 314–330. [Google Scholar] [CrossRef]
- Farrior, C.E.; Rodriguez-Iturbe, I.; Dybzinski, R.; Levin, S.A.; Pacala, S.W. Decreased Water Limitation under Elevated CO2 Amplifies Potential for Forest Carbon Sinks. Proc. Natl. Acad. Sci. USA 2015, 112, 7213–7218. [Google Scholar] [CrossRef]
- Zhang, T.; Lichstein, J.W.; Birdsey, R.A. Spatial and Temporal Heterogeneity in the Dynamics of Eastern US Forests: Implications for Developing Broad-Scale Forest Dynamics Models. Ecol. Model. 2014, 279, 89–99. [Google Scholar] [CrossRef]
- Weng, E.S.; Malyshev, S.; Lichstein, J.W.; Farrior, C.E.; Dybzinski, R.; Zhang, T.; Shevliakova, E.; Pacala, S.W. Scaling from Individual Trees to Forests in an Earth System Modeling Framework Using a Mathematically Tractable Model of Height-Structured Competition. Biogeosciences 2015, 12, 2655–2694. [Google Scholar] [CrossRef]
- Weng, E.; Farrior, C.E.; Dybzinski, R.; Pacala, S.W. Predicting Vegetation Type through Physiological and Environmental Interactions with Leaf Traits: Evergreen and Deciduous Forests in an Earth System Modeling Framework. Glob. Change Biol. 2017, 23, 2482–2498. [Google Scholar] [CrossRef]
- Weng, E.; Dybzinski, R.; Farrior, C.E.; Pacala, S.W. Competition Alters Predicted Forest Carbon Cycle Responses to Nitrogen Availability and Elevated CO2: Simulations Using an Explicitly Competitive, Game-Theoretic Vegetation Demographic Model. Biogeosciences 2019, 16, 4577–4599. [Google Scholar] [CrossRef]
- Erickson, A.; Strigul, N. A Forest Model Intercomparison Framework and Application at Two Temperate Forests Along the East Coast of the United States. Forests 2019, 10, 180. [Google Scholar] [CrossRef]
- Erickson, A.; Strigul, N. Implementation of the Perfect Plasticity Approximation with Biogeochemical Compartments in R. Ecography 2020, 43, 682–688. [Google Scholar] [CrossRef]
- Lines, E.R.; Zavala, M.A.; Ruiz-Benito, P.; Coomes, D.A. Capturing Juvenile Tree Dynamics from Count Data Using Approximate Bayesian Computation. Ecography 2020, 43, 406–418. [Google Scholar] [CrossRef]
- Le Squin, A.; Boulangeat, I.; Gravel, D. Climate-Induced Variation in the Demography of 14 Tree Species Is Not Sufficient to Explain Their Distribution in Eastern North America. Glob. Ecol. Biogeogr. 2021, 30, 352–369. [Google Scholar] [CrossRef]
- Purves, D.W.; Lichstein, J.W.; Pacala, S.W. Crown Plasticity and Competition for Canopy Space: A New Spatially Implicit Model Parameterized for 250 North American Tree Species. PLoS ONE 2007, 2, e870. [Google Scholar] [CrossRef] [PubMed]
- ArcGIS; Pro 2020; Esri Inc.: Redlands, CA, USA, 2020.
- Luyssaert, S.; Inglima, I.; Jung, M.; Richardson, A.D.; Reichstein, M.; Papale, D.; Piao, S.L.; Schulze, E.-D.; Wingate, L.; Matteucci, G.; et al. CO2 Balance of Boreal, Temperate, and Tropical Forests Derived from a Global Database. Glob. Change Biol. 2007, 13, 2509–2537. [Google Scholar] [CrossRef]
- Abrams, M.D. The Red Maple Paradox. BioScience 1998, 48, 355–364. [Google Scholar] [CrossRef]
- Whittaker, R.H.; Likens, G.E. Primary Production: The Biosphere and Man. Hum. Ecol. 1973, 1, 357–369. [Google Scholar] [CrossRef]
- O’Neill, R.V.; De Angelis, D.L. Comparative Productivity and Biomass Relations of Forest Ecosystems. In Dynamic Properties of Forest Ecosystems; Cambridge University Press: Cambridge, UK, 1981; pp. 411–449. ISBN 978-0-521-22508-3. [Google Scholar]
- Raich, J.W.; Russell, A.E.; Kitayama, K.; Parton, W.J.; Vitousek, P.M. Temperature Influences Carbon Accumulation in Moist Tropical Forests. Ecology 2006, 87, 76–87. [Google Scholar] [CrossRef]
- Keeling, H.C.; Phillips, O.L. The Global Relationship between Forest Productivity and Biomass. Glob. Ecol. Biogeogr. 2007, 16, 618–631. [Google Scholar] [CrossRef]
- Pretzsch, H.; Biber, P.; Uhl, E.; Dahlhausen, J.; Rötzer, T.; Caldentey, J.; Koike, T.; van Con, T.; Chavanne, A.; Seifert, T.; et al. Crown Size and Growing Space Requirement of Common Tree Species in Urban Centres, Parks, and Forests. Urban For. Urban Green. 2015, 14, 466–479. [Google Scholar] [CrossRef]
- Scharenbroch, B.C.; Carter, D.; Bialecki, M.; Fahey, R.; Scheberl, L.; Catania, M.; Roman, L.A.; Bassuk, N.; Harper, R.W.; Werner, L.; et al. A Rapid Urban Site Index for Assessing the Quality of Street Tree Planting Sites. Urban For. Urban Green. 2017, 27, 279–286. [Google Scholar] [CrossRef]
- Cai, H.; Di, X.; Chang, S.X.; Jin, G. Stand Density and Species Richness Affect Carbon Storage and Net Primary Productivity in Early and Late Successional Temperate Forests Differently. Ecol. Res. 2016, 31, 525–533. [Google Scholar] [CrossRef]
- Dangal, S.P.; Das, A.K.; Paudel, S.K. Effectiveness of Management Interventions on Forest Carbon Stock in Planted Forests in Nepal. J. Environ. Manag. 2017, 196, 511–517. [Google Scholar] [CrossRef]
- Hudiburg, T.; Law, B.; Turner, D.P.; Campbell, J.; Donato, D.; Duane, M. Carbon Dynamics of Oregon and Northern California Forests and Potential Land-Based Carbon Storage. Ecol. Appl. 2009, 19, 163–180. [Google Scholar] [CrossRef]
- He, L.; Chen, J.M.; Pan, Y.; Birdsey, R.; Kattge, J. Relationships between Net Primary Productivity and Forest Stand Age in U.S. Forests. Glob. Biogeochem. Cycles 2012, 26, 394–415. [Google Scholar] [CrossRef]
- Arseniou, G.; MacFarlane, D.; Calders, K.; Baker, M. Accuracy Differences in Aboveground Woody Biomass Estimation with Terrestrial Laser Scanning for Trees in Urban and Rural Forests and Different Leaf Conditions. Trees 2023, 37, 3. [Google Scholar] [CrossRef]
- McHale, M.R.; Burke, I.C.; Lefsky, M.A.; Peper, P.J.; McPherson, E.G. Urban Forest Biomass Estimates: Is It Important to Use Allometric Relationships Developed Specifically for Urban Trees? Urban Ecosyst. 2009, 12, 95–113. [Google Scholar] [CrossRef]
- Nowak, D.; Stevens, J.; Sisinni, S.; Luley, C. Effects of Urban Tree Management and Species Selection on Atmospheric Carbon Dioxide. J. Arboric. 2002, 28, 113–122. [Google Scholar] [CrossRef]
- Hauer, R.J.; Vogt, J.M.; Fischer, B.C. The Cost of Not Maintaining the Urban Forest. Arborist News 2015, 24, 12–17. [Google Scholar]
- Carmichael, C.E.; McDonough, M.H. Community Stories: Explaining Resistance to Street Tree-Planting Programs in Detroit, Michigan, USA. Soc. Nat. Resour. 2019, 32, 588–605. [Google Scholar] [CrossRef]
- Riedman, E.; Roman, L.A.; Pearsall, H.; Maslin, M.; Ifill, T.; Dentice, D. Why Don’t People Plant Trees? Uncovering Barriers to Participation in Urban Tree Planting Initiatives. Urban For. Urban Green. 2022, 73, 127597. [Google Scholar] [CrossRef]
- Gerrish, E.; Watkins, S.L. The Relationship between Urban Forests and Income: A Meta-Analysis. Landsc. Urban Plan. 2018, 170, 293–308. [Google Scholar] [CrossRef] [PubMed]
- Schwarz, K.; Fragkias, M.; Boone, C.G.; Zhou, W.; McHale, M.; Grove, J.M.; O’Neil-Dunne, J.; McFadden, J.P.; Buckley, G.L.; Childers, D.; et al. Trees Grow on Money: Urban Tree Canopy Cover and Environmental Justice. PLoS ONE 2015, 10, e0122051. [Google Scholar] [CrossRef]
- Iverson, L.R. Urban Forest Cover of the Chicago Region and Its Relation to Household Density and Income. Urban Ecosyst. 2000, 4, 105–124. [Google Scholar] [CrossRef]
- Heynen, N.; Perkins, H.A.; Roy, P. The Political Ecology of Uneven Urban Green Space: The Impact of Political Economy on Race and Ethnicity in Producing Environmental Inequality in Milwaukee. Urban Aff. Rev. 2006, 42, 3–25. [Google Scholar] [CrossRef]
- Pham, T.-T.-H.; Apparicio, P.; Séguin, A.-M.; Landry, S.; Gagnon, M. Spatial Distribution of Vegetation in Montreal: An Uneven Distribution or Environmental Inequity? Landsc. Urban Plan. 2012, 107, 214–224. [Google Scholar] [CrossRef]
- Landry, S.M.; Chakraborty, J. Street Trees and Equity: Evaluating the Spatial Distribution of an Urban Amenity. Environ. Plan. A 2009, 41, 2651–2670. [Google Scholar] [CrossRef]
- Jenkins, J.C.; Chojnacky, D.C.; Heath, L.S.; Birdsey, R.A. National-Scale Biomass Estimators for United States Tree Species. For. Sci. 2003, 49, 12–35. [Google Scholar]
- McPherson, E.G.; van Doorn, N.S.; Peper, P.J. Urban Tree Database and Allometric Equations; U.S. Department of Agriculture, Forest Service, Pacific Southwest Research Station: Albany, CA, USA, 2016; p. PSW-GTR-253.
Figure 1.
Visualization of optimization point. Carbon storage increases at low densities, then reaches the optimization point and saturates as density continues increasing.
Figure 1.
Visualization of optimization point. Carbon storage increases at low densities, then reaches the optimization point and saturates as density continues increasing.

Figure 2.
Carbon storage (kg/m2) across a gradient of stand density (trees/hectare). Each panel (a–h) represents results from a set of simulation runs with particular levels of three mechanisms: overall productivity, crown allometry relative to stem diameter, and mortality rate, as described on the panel. All simulations ran to 100 years with 10 replicates of each density. The colors of the bars correspond to the year: orange = 12, green = 25, blue = 50, and purple = 100. Striping on a bar indicates that the canopy is closed at that particular year and density. Within a given panel, the presence of a dot above a bar shows that the carbon storage value of that density and time is at its maximum and is statistically indistinguishable from other dotted bars within that panel.

Figure 3.
Carbon sequestration (kg/m2/year) across a gradient of stand density (trees/hectare). Each panel (a–h) represents results from a set of simulation runs with particular levels of three mechanisms: overall productivity, crown allometry relative to stem diameter, and mortality rate, as described on the panel. All simulations ran to 100 years with 10 replicates of each density. The colors of the bars correspond to the year: orange = 12, green = 25, blue = 50, and purple = 100. Striping on a bar indicates that the canopy is closed at that particular year and density. Within a given panel, the presence of a dot above a bar shows that the carbon sequestration value of that density and time is at its maximum and is statistically indistinguishable from other dotted bars within that panel.

Figure 4.
The carbon storage (kg/m2) across plot densities in 10 U.S. cities, each represented in separate panels (a–j). Each data point represents a unique plot within the given city, and the line in each graph is a spline with degrees of freedom 4 that measures the average carbon storage across density.

Disclaimer/Publisher’s Note: The statements, opinions and data contained in all publications are solely those of the individual author(s) and contributor(s) and not of MDPI and/or the editor(s). MDPI and/or the editor(s) disclaim responsibility for any injury to people or property resulting from any ideas, methods, instructions or products referred to in the content. |
© 2023 by the authors. Licensee MDPI, Basel, Switzerland. This article is an open access article distributed under the terms and conditions of the Creative Commons Attribution (CC BY) license (https://creativecommons.org/licenses/by/4.0/).
Share and Cite
MDPI and ACS Style
Drolen, J.; Brandt, L.; Wei, Y.; Dybzinski, R. Modeling Management-Relevant Urban Forest Stand Characteristics to Optimize Carbon Storage and Sequestration. Forests 2023, 14, 2207. https://doi.org/10.3390/f14112207
AMA Style
Drolen J, Brandt L, Wei Y, Dybzinski R. Modeling Management-Relevant Urban Forest Stand Characteristics to Optimize Carbon Storage and Sequestration. Forests. 2023; 14(11):2207. https://doi.org/10.3390/f14112207
Chicago/Turabian StyleDrolen, Jenna, Leslie Brandt, Yanning Wei, and Ray Dybzinski. 2023. "Modeling Management-Relevant Urban Forest Stand Characteristics to Optimize Carbon Storage and Sequestration" Forests 14, no. 11: 2207. https://doi.org/10.3390/f14112207
Note that from the first issue of 2016, this journal uses article numbers instead of page numbers. See further details here.