Article

Quantitative Characterization of Excess Pressure Gradient in the Upper Interval of Es4 Member of Dongying Depression and Its Indicative Significance for Oil Migration and Accumulation

1
Key Laboratory of Tectonics and Petroleum Resources, Ministry of Education, China University of Geosciences (Wuhan), Wuhan 430074, China
2
Research Institute of Exploration and Development, Sinopec Shengli Oilfield Company, Dongying 257015, China
*
Author to whom correspondence should be addressed.
Energies 2022, 15(10), 3554; https://doi.org/10.3390/en15103554
Submission received: 12 March 2022 / Revised: 5 May 2022 / Accepted: 11 May 2022 / Published: 12 May 2022
(This article belongs to the Section H1: Petroleum Engineering)

Abstract

:
Excess pressure is the main driving force of oil migration in the source-reservoir system of overpressured petroliferous basins. It can reflect the change in driving force for oil migration and its influence on oil accumulation in overpressure transport layers. The drilling stem test (DST) data, well logging data, and seismic velocity data are used to describe the plane distribution of the excess pressures in the Es4s member of the Dongying Depression. Then, the values and directions of the excess pressure gradient, which can indicate oil migration and accumulation, are calculated based on the plane distribution of the excess pressure in the Es4s member of the Dongying Depression. The results suggest that overpressure is widely developed in the Es4s member of the Dongying Depression, and the excess pressure gradually decreases from the center to the edge of each sag, while the variation in the excess pressure gradient is characterized by “low-high-low” in a circular band around the sags. The excess pressure in the sag areas exceeds 15 MPa, but the excess pressure gradient is mainly between 0 and 1 MPa/km. The excess pressure in the northern steep slope zone of the Lijin sag and the northern steep slope zone of the Minfeng sag are less than 15 MPa, while the excess pressure gradient ranges from 1 to 7 MPa/km. The excess pressure in the central anticline belt and the gentle slope belt in the south of the Niuzhuang sag are between 0 and 15 MPa, and the excess pressure gradient is from 0 MPa/km to 2 MPa/km. From geochemical evidence, local oil migration directions indicated by the excess pressure gradient are consistent with those indicated by the ratio parameters of carbazole compounds in crude oil samples, indicating that the direction of the excess pressure gradient can indicate the dominant direction of oil migration driven by excess pressure, and the oil from the Es4s source rock is mainly distributed in the areas with a high excess pressure gradient or the areas with a low excess pressure gradient and low excess pressure (area II).

1. Introduction

Overpressure is widely developed in petroliferous basins [1,2,3]. The driving force of oil migration in overpressured petroliferous basins has always been important content of petroleum geology research [4], and it is also a difficult point of oil and gas accumulation research [5,6]. Bethke (1991) proposed that overpressure was the main driving force for oil and gas migration in the Illinois Basin [7]. Schegg (1999) believed that overpressure was more important than buoyancy in driving oil and gas migration [8]. Hubbert (1959) defined the sum of the mechanical energy per unit mass of fluid as the fluid potential [9], and it can be calculated as follows:
= 0 P d P ρ + g z + 1 2 q 2
where is the fluid potential (mechanical energy per unit mass of fluid), kg*m2/s2; P is the pore pressure of the measuring point, MPa; ρ is the density of the pore fluid, g/cm3; g is the acceleration of gravity, 9.8 m/s2; z is the elevation from the measuring point to the reference plane, m; q is the flow velocity of pore fluid, m/s. It can be seen that the fluid potential mainly consists of three parts: pressure energy, potential energy, and kinetic energy. Due to the slow flow velocity of oil and gas in the formation, the kinetic energy can be ignored, and the compressibility of the pore fluid in the formation is finite, so the density of the pore fluid can be regarded as a constant. That means the fluid potential can be calculated as:
= P ρ + g z
According to the second law of thermodynamics, oil and gas spontaneously flow from the high-potential area to the low-potential area. Based on Formula (2), oil and gas spontaneously flow from the areas with high excess pressure to the areas with low excess pressure if they are at the same depth. That means that the change in excess pressure controls oil and gas migration. Early research on the driving force of oil and gas migration mainly used the plane distribution map of the excess pressure to qualitatively describe the excess pressure variations. Feng et al. (2019) proposed the plane pressure decrease gradient in the Bonan sag of the Zhanhua Depression and explained the variation characteristics of the oil and gas migration model under the control of overpressure [10]. Liu et al. (2020) calculated the excess pressure gradient of the third member of the Shahejie Formation in the Bonan sag and analyzed the variation in the excess pressure gradient and its influence on the distribution of oil and gas [11]. However, few studies have noted the directional characteristics of the excess pressure gradient and its indicating significances on oil and gas migration. In addition, it is challenging to choose a reasonable step size when calculating the excess pressure gradient. In this paper, a new method is proposed to calculate the excess pressure gradient. We hope to obtain the direction and value of the excess pressure gradient, and, based on the results of the excess pressure gradient, we expect to explain the control on oil and gas migration and accumulation of the excess pressure gradient.
Previous studies have reported the significance of abnormal overpressure in the upper interval of the Es4 member of the Dongying Depression and the excess pressure range from 5.6 MPa to 30.9 MPa [1,12,13,14]. However, there are no publications concerning the excess pressure gradient in Dongying Depression at present. In this paper, the new method is used to calculate the excess pressure gradient in upper interval of the Es4 member, Dongying Depression. Furthermore, we expect to explain the relationship between the excess pressure gradient and the oil fields that are from Es4s source rocks.

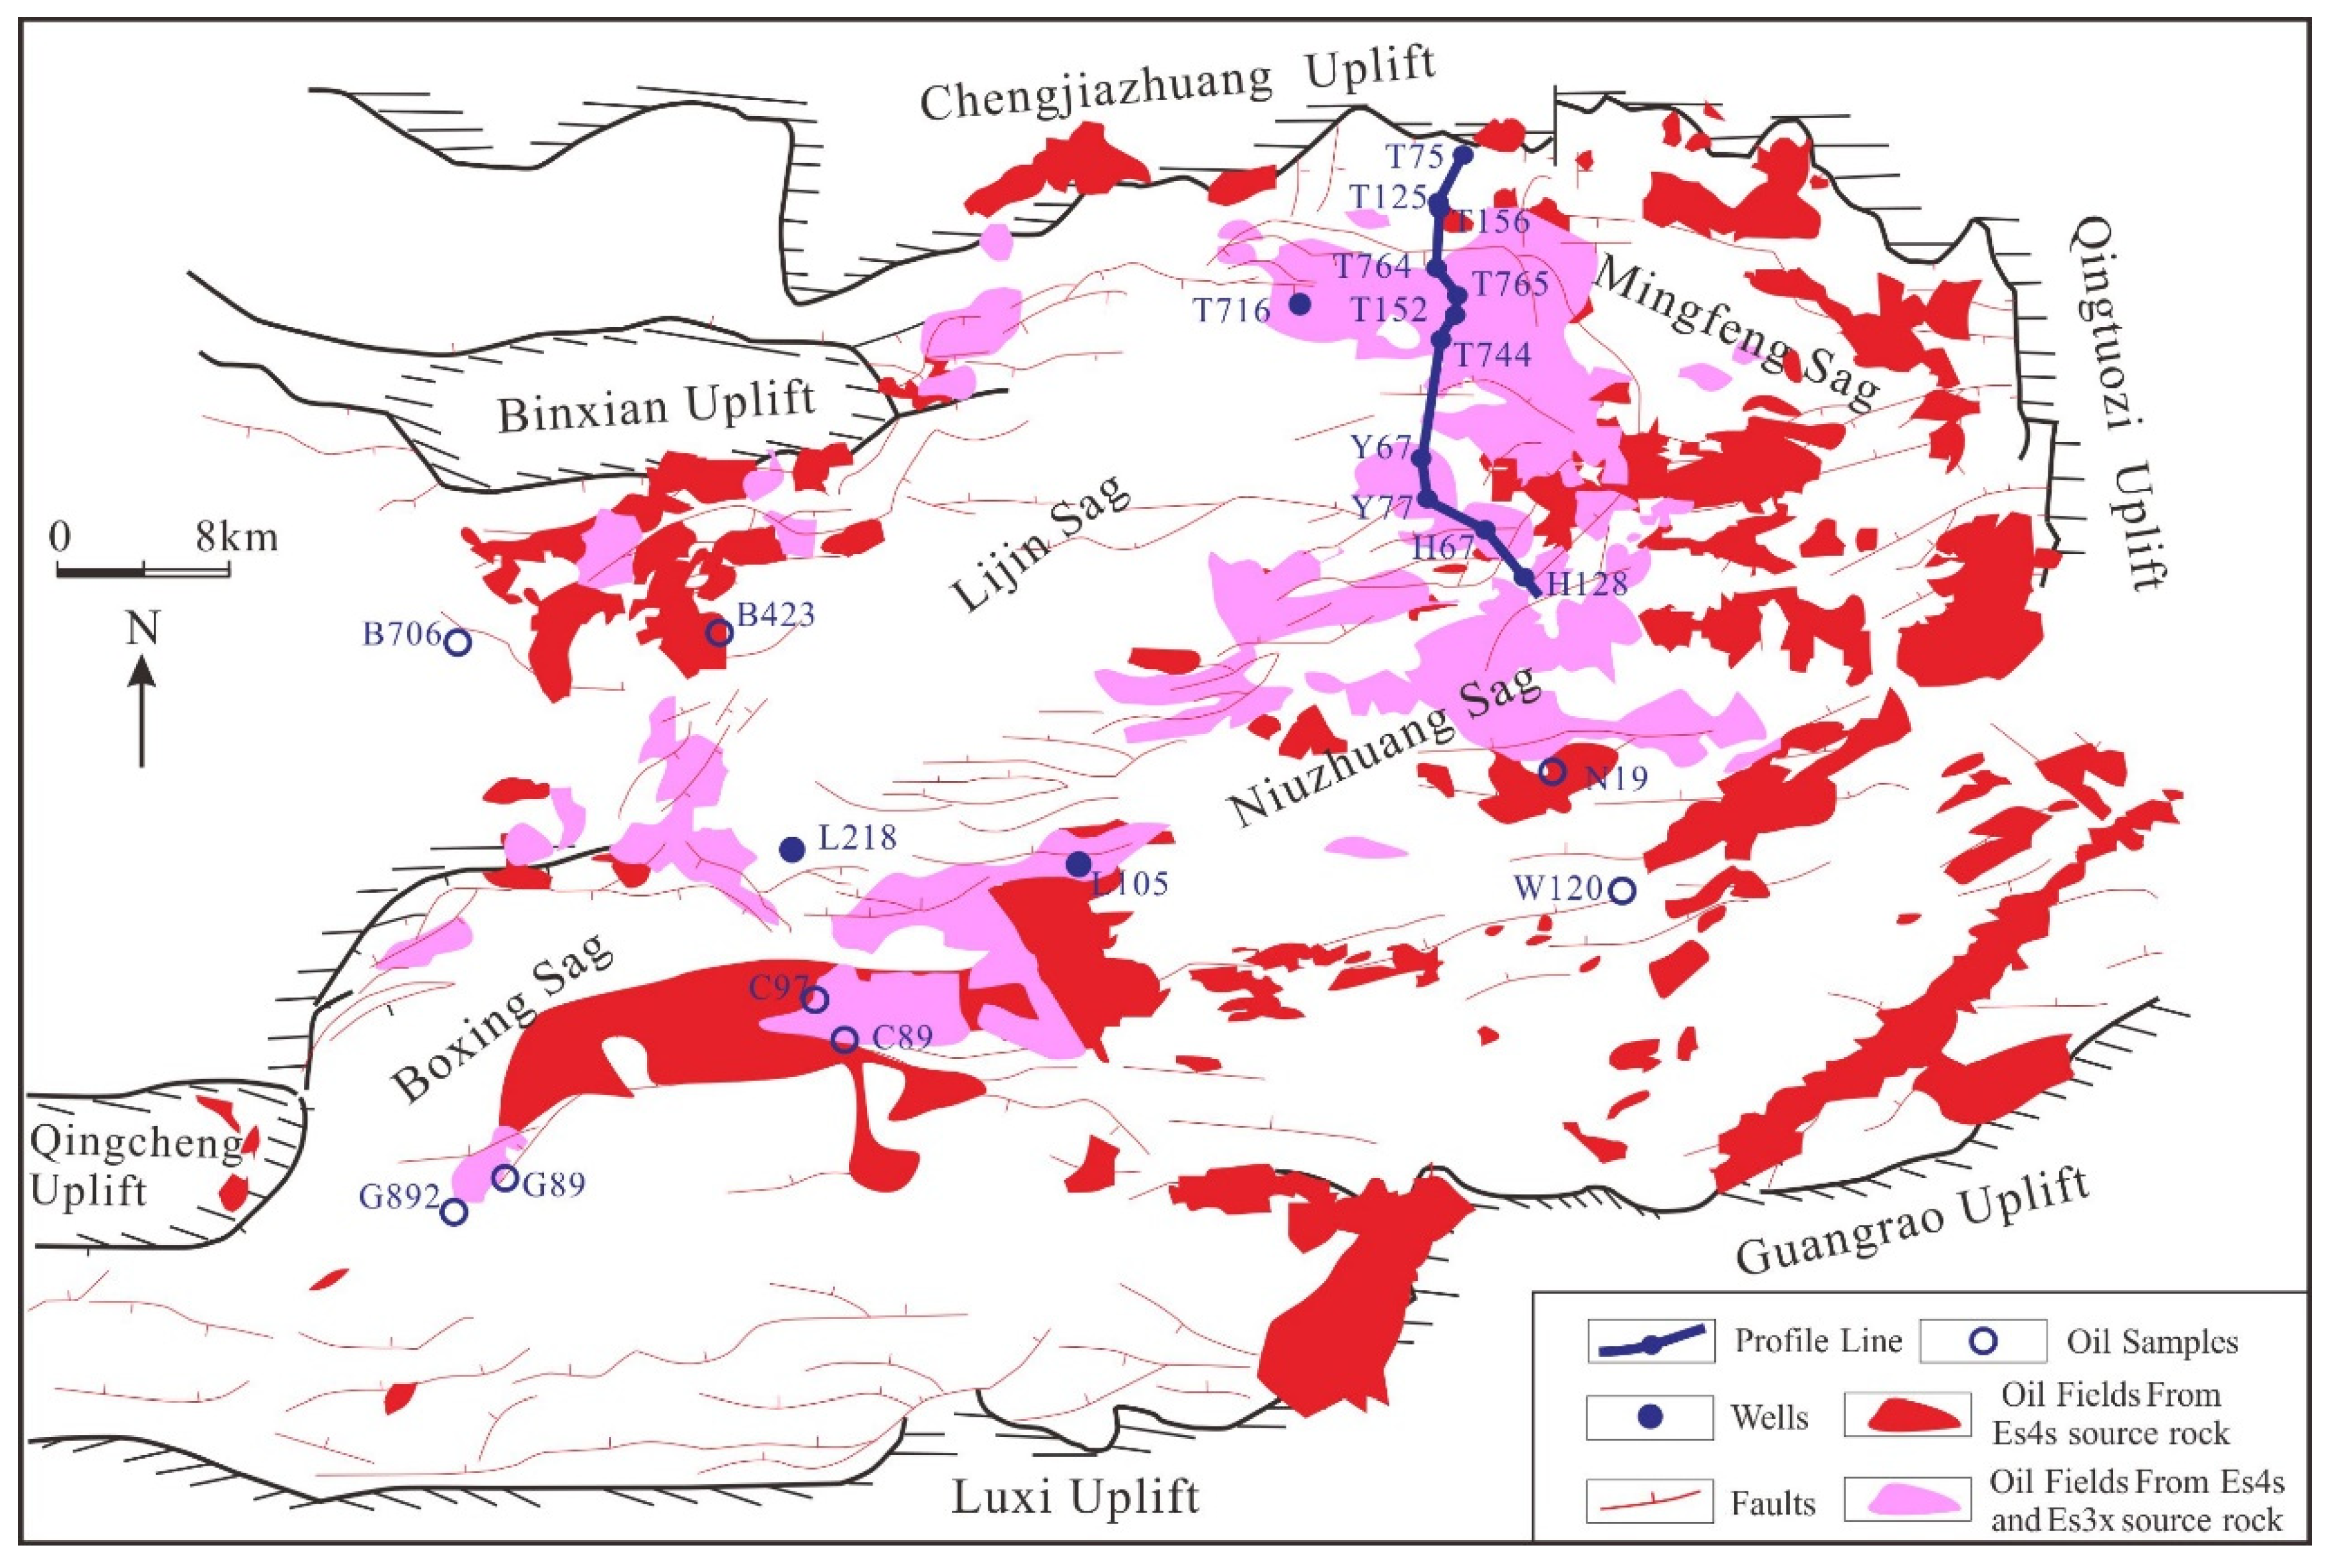
2. Geological Setting

The Dongying Depression is located in the East of China and is part of the Bohai Bay Basin. The Dongying Depression is NE–SW trending with an area of about 5700 km2. The depression is adjacent to Qingtuozi Uplift in the east, connected to Guanggrao Uplift and Luxi Uplift in the south, bounded by Qingcheng-Binxian Uplift in the west, and terminated at Chenjiazhuang Uplift in the north. Four groups of faults with different trending can be distinguished in the Dongying Depression: East–West (EW), North East–East to (NEE), North West–West (NWW), and North East (NE). The Dongying Depression consists of the Mingfeng Sag, Lijin Sag, Niuzhuang Sag, Boxing Sag, Northern Steep Slope zone, Southern Ramp zone, and Central Anticline Belt (Figure 1) [15,16]. The basement of the Dongying Sag is Archaean and Paleozoic, and the sedimentary cover is Mesozoic and Cenozoic. The dark mudstones in the lower interval of the third member of the Paleogene Shahejie Formation (Es3x) and the upper interval of the fourth member of the Paleogene Shahejie Formation (Es4s) are the main source rocks in the study area with a total organic content (TOC) of 0.5–3.6% [1,17]. The thickness of the Es4s member in the Dongying Depression is about 344 m. The thickness of mudstones in the Es4s member ranges from 0 m to 172 m with an average of 58.92 m, while thickness of the sandstone reservoirs in the Es4s member ranges from 0 m to 322 m with an average of 273.24 m. In addition, the average ratios of mudstones and sandstone in the Es4s member account for 79.43% and 17.13%, respectively. The muddy source rocks interbedded with sandstone reservoirs are the most important petroleum system [14]. The sandstone lithology is mainly fine sandstone. The basement fractured metamorphic rocks, Mesozoic conglomerates, and Cenozoic sandstones are important reservoirs in the study area, and the mudstones of the First member of the Shahejie Formation of the Paleogene and the Minghuazhen Formation of the Neogene are stable regional cap rocks in the study area (Figure 2). The exploration results show that there are many types of reservoirs in the Dongying Depression, including the structural reservoir, stratigraphic lithologic reservoir, and structure-stratigraphic lithologic compound reservoir [13,14]. A large amount of drill-stem test data (DST) show that a large-scale overpressure is developed in Es4 and Es3 of the Dongying Depression, and the maximum measured pore pressure coefficient (the pore pressure coefficient is the ratio of pore pressure and hydrostatic pressure) of the Es4s member can reach 1.99.
The Dongying Depression experienced two periods of oil charging. The early oil charging occurred during the deposition period of the Dongying Formation (30–25 Ma) [18,19], dominated by low-mature oil, and the late oil charging occurred from the late deposition of the Guantao Formation to the present (10–0 Ma), which was the main accumulation period of the Dongying Sag [20,21]. Well L218 is located in the south of the Central Anticline zone in the Dongying Depression (Figure 1). The sandstone sample from 3656.3 m in the Es4s member was investigated using an integrated fluid inclusion workflow. The results showed that the average homogenization temperature of oil inclusions in the sandstone sample is 99.35 °C, and the average homogenization temperature of associated aqueous inclusions is 135.6 °C. On the basis of the burial–thermal maturation history of the well, it can be seen that the time of the period of oil charge was around 4 Ma (Figure 3). The current vitrinite reflectance (Ro, %) of source rocks in Es4s ranges from 0.65% to 1.30%, which is still in the stage of massive oil generation [1]. The late period of overpressure in the Es4s member was mainly caused by oil generation [1,12,22]. Therefore, the current pressure distribution in the Es4s member of the Dongying Depression can approximately represent the pressure distribution during the late period of oil charge.

3. Samples and Methods

3.1. Samples and Carbazole Analysis

Oil samples from eight wells in the Es4s member were collected for carbazole analysis to define the main oil migration pathways (Figure 1 and Table 1). N-hexane was used to precipitate the asphaltene and a chromatographic column was used to fractionate saturates, aromatics, and polar compounds. The chromatographic column consisted of silica gel and alumina with a ratio of 3:2 in volume. The silica gel must be activated by heating at 150 °C for 8 h in an oven, and the alumina would be activated by heating in a muffle furnace for 4 h with 400 °C. The saturated hydrocarbons were separated by sequential elution of n-hexane; the aromatic hydrocarbons were separated by the admixed dichloromethane and n-hexane admixture (ratio of 2:1 in volume); the polar compounds were separated by a chloroform and methanol solution admixture (ratio of 98:2 in volume). The amounts of n-hexane, the admixed dichloromethane and n-hexane admixture, and the chloroform and methanol solution admixture used in the measurement were 50 mL, 50 mL, and 30 mL, respectively. Carbazoles were separated from the resins on a chromatographic column (4 g of silicic acid) and eluted by the admixed n-hexane and toluene solution with a ratio of 1:1 in volume [23]. The 9-phenylcarbazole was added to the carbazoles to quantify the concentrations of carbazoles before performing GC–MS analysis, and the peak-area ratio method was used to calculate the concentrations of selected individual compounds.
The carbazoles were analyzed at the Key Laboratory of Tectonics and Petroleum Resources Ministry of Education, China by a gas chromatograph (Agilent 7890A), coupled with a mass spectrometer (GC-MS), equipped with a fused silica capillary column (DB-5MS 60 m × 0.25 mm × 0.25 μm). The carrier gas was helium (purity > 99.995%) and the inject rate of carrier gas was 1.0 mL/min. The experimental temperature during the test was kept at 50 °C for 1 min, and then increased up to 100 °C at a rate of 20 °C/min, up to 315 °C at a rate of 3 °C/min, and eventually remained at 315 °C for 31.8 min. The ion monitoring (SIM) mode was selected for the mass spectrometer at an electron impact of 70 eV during the test.

3.2. Homogenization Temperature of Oil and Aqueous Inclusions

The sandstone sample from Well L218 at 3656.3 m in the Es4s member was made into doubly polished sections at a thickness about 100 μm for fluid inclusion analysis. The homogenization temperature (Th) of oil and aqueous inclusions was carried out using a calibrated Linkam TH-600 stage equipped with a Zeiss Axiovert 200 microscope in the Key Laboratory of Tectonics and Petroleum Resources Ministry of Education, China University of Geosciences (Wuhan). The Th was measured at a heating rate of 10 °C/min to 60 °C and then at a heating rate of 5 °C/min. The measured temperature precision for Th was ±1 °C.

3.3. Drill-Stem Test Data

In this paper, a total of 592 drill-stem test data from 426 wells of the Es4s member in the Dongying Depression were collected from the Research Institute of Exploration and Development, Sinopec Shengli Oilfield Company. In order to avoid the invalid data influenced by seal failures, the drill-stem test data were carefully checked by combining mud weight log.

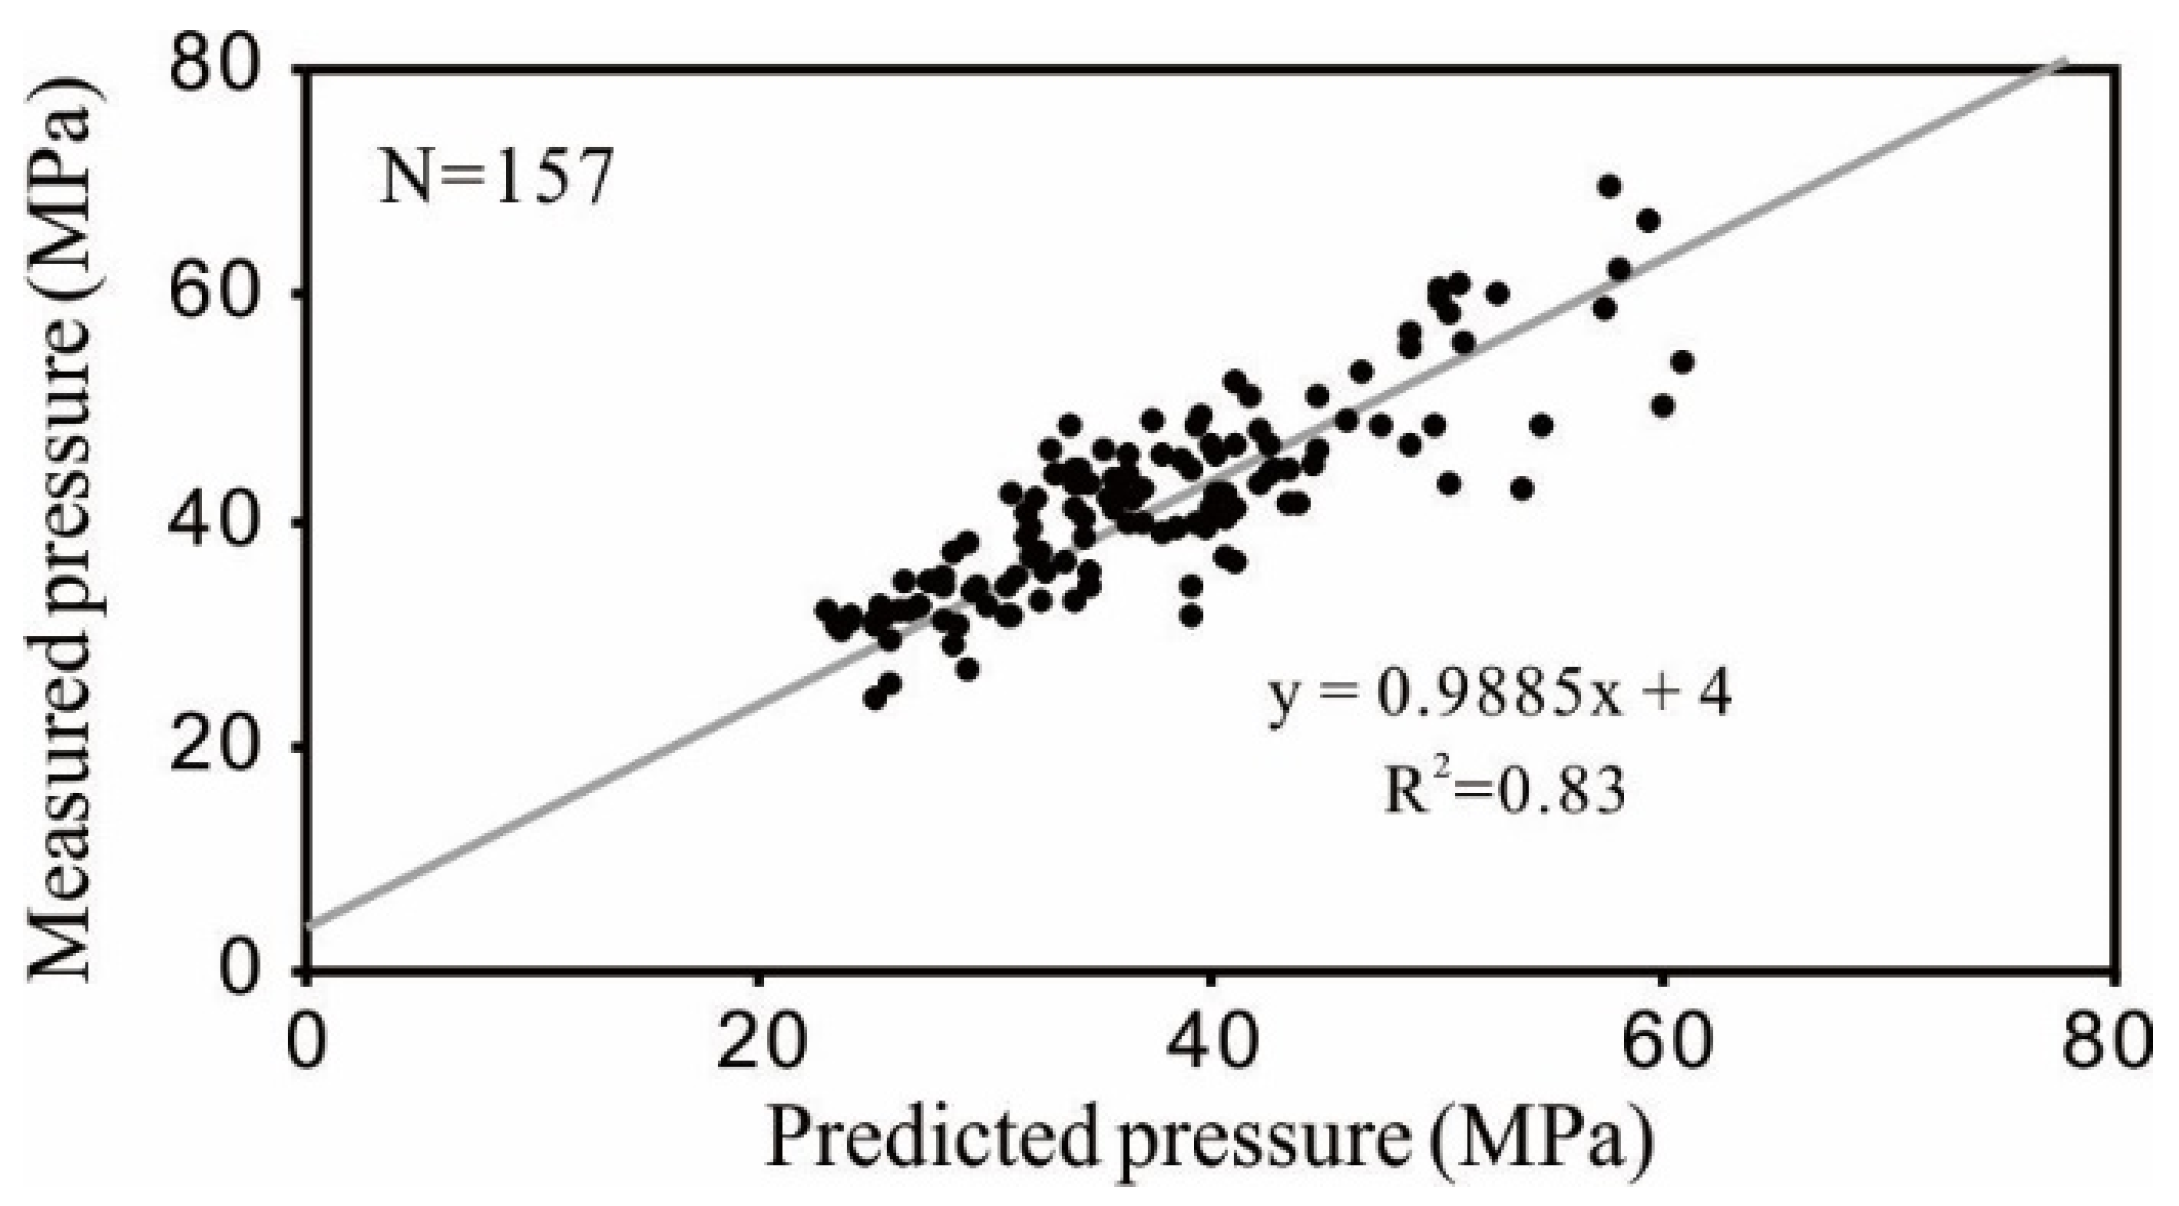
3.4. Excess Pressure Prediction Using Well Log Data

Excess pressure is the difference between pore pressure and hydrostatic pressure:
Δ P = P p P h
where Δ P is the excess pressure, MPa; P p is the pore pressure, MPa; P h is the hydrostatic pressure, MPa. Previous studies have suggested that the overpressure generated by different mechanisms should be predicted in different methods [24]. The overpressure in the Dongying Depression is mainly caused by oil generation from the source rocks [1,25], while compaction disequilibrium may have contributed to the overpressure in the north Steep Slope zone of the Dongying Depression [26,27]. Thus, the pore pressure can be calculated by the Eaton Formula [28,29]:
P p = P r ( P r P h ) ( Δ t n Δ t i ) N
P h = ρ w g h
where P r is the vertical stress loaded by overlying strata, MPa; Δ t n is the acoustic travel time under the normal compaction trend, μs/m; Δ t i is the observed acoustic travel time from the well log, μs/m; N is an exponent, N = 2.3 in this paper; ρ w is the pore fluid density, g/cm3; h is the depth of investigation, m.
Therefore, pore pressure can be calculated by Formulas (4) and (5). The pore pressure calculated by Formula (4) must be corrected by the measured pore pressure before putting it into Formula (3). In this paper, a total of 110 wells were collected to calculate the pore pressure. A total of 158 measured pore pressures in the Es4s member were collected to correct the predicted pore pressure in adjacent mudstones. The plot of measured pore pressure versus predicted pore pressures indicates that the predicted pore pressures calculated by Formula (4) matched well with the measured pore pressure (Figure 4). It reliably predicted pore pressures calculated by the Eaton Formula with N = 2.3. Furthermore, the fitting curve can be used to correct the predicted pore pressures. The correction formula can be inferred as:
P p = 0.9885 P p + 4
where P p is the predicted pore pressure after correction, MPa. Then, the predicted pore pressure after correction was put into Formula (3), and we obtained the excess pressure.

3.5. Excess Pressure Gradient

The excess pressure gradient is defined as the variation in the value of excess pressure per unit distance in a specified direction, and in this direction, the excess pressure changes the fastest. The excess pressure gradient is a vector with both magnitude and direction, and it can be calculated as:
G p = d P x d x + d P y d y + d P z d z
where G p is the excess pressure gradient, MPa/km; d P x ,   d P y ,   and   d P z are the variations in excess pressure in the directions of X, Y, and Z, respectively, MPa/km; d x ,     d y ,   and   d z are the variations in distance in the direction of X, Y, and Z, respectively, km.
The excess pressure gradient calculation in three-dimensional space is difficult to achieve at present because of the lack of continuous three-dimensional excess pressure data. In this paper, the plane distribution of excess pressure in the Es4s member with the contour map was used to calculate the excess pressure gradient in the two-dimensional plane. The pressure system consists of continuously distributed particles, and each particle has a unique excess pressure value (Figure 5). As shown in Figure 5, the particle O has eight potential directions for the gradient calculation. Each direction can obtain a value of the excess pressure gradient. Then, the direction with the maximum value is the direction of the excess pressure gradient and the maximum value is the magnitude of the excess pressure gradient, such as the excess pressure gradient between O and e in Figure 5. The excess pressure gradient can be shown in the form of arrows. In this paper, the calculation of the excess pressure gradient in arrows was carried out on the Grid Vector Map in Surfer. The direction and the length of the arrow represent the direction and the magnitude of the excess pressure gradient, respectively. The length of the arrows was digitized and converted into the magnitude of the excess pressure gradient. The magnitude of the excess pressure gradient of each particle can be shown in the form of a contour map.

4. Results and Discussions

4.1. Drill Stem Tests

More than 590 measured pore pressure points of the Es4s member sandstone from 426 exploratory wells were collected to investigate the distribution of overpressure in the Dongying Depression. The profiles of pore pressures, excess pressure, and pressure coefficients versus depths in the Es4s member are presented in Figure 4. According to the profiles of pore pressures, excess pressure, and pressure coefficients versus depths, the overpressure occurred from 2100 m. The excess pressure was over 10 MPa when the depth reached 2600 m and the excess pressure exceeded 20 MPa when the depth reached 3100 m (Figure 6). The maximum excess pressure at the depth of 3574.5 m (Well L98) was 30.93 MPa, while the pore pressure was 66.67 MPa.

4.2. Excess Pressure

4.2.1. Well-Log Responses to Overpressure

The drill stem test (DST) can directly measure pore pressure in sandstones, while the mudstones cannot be directly measured, because of their low permeability. Therefore, the pore pressure in mudstones is commonly estimated based on well-log data. Well-log data from more than 300 wells were investigated. The acoustic travel time, resistivity log, and density log were used to analyze the differences between the overpressured and normally pressured regimes. Two representative wells, which were located on different structural zones in the Dongying Depression (Figure 1), were analyzed for their well-log responses to overpressure (Figure 7). Well T716 was located north of the Lijing Sag with a drilling depth at 3555 m. Well L105 was located south of the Central Anticline Belt with a drilling depth at 3216 m. Drill stem tests of Well T716 showed that the pore pressures were 53.38 MPa (3171 m), 56.96 MPa (3335 m), and 62.32 MPa (3486.5 m) and the corresponding excess pressures were 21.67 MPa, 23.61 MPa, and 27.45 MPa, respectively. Drill stem tests of Well L105 at depths of 3148.3 m and 3158.1 m were 40.52 MPa and 48.61 MPa, while the corresponding excess pressures were 8.92 MPa and 17.11 MPa, respectively. The measured pore pressure (DST) and pore pressure calculated by mud weights showed that the top of overpressure of Well T716 began at 2200 m and the top of overpressure of Well L105 began at 2700 m.
According to the well-log data, we suggest that the acoustic travel time is a reliable well-log response to overpressure in the Dongying Depression. The mudstones under the top of overpressure had a higher acoustic travel time than the normally pressured mudstones at a given depth, while the resistivity log and density log had no obvious indication of overpressure in the Dongying Depression (Figure 7). The varying trends of the acoustic travel time versus depths was different between normally pressured mudstones and overpressured mudstones. The acoustic travel time of normally pressured mudstones decreased with depth, while the acoustic travel time of overpressured mudstones increased with depth at the upper interval and then decreased with depth at the lower interval.

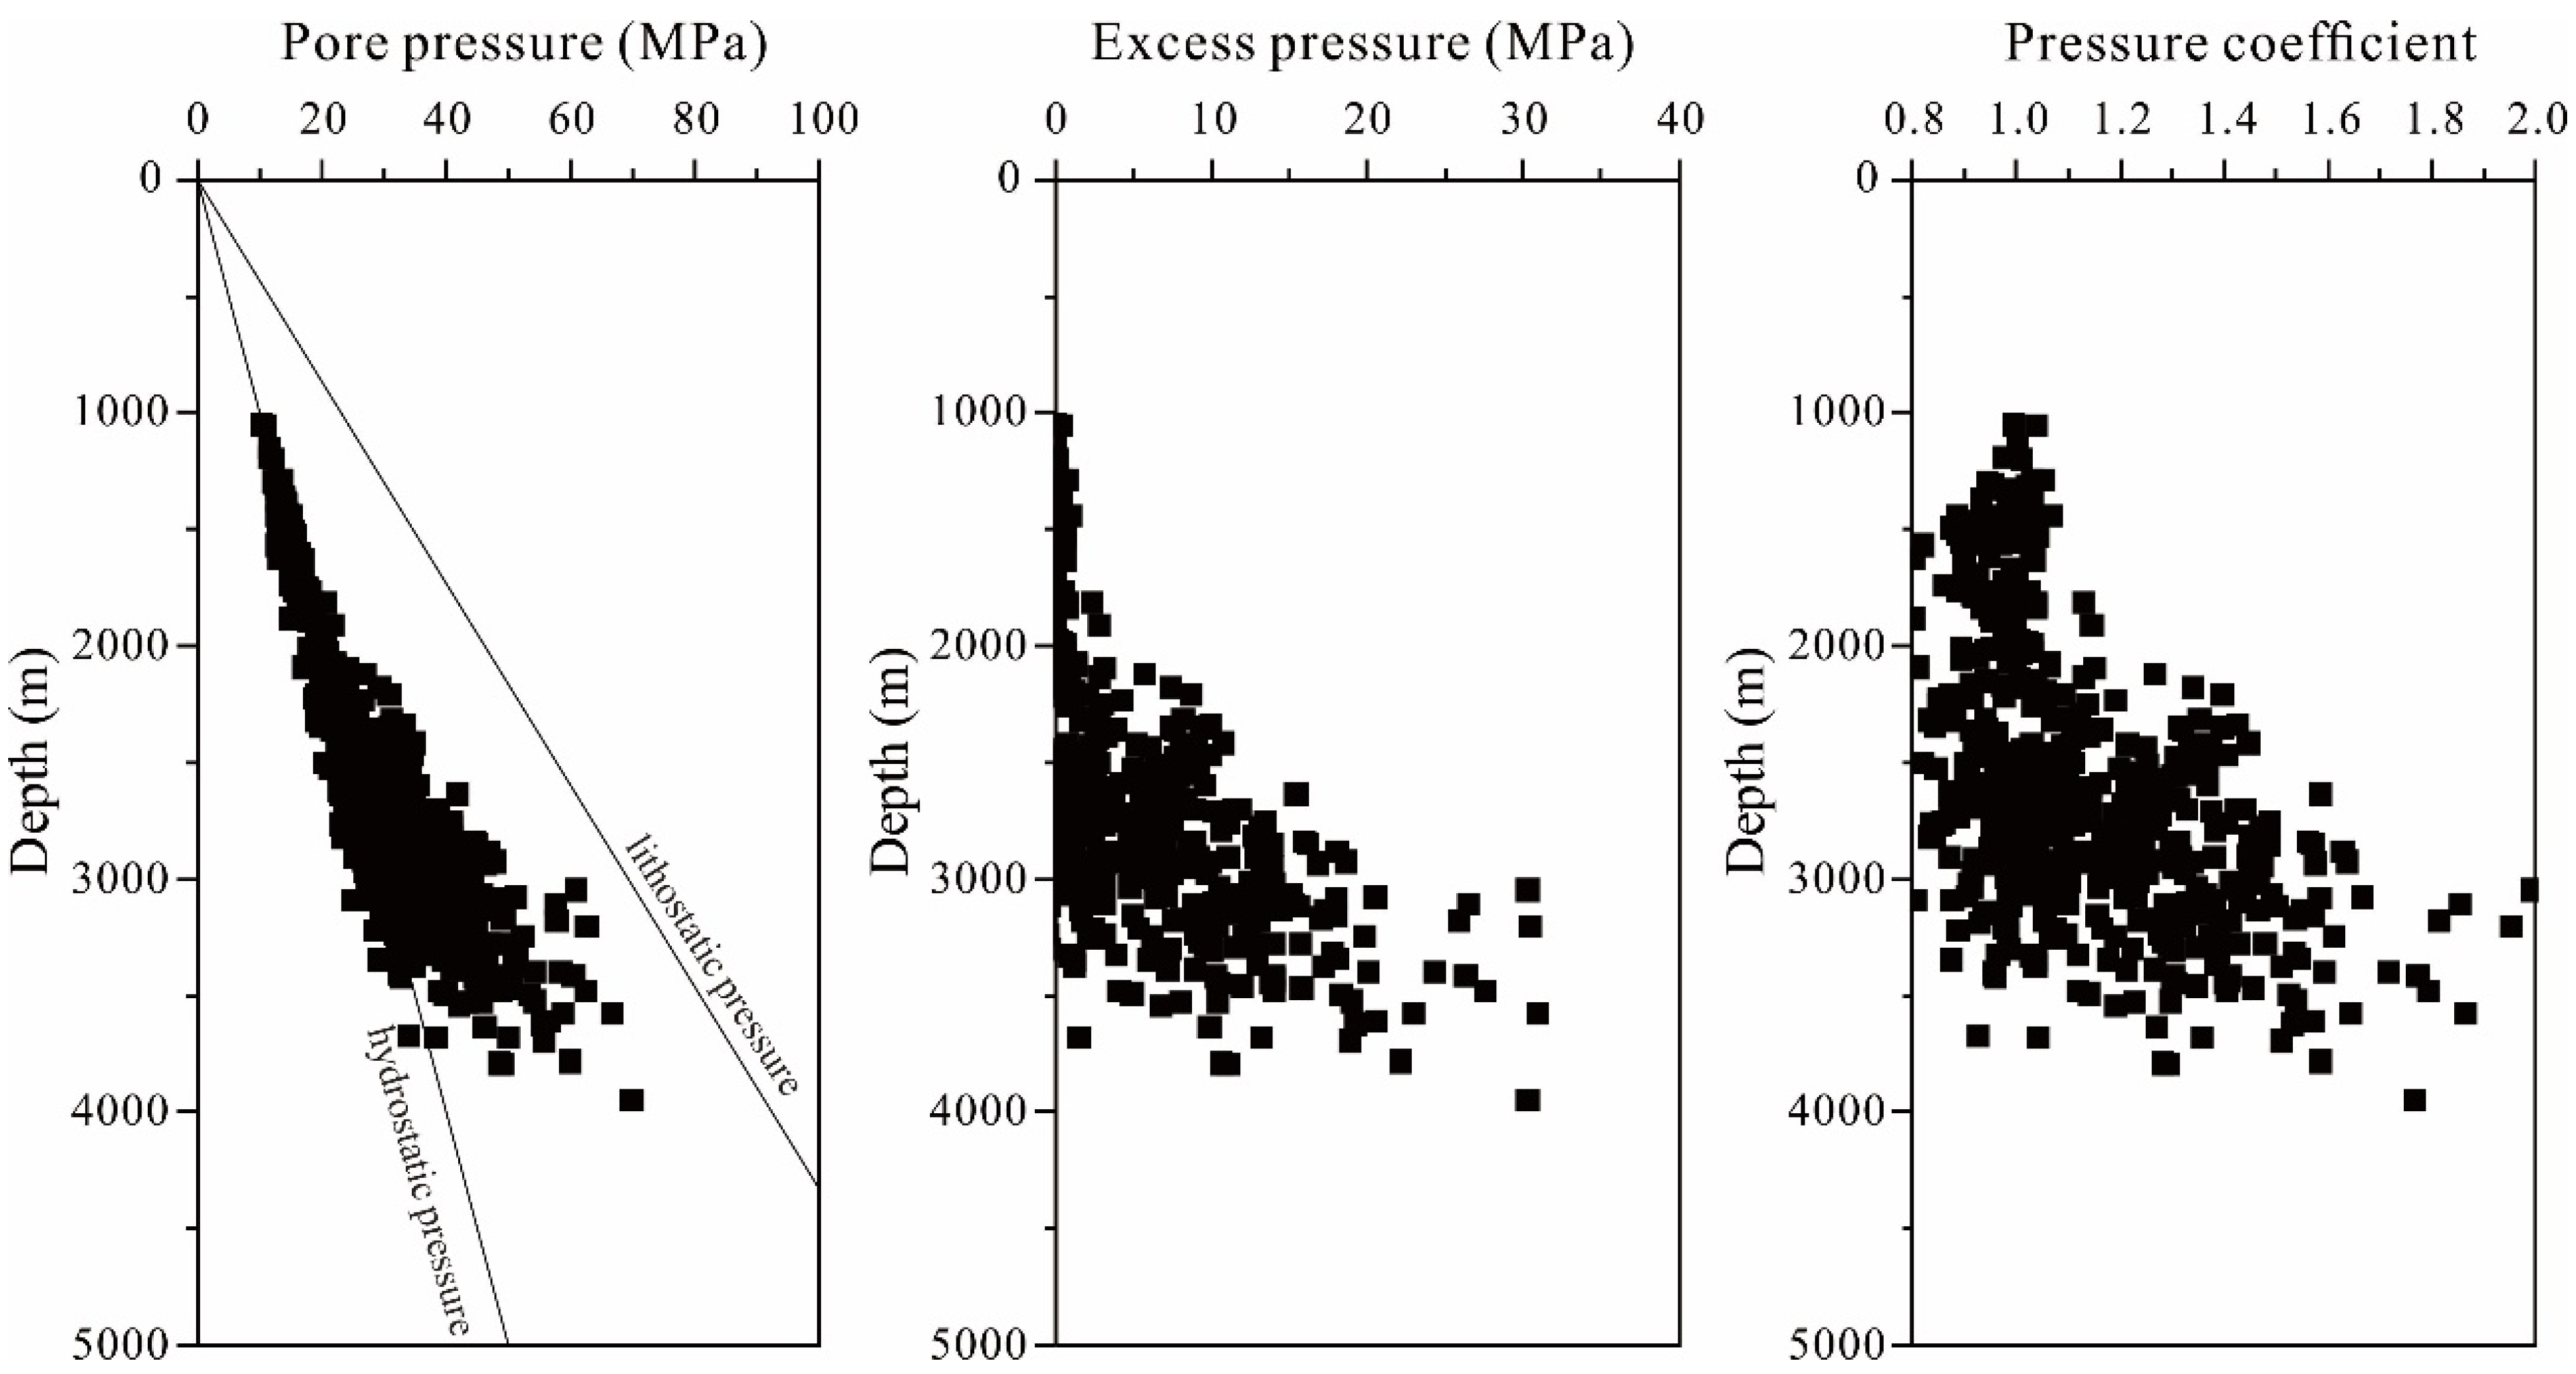
4.2.2. Distribution of Excess Pressure

The excess pressure calculated by drill stem tests are direct evidence for identifying overpressure. However, there are no drill stem tests in mudstones, because of the low permeability. The relationship between acoustic travel time and pore pressure was used to obtain the pore pressure in mudstones. The vertical distribution of excess pressure showed an increasing trend from the shallow burial regions to the deep burial regions (Figure 6 and Figure 7). According to the plot of drill stem tests versus depths (Figure 6), the excess pressure was less than 3 MPa at depths from 0 m to 2000 m, most of the excess pressure ranged from 5 MPa to 10 MPa at depths from 2000 m to 2600 m, and the excess pressure exceeded 20 MPa at the depth of 3000 m. The excess pressure in mudstones of the Es4s member calculated by the acoustic travel time using the Eaton formula continuously varied with depth (Figure 7). The excess pressure of mudstones in the Es4s member exceeded 20 MPa at Well T716 and was approximately 15 MPa at Well L105.
The lateral distribution of excess pressure in mudstones of the Es4s member are shown in Figure 8. It can be seen that the overpressure area of the Es4s member was mainly distributed in the Lijin Sag, Minfeng Sag, and Niuzhuang Sag. The excess pressure in mudstones of the Es4s member in the Lijin Sag ranged from 15 MPa to 35 MPa, the excess pressure in mudstones of the Es4s member in the Minfeng Sag and Niuzhuang Sag ranged from 15 MPa to 27 MPa, while the excess pressure in mudstones of the Es4s member in the Boxing Sag and Central Anticline Belt were mainly less than 15 MPa. The area between the excess pressure contour of 0 MPa and the boundary of the Dongying Depression was the normally pressured area without color filling in the depression (Figure 8).

4.3. Distribution of Excess Pressure Gradient

The lateral distribution of the excess pressure gradient in mudstones of the Es4s member can be shown in the form of arrows or in the form of a contour map (Figure 9). The direction of the arrows is expressed as the excess pressure gradient direction, while the length of the arrows represents the value of the excess pressure gradient (Figure 9a). The results showed that the direction of the pore pressure gradient of the Es4s member in the Dongying Depression diverged from the overpressured area of each sag to the periphery of the Dongying Depression. The excess pressure gradient direction of each point in the depression took the form of a series of continuous lines. The excess pressure gradient in the Es4s member at the Lijin Sag had two main directions and either pointed to the Steep Slope zone converging on Chengjiazhuang Uplift and Bingxian Uplift, or pointed to the Central Anticline Belt. The excess pressure gradient in the Es4s member at the Niuzhuang Sag could be distinguished into two main directions, but most of the excess pressure gradients pointed to the Southern Ramp zone. The excess pressure gradient in the Es4s member at the Mingfeng Sag mainly pointed to Chenjiazhuang Uplift and Qingtuozi Uplift. In addition, the length of the arrows at the northern Steep Slope zone was longer than the arrows at other areas in the Dongying Depression. That means that the values of the excess pressure gradient in the northern Steep Slope zone were higher than those in other areas in the Dongying Depression.
The values of the excess pressure gradient presented “low-high-low” from the sag area to the periphery of the Dongying Depression (Figure 9b). The low excess pressure gradient could be identified as two types. Type I was the area with a low excess pressure gradient and high excess pressure: the excess pressure gradient was less than 1 MPa/km, while the excess pressure was more than 15 MPa. This type was mainly distributed in the sag areas (area I in Figure 9b). Type II was the area with a low excess pressure gradient and low excess pressure: the excess pressure gradient was less than 1 MPa/km and the excess pressure was less than 15 MPa. This type was mainly distributed in the periphery of the Dongying Depression (area II in Figure 9b). The high excess pressure gradients were mainly distributed in the faults around the sags and ranged from 1 MPa/km to 7 MPa/km. The Lijin fault-Shengbei fault in the north of the Lijin Sag had the largest excess pressure gradient of 7 MPa/km, followed by the Yongbei fault in the north of the Minfeng Sag, which was about 6 MPa/km.

4.4. Indicative Significance for Oil Migration and Accumulation

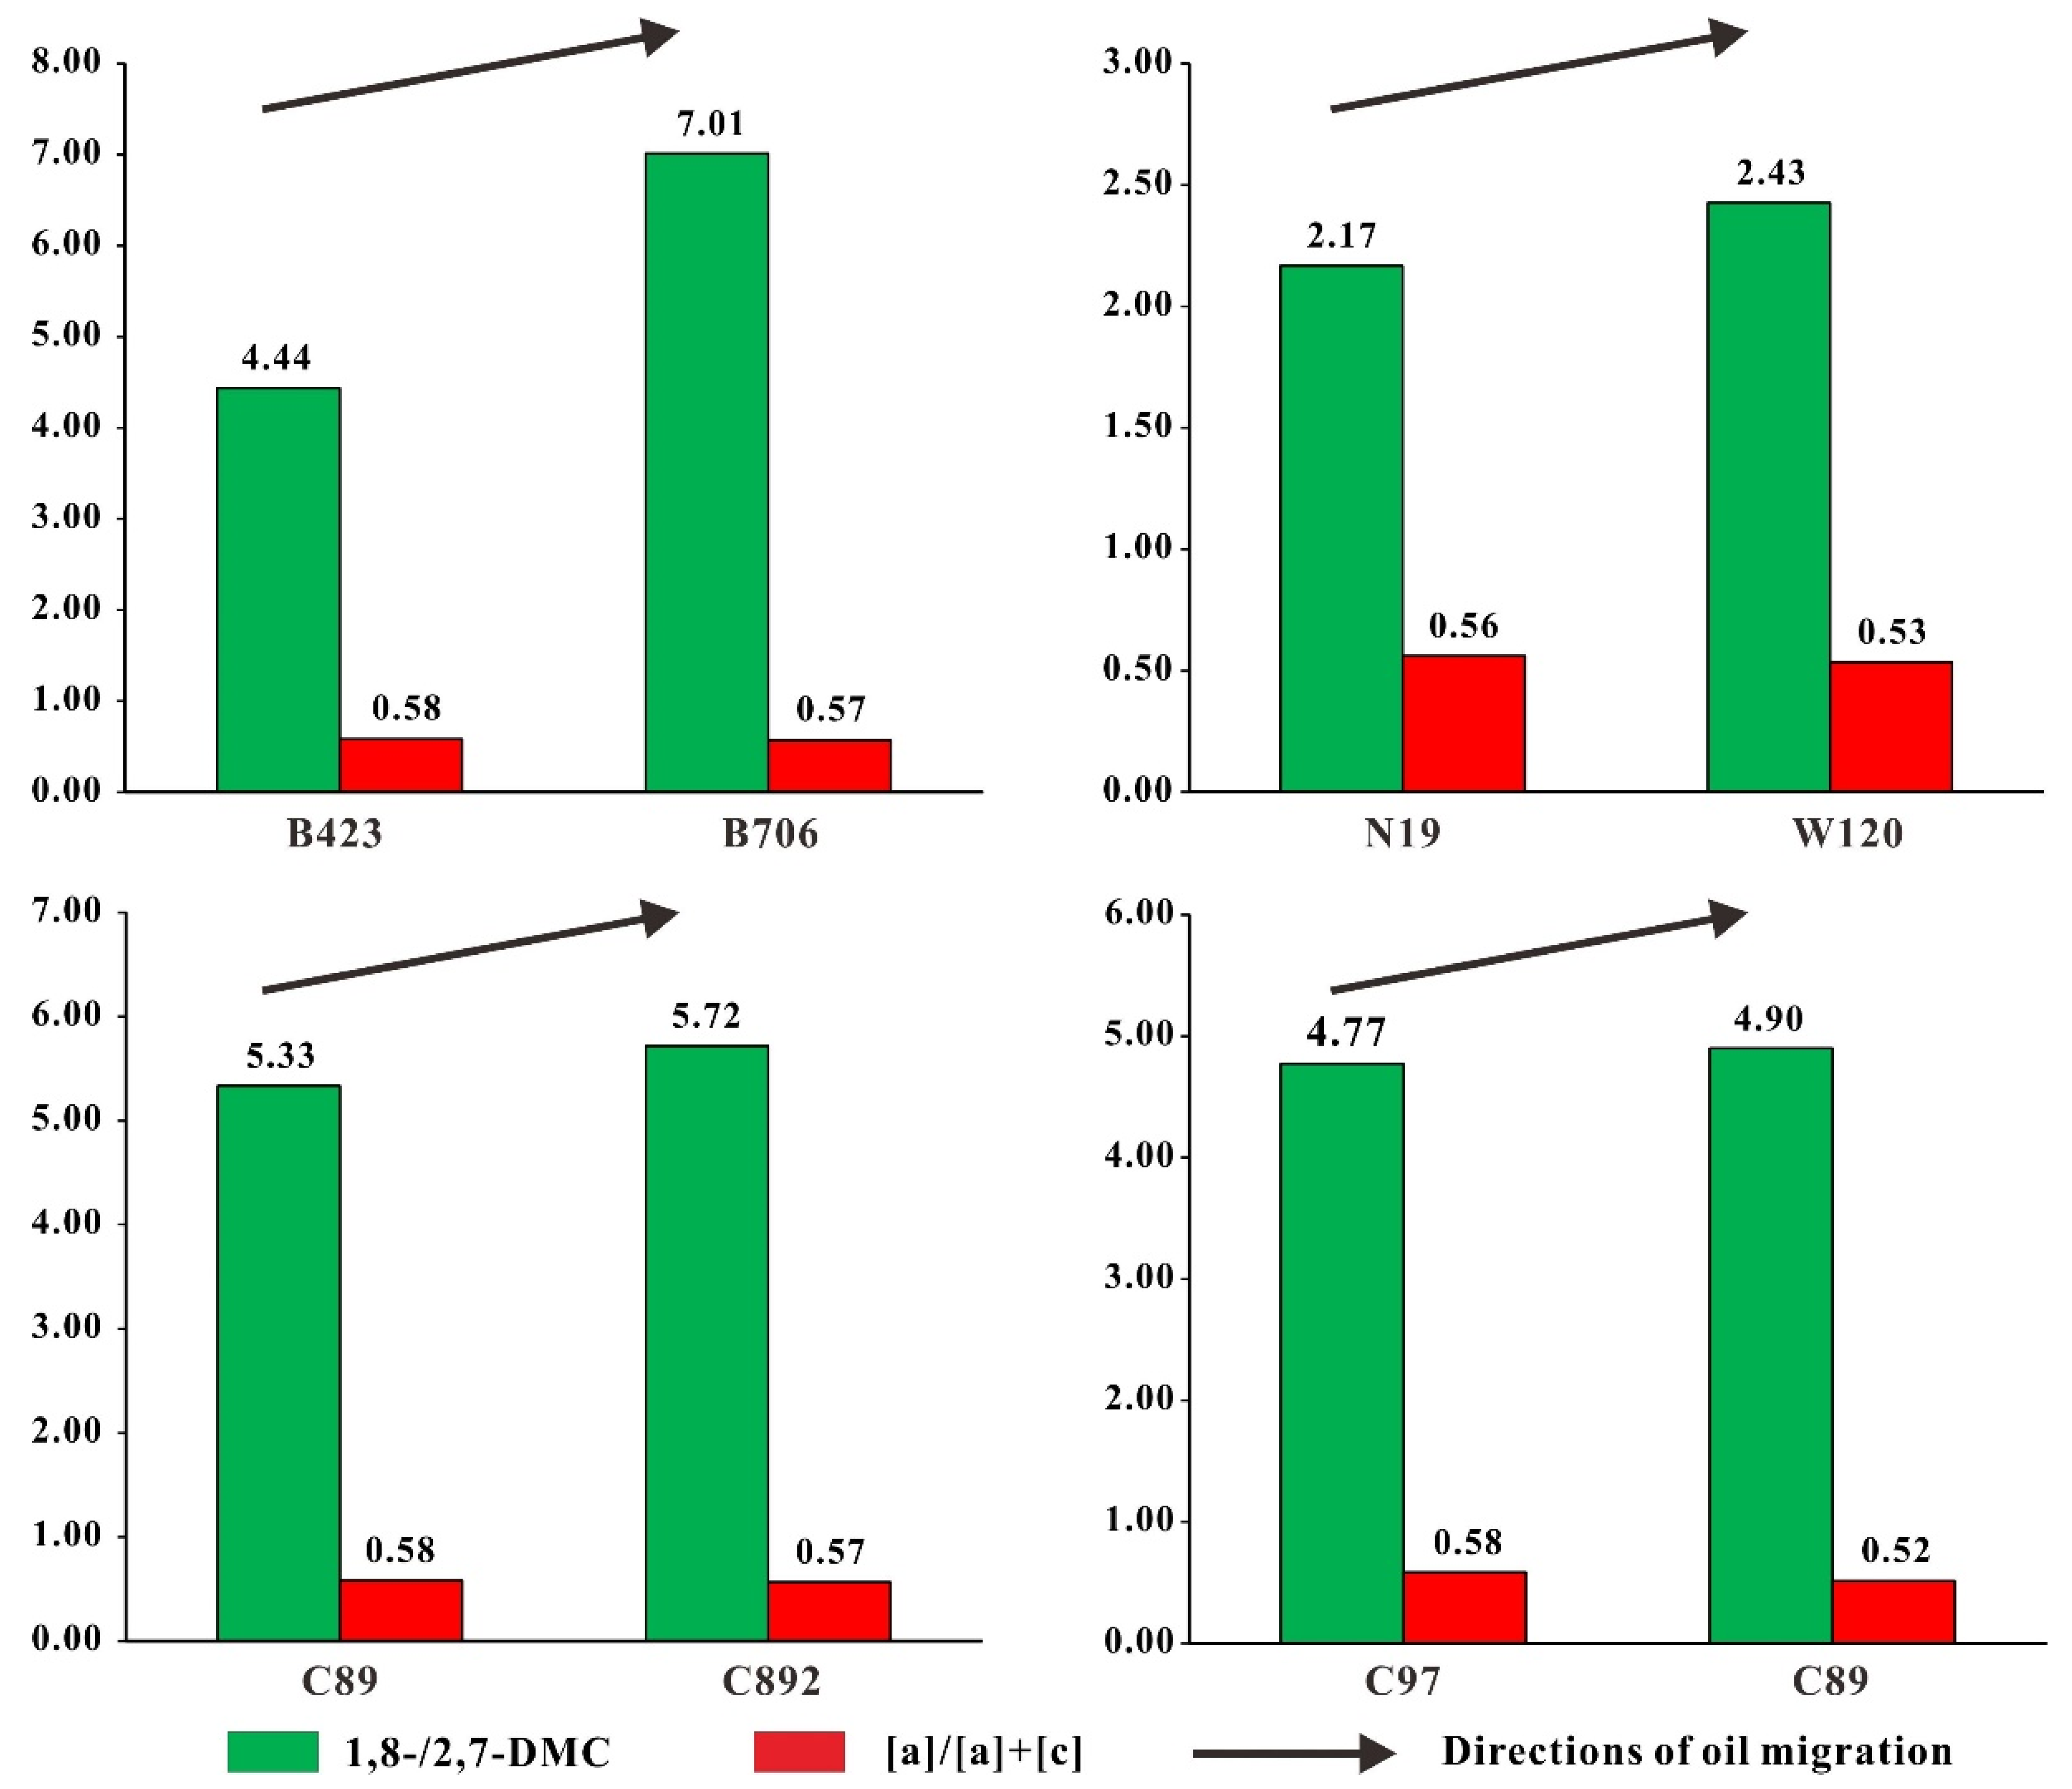
4.4.1. The Excess Pressure Gradient Indicates the Direction of Oil Migration

Carbazoles, methylcarbazoles, dimethylcarbazoles, and benzocarbazoles were detected in the eight oil samples from the Dongying Depression (Table 1). The concentration of carbazoles, methylcarbazoles, dimethylcarbazoles, and benzocarbazoles varied from 0.87 μg/g to 5.01 μg/g, 3.30 μg/g to 13.44 μg/g, 4.79 to 23.66 μg/g, and 1.23 to 4.93 μg/g, respectively (Table 2). For dimethylcarbazoles, the ratios of 1,8-/2,7-dimethylcarbazoles (1,8-/2,7-DMC) ranged from 2.17 to 7.01 (Table 2). As for dimethylcarbazoles, the oil samples had benzo[a]carbazole/benzo[a]carbazole + benzo[c]carbazole ([a]/[a] + [c]) ratios from 0.52 to 0.58 (Table 2).
Pyrrolic nitrogen compounds within crude oil are widely applied in the research of oil migration, and the change in the carbazole parameters can be used to trace the direction of oil migration [30,31,32]. During the secondary migration of oil, carbazoles with strong polarity are more easily absorbed by reservoir rocks than carbazoles with less polarity. As the secondary migration distance of oil increases, the relative content of nitrogen-shielded isomers increases, while the relative content of nitrogen-exposed isomers decreases. In this study, carbazole parameters such as 1,8-/2,7-DMC and [a]/[a] + [c] ratios were used to trace the secondary oil migration direction.
The 1,8-/2,7-DMC ratio was lower in the oil sample from Well B423 than that in Well B706, while the [a]/[a] + [c] ratio was higher in the oil sample from Well B423 than that from Well B706. As the secondary oil migration distance increased, a higher 1,8-/2,7-DMC ratio and lower [a]/[a] + [c] ratio were expected for oils with the same source, indicating that the oil sample from Well B706 migrated further than that from Well B423. Based on analyses of 1,8-/2,7-DMC and [a]/[a] + [c] ratios, the oil migration pathway from Well N19 to Well W120 in the Niuzhuang Sag and the oil migration pathways from Well G89 to Well G892 and from Well C97 to Well C89 in the Boxing Sag were traced for the Es4-derived oils (Table 2, Figure 10).
The oil migration direction traced by carbazoles concurs with that indicated by the excess pressure gradient, and the area where the excess pressure gradient arrows converge is often the oil accumulation area, which suggests that the traced oil migration pathways are reliable in the Dongying Depression (Figure 9a). In addition, there are few oil accumulations in the area where the direction of the excess pressure gradient arrows is parallel or divergent, which implies that the direction of the excess pressure gradient can be used to trace oil migration and accumulation.

4.4.2. Driven Force of Oil Migration

Oil migration in overpressured petroliferous basins is mainly affected by buoyancy, gravity, excess pressure, and capillary force. The resultant force of buoyancy and gravity is net buoyancy, net buoyancy and excess pressure are the driving force of oil migration, while the capillary force is the resistance of oil migration. The driving force must be great enough to overcome capillary resistance during oil migration. If net buoyancy is the only driving force for oil migration, enough oil column is needed to produce a sufficient net buoyancy to overcome the capillary force. The mercury injection test showed that the maximum connecting pore throat radius of fine sandstone in the Es4s member of the Dongying Depression ranged from 0.551 μm to 7.129 μm. It was calculated that the capillary resistance during oil migration in the presence of oil-water phases in the fine sandstone reservoir was between 1.333 MPa and 6.431 MPa. Taking it as the boundary condition, the critical oil column height in the vertical direction for oil migration in the Es4s formation must be 755 m to 3645 m at least. The dip angle of the Es4s formation was about 5°; therefore, the critical oil column contiguous length for oil migration in the Es4s member must be 8.6 km to 41.7 km, while the distance from the overpressured center of each sag in the Dongying Depression to the sag boundary was about 5–20 km. It can be determined that it is difficult to generate enough net buoyancy to overcome capillary resistance and drive oil migration in the overpressure system of the Es4s member. However, the excess pressure in the overpressure system of the Es4s member exceeded 15 MPa (Figure 6 and Figure 8). It was significantly greater than the capillary resistance of oil migration with the presence of two oil-water phases in the fine sandstone reservoir of the Es4s formation. Therefore, it can be inferred that the excess pressure is the main driving force of oil migration in the overpressured area of the Es4s formation.
The representative profile of the excess pressure gradient and oil reservoirs in the Dongying Depression are shown in Figure 11 (the location of the profile is shown in Figure 9a). It can be seen that the excess pressure in the Es4s member exceeded 20 MPa. The high excess pressure gradient (2 MPa/km–7 MPa/km) mainly distributed between Well T152 and Well T125 around the ShengBei Fault. The crude oil was generated in the sag, and oil laterally migrated under the driving by excess pressure. When the oil reaches the fault, the overpressure hydrocarbon-bearing fluid is released rapidly if the fault is under poor preservation conditions. Furthermore, the excess pressure gradient increases and the excess pressure decreases rapidly. When the excess pressure is insufficient for the oil to overcome the capillary resistance, the oil migration stops under the influence of capillary resistance for the moment. If there is a trap, the oil accumulates and forms a reservoir there, such as the oil reservoirs near the fault and Well T764 (Figure 11).
The distribution of oil reservoirs (related to the Es4s source rock) and the excess pressure gradient indicates the close affinity between them (Figure 12). It can be seen that the oil reservoirs that are sourced from the Es4s source rock are mainly accumulated in high-excess-pressure-gradient areas or a low excess pressure gradient with low-excess-pressure areas (area II), and only a few oil reservoirs are distributed in a low excess pressure gradient with high-excess-pressure areas (area I). The oil reservoirs in area I are mainly lithologic reservoirs in lentoid sandy [12,33]. For the lack of large-scale sandstone reservoirs in Es4s, the oil generated in the Es4s source rock laterally migrates to periphery of the sag. The high excess pressure gradient in the nearby sag means the excess pressure decreasing fast here. That indicates that there exists a good carrier bed for oil migration. It can be seen that the faults match well with the high-excess-pressure-gradient areas. Thus, it is inferred that the faults in the high-excess-pressure-gradient areas are the main carrier bed for oil migration (Figure 11 and Figure 12). The trap in the high-excess-pressure-gradient area will be the advantageous area for forming oil reservoirs. If there is no trap, the oil from the Es4s source rock will migrate through faults to the upper formation. When the oil migrates to area II, it will be difficult for the excess pressure to overcome the capillary resistance. The oil will accumulate until the oil column provides enough net buoyancy to overcome the capillary resistance and continue migrating.

5. Conclusions

(1)
The measured excess pressure in the Es4s member ranges from 5.65 MPa to 30.93 MPa. The results of overpressure prediction show that the overpressure in the Es4s member is mainly distributed in the Lijin Sag, Minfeng Sag, and Niuzhuang Sag, and the excess pressure ranges from 5 MPa to 30 MPa, while the excess pressure in the Boxing Sag is mainly less than 15 MPa.
(2)
The new method can calculate the values and the directions of the excess pressure gradient. The values of the excess pressure gradient in the Es4s member of the Dongying Depression present as “low-high-low” from the sag area to the periphery of the depression. The directions of the excess pressure gradient are consistent with the directions of oil migration indicated by the ratio of carbazole compounds, which suggests that the directions of the excess pressure gradient can be used to trace oil migration and accumulation.
(3)
The oil migration in overpressured areas is driven by excess pressure. With the excess pressure decreasing, the net buoyancy kicks gradually in the high-excess-pressure-gradient areas. Before the net buoyancy overcomes the capillary resistance and drives the oil migration, the oil will continue accumulating at the reservoir until the oil column provides enough net buoyancy to overcome the capillary resistance.
(4)
The distribution of the excess pressure gradient in the Es4s formation in the study area has a good matching relationship with the distribution of the oil field. The oil from the Es4s source rock is mainly distributed in the areas with a high excess pressure gradient or areas with a low excess pressure gradient and low excess pressure (area II).

Author Contributions

Writing—original draft, W.Z. and S.H.; writing—review and editing, W.Z., S.H., Y.W., X.W., G.J., X.G., Y.Q. and J.C. All authors have read and agreed to the published version of the manuscript.

Funding

The research was funded by the National Major Science and Technology Projects of China. The funding number is 2016Zx05006-003.

Institutional Review Board Statement

Not applicable.

Informed Consent Statement

Not applicable.

Data Availability Statement

Not applicable.

Acknowledgments

This research was funded by the National Major Science and Technology Projects of China, grant number 2016ZX05006-003. The Shengli Oilfield Research Institute, SINOPEC, is thanked for providing background geological data, samples, and the permission to publish the results.

Conflicts of Interest

The authors declare no conflict of interest.

References

  1. Guo, X.W.; He, S.; Liu, K.Y.; Song, G.Q.; Wang, X.J.; Shi, Z.S. Oil generation as the dominant overpressure mechanism in the Cenozoic Dongying Depression, Bohai Bay Basin, China. Am. Assoc. Pet. Geol. Bull. 2010, 94, 1859–1881. [Google Scholar] [CrossRef]
  2. Lahann, R.W. Gulf of Mexico overpressure and clay diagenesis without unloading: An anomaly? Am. Assoc. Pet. Geol. Bull. 2017, 101, 1859–1877. [Google Scholar] [CrossRef]
  3. Liu, J.; Liu, T.; Liu, H.; He, L.; Zheng, L. Overpressure caused by hydrocarbon generation in the organic-rich shales of the Ordos Basin. Mar. Pet. Geol. 2021, 134, 105349. [Google Scholar] [CrossRef]
  4. Hunt, J.M. Generation and migration of petroleum from abnormally pressured fluid compartments. Am. Assoc. Pet. Geol. Bull. 1990, 74, 1–12. [Google Scholar] [CrossRef]
  5. Zhang, F.Q.; Kor, T.; Yan, J.Z. Oil secondary migration simulation in tight reservoir and fingering factors analysis. J. Pet. Sci. Eng. 2022, 209, 109969. [Google Scholar] [CrossRef]
  6. Yang, H.; Fu, J.H.; Liu, X.S.; Liu, X.S.; Meng, P.L. Accumulation conditions and exploration and development of tight gas in the Upper Paleozoic of the Ordos Basin. Pet. Explor. Dev. 2012, 39, 295–303. [Google Scholar] [CrossRef]
  7. Bethke, C.M.; Reed, J.D.; Oltz, D.F. Long-range petroleum migration in the Illinois Basin. Am. Assoc. Pet. Geol. Bull. 1991, 75, 925–945. [Google Scholar] [CrossRef] [Green Version]
  8. Schegg, R.; Cornford, C.; Leu, W. Migration and accumulation of hydrocarbons in the Swiss Molasse Basin: Implications of a 2D basin modeling study. Mar. Pet. Geol. 1999, 16, 511–531. [Google Scholar] [CrossRef]
  9. Hubbert, M.K.; Rubey, W.W. Role of fluid pressure in mechanics of overthrust faulting: I. Mechanics of fluid-filled porous solids and its application to overthrust faulting. Geol. Soc. Am. Bull. 1959, 70, 115–166. [Google Scholar] [CrossRef]
  10. Feng, Y.L.; Liu, H.; Song, G.Q.; Yuan, F.F. Calculation and application of plane pressure decrease gradient. Pet. Geol. Exp. 2019, 41, 598–605. [Google Scholar]
  11. Liu, H.; Li, J.; Feng, Y.L.; Hao, X.F.; Lin, H.M.; Yuan, F.F. Relationship between excess pressure gradient and hydrocarbon distribution in the 3rd member of Shahejie Formation in Bonan Sag, Bohai Bay Basin. Oil Gas Geol. 2020, 41, 1083–1091. [Google Scholar] [CrossRef]
  12. Hao, X.F. Overpressure genesis and evolution of sanstone reservoirs in the 3rd and 4th members of Shahejie Formation, the Dongying Depression. Oil Gas Geol. 2013, 34, 167–173. [Google Scholar] [CrossRef]
  13. Qiu, Y.B. Pressure system and oil/gas reservoir forming in Dongying Sag. Spec. Oil Gas Reserv. 2015, 22, 58–61. [Google Scholar] [CrossRef]
  14. Wang, Y.S.; Qiu, Y.B. Overpressure structure dissimilarity and its controlling factors in the Jiyang Depression. Oil Gas Geol. 2017, 38, 430–437. [Google Scholar]
  15. Feng, Y.Q.; Li, S.T.; Lu, Y.C. Sequence stratigraphy and architectural variability in late Eocene lacustrine strata of the Dongying Depression, Bohai Bay Basin, eastern China. Sediment. Geol. 2013, 295, 1–26. [Google Scholar] [CrossRef]
  16. Chen, Z.H.; Huang, W.; Liu, Q.; Zhang, L.Y.; Zhang, S.C. Geochemical characteristics of the Paleogene shales in the Dongying Depression, eastern China. Mar. Pet. Geol. 2016, 73, 249–270. [Google Scholar] [CrossRef]
  17. Zhang, L.Y.; Liu, Q.; Zhu, R.F.; Lu, X.C. Source rocks in Mesozoic–Cenozoic continental rift basins, east China: A case from Dongying Depression, Bohai Bay Basin. Org. Geochem. 2009, 40, 229–242. [Google Scholar] [CrossRef]
  18. Qiu, N.S.; Jin, Z.J.; Hu, W.X. Study on the hydrocarbon charge history in Dongying Depression by evidence from fluid inclusion. J. Univ. Pet. 2000, 24, 95–103. [Google Scholar]
  19. Guo, X.W.; Chen, J.X.; Yuan, S.Q.; He, S.; Zhao, J.X. Constraint of in-situ calcite U-Pb dating by laser ablation on geochronology of hydrocarbon accumulation in petroliferous basins: A case study of Dongying sag in the Bohai Bay Basin. Acta Pet. Sin. 2020, 41, 284–291. [Google Scholar]
  20. Jiang, Y.L.; Liu, H.; Zhang, L.; Tan, L.J.; Wang, N. Analysis of petroleum accumulation phase in Dongying Sag. Oil Gas Geol. 2003, 24, 215–259. [Google Scholar] [CrossRef]
  21. Zhu, G.Y.; Jin, Q.; Dai, J.X.; Zhang, S.C.; Guo, C.C.; Zhang, L.Y.; Li, J. A study on periods of hydrocarbon accumulation and distribution pattern of oil and gas pools in Dongying Depression. Oil Gas Geol. 2004, 25, 209–216. [Google Scholar] [CrossRef]
  22. Bao, X.H.; Hao, F.; Fang, Y. Evolution of geopressure field in Niuzhuang sag in Dongying Depression and its effect on petroleum accumulation. Earth Sci.-J. China Univ. Geosci. 2007, 32, 241–246. [Google Scholar] [CrossRef]
  23. Li, M.W.; Larter, S.R.; Stoddart, D.; Bjoroey, M. Liquid chromatographic separation schemes for pyrrole and pyridine nitrogen aromatic heterocycle fractions from crude oils suitable for rapid characterization of geochemical samples. Anal. Chem. 1992, 64, 1337–1344. [Google Scholar] [CrossRef]
  24. Bowers, G.L. Pore pressure estimation from velocity data: Accounting for overpressure mechanisms besides undercompaction. SPE Drill. Completion 1995, 10, 89–95. [Google Scholar] [CrossRef]
  25. Wang, M.; Chen, Y.; Bain, W.M.; Song, G.Q.; Liu, K.Y.; Zhou, Z.; Steele-Maclnnis, M. Direct evidence for fluid overpressure during hydrocarbon generation and expulsion from organic-rich shales. Geology 2020, 48, 374–378. [Google Scholar] [CrossRef]
  26. Wang, B.J. Overpressure Distribution and Evolution, Dynamical Mechanism of Oil and Gas, Dongying Depression. Ph.D. Thesis, China University of Geosciences, Wuhan, China, 2012. [Google Scholar]
  27. Zhang, Y.S.; Lv, D.W.; Wang, Y.; Liu, H.Y.; Song, G.Z.; Gao, J. Geological characteristics and abnormal pore pressure prediction in shale oil formations of the Dongying Depression, China. Energy Sci. Eng. 2020, 8, 1962–1979. [Google Scholar] [CrossRef]
  28. Eaton, B.A. Graphical Method Predicts Geopressures Worldwide; World Oil: Houston, TX, USA, 1976; Volume 183. [Google Scholar]
  29. Luo, S.Y.; He, S.; Song, G.Q.; Wang, Y.S.; Hao, X.F.; Jin, Q.Y. Formation pressure prediction in Bonan Sag. Oil Geophys. Prospect. 2014, 49, 349–359. [Google Scholar]
  30. Larter, S.R.; Bowler, B.F.J.; Li, M.; Chen, M.; Brincat, D.; Noke, K.; Domohoe, P.; Simmons, D.; Kohnen, M.; Allan, J.; et al. Molecular indicators of secondary oil migration distances. Nature 1996, 383, 593–597. [Google Scholar] [CrossRef]
  31. Wang, T.G.; Li, S.M.; Zhang, A.Y.; Zhang, A.Y.; Zhu, L.; Li, B.H.; Zhou, Y.B. Oil Migration Analysis with Pyrrolicnitrogen Compounds. J. Univ. Pet. 2000, 24, 83–86. [Google Scholar]
  32. Chen, J.X.; Guo, X.W.; Han, Y.J.; He, S.; Wang, Y.S.; Wang, X.J.; Zhao, W. Combination of basin modelling and carbazoles to investigate secondary oil migration pathways in the Dongying Depression of the Bohai Bay Basin, China. Mar. Pet. Geol. 2021, 131, 105163. [Google Scholar] [CrossRef]
  33. Hao, X.F.; Chen, H.H.; Gao, Q.L.; Song, G.Q. Micro-charging processes of hydrocarbon in the Niuzhuang lentoid sandy reservoirs, Dongying Depression. Earth Sci.-J. China Univ. Geosci. 2006, 31, 182–191. [Google Scholar] [CrossRef]
Figure 1. Map of structural division, fault distribution, the distribution of oil fields related to the source of Es4s member, and the mixed source in Dongying Depression.
Energies 15 03554 g001
Figure 2. Schematic tertiary stratigraphy of the Dongying Depression in Bohai Bay Basin.
Energies 15 03554 g002
Figure 3. Burial–thermal evolution history of Well L218 and homogenization temperature projection of aqueous inclusions associated with oil inclusions.
Energies 15 03554 g003
Figure 4. Relationship between DST pressures and predicted pressures in the upper interval of Es4 member of Dongying Depression.
Energies 15 03554 g004
Figure 5. Sketch map of calculation about plane excess pressure gradient (The letters a–h represent different particles in the formation).
Energies 15 03554 g005
Figure 6. Profiles of DST pressure data, excess pressures, and pressure coefficients versus depth in the upper interval of Es4 member of Dongying Depression.
Energies 15 03554 g006
Figure 7. Profiles of acoustic travel time (AC), resistivity log (R4), density log (DEN), fluid pressures, and excess pressures versus depth in Well T716 and Well L105.
Energies 15 03554 g007
Figure 8. Contour map of plane distribution of maximum excess pressures in the upper interval of Es4 member of Dongying Depression.
Energies 15 03554 g008
Figure 9. Distribution characteristics of plane excess pressure gradient in the upper interval of Es4 member of Dongying Depression. ((a): in the form of arrow; (b): in the form of isoline).
Energies 15 03554 g009
Figure 10. Histogram of carbazole compound ratios (migration parameters) of crude oil samples of Dongying Depression.
Energies 15 03554 g010
Figure 11. Profile of excess pressure and oil reservoir in Dongying Depression (The location of the A–B profile is shown in Figure 9b).
Energies 15 03554 g011
Figure 12. Superposition graph of excess pressure gradient in the upper interval of Es4 member and the plane distribution of oil fields related to the source of Es4 member and the mixed source of Dongying Depression.
Energies 15 03554 g012
Table 1. Hydrocarbon group composition of tested crude oils.
No.WellDepthWeight (mg)Saturated Hydrocarbons (mg)Aromatic Hydrocarbons (mg)Resins (mg)Asphaltene (mg)
1B423295160.629.61.15.27.2
2B706147855.834.49.86.48.7
3N19304358.733.69.76.86.5
4W120243562.22.813.18.95.1
5G89304663.639.59.14.16.9
6G892299559.930.710.58.34.6
7C9724179652.815.810.47.8
Table 2. Carbazole parameters in the crude oil samples of the Dongying Depression.
WellC (μg/g)MC (μg/g)DMC (μg/g)BC (μg/g)1,8-/2,7-DMC[a]/[a] + [c]Migration Distance (km)Relative Distance to Source Rocks
B4230.873.519.031.234.440.5812.24Short distance
B7060.643.3011.402.287.010.57Long distance
N193.5513.4419.641.672.170.566.59Short distance
W1201.616.344.792.272.430.53Long distance
G893.8511.4721.874.935.330.582.65Short distance
G8922.348.2318.333.115.720.57Long distance
C972.325.4910.512.554.770.582.18Short distance
C895.0112.7623.664.314.900.52Long distance
Note: C = carbazoles, MC = methylcarbazoles, DMC = dimethylcarbazoles, BC = benzocarbazoles, 1,8-DMC = 1,8-dimethylcarbazoles, 2,7-DMC = 2,7-dimethylcarbazoles, [a] = benzo[a]carbazoles, [c] = benzo[c]carbazoles.
Publisher’s Note: MDPI stays neutral with regard to jurisdictional claims in published maps and institutional affiliations.

