Article

Thermodynamic Study of Energy Consumption and Carbon Dioxide Emission in Ironmaking Process of the Reduction of Iron Oxides by Carbon

1
School of Metallurgical and Ecological Engineering, University of Science and Technology Beijing, Beijing 100083, China
2
Beijing Key Laboratory of Special Melting and Preparation of High-End Metal Materials, University of Science and Technology Beijing, Beijing 100083, China
3
College of Metallurgical Engineering, Xi’an University of Architecture and Technology, Xi’an 710055, China
*
Authors to whom correspondence should be addressed.
Energies 2021, 14(7), 1999; https://doi.org/10.3390/en14071999
Submission received: 1 March 2021 / Revised: 26 March 2021 / Accepted: 2 April 2021 / Published: 5 April 2021

Abstract

:
Carbon included in coke and coal was used as a reduction agent and fuel in blast furnace (BF) ironmaking processes, which released large quantities of carbon dioxide (CO2). Minimizing the carbon consumption and CO2 output has always the goal of ironmaking research. In this paper, the reduction reactions of iron oxides by carbon, the gasification reaction of carbon by CO2, and the coupling reactions were studied by thermodynamic functions, which were derived from isobaric specific heat capacity. The reaction enthalpy at 298 K could not represent the heat value at the other reaction temperature, so the certain temperature should be confirmed by Gibbs frees energy and gas partial pressure. Based on Hess’ law, the energy consumption of the ironmaking process by carbon was calculated in detail. The decrease in the reduction temperature of solid metal iron has been beneficial in reducing the sensible heat required. When the volume ratio of CO to CO2 in the top gas of the furnace was given as 1.1–1.5, the coupling parameters of carbon gasification were 1.06–1.28 for Fe2O3, 0.71–0.85 for Fe3O4, 0.35–0.43 for FeO, respectively. With the increase in the coupling parameters, the volume fraction of CO2 decreased, and energy consumption and CO2 output increased. The minimum energy consumption and CO2 output of liquid iron production were in the reduction reactions with only CO2 generated, which were 9.952 GJ/t and 1265.854 kg/t from Fe2O3, 9.761 GJ/t and 1226.799 kg/t from Fe3O4, 9.007 GJ/t and 1107.368 kg/t from FeO, respectively. Compared with the current energy consumption of 11.65 GJ/t hot metal (HM) and CO2 output of 1650 kg/tHM of BF, the energy consumption and CO2 of ironmaking by carbon could reach lower levels by decreasing the coupled gasification reactions, lowering the temperature needed to generate solid Fe and adjusting the iron oxides to improve the iron content in the raw material. This article provides a simplified calculation method to understand the limit of energy consumption and CO2 output of ironmaking by carbon reduction iron oxides.

1. Introduction

Ironmaking processes are a focus area when the topic of energy consumption and CO2 emissions is mentioned, which requires carbon (from coke and coal) as the fuel and reducing agent to convert iron oxide to hot metal at high temperatures. The CO2 emissions from the iron and steel industry accounted for 4–7% of that of global emissions [1]. Current production processes consisting of sintering or pelletizing, coke making, and blast furnace (BF) without top gas recovery contribute to approximately 90% of the CO2 output from BF-converter steelmaking integrated steel plants [2,3]. As the dominant primary energy source, coal (coking coal and pulverized coal) accounts for about 80% of the total energy consumption and acts as a major source of CO2 emissions in the iron and steel industry [3]. CO2 emissions of the BF process are around 1.650 t CO2/tHM [4], and the energy consumption of the BF process is around ±12 GJ/tHM [5,6]. Therefore, from the point of view of carbon sources, reducing carbon usage is to reduce CO2 emissions.
With the strict environmental policy and the recent signing of the Paris agreement, steel manufacturers are under continually increasing pressure to reduce CO2 emissions further to near net-zero levels [7,8,9,10,11]. Several innovative technologies [1,8,12,13,14,15,16] have been used or are under development to reduce energy consumption and CO2 emissions of BF process, for example, flue gas recycling within BF stoves, dry gas cleaning process, dry slag granulation including heat recovery, high-efficiency coal injection technology (PCI), top gas dry residual pressure power generation (TRT), hot BF flue gas double preheating technology, BF gas recovery technology, BF slag comprehensive utilization technology, BF coke oven gas injection technology, BF waste plastic injection technology, charcoal injection, top-gas recycling (TGR) with carbon capture and storage (CCS), microbiological process gas treatment, H2 injection. According to the report [8], 1.75 GJ/t and 54.12kg CO2/t crude steel would be reduced in the BF process. Direct reduction ironmaking technology with syngas as the reduction gas, represented by Midrex and HYL/Energiron, is also an alternative choice to reduce the energy consumption and carbon emissions of ironmaking [17,18]. Therefore, decreasing energy input or increasing energy savings are alternative ways to reduce energy consumption.
BF production is the most cost-efficient technology today [1], and is considered a highly developed process operating close to the thermodynamic limits of efficiency. There are no obvious enhancements that will fundamentally reduce its carbon demand or significantly improve its thermal efficiency [19], so there is only limited room left for improvement based on existing technologies [11,20,21]. Are BF plants now at or very close to their thermodynamic limits? This is an interesting question worthy of further consideration and research.
Although extensive research has been carried out on the low energy consumption and low emission of the BF process [7,18,22,23,24,25,26,27,28,29,30,31], research and development of the theoretical innovation for carbon reduction of iron oxides is scarce. And also, there is very limited information on a more accurate equation formula in terms of reduction and gas gasification of carbon. The simplified equations have been recognized and used in many situations [8,13,14,18,30,31,32,33,34,35,36,37,38,39,40], which facilitates the rapid use by researchers, but they are not accurate enough. In this paper, the complete temperature function expressions of enthalpy, entropy, and Gibbs free energy were derived from the isobaric specific heat capacity, which was used to analyze the reduction law and energy consumption.
The purpose of this paper was to explore the possible limit of further reducing the fuel ratio of the BF ironmaking process. Base on the existing equilibrium of chemical reactions, a thermodynamic model of carbon reduction of iron oxides was proposed. The effect of temperature and gas partial pressure on reduction reactions and gasification reactions was analyzed to confirm the reaction conditions. Furthermore, reaction enthalpy and gas yields of coupling chemical reactions were discussed to fix the energy consumption. Through the simplified model, the energy consumption of BF ironmaking was calculated, and then the minimum energy consumption would be found in basic thermodynamics.

2. Methods

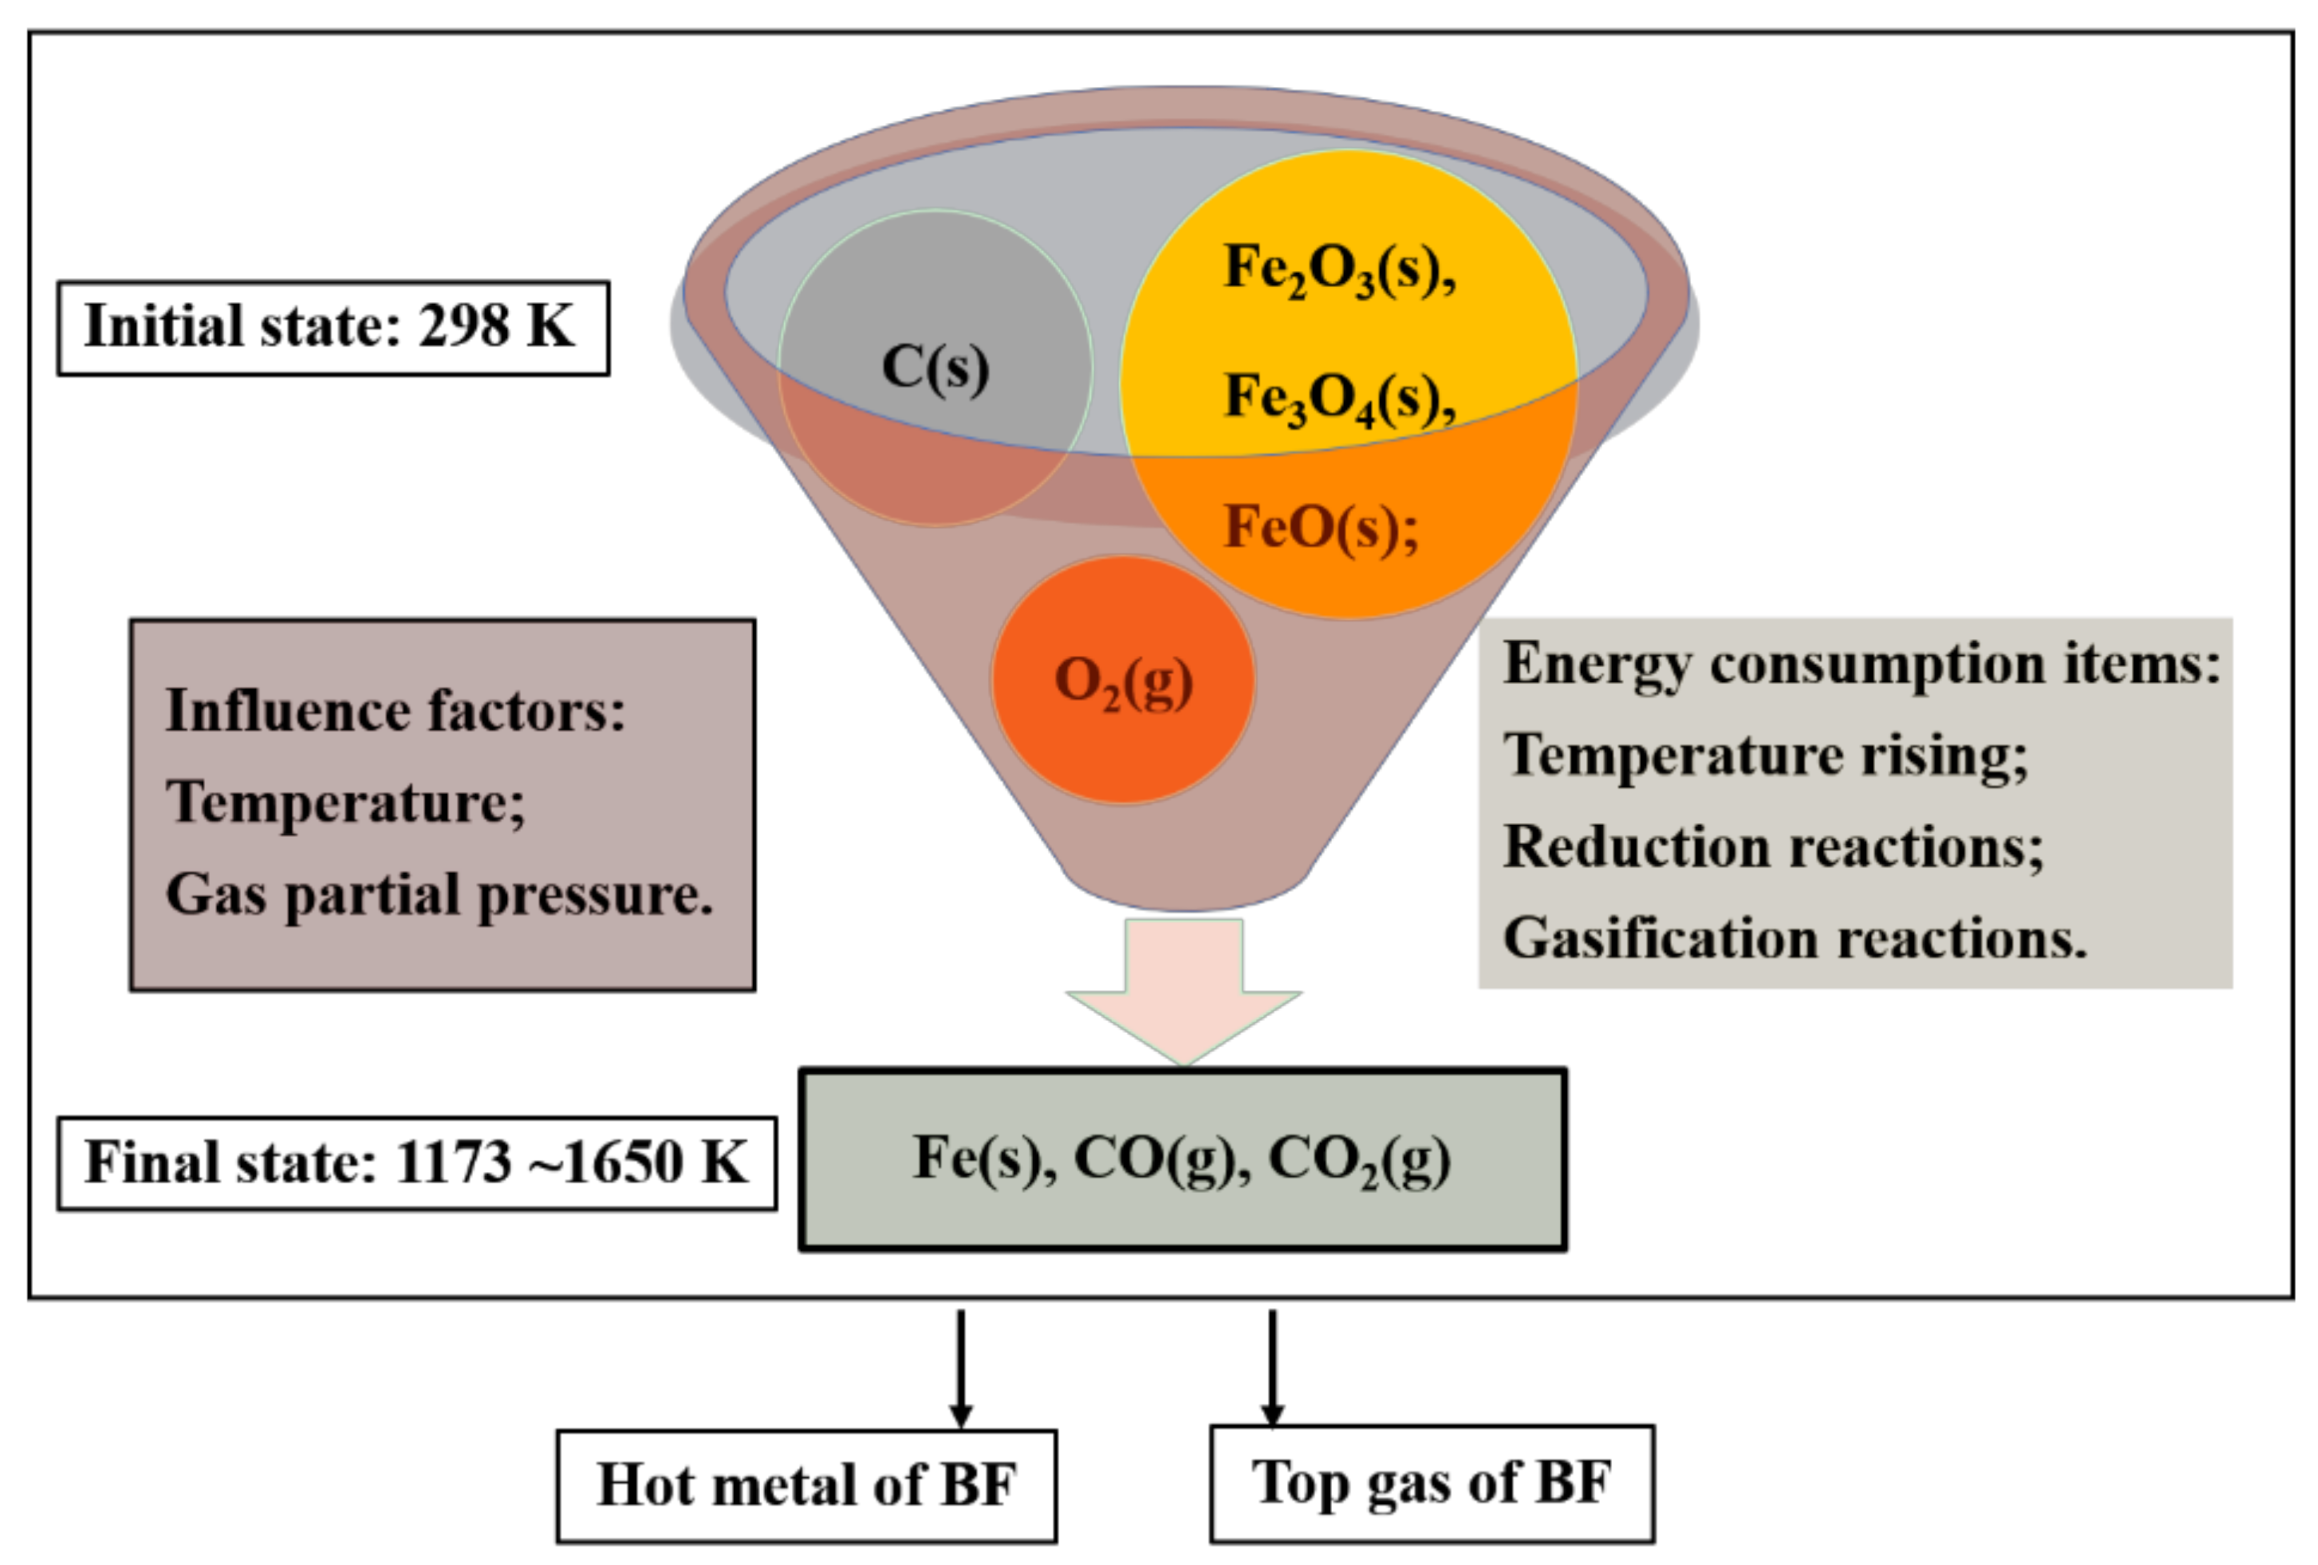
2.1. Model Setting Assumptions

The heat and mass balance between income and outcome of the BF process were used in the textbook calculation, which needed to collect adequate and detailed data to match the actual BF as much as possible [41]. To simplify the calculation process, according to Hess’ law [42,43], the following assumptions were made in this study:
(1)
Carbon and iron oxides were objects of study, and other components were ignored, such as ash, volatile matter, gangue, and carbonate, etc. Carbon in coke or coal was considered as a reducing agent and fuel. Three kinds of iron oxides of Fe2O3, Fe3O4, and FeO were the main components in agglomeration or lump. The differences between various raw materials and production processes were not considered, and the common problems of reduction and energy consumption would be studied.
(2)
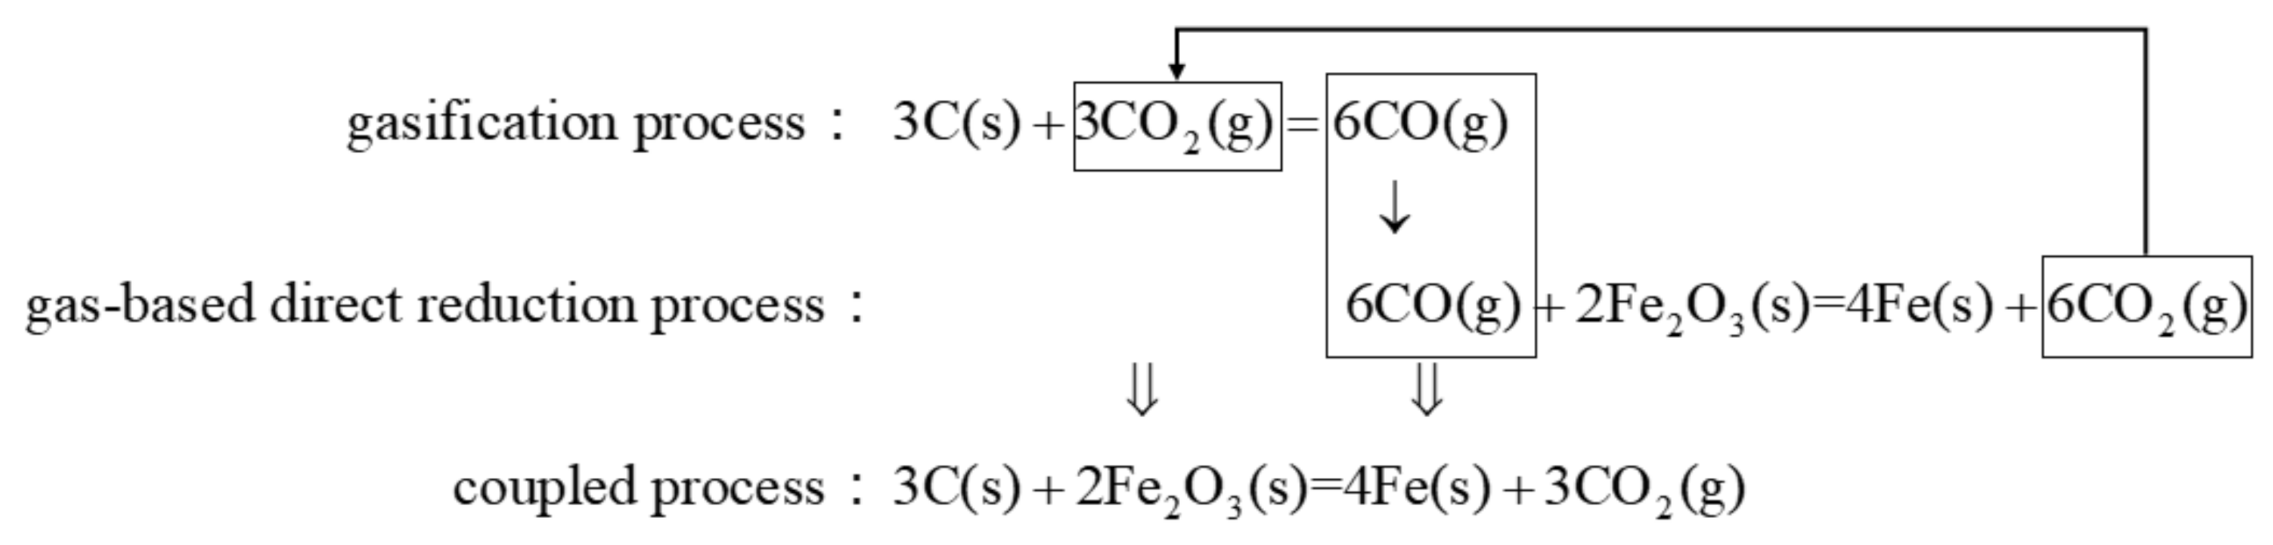
Energy was mainly used to provide heat to raise the temperature of solid raw materials, and met the heat needed of the reactions of reduction and gasification, and was supplied by the complete combustion of carbon. Although the heat energy in the hot air, non-recyclable heat loss, and recyclable heat of the top gas of BF could not be ignored in heat balance, they were not in the scope of this paper. Therefore, the carbon consumption included carbon for combustion, for reduction, for gasification, as shown in Equation (1). When the reduction and gasification reactions were considered simultaneously, the coupling reactions would be constructed as:
C C consumption = C C combustion + C C reduction + C C gasification = C C combustion + C C coupling = E temperature   rising + E smelting + E coupling Δ r H combustion Ө + C C coupling
where CC referred to the quality of the carbon consumption, kg/t Fe. The subscripts “combustion”, “reduction”, “gasification”, “coupling” referred to the combustion reaction, reduction reactions, gasification reaction, and coupling reactions, respectively. E referred to the energy consumption, GJ/t Fe. The subscripts “temperature rising”, “smelting” referred to raising the temperature of solid materials to reduction temperature or smelting temperature, and the process of converting to liquid pure iron, respectively. Δ r H combustion Ө referred to the heat value of complete combustion of carbon and oxygen at a certain temperature, which was determined by thermodynamics discussion, GJ/kg C. So, C C coupling meant the carbon needed for coupling reactions based on chemical reaction equations of coupling reactions. E coupling Δ r H combustion Ө meant the carbon needed to provide heat for the coupling reactions based on enthalpy change of coupling reactions.
(3)
The CO2 was produced from combustion and reduction, and its mole value was equal to the mole value of carbon consumption.
(4)
The gaseous O2 in hot air was used for combustion with carbon and did not exist in the top gas of the actual BF [41]. The steam (gaseous H2O) in hot air was not considered in this study to only explore the thermodynamic law of gasification between C and CO2.
(5)
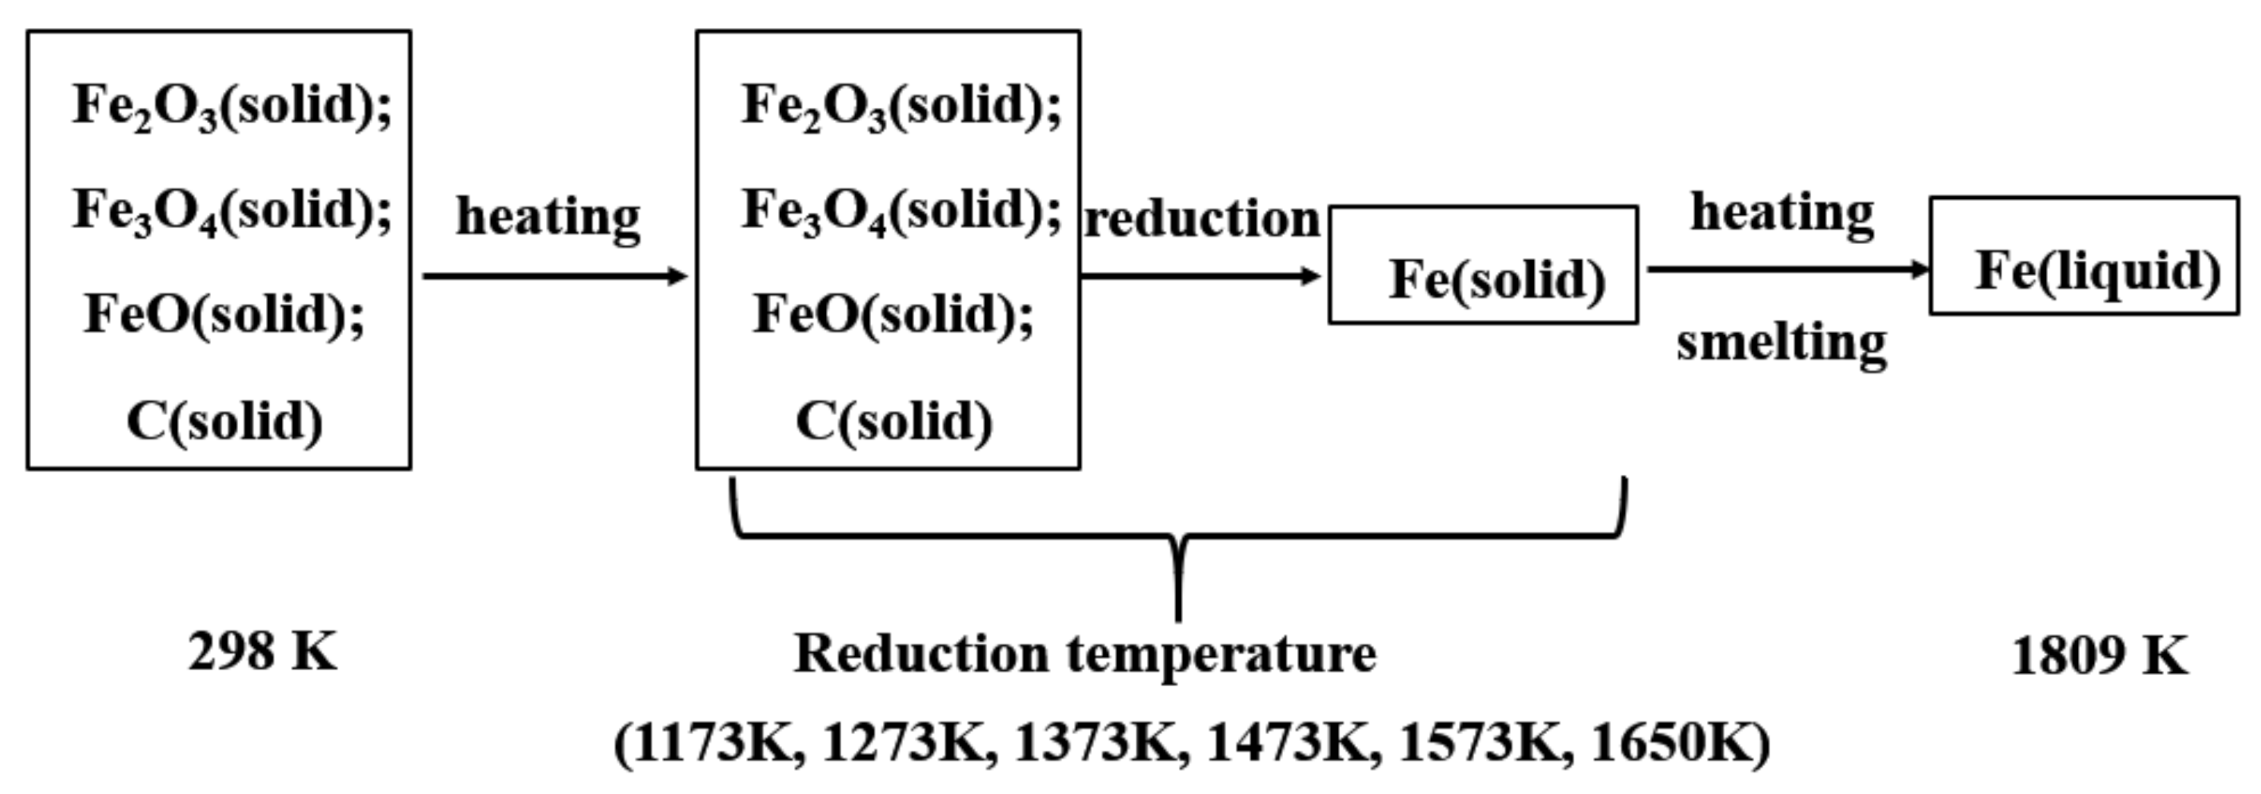
The process of smelting hot metal and output of top gas of BF were not considered in the chemical reaction but consumed vast amount of energy [44]. The energy consumption of pure iron smelting from solid metallic iron to liquid iron at 1809 K (1536 °C) was 349.573 kJ/mol [45], namely was 6.242 GJ/t. The sensible heat of the top gas of BF was not considered in energy consumption items in this study, because it was the result of chemical reactions and heat transfer of gases in BF, and not the direct consumption item.
Energy consumption from the initial to the final state of ironmaking by carbon would be studied, as shown in Figure 1. The influence factors of temperature and gas partial pressure on the reaction also would be studied. According to Hess’ law, the energy consumption of ironmaking included the heat needed for heating raw materials and chemical reactions, as shown in Figure 2.
In this given system, the component number was 6, namely being FexOy, C, O2, Fe, CO, CO2, and the element number was 3, namely being C, Fe, O. So, the number of independent chemical reactions in this system was equal to 3, which was 3 of the element numbers subtracted from 6 of the component numbers. Therefore, from the thermodynamic theory, two independent chemical reactions were used to describe the carbon reduction of iron oxides and reflected the whole process [39,40]. In BF ironmaking, the reactions of C and iron oxides were generally called direct reduction reactions. The reactions of CO or H2 and iron oxide were called indirect reduction reactions. The possible reactions were listed in Table 1, including the direct reduction reaction of carbon and iron oxides (which was divided into only CO generated, only CO2 generated, and both CO and CO2 generated), the gasification reaction of C and CO2, and the combustion of C and O2. The abbreviation of (s) and (g) referred to the solid phase and gas phase, respectively.
According to the published data of a certain large BF in the reference [39], the average volume fraction of CO and CO2 in the top gas of BF were 21.859% and 19.933%, respectively. The average value of the ratio of volume fraction of CO to that of CO2 in a certain large BF was 1.10, as shown in Equation (10). It was to be noted that the CO and CO2 in the top gas of BF were from the reduction reaction, gasification reaction, and combustion reaction, which provided the former two kinds of reaction. From the perspective of the initial state and the final state, the CO2 output was from the reduction reaction, gasification reaction, and combustion reaction, as shown in Equation (11). For the coupling reaction of reduction reactions and gasification reaction, the ratio of volume fraction of CO to that of CO2 in equilibrium state was more than 1.10, as shown in Equation (12).
The complete combustion of carbon occurred in the tuyere combustion strip of BF, so the generated CO2 would participate in the gasification reactions and has been converted to CO. However, the follow up coupling reaction made sure that CO2 was kept in a certain concentration in top gas. The CO2 output was the sum generated from the combustion and coupling reactions, as shown in Equation (11).
φ C O φ C O 2 1.10   ( average   ratio   in   the   top   gas   of   BF )
M C O 2 , output = M C O 2 , combustion + M C O 2 , reduction + M C O 2 , gasification = M C O 2 , combustion + M C O 2 , coupling
where M referred to the mass of CO2.
φ C O φ C O 2 > 1 . 10   ( in   the   coupling   reactions )
where φ CO and φ CO 2 were the volume fraction of CO and CO2, respectively.

2.2. Thermodynamic Functions

2.2.1. Basic Thermodynamic Function

The classical pure material data book [45,46,47] provided calories and kilocalories as heat units and listed the isobaric specific heat capacity, standard enthalpy, and standard entropy at 298 K, transition enthalpy, and transition entropy when the phase changes. Although the tabulated data was easy to read, an additional conversion calculation was required and the more detailed needs of scientific researchers were not being met. For this reason, the functions of standard enthalpy and standard Gibbs free energy would be derived by mathematical derived from basic data. The origin data, function expressions and calculation processes were shown in the Supplementary Sheet. The calculation methods were listed in Equations (13)–(19), and the results were shown in Table 2. Equation (20) was used to check the correctness of the calculation results.
C T = A 1 + A 2 × 10 3 T + A 3 × 10 5 T 2 + A 4 × 10 6 T 2
H T Ө = 298.15 T C T d T = H 0 + A 1 T + A 2 × 10 3 2 T 2 A 3 × 10 5 T 1 + A 4 × 10 6 3 T 3
H 0 = H 298.15 Ө ( A 1 × 298.15 + 1 2 × A 2 × 10 3 × 298.15 2    A 3 × 10 5 × 298.15 1 + 1 3 × A 4 × 10 6 × 298.15 3 )
S T Ө = 298.15 T C T T d T = S 0 + A 1 ln T + A 2 × 10 3 T 1 2 A 3 × 10 5 T 2 + 1 2 A 4 × 10 6 T 2
S 0 = S 298.15 Ө ( A 1 × ln 298.15 + A 2 × 10 3 × 298.15         1 2 A 3 × 10 5 × 298.15 2 + 1 2 A 4 × 10 6 × 298.15 2 )
G T Ө = H T Ө T S T Ө H 0 + I T A 1 T ln T 1 2 A 2 × 10 3 T 2 1 2 A 3 × 10 5 T 1 1 6 A 4 × 10 6 T 3
I = S 298.15 Ө + A 1 × ( 1 + ln 298.15 ) + A 2 × 10 3 × 298.15 1 2 A 3 × 10 5 × 298.15 2 + 1 2 A 4 × 10 6 × 298.15 2
I = A 1 S 0
In these equations:
C T , isobaric specific heat capacity at temperature T, J/(mol•K);
H T Ө , standard molar enthalpy at temperature T, J/mol;
S T Ө , standard molar entropy at temperature T, J/(mol•K);
G T Ө , standard molar Gibbs free energy at temperature T, J/mol;
T , temperature, K;
H 0 , integration constant of standard molar enthalpy, J/mol;
S 0 , integration constant of standard molar entropy, J/(mol•K);
I , integration constant of standard molar Gibbs free energy, J/mol;
A1, A2, A3, A4, coefficient of specific heat capacity, dimensionless parameter.
In Table 2, Greek symbols of α, β, γ, refer to the serial number of the crystal body. T1 and T2 refer to the temperature initial point and the final point when the phase of solid species changes, and the enthalpy and Gibbs free energy at these temperatures need to be dealt with carefully.
When the chemical reaction equations were confirmed, the reaction enthalpy Δ r H T Ө (J/mol) and reaction Gibbs free energy Δ r G T Ө (J/mol) could be calculated according to the Equations (21) and (22), respectively, namely that the former state was subtracted from the latter state. In other words, the functions were calculated from the addition and subtraction of parameters of thermodynamic functions. Besides, Equation (21) also was used to calculate sensible heat needed for solid raw materials.
Δ r H T Ө = i ν i H T Ө
Δ r G T Ө = i ν i G T Ө
where ν i was the stoichiometric number of species i in the reaction equation, and was “−” for the former state, and “+” for the latter state. The subscript i refers to species i that participated in the chemical reaction.

2.2.2. Single Reaction

According to theoretical isotherm equations of Gibbs free energy, as shown in Equation (23), and gas–solid reduction reaction of Equations (2)–(7), the relative gas partial pressure of CO and CO2 in reduction reactions could be calculated by Equations (24)–(25) and Equations (26) and (27), respectively.
Δ r G T Ө = R T ln K Ө
For the reaction Equations (2)–(4),
Δ r G T Ө = R T ln K Ө = R T ln P CO ν CO = R T ln P CO P Ө ν CO   ν CO = 1 ,   3 ,   4
P CO = exp ( Δ r G T Ө R T ) ν CO   ν CO = 1 ,   3 ,   4
For the reaction Equations (5) and (6),
Δ r G T Ө = R T ln K Ө = R T ln P CO 2 ν CO 2 = R T ln P CO 2 P Ө ν CO 2   ν CO 2   =   1 ,   2 ,   3
P CO 2 = exp ( Δ r G T Ө R T ) ν CO 2   ν CO 2   =   1 ,   2 ,   3
In these equations:
P C O and P C O 2 , were relative gas pressure of CO and CO2, respectively, dimensionless, the ratio of absolute atmospheric pressure (namely P C O and P C O 2 , unit: Pa) to standard atmospheric pressure P Ө (= 101,325 Pa);
R, was ideal gas constant, 8.314 J/(mol•K);
v C O = 1, 3, 4 were the stoichiometric number of species CO in reduction reaction with only CO generated in Equations (2)–(4);
v C O 2 = 1, 2, 3 were the stoichiometric number of species CO2 in reduction reaction with only CO2 generated in Equations (5)–(7).
The volume fraction sum of CO and CO2 in the top gas of actual BF was about 41.13–42.43% [39,41], and the other parts were mainly N2 and a small amount of H2O and H2. The top gas pressure of modern advanced BF was 200–300 kPa [12,41], so the sum of the relative partial pressure of CO and CO2 could be set as 0.4–1.2. According to Equation (23) and Equation (8), the relative gas partial pressure of CO and CO2 in gasification reaction can be calculated by Equations (28)–(33).
Δ r G T Ө = R T ln ( P CO P Ө ) 2 ( P CO 2 P Ө ) = R T ln P CO 2 P CO 2   , so  P CO 2 P CO 2 = e Δ r G T Ө R T
P CO 2 P CO 2 = e Δ r G T Ө R T
P CO + P CO 2 = z ,   z = 0.4 1.2
e Δ r G T Ө R T P CO 2 + P CO z = 0 ,   z = 0.4 1.2
P CO = 1 + 1 + 4 z e Δ r G T Ө R T 2 e Δ r G T Ө R T = e Δ r G T Ө R T + ( e Δ r G T Ө R T ) 2 + 4 z e Δ r G T Ө R T 2 ,   z = 0.4 1.2
P CO 2 = z 1 + 1 + 4 z e Δ r G T Ө R T 2 e Δ r G T Ө R T ,   z = 0.4 1.2
where z was the sum of the relative partial pressure of CO and that of CO2.

2.2.3. Coupling Reaction

The coupling reactions equations of the C-CO2 gasification reaction and C-FexOy direct reduction reaction were shown in Equations (34), (37) and (40), and m, n, and p were coupling parameters for Fe2O3 (s), Fe3O4 (s), FeO (s), respectively. Due to the existence of CO2, the variation range of m, n and p were fixed as 0 ≤ m ≤ 3, 0 ≤ n ≤ 2, 0 ≤ p ≤ 1, respectively. Equations (35), (38), and (41) were the isothermal equations between the Gibbs free energy and gas partial pressure. According to the ratio of the gas partial pressure of CO and CO2, the Equations (36), (39), and (42) were used to calculate the equilibrium gas partial pressure and the equilibrium gas volume fraction.
From the Equations (36), (39), and (42), the volume fraction of CO and CO2 were not a function of temperature and were affected by the coupling parameter.
When m = 3, n = 2, and p = 1, the Equations (34), (37) and (40), were equal to the Equations (2), (3) and (4), respectively. When m = 0, n = 0, and p = 0, the Equations (34), (37) and (40) were equal to the Equations (5), (6) and (7), respectively.
  1 ×   3C(s) + 2Fe 2 O 3 (s) = 4Fe(s) + 3CO 2 (g)   +   m ×   C(s) + CO 2 (g) = 2CO(g)   ;          m = 0 3.0   ¯ ( m + 3 )C(s) + 2Fe 2 O 3 (s) = 4 Fe(s) + 2 m CO(g) + (3- m )CO 2 (g)
Δ r G T Ө = R T ln ( P CO P Ө ) 2 m ( P CO 2 P Ө ) 3 m = R T ln P CO 2 m P CO 2 3 m
P CO 2 m P CO 2 3 m = e Δ r G T Ө R T P CO P CO 2 = 2 m 3 m 1.10 P CO + P CO 2 = z   z = 0.4 1.2 P CO 2 = ( 2 m 3 m ) 2 m e Δ r G T Ө R T 3 + m = 3 m 3 + m z = z φ CO 2 P CO = ( 2 m 3 m ) 3 m e Δ r G T Ө R T 3 + m = 2 m 3 + m z = z φ CO φ CO 2 = 3 m 3 + m φ CO = 2 m 3 + m m 0 , m 3 1.06 < m < 3 0.4 P CO  or  P CO 1.2
  1 ×   2C(s) + Fe 3 O 4 (s) = 3Fe(s) + 2CO 2 (g)   +   n ×   C(s) + CO 2 (g) = 2CO(g)   ;          n = 0 2.0   ¯ ( n + 2 )C(s) + Fe 3 O 4 (s) = 3 Fe(s) + 2 n CO(g) + (2- n )CO 2 (g)
Δ r G T Ө = R T ln ( P CO P Ө ) 2 n ( P CO 2 P Ө ) 2 n = R T ln P CO 2 n P CO 2 2 n
P CO 2 n P CO 2 2 n = e Δ r G T Ө R T P CO P CO 2 = 2 n 2 n 1.10 P CO + P CO 2 = z z = 0.4 1.2   P C O 2 = ( 2 n 2 n ) 2 n e Δ r G T Ө R T 2 + n = 2 n 2 + n z = z φ C O 2 P CO = ( 2 n 2 n ) 2 n e Δ r G T Ө R T 2 + n = 2 n 2 + n z = z φ CO φ CO 2 = 2 n 2 + n φ CO = 2 n 2 + n n 0 ( n 2.0 ) 0.71 < n < 2 0.4 P CO   or   P CO 1.2
  1 ×   C(s) + 2FeO(s) = 2Fe(s) + CO 2 (g)   +   p ×   C(s) + CO 2 (g) = 2CO(g)   ;         p = 0 1.0 ¯ ( p + 1 )C(s) + 2FeO(s) = 2 Fe(s) + 2 p CO(g) + ( 1 p ) CO 2 (g)
Δ r G T Ө = R T ln ( P CO P Ө ) 2 p ( P CO 2 P Ө ) 1 p = R T ln P CO 2 p P CO 2 1 p
P CO 2 p P CO 2 1 p = e Δ r G T Ө R T P CO P CO 2 = 2 p 1 p 1.10 P CO + P CO 2 = z z = 0.4 1.2   P CO 2 = ( 2 p 1 p ) 2 p e Δ r G T Ө R T 1 + p = 1 p 1 + p z = z φ CO 2 P CO = ( 2 p 1 p ) 1 p e Δ r G T Ө R T 1 + p = 2 p 1 + p z = z φ CO φ CO 2 = 1 p 1 + p φ CO = 2 p 1 + p p 0 , p 1.0 , 0.35 < p < 1 0.4 P CO   or   P CO 1.2

3. Results and Discussion

3.1. Reduction Reactions between Carbon and Iron Oxides

3.1.1. Standard Gibbs Free Energy

According to Table 2 and Equations (2)–(7) and (13)–(20), the standard Gibbs free energy of reduction reactions between carbon and iron oxides with single gas product generation were calculated, and the graphical representation of these functions was shown in Figure 3. It should be noted that the displayed line was composed of piecewise functions according to the temperature range in Table 2. When Δ r G T Ө = 0 and P CO = P C O 2 = P Ө , the temperature T was the lowest critical temperature at which the reaction could start. The critical reaction temperatures for the reduction reactions of iron-containing raw materials Fe2O3(s), Fe3O4(s), FeO(s) with C(s) to generated CO2 were 872 K, 997 K, 1144 K, respectively. The critical reaction temperatures for the reduction reactions of iron-containing raw materials Fe2O3(s), Fe3O4(s), FeO(s) with C(s) to generated CO were 924 K, 983 K, 1044 K, respectively. The lowest critical temperature of carbon and iron oxides was at 872 K for the reaction 3C(s) + 2Fe2O3(s) = 4Fe(s) + 3CO2(g), and the highest temperature was at 1144 K for the reaction C(s) + 2FeO(s) = 2Fe(s) + CO2(g).

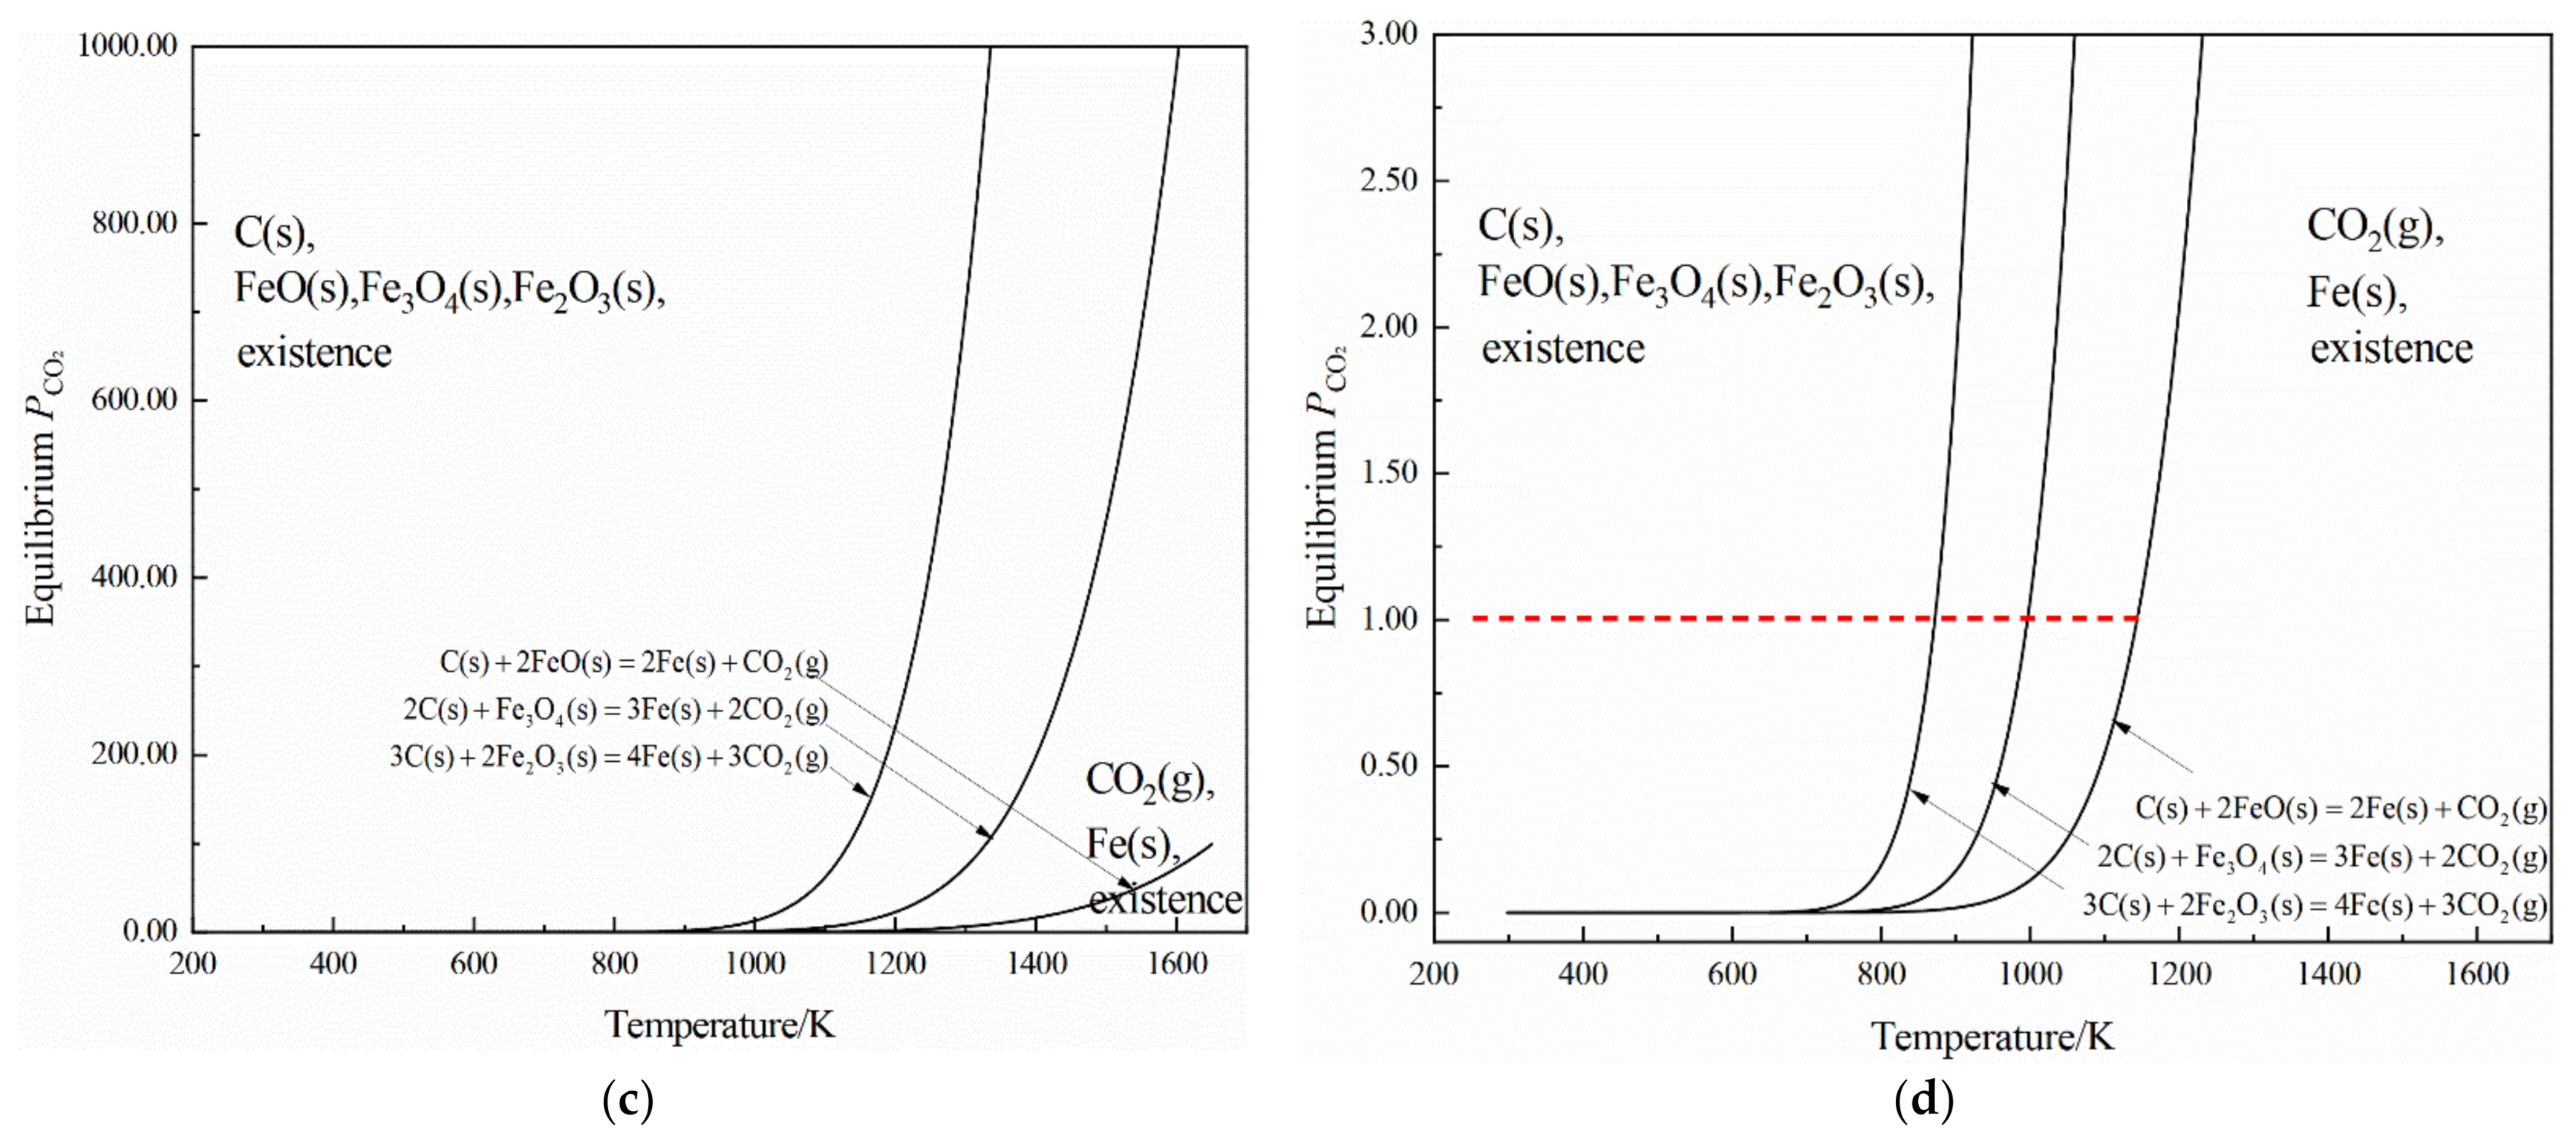
3.1.2. Equilibrium Relative Gas Partial Pressure of CO and CO2

According to Table 2 and Equations (23)–(27), the equilibrium relative gas partial pressure of CO and CO2 of reduction reactions between carbon and iron oxides were calculated, and the graphical representation of these functions was shown in Figure 4. Figure 4a,c displayed the global y-axis as 0–1000, and Figure 4b,d displayed the local y-axis as 0–3 to display comparative connections of different raw materials. All the curves in Figure 3 increased with rising temperature, and the y-axis coordinate values could be more than 100 when the temperature was more than 1200 K. Figure 4 shows that the equilibrium relative gas partial pressure of CO or CO2 at the same temperature in order from high to low were Fe2O3(s), Fe3O4(s), FeO(s).
When the actual relative gas partial pressure was lower than the equilibrium relative gas partial pressure, it was more likely to produce metallic iron. In other words, making the gas partial pressure lower than the equilibrium value was beneficial for decreasing the critical reaction temperature. The equilibrium relative gas partial pressure of CO and CO2 was set as 0.01, 0.10, 0.25, 0.50, 0.75, 1.00, which were not more than one atmosphere, and the corresponding critical reaction temperatures were clear, which were listed in Table 3. For example, the reaction temperature of 3C(s) + 2Fe2O3(s) = 4Fe(s) + 3CO2(g) decreased from 872 K at P C O 2   =   1 to 712 K at P C O 2   =   0.01 , and the decreased extent was 160 K.
In actual BFs, the value of relative gas partial pressure of CO and CO2 was larger than 0.2. According to Figure 4, the lowest temperature was required to be more than 857 K for the reaction between C(s) and Fe2O3(s) with only CO generated and more than 808 K for the reaction between C(s) and Fe2O3(s) with only CO2 generated, respectively. This was so that the possible reactions of carbon and iron oxides in the BF could be set as more than 808 K.

3.1.3. Standard Reaction Enthalpy

According to Table 2 and Equation (21), the standard enthalpy function per mole iron produced by reduction reactions was calculated, and the graphical representation of these functions was shown in Figure 5. Table 4 demonstrates the data of the reaction energy consumption per ton metallic iron produced at the temperature range of 298–1650 K. The reduction temperatures of 1173 K, 1273 K, 1373 K, 1473 K, 1573 K, 1650 K were set to evaluate the energy consumption of reduction reactions.
From Figure 5 and Table 4, for the same kind of iron oxide, the energy consumption of the reduction reaction with only CO generated was nearly twice as much as that of the reduction reaction with generating CO2. In the same type of reaction, energy consumption in order from high to low were Fe2O3 (s), Fe3O4 (s), FeO (s). It was important to note that the energy consumption of the above reactions reached a peak at 298K, and remained downward as a function of temperature. For instance, the reaction energy consumption per ton of iron through the reaction of 3C(s) + 2Fe2O3(s) = 4Fe(s) + 3CO2(g) was decreased from 2.100 GJ/t at 298 K to 1.848 GJ/t at 1650 K, and the decreased percent was 12.01%, which should not be neglected. So, the use of the reaction enthalpy at 298 K for the heat calculation was inappropriate, and the reaction temperature should be confirmed when the reaction enthalpy was used.

3.2. Gasification Reaction between Carbon and CO2

3.2.1. Standard Gibbs Free Energy

According to Table 2 and Equation (8), the standard Gibbs free energy of gasification reaction between carbon and CO2 was calculated, and the graphical representation of these functions was shown in Figure 6. When T > 972   K , Δ r G T Ө < 0 the reaction of C(s) + CO2(g) = 2CO(g) went forward.

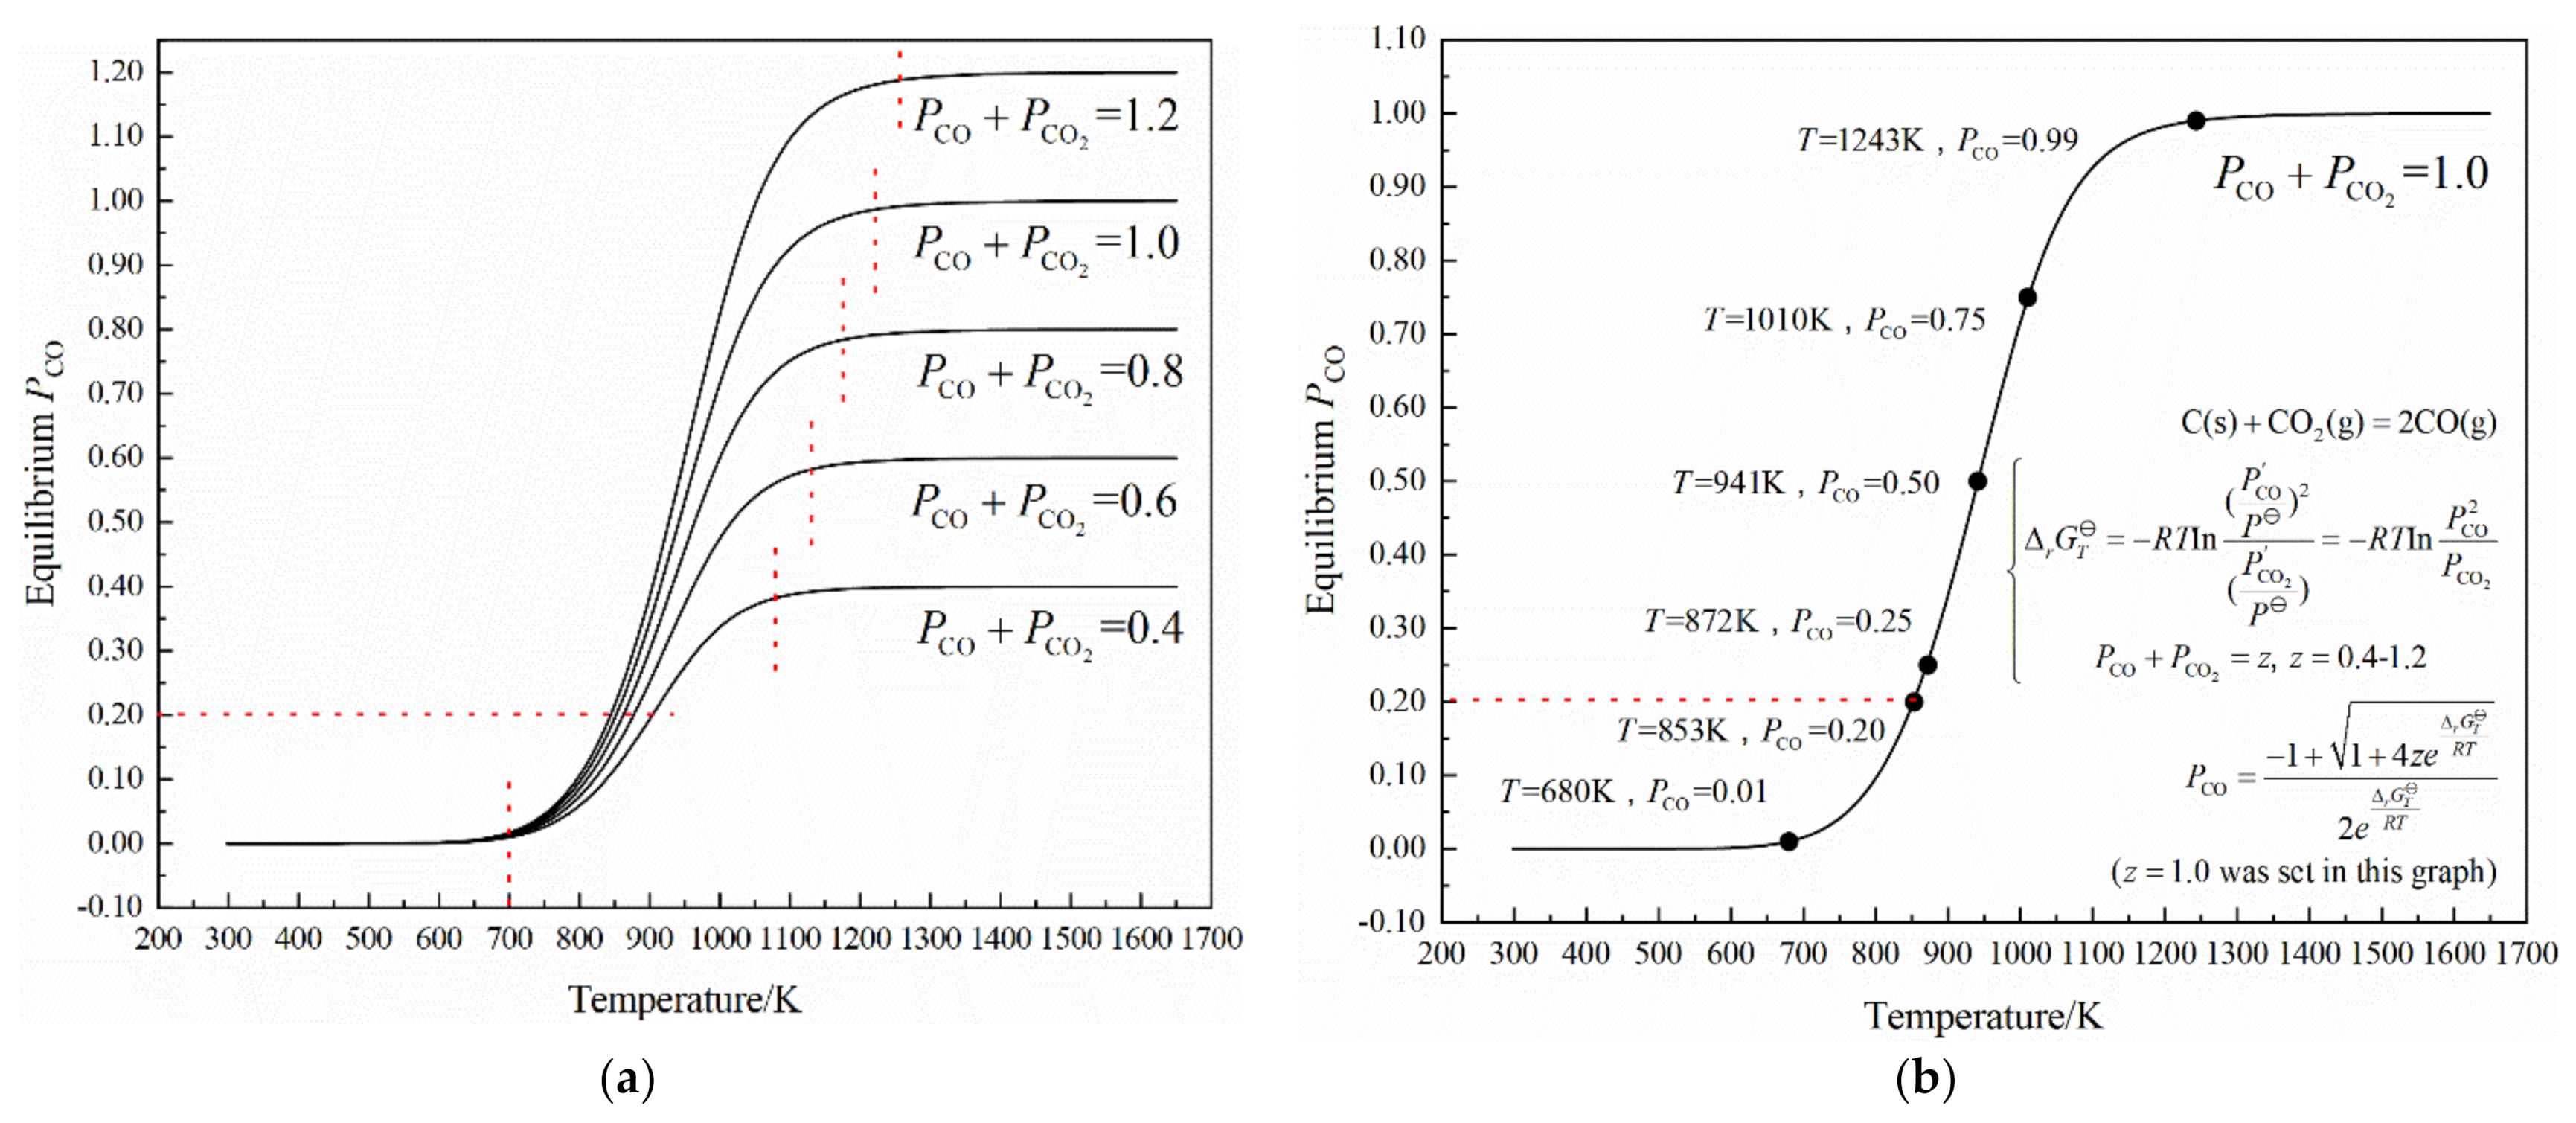
3.2.2. Equilibrium Relative Gas Partial Pressure of CO

According to Table 2 and Equations (28)–(33), the equilibrium relative gas partial pressure of CO and CO2 of the reaction of C(s) + CO2(g) = 2CO(g) was calculated, and the graphical representation of these functions was shown in Figure 7.
For the varied sum value (0.4, 0.6, 0.8, 1.0, 1.2) of the relative gas partial pressure of CO and CO2, the equilibrium P CO was displayed in an S-shaped curve in Figure 7. The relative gas partial pressure of CO increased with the sum value increasing at the same temperature. The curves in Figure 7a increased slightly at T < 700   K with P CO < 0.02 and jumped sharply at about T = 700 1100   K , and then remained stable at T > 1100   K with P CO < 0.02 .
Figure 7b showed the six sets of grid data of equilibrium P CO with P CO + P CO 2 = 1 , to display the change of P CO and temperature in more detail. Equilibrium P CO increased with the temperature rising. When the equilibrium relative gas partial pressure of CO was set as 0.01, 0.20, 0.25, 0.50, 0.75, 0.99, the corresponding critical reaction temperature was 680 K, 853 K, 872 K, 941 K, 1010 K, 1243 K, respectively. When the actual P CO was less than the equilibrium P CO , the reaction of C(s) + CO2(g) = 2CO(g) went forward.
The relative gas partial pressure of CO and CO2 was less than 0.2 in actual BF, so the gasification temperature of C(s) + CO2(g) = 2CO(g) should be considered as more than 905 K.

3.2.3. Standard Reaction Enthalpy of the Gasification Reaction and Combustion Reaction

According to Table 2 and Equation (8), the standard enthalpy of the gasification reaction of C(s) + CO2(g) = 2CO(g) was shown in Figure 8a, and increased from 172.423 kJ/mol at 298 K to 173.683 kJ/mol at 527 K, and then decreased to 163.974 kJ/mol at 1650 K. Obviously, the standard enthalpy of the gasification at the temperature more than 905 K was less than that at 298 K. For the calculation of energy consumption of the gasification reaction of C(s) + CO2(g) = 2CO(g), it was necessary to confirm the given temperature. In the follow up energy consumption calculation, the temperature of the gasification reaction was set to the same as that of the reduction reaction, namely being 1173 K, 1273 K, 1373 K, 1473K, 1573K, 1650 K.
According to Table 2 and Equation (9), the standard enthalpy of the combustion reaction of C(s) + O2(g) = CO2(g) was shown in Figure 8b and decreased from −393.505 kJ/mol at 298 K to −396.631 kJ/mol at 1650 K.
The temperature of hot air injected into BF was 1413–1533 K (1140–1260 °C) [8,12], and thus the average temperatures of 1473 K could be set as the temperature of O2 (g) and combustion reaction. The combustion enthalpy at 1473 K was −396.218 kJ/mol, namely −0.0330 GJ/kg C and 30.286 kg C/GJ.

3.3. Coupling Reaction of Reduction and Gasification

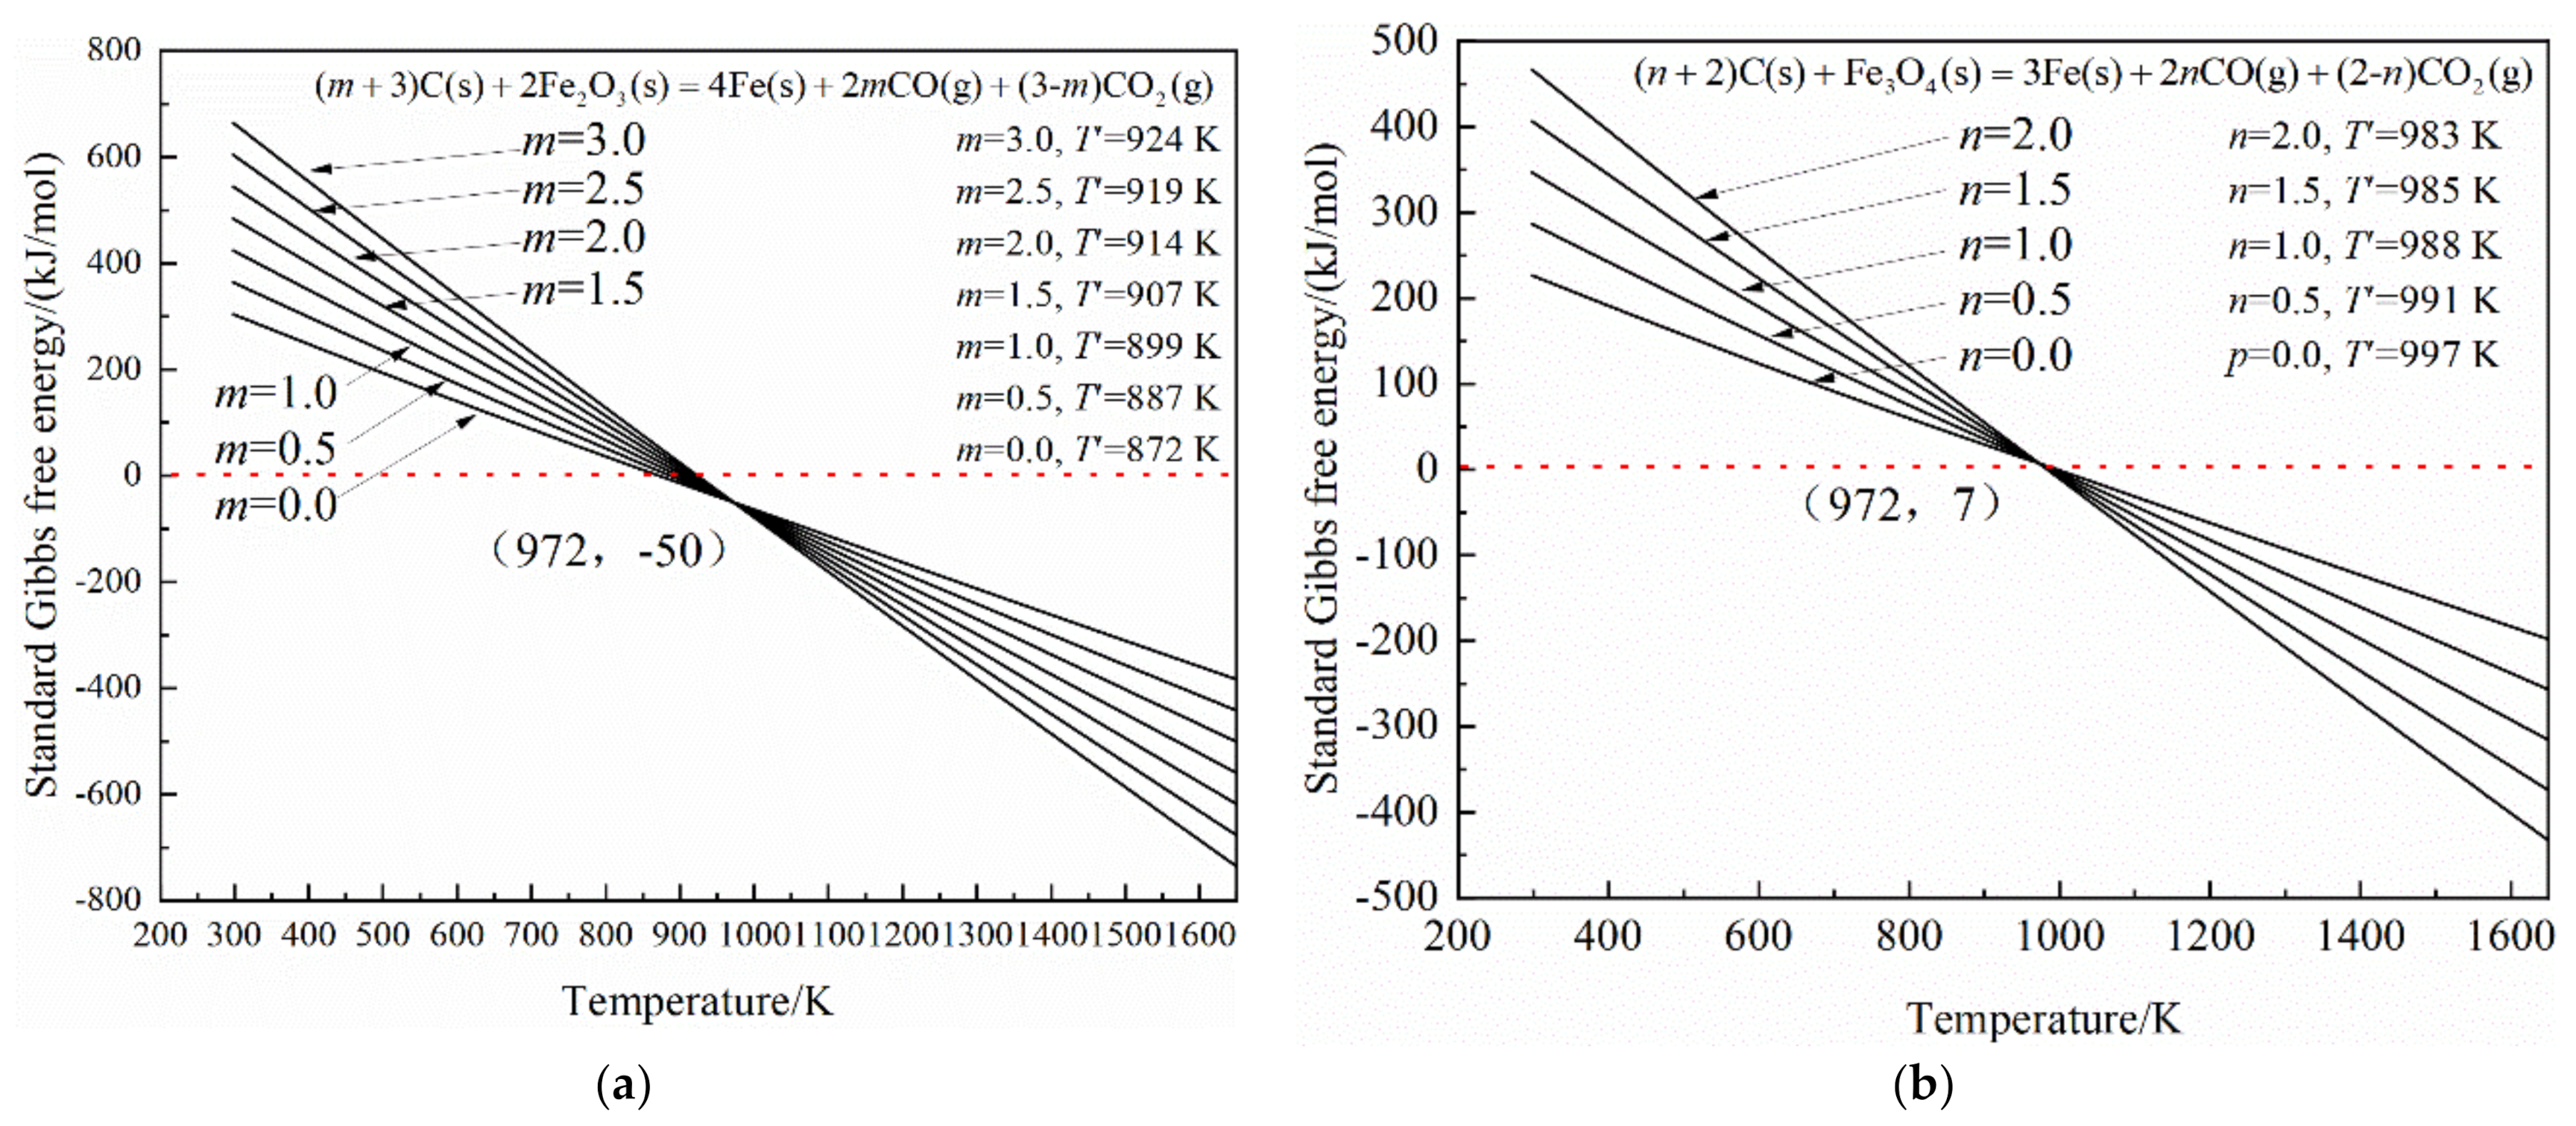
3.3.1. Standard Gibbs Free Energy

According to Table 2 and the Equations (34), (37) and (40), the standard Gibbs free energy of the coupling reaction with varied coupling parameters was shown in Figure 9 and decreased with the increasing temperature.
T’ was the critical temperature when the standard Gibbs free energy was zero, and increased with the coupling parameters increasing for the reaction (m+3)C(s) + 2Fe2O3(s) = 4Fe(s) + 2mCO(g) + (3 − m)CO2(g) and the reaction (p+1)C(s) + 2FeO(s) = 2Fe(s) + 2pCO(g) + (1 − p)CO2(g), which were shown in Figure 9a,b, respectively. The T’ decreased slightly with the coupling parameter increasing for the reaction (n + 2)C(s) + Fe3O4(s) = 3Fe(s) + 2nCO(g) + (2 − n)CO2(g). It could be seen that when the temperature was more than 1144 K, all the coupling reactions could start. For the different iron oxides, Figure 9 shows that one crossover point appeared for varied coupling parameters, and the temperature was 972 K.

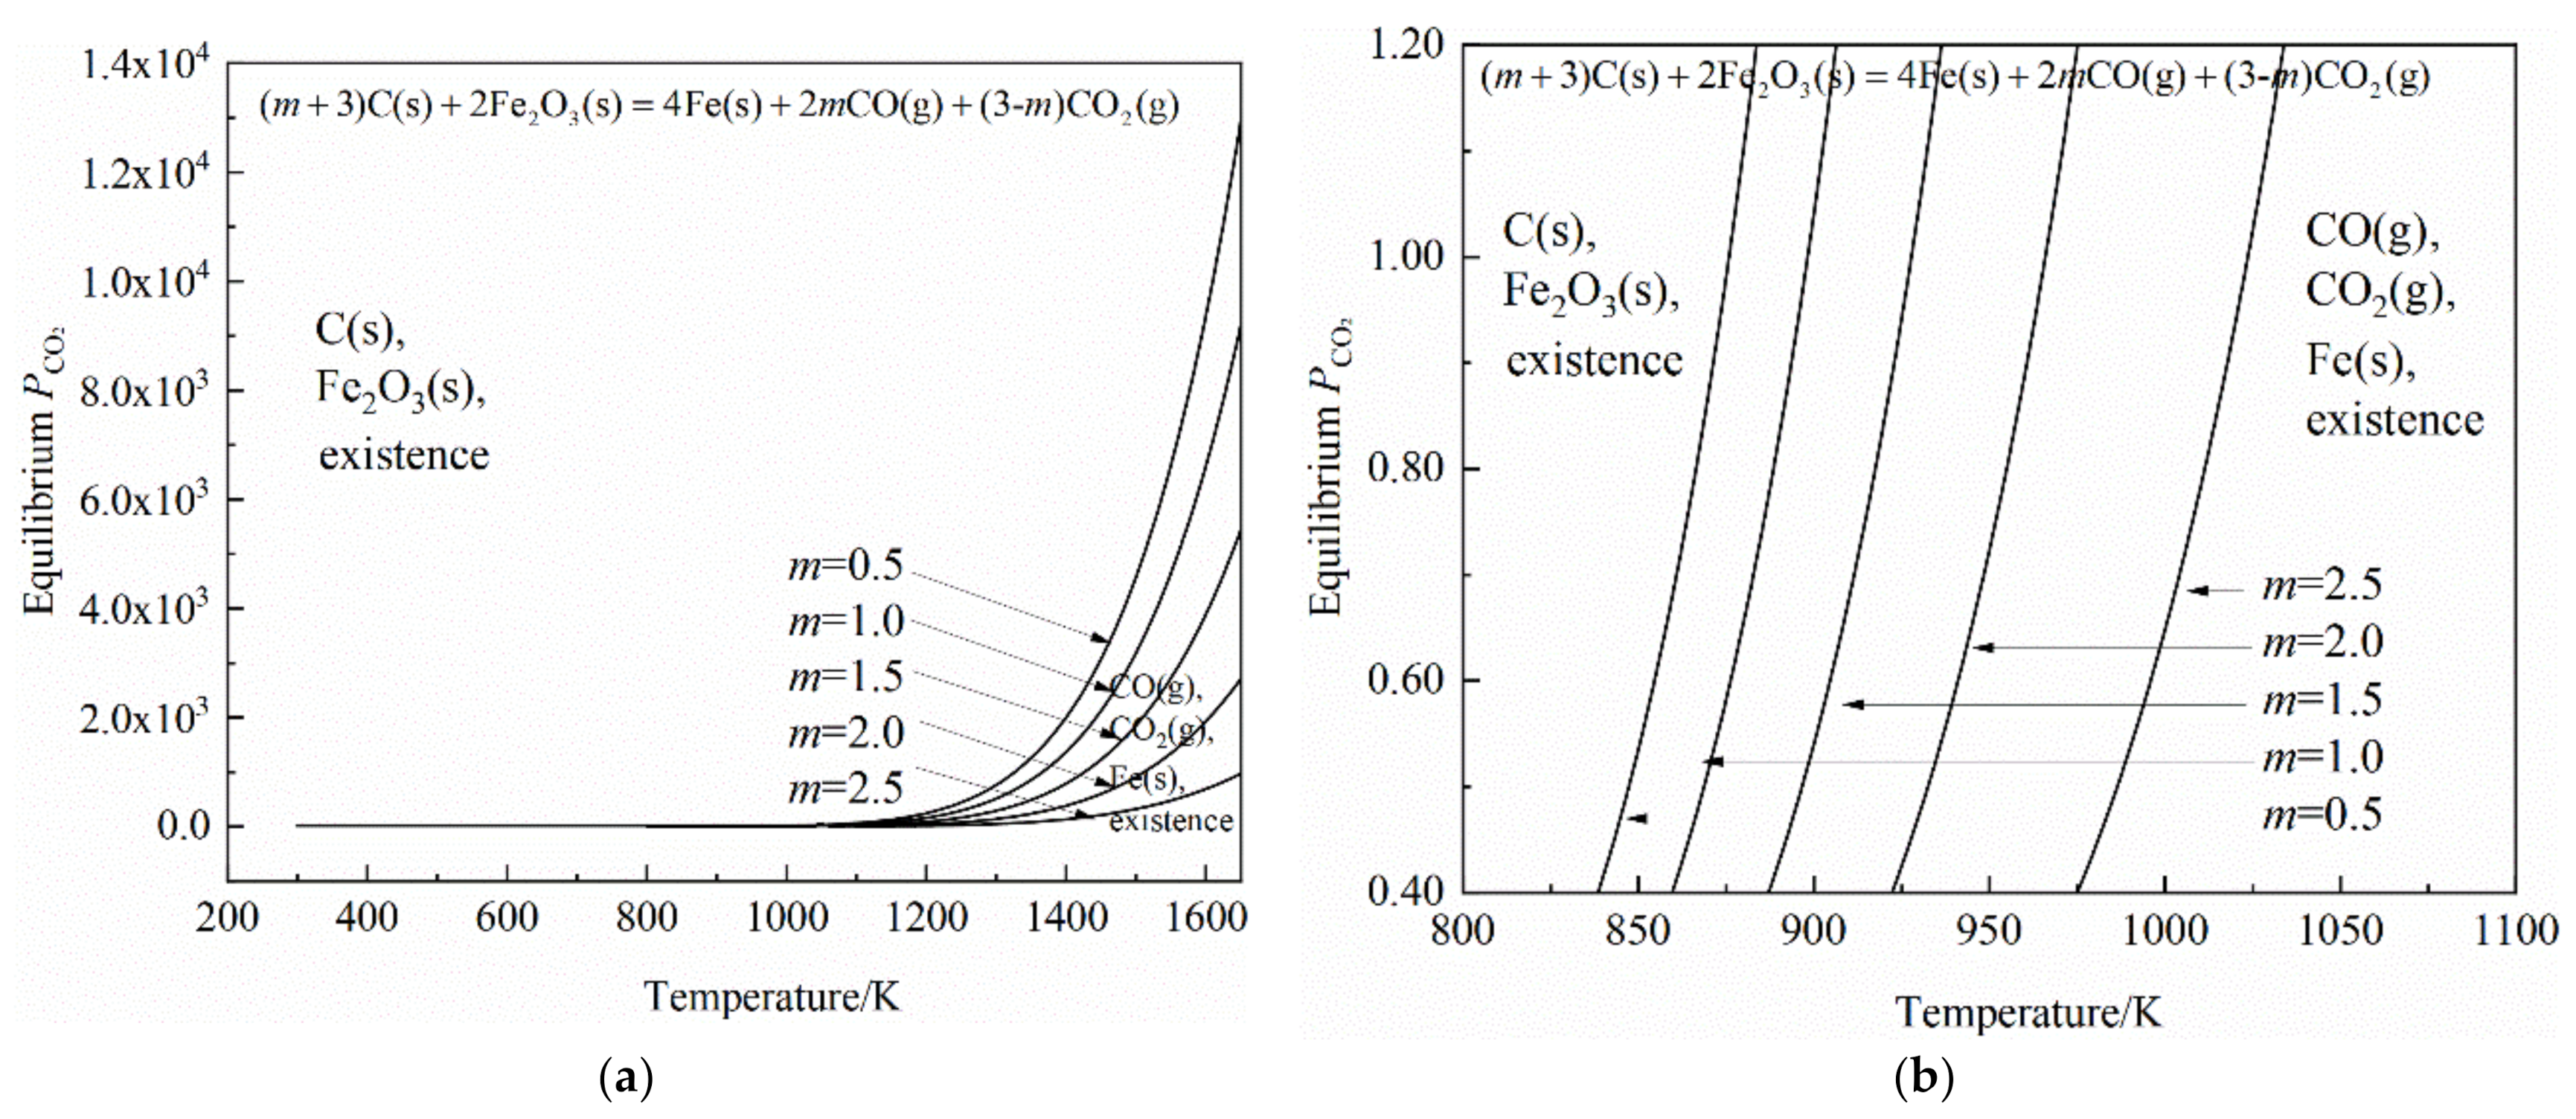
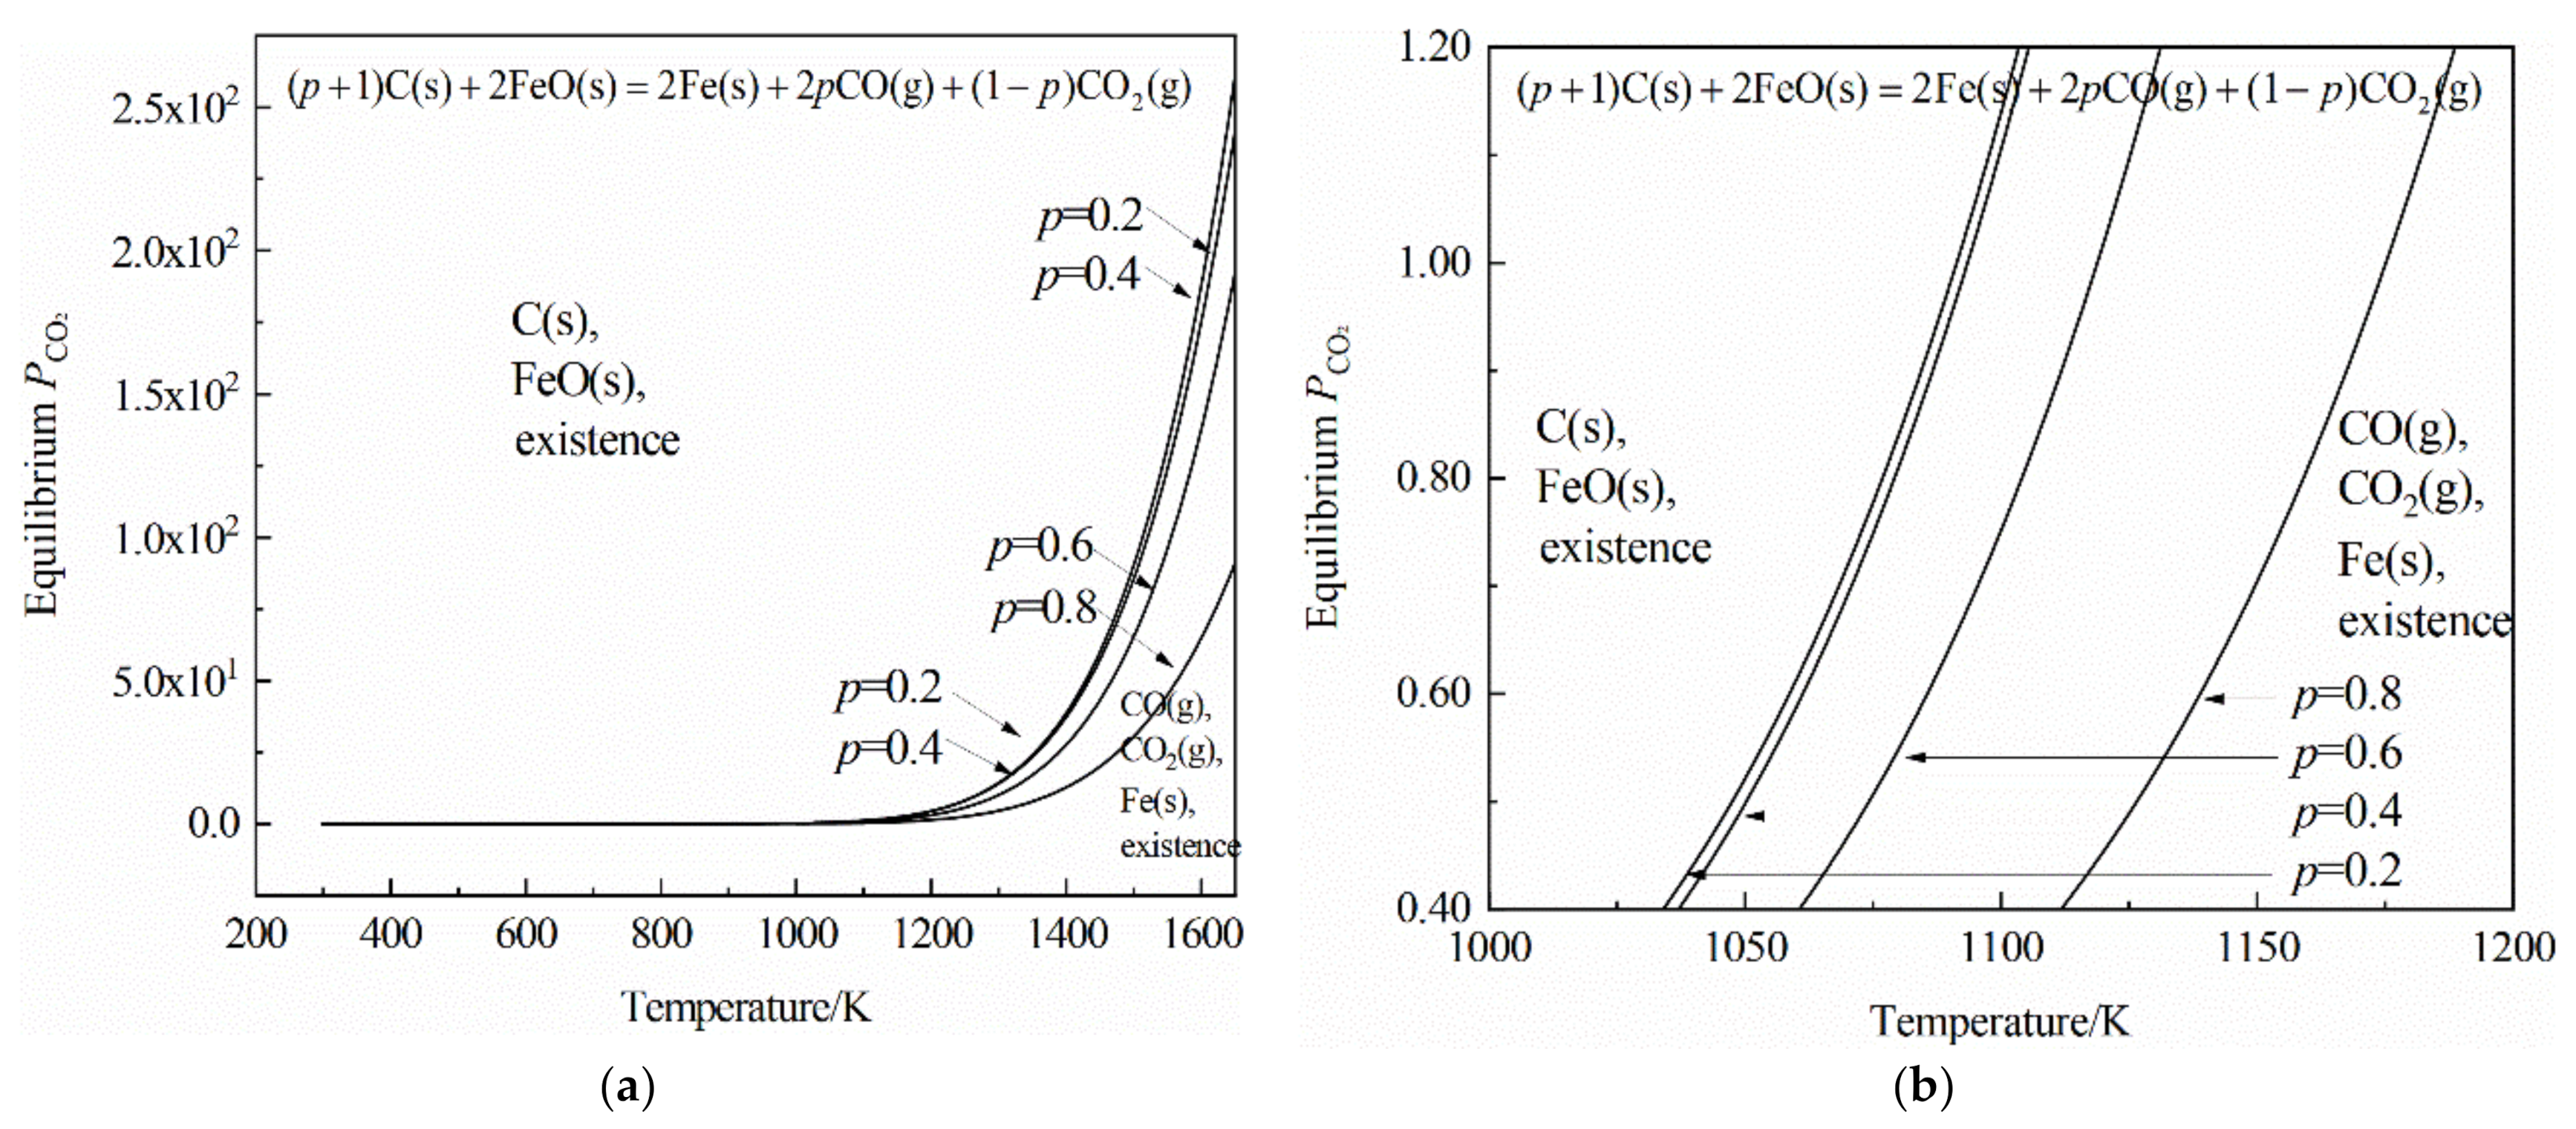
3.3.2. Relative Gas Partial Pressure of CO and CO2

According to the Table 2 and Equations (36), (39), and (42), the equilibrium relative gas partial pressure of CO2 was calculated, and the graphical representation of these functions was shown in Figure 10 for the reaction of (m + 3)C(s) + 2Fe2O3(s) = 4Fe(s) + 2mCO(g) + (3 − m)CO2(g) (m = 0.5, 1.0, 1.5, 2.0, 2.5), and in Figure 11 for the reaction of (n + 2)C(s) + Fe3O4(s) = 3Fe(s) + 2nCO(g) + (2 − n)CO2(g) (n = 0.5, 1.0, 1.5), and in Figure 12 for the reaction of (p + 1)C(s) + 2FeO(s) = 2Fe(s) + 2pCO(g) + (1 − p)CO2(g) (p = 0.2, 0.4, 0.6, 0.8), respectively. The global graph was displayed when the y-axis value was greater than 10, and the local graph was displayed when the y-axis value was less than 1.2.
The equilibrium relative gas partial pressure of CO2 increased with temperature increases and decreased with increasing coupling parameters, namely more CO2 was converted to CO. A similar changing rule appeared in Figure 10, Figure 11, Figure 12. When the actual relative gas partial pressure of CO2 was under the equilibrium value, the coupling reaction proceeded in the direction of producing Fe(s) + CO(g) + CO2(g).
When the equilibrium relative gas partial pressure of CO2 was limited between 0.4 and 1.2, the local graphs were shown in Figure 10b, Figure 11b and Figure 12b. The curves were parallel in a single graph.
Figure 13a shows that the ratio of equilibrium gas partial pressure of CO and CO2 increased with the coupling parameters increasing and displayed a similar shape. When the ratio was fixed to 1.1–1.5, the coupling parameters were m = 1.06–1.28 for Fe2O3, n = 0.71–0.85 for Fe3O4, p = 0.35–0.43 for FeO, respectively, which was shown in Figure 13b.
According to the stoichiometry of chemical Equations (36), (39), and (42), C needed per mole iron produced and equilibrium CO2 volume fraction as a function of the coupling parameter, as shown in Figure 14a,b, respectively. The C needed per mole of Fe increased with the coupling parameters increasing and the maximum value was 1.5 mol C/mol Fe with Fe2O3 reduction, the minimum value was 0.5 mol C/mol Fe with FeO reduction. Figure 14b shows that the Equilibrium CO2 volume fraction decreased with the coupling parameters increasing, and the reason was that the coupling parameters represented the amount of the gasification reaction, which consumed CO2.

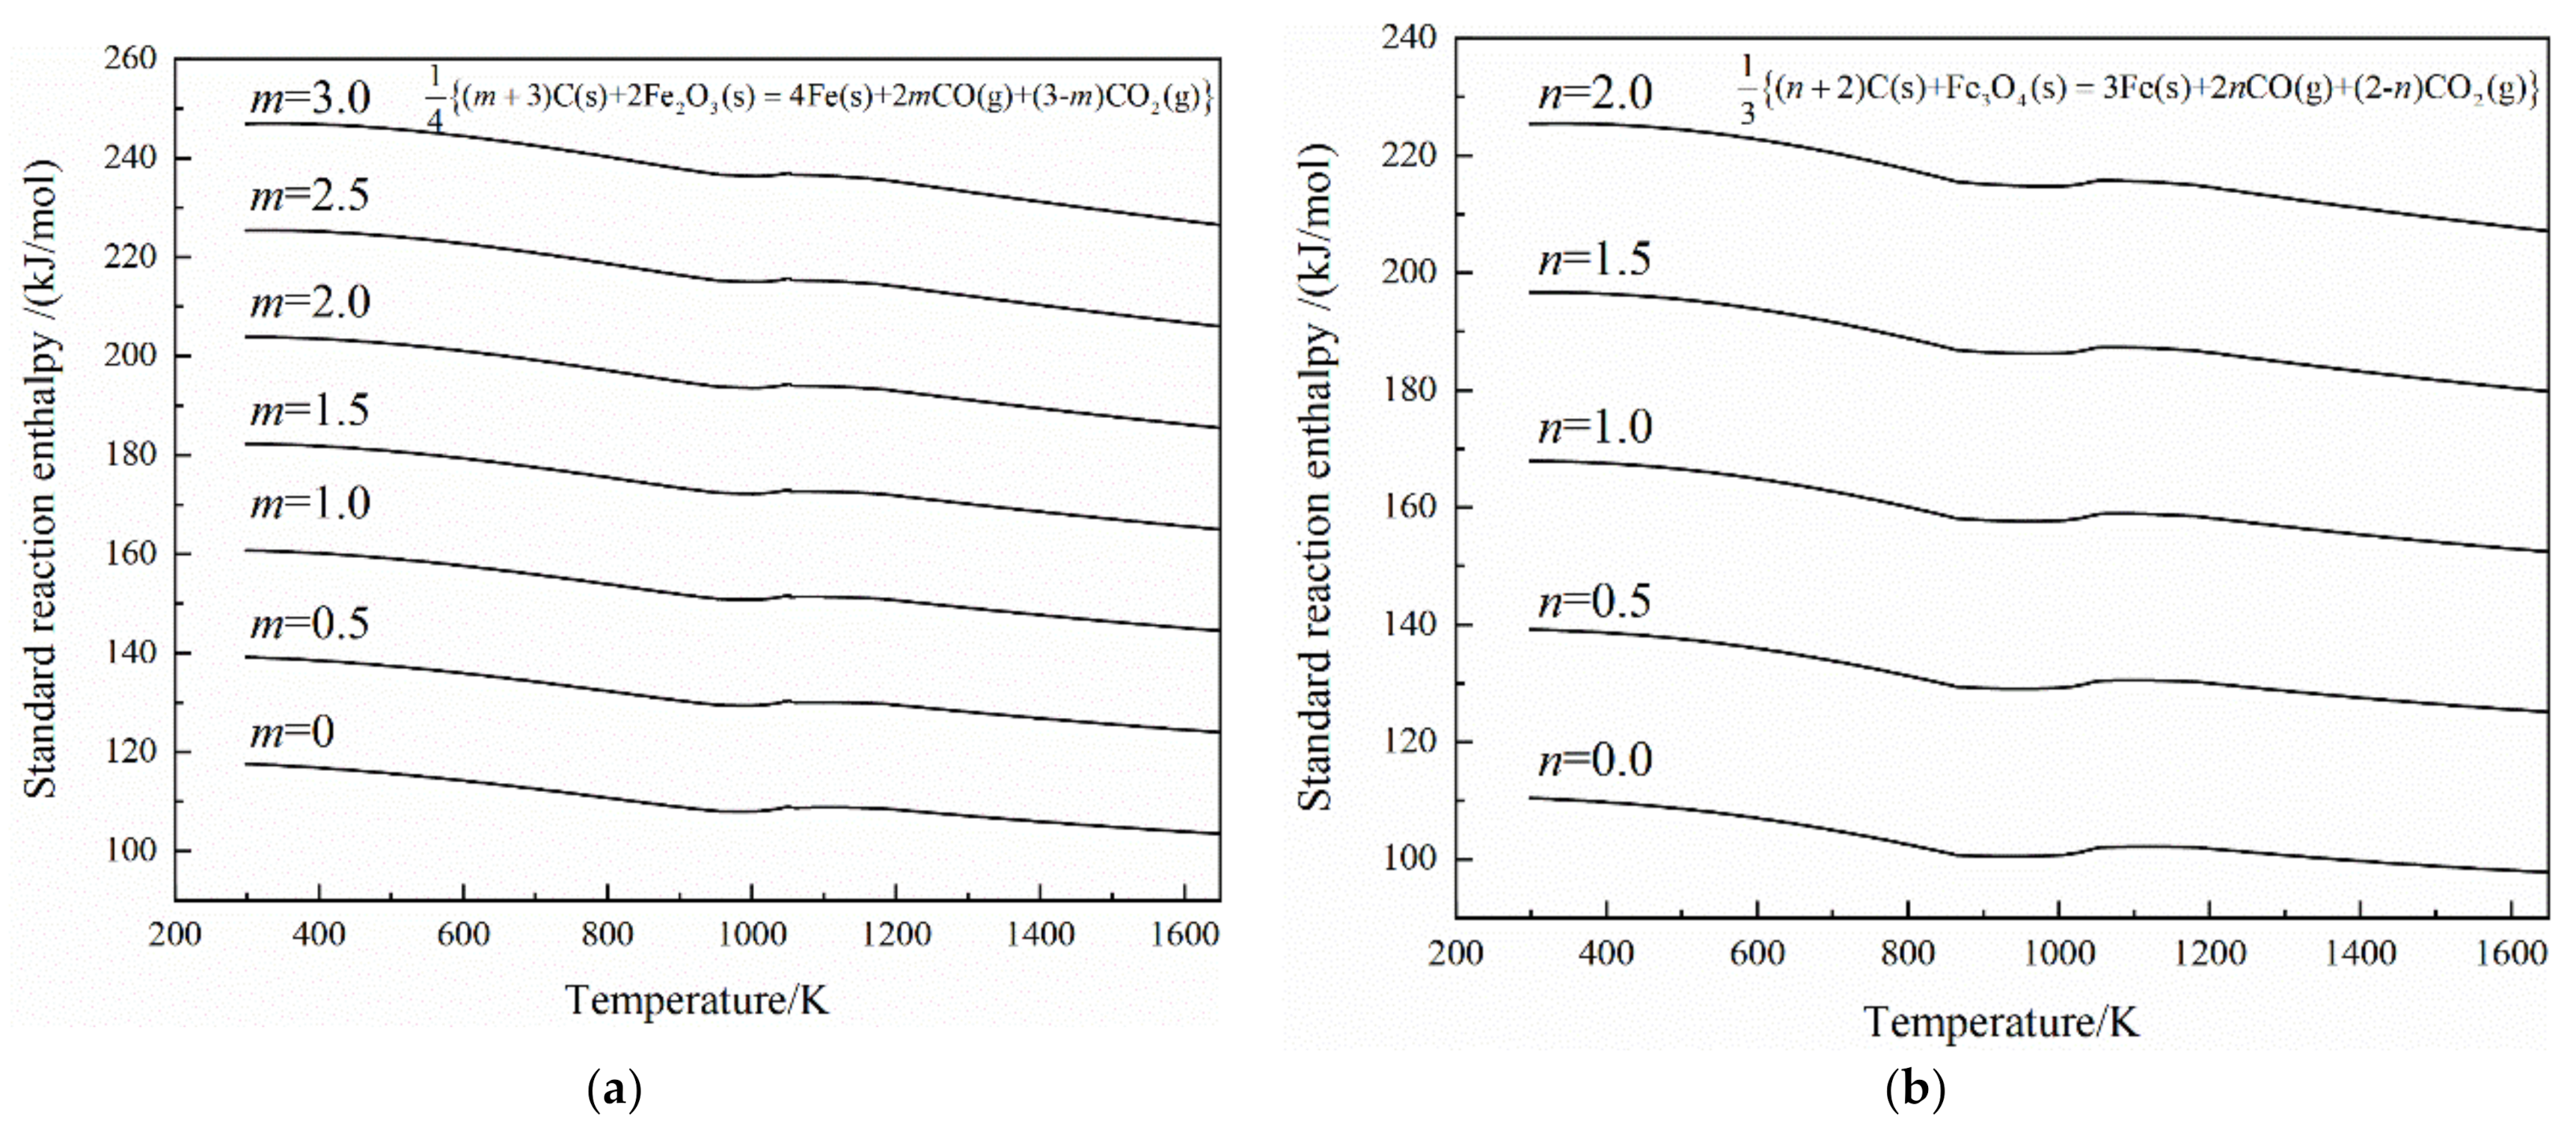
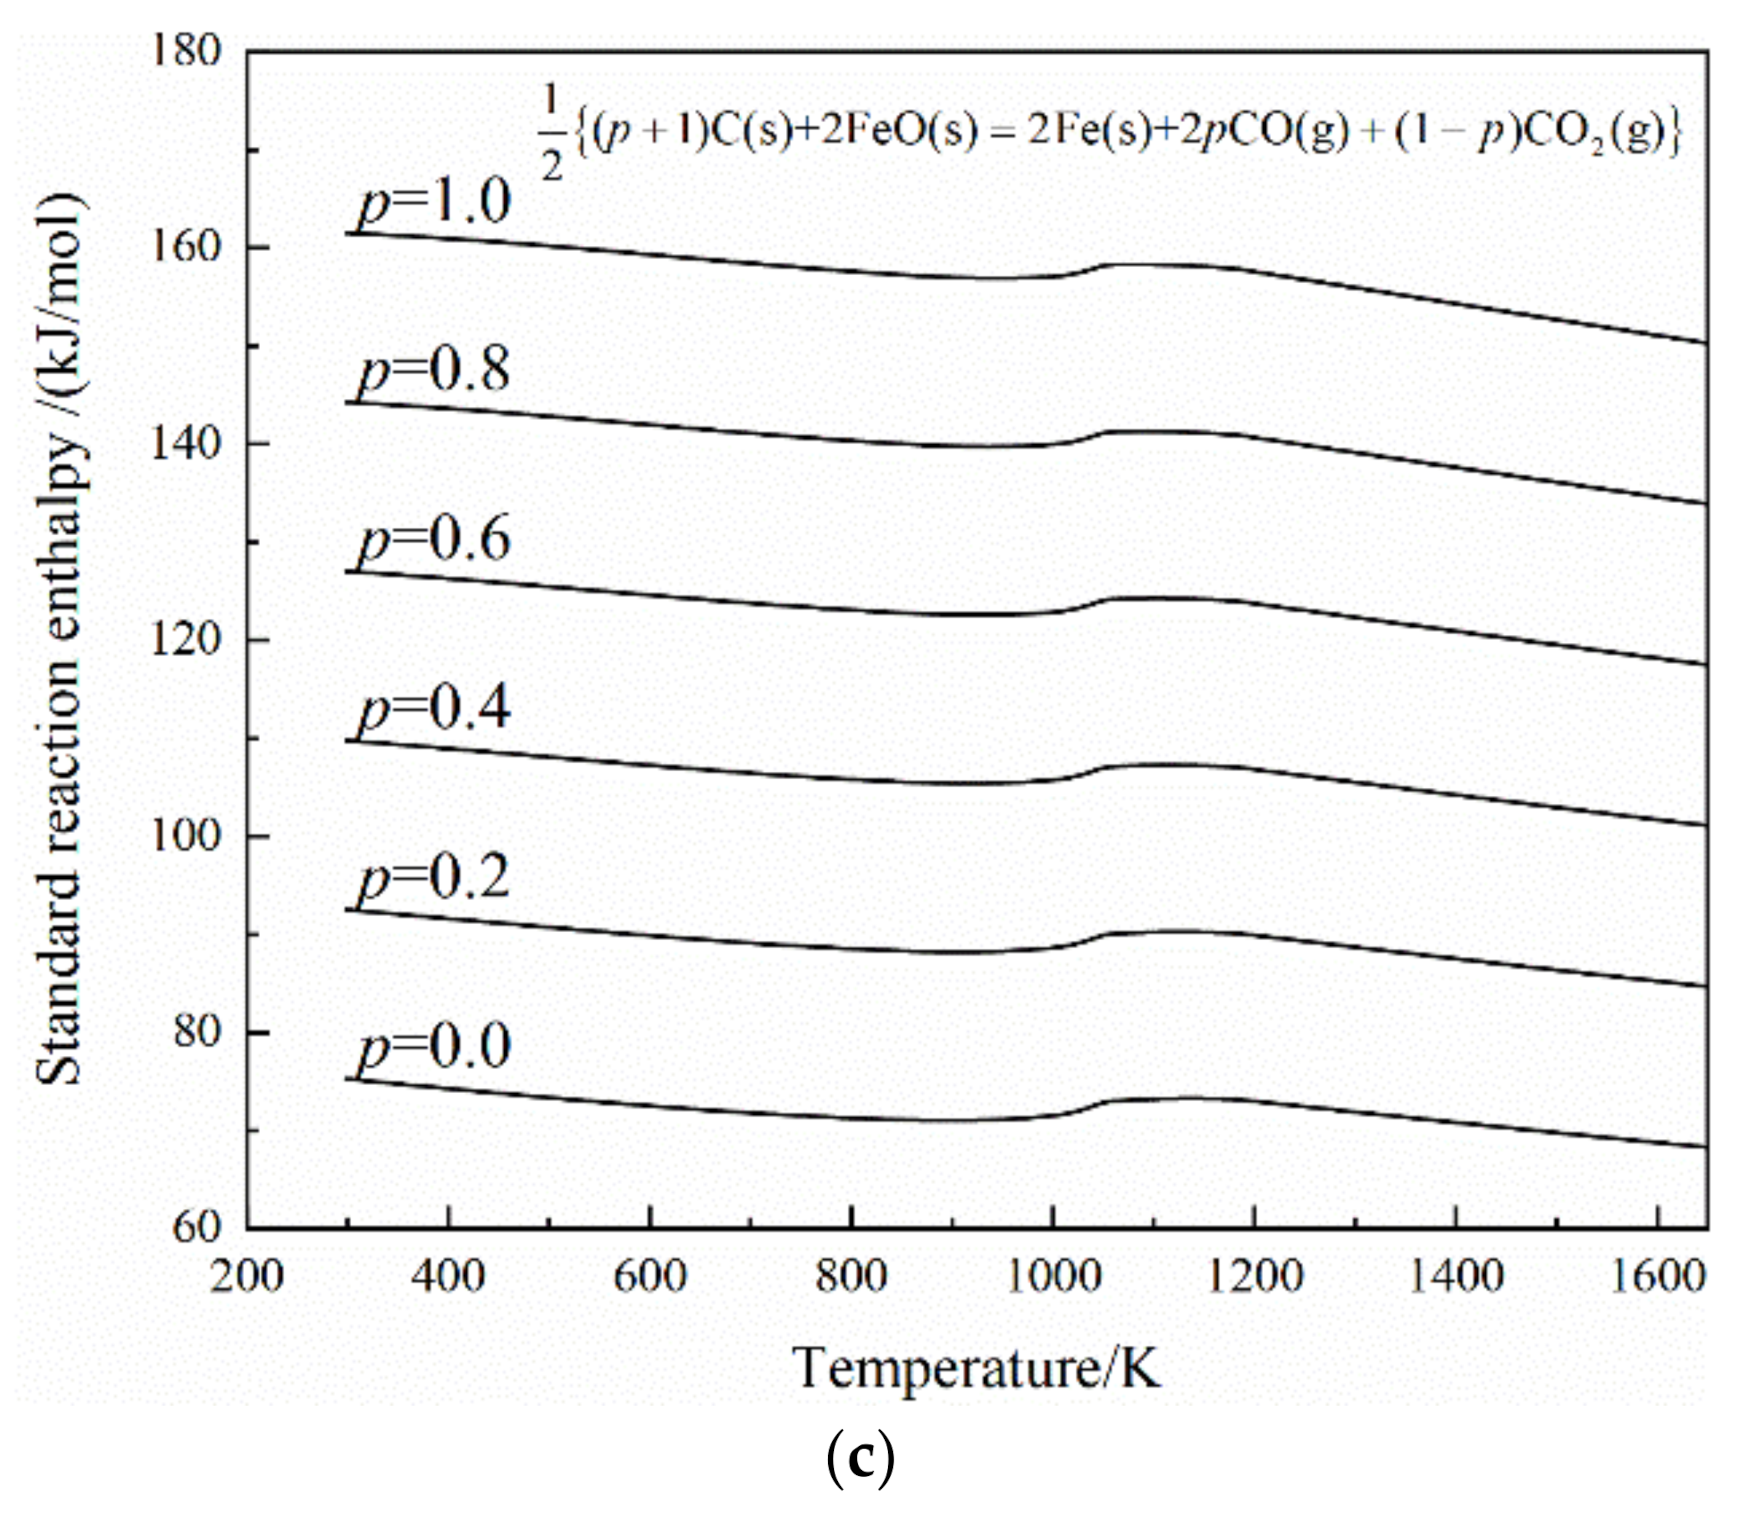
3.3.3. Standard Reaction Enthalpy

According to Table 2 and the Equations (21), (34), (37), and (40), the standard reaction enthalpy with varied coupling parameters as a function of temperature was shown in Figure 15. The standard reaction enthalpy decreased with the temperature increasing and increased with the coupling parameter increasing. Figure 15 showed that the standard reaction enthalpy increased with the coupling parameters increasing.
Table 5 showed the energy consumption of heating the coupling reactions at the reduction temperature of 1173 K, 1273 K, 1373 K, 1473 K, 1573 K, and 1650 K. When the coupling parameter was fixed, the energy consumption of heating the coupling reactions decreased with increasing temperature.

3.4. Energy Consumption of Heating Solid Materials

According to Table 2 and Equation (21), the energy consumption of heating solid materials per ton iron before smelting was calculated based on the process in Figure 16, and the result was shown in Table 6. The reduction temperature in Figure 16 was set as 1173 K, 1273 K, 1373 K, 1473 K, 1573 K, and 1650 K.
In the real process, Fe was not heated up to 1809 K, and the Fe3C generated would melt at 1500 K. Within the established system, 1809 K was set as the smelting temperature of pure Fe.
From Table 6, it could be seen that the energy consumption of heating solid materials increased with an increasing reduction temperature, and increased with increases of the coupling parameter. When the coupling parameter was fixed, the energy consumption of heating solid materials of the coupling reactions increased with the increasing temperature.

3.5. Energy Consumption Per Ton Liquid Iron

According to Equation (1) and the smelting heat per ton of pure iron, the energy consumption per ton of liquid iron was calculated, and the result was shown in Table 7 and Figure 17. From Table 7, it could be seen that the energy consumption per ton of liquid iron increased with increasing reduction temperatures, and increased with increasing the coupling parameter.
The energy consumption per ton of hot metal of BF was reported as 12.2 GJ/t (namely was 416.3 kgce/t) in 2007 in reference [5], and 11.65 GJ/t (namely was 392.1 kgce/t) in China’s key steel enterprises in 2018 [6], which were shown in Figure 17. Kgce was the unit of energy consumption and equaled the heat value 20,307 kJ of 1 kg stand coal. Compared with the reported values and the calculated values, the energy consumption of carbon reduction ironmaking could be further reduced by about 1 GJ/t (34.12 kgce/t).
To make the energy consumption of ironmaking process less than the reported value, the coupling parameter m < 2.0 was required for the reaction of (m + 3)C(s) + 2Fe2O3(s) = 4Fe(s) + 2mCO(g) + (3 − m)CO2(g), and the coupling parameter n < 1.5 was required for the reaction of (n + 2)C(s) + Fe3O4(s) = 3Fe(s) + 2nCO(g) + (2 − n)CO2(g).
When the ratio was fixed to 1.1–1.5, the energy consumption per ton liquid iron with coupling parameters m = 1.06–1.28 for Fe2O3, n = 0.71–0.85 for Fe3O4, and p = 0.35–0.43 for FeO was marked out in Figure 17, respectively, and these values were less than 11.65 GJ/t.
The minimum energy consumption was 9.952 GJ/t for Fe2O3, 9.761 GJ/t for Fe3O4, 9.007 GJ/t for FeO with the reduction reaction at 1173 K, and the maximum energy consumption was 12.883 GJ/t for Fe2O3, 12.353 GJ/t for Fe3O4, 10.951 GJ/t for FeO with the reduction reaction at 1650 K.
It should be emphasized that the energy consumption in this study was the theoretical value for pure liquid iron, and the reported values were for hot metal (also called molten pig iron) and not for pure liquid iron.

3.6. Carbon Consumption and CO2 Output

The carbon needed for supply 1 GJ heat was 30.286 kg. The carbon consumption used as reduction agent for coupling reactions and the carbon consumption for coupling reactions per ton liquid iron was shown in Table 8 and Table 9, respectively.
The carbon consumption as reduction agent per ton hot metal of BF was reported as 482kg/t, and 414 kg/t was considered to be the minimum value in the reference [48], which was shown in Figure 18. Compared with the 475–544 kg/tHM of fuel ratio of advanced BF [6], the actual values were less than the calculated values in this study, which included the combustion consumption, gasification consumption, and reduction consumption. Compared with the values in Table 8 and Table 9, the carbon used for combustion was larger than for reduction and gasification.
From Table 9, the minimum carbon consumption was 462.116 kg/t for Fe2O3, 438.478 kg/t for Fe3O4, 379.932 kg/t for FeO with the reduction reaction at 1173 K, and the maximum carbon consumption was 711.598 kg/t for Fe2O3, 659.830 kg/t for Fe3O4, 545.946 kg/t for FeO with the reduction reaction at 1650 K.
The CO2 output per ton liquid iron was shown in Table 10. From Table 10, the minimum CO2 output was 1265.854 kg/t for Fe2O3, 1226.799 kg/t for Fe3O4, 1107.368kg/t for FeO with the reduction reaction at 1173 K, and the maximum energy consumption was 1430.622 kg/t for Fe2O3, 1371.758 kg/t for Fe3O4, 1216.088 kg/t for FeO with the reduction reaction at 1650 K.
The CO2 output per ton of hot metal of BF was reported as 1650 kg/t without CCS, and 790 kg/t with CCS in reference [4], which was shown Figure 19. Obviously, the calculated values in this study were much less than the actual values without CCS. In other words, the CO2 output could be generated at a lower level.

3.7. Discussion

From the minimum energy consumption point of view, the ideal thermodynamic model for the reduction of iron oxide by carbon was shown in Figure 20, namely only CO2 was generated.
In actual BFs, this ideal model does not exist due to the presence of the gasification reaction of C and CO2. The coupling parameter of the C–CO2 reaction was the key point to adjust the energy consumption and composition of products. The more the gasification reaction occurred, the more energy consumption and CO2 output there was, and the lower the ratio of volume fraction of CO2 to that of CO.
As all reactions were in one furnace, such as a blast furnace, it was very difficult to control reactions in detail, though these reactions appeared in different areas. Another way of dividing the reduction and gasification reactions, such as a gas-based direct reduction ironmaking, was shown in Figure 21. This method can control the amount of the C–CO2 reaction, but this may need more heat to increase the gas temperature.

4. Conclusions

Through the thermodynamic functions, standard Gibbs free energy, standard reaction enthalpy, the relative gas partial pressure of CO and CO2, energy consumption, and carbon consumption were calculated, and some interesting conclusions were obtained.
(1)
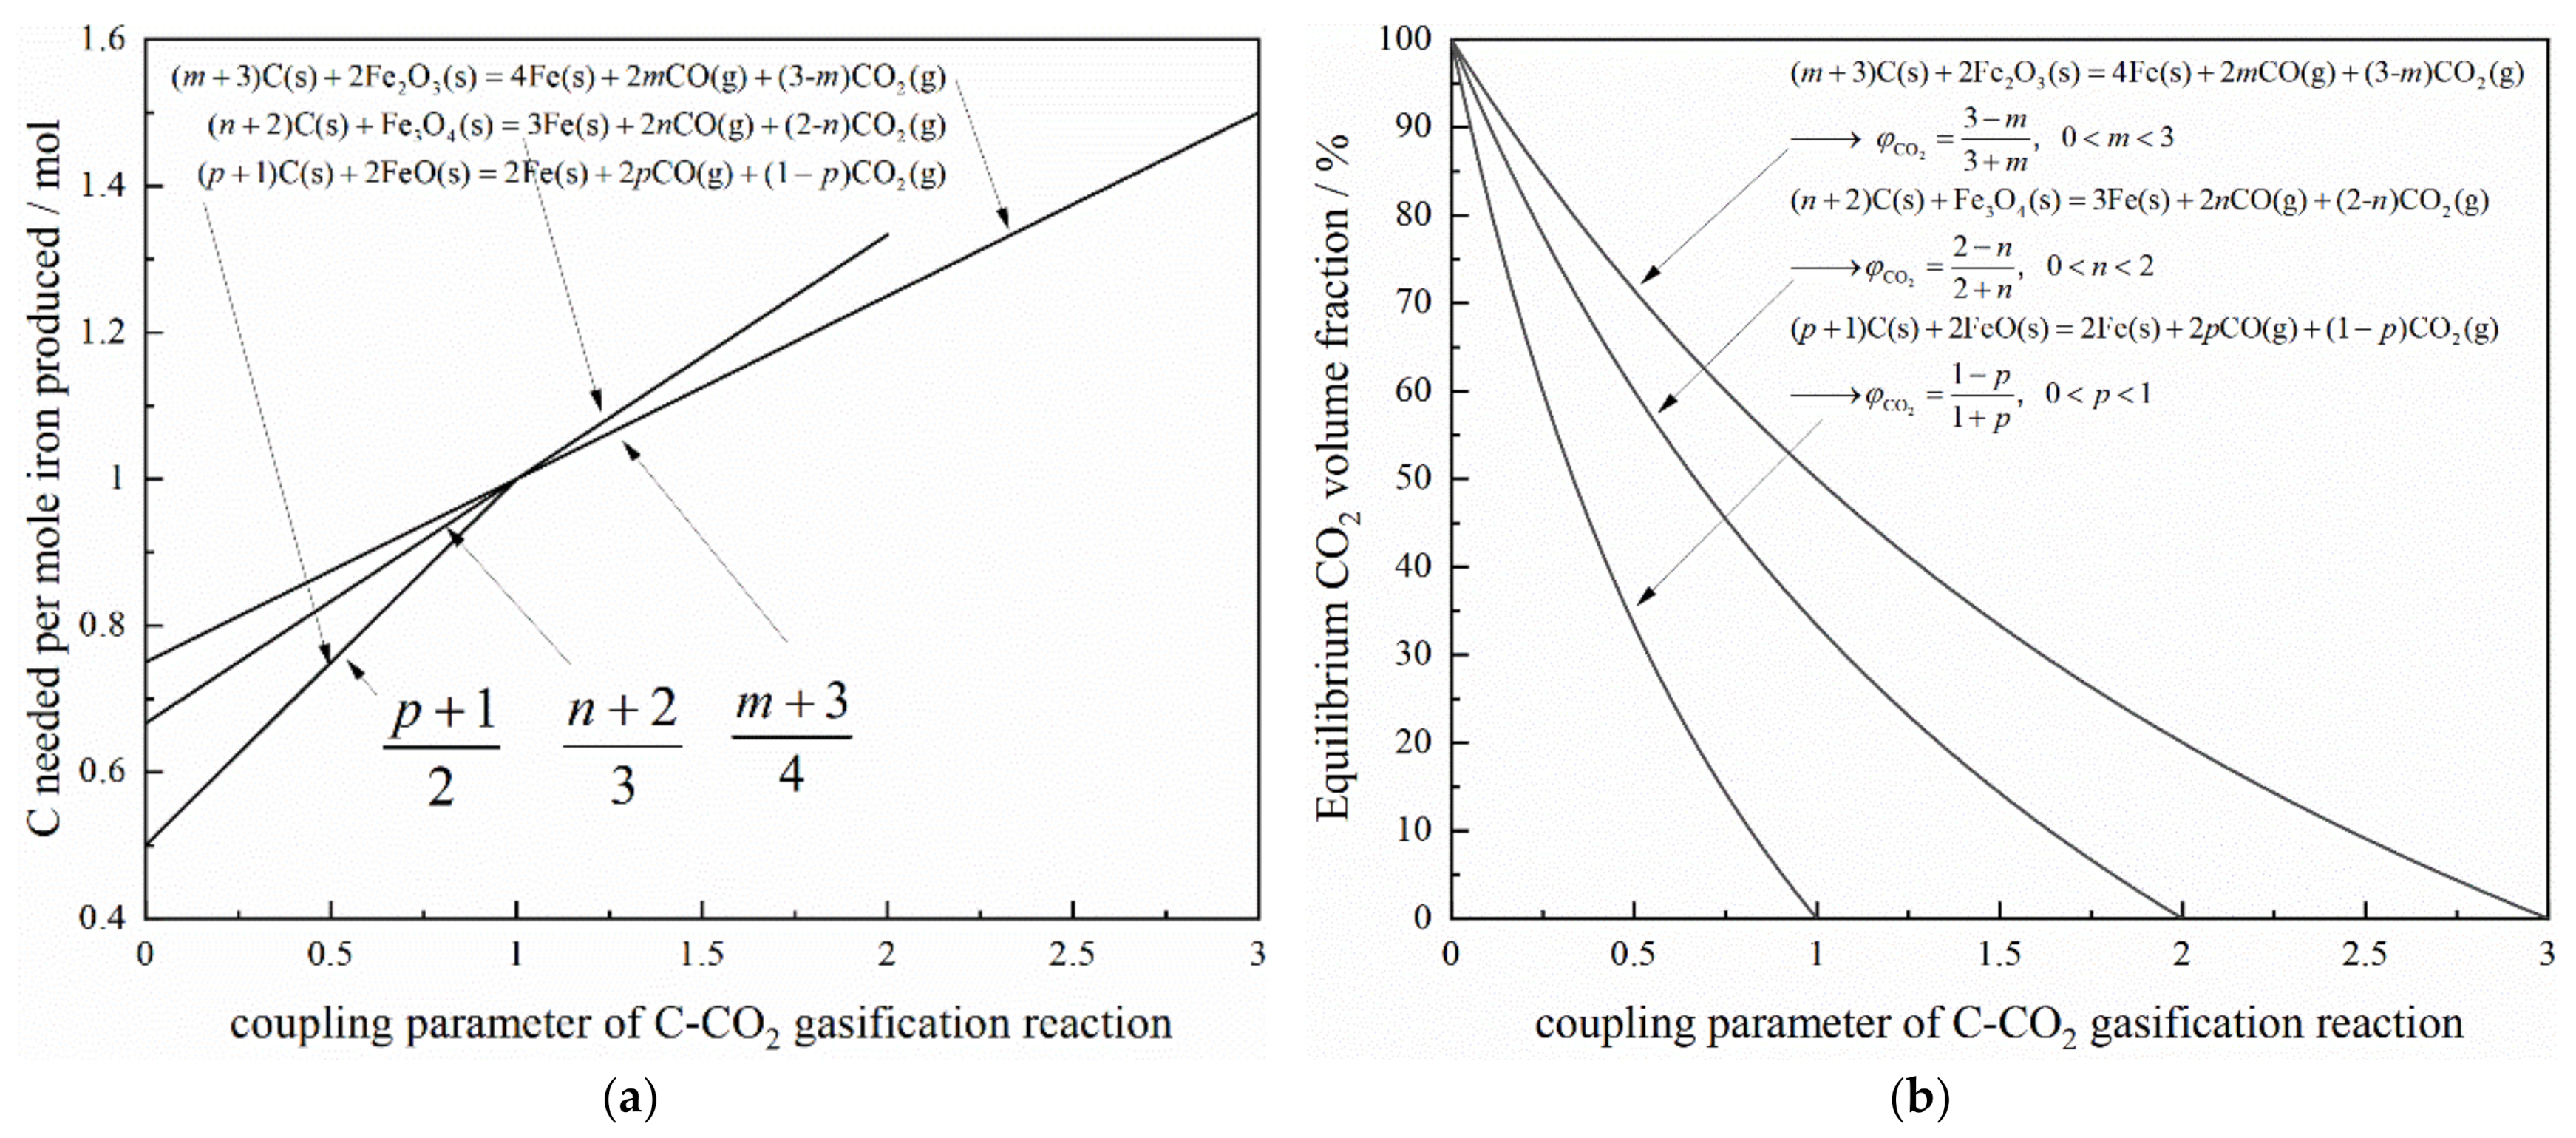
The equilibrium relative gas partial pressure of CO2 was limited between 0.4 and 1.2, and the volume fraction of CO2 decreased as the coupling parameters increased.
(2)
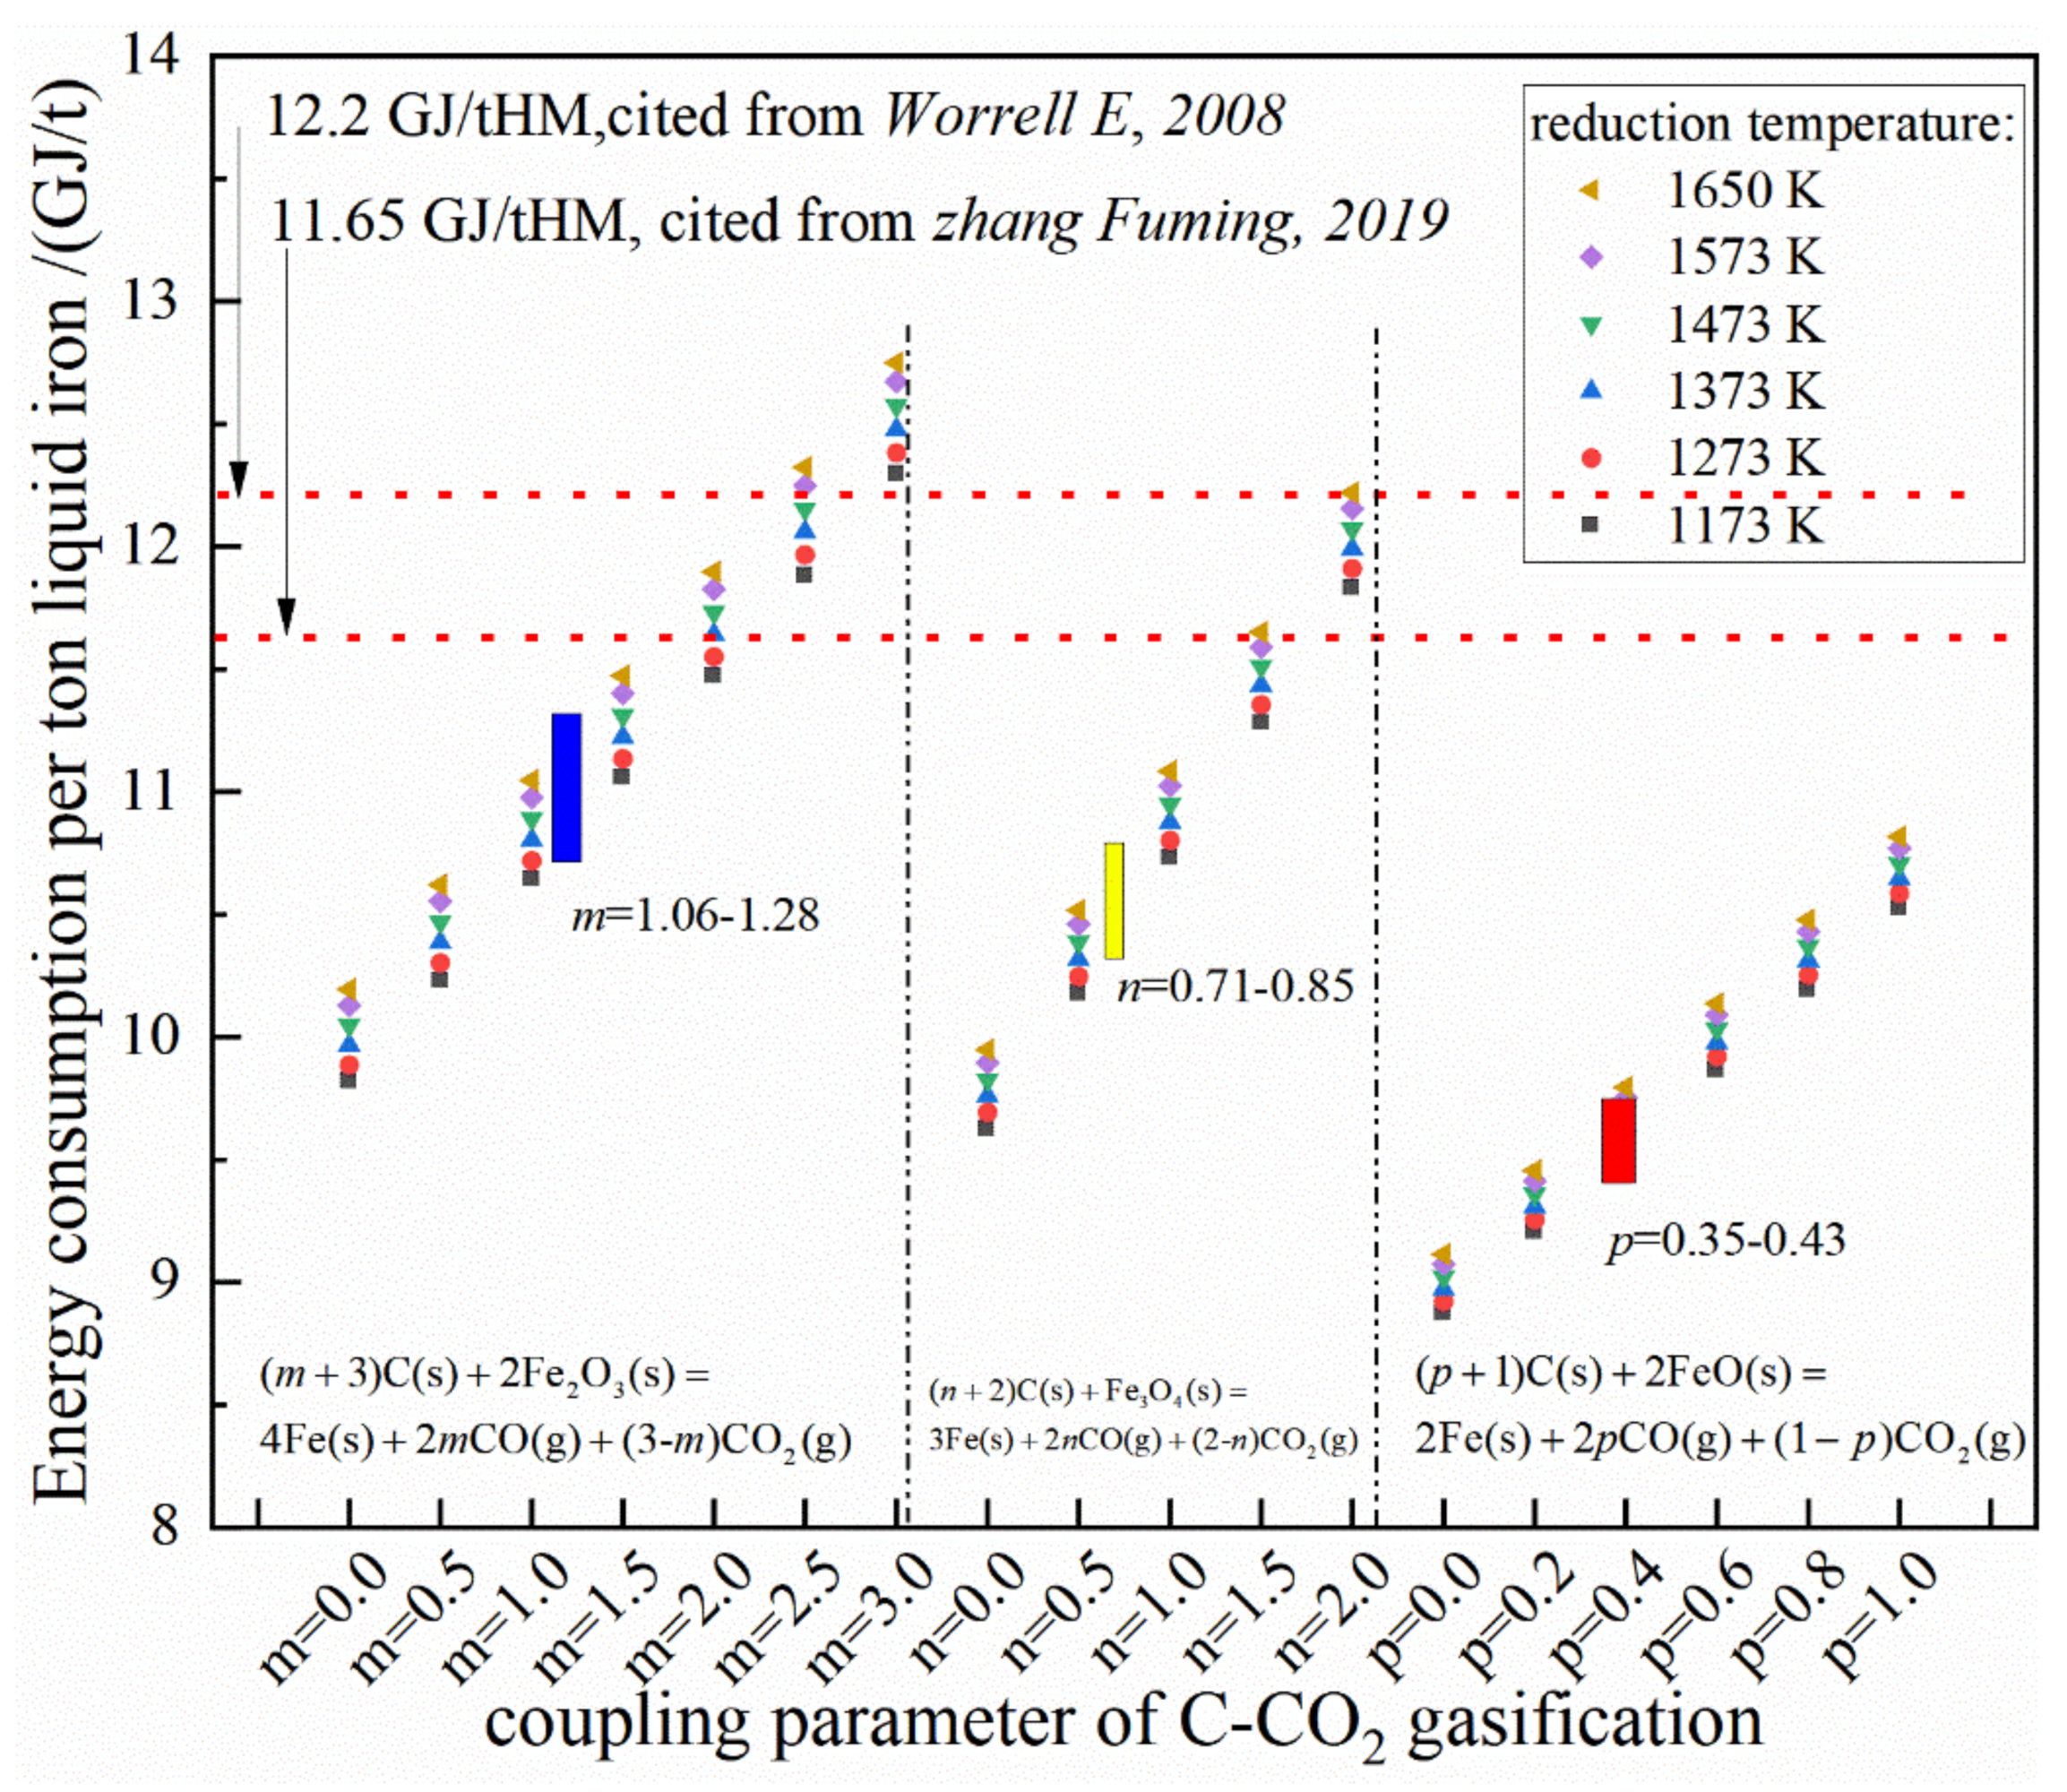
According to the actual volume ratio of CO to CO2, the coupling parameters of carbon gasification by CO2 and reduction of iron oxides by carbon were 1.06–1.28 for Fe2O3, 0.71–0.85 for Fe3O4, 0.35–0.43 for FeO, respectively.
(3)
Under the same conditions, the energy consumption of ironmaking of iron oxides increased with increases in the amount of carbon gasification by CO2.
(4)
The minimum energy consumption, carbon consumption, and CO2 output occurred in the reduction reaction with only CO2 generated, and the maximums of these items were by the reduction reaction with only CO generated.
(5)
Compared with current production levels, the energy consumption and CO2 of ironmaking by carbon could be lower by decreasing the coupling parameter of the C–CO2 reaction, or by lowering the generated temperature of solid Fe, or increasing the iron content in the raw material though changing the iron oxides, though these were very difficult to operate.

Supplementary Materials

The data presented in this study are available in https://www.mdpi.com/article/10.3390/en14071999/s1, which include origin data, function expressions and calculation processes.

Author Contributions

Conceptualization, H.G. and J.G.; methodology, B.L. and W.Y.; software, B.L. and S.L.; data curation, writing—original draft preparation, writing—review and editing, G.S. All authors have read and agreed to the published version of the manuscript.

Funding

This work was supported by the National Natural Science Foundation of China (grant number 51274031) and the National Natural Science Foundation of China (Grant Number U1560203).

Institutional Review Board Statement

Not applicable.

Informed Consent Statement

Not applicable.

Data Availability Statement

Publicly available datasets were analyzed in this study. This data can be found here: https://www.springer.com/cn/book/9783662022955 (accessed on 1 April 2021).

Conflicts of Interest

The authors declare no conflict of interest.

References

  1. Suopajärvi, H.; Umeki, K.; Mousa, E.; Hedayati, A.; Romar, H.; Kemppainen, A.; Wang, C.; Phounglamcheik, A.; Tuomikoski, S.; Norberg, N.; et al. Use of biomass in integrated steelmaking-Status quo, future needs and comparison to other low-CO2 steel production technologies. Appl. Energy 2018, 213, 384–407. [Google Scholar] [CrossRef] [Green Version]
  2. Hasanbeigi, A.; Arens, M.; Price, L. Alternative emerging ironmaking technologies for energy-efficiency and carbon dioxide emissions reduction: A technical review. Renew. Sustain. Energy Rev. 2014, 33, 645–658. [Google Scholar] [CrossRef]
  3. Zhang, Q.; Li, Y.; Xu, J.; Jia, G. Carbon element flow analysis and CO2 emission reduction in iron and steel works. J. Clean. Prod. 2018, 172, 709–723. [Google Scholar] [CrossRef]
  4. Abdul Quader, M.; Ahmed, S.; Dawal, S.Z.; Nukman, Y. Present needs, recent progress and future trends of energy-efficient Ultra-Low Carbon Dioxide (CO2) Steelmaking (ULCOS) program. Renew. Sustain. Energy Rev. 2016, 55, 537–549. [Google Scholar] [CrossRef]
  5. Worrell, E.; Price, L.; Neelis, M.; Galitsky, C.; Zhou, N. World Best Practice Energy Intensity Values for Selected Industrial Sectors; LBNL-62806; R&D Project: 809P73; US200810%%205; Ernest Orlando Lawrence Berkeley NationalLaboratory: Berkeley, CA, USA, 2007. [Google Scholar] [CrossRef] [Green Version]
  6. Fu-ming, Z. Prospect and development achievements of blast furnace ironmaking technologies and equipments in China. Iron Steel 2019, 54, 1–8. [Google Scholar] [CrossRef]
  7. Khasraw, D.; Spooner, S.; Hage, H.; Meijer, K.; Li, Z. Devolatilisation characteristics of coal and biomass with respect to temperature and heating rate for HIsarna alternative ironmaking process. Fuel 2021, 284, 119101. [Google Scholar] [CrossRef]
  8. Qi, Z.; Wei, Z.; Yu-jie, W.; Jin, X.; Xian-chang, C. Potential of energy saving and emission reduction and energy efficiency improvement of China's steel industry. Iron Steel 2019, 54, 7–14. (In Chinese) [Google Scholar] [CrossRef]
  9. Tan, X.; Li, H.; Guo, J.; Gu, B.; Zeng, Y. Energy-saving and emission-reduction technology selection and CO2 emission reduction potential of China's iron and steel industry under energy substitution policy. J. Clean. Prod. 2019, 222, 823–834. [Google Scholar] [CrossRef]
  10. Jin, P.; Jiang, Z.; Bao, C.; Lu, Y.; Zhang, J.; Zhang, X. Mathematical Modeling of the Energy Consumption and Carbon Emission for the Oxygen Blast Furnace with Top Gas Recycling. Steel Res. Int. 2016, 87, 320–329. [Google Scholar] [CrossRef] [Green Version]
  11. Karakaya, E.; Nuur, C.; Assbring, L. Potential transitions in the iron and steel industry in Sweden: Towards a hydrogen-based future? J. Clean. Prod. 2018, 195, 651–663. [Google Scholar] [CrossRef]
  12. Fu-ming, Z. Developing prospects on high temperature and low fuel ratio technologies for blast furnace ironmaking. China Metall. 2013, 23, 1–7. (In Chinese) [Google Scholar] [CrossRef]
  13. Hong-qiang, L.; Fu-ming, Z.; Si-yu, L.; Jian-xun, F. Green low-carbon analysis of iron and steel manufacturing process of Shougang Jingtang Iron and Steel Company. Iron Steel 2016, 51, 80–88. (In Chinese) [Google Scholar] [CrossRef]
  14. Fu-ming, Z. Development and prospect of green and low carbon ironmaking technologies in Shougang. Iron Steel 2020, 55, 11–18. (In Chinese) [Google Scholar] [CrossRef]
  15. Xu, J.P.; Feng, Q.; Lv, C.W.; Huang, Q. Low-carbon electricity generation-based dynamic equilibrium strategy for carbon dioxide emissions reduction in the coal-fired power enterprise. Environ. Sci. Pollut. Res. 2019, 26, 36732–36753. [Google Scholar] [CrossRef] [PubMed]
  16. Yap, J.Y.; Tan, J.; Foo, D.C.Y.; Tan, R.R.; Papadokonstantakis, S.; Badr, S. A graphical method for carbon dioxide emissions reduction in multi-product plants. Process Saf. Environ. Prot. 2020, 133, 51–63. [Google Scholar] [CrossRef]
  17. Rami, B.; Hamzeh, H.; Olivier, M.; Fabrice, P. Optimization of the iron ore direct reduction process through multiscale process modeling. Materials 2018, 11, 1094. [Google Scholar] [CrossRef] [Green Version]
  18. Zhao, J.; Zuo, H.; Wang, Y.; Wang, J.; Xue, Q. Review of green and low-carbon ironmaking technology. Ironmak. Steelmak. 2020, 47, 296–306. [Google Scholar] [CrossRef]
  19. Smith, M.P. Blast Furnace Ironmaking-A View on Future Developments. In Proceedings of the Procedia Engineering13th Global Congress on Manufacturing and Management, Zhengzhou, China, 28–30 November 2016; pp. 19–28. [Google Scholar]
  20. Ariyama, T.; Murai, R.; Ishii, J.; Sato, M. Reduction of CO2 emissions from integrated steel works and its subjects for a future study. ISIJ Int. 2005, 45, 1371–1378. [Google Scholar] [CrossRef] [Green Version]
  21. Griffin, P.W.; Hammond, G.P. Industrial energy use and carbon emissions reduction in the iron and steel sector: A UK perspective. Appl. Energy 2019, 249, 109–125. [Google Scholar] [CrossRef]
  22. Lin, B.Q.; Ouyang, X.L. Analysis of energy-related CO2 (carbon dioxide) emissions and reduction potential in the Chinese non-metallic mineral products industry. Energy 2014, 68, 688–697. [Google Scholar] [CrossRef]
  23. Xu, B.; Lin, B.Q. Carbon dioxide emissions reduction in China's transport sector: A dynamic VAR (vector autoregression) approach. Energy 2015, 83, 486–495. [Google Scholar] [CrossRef]
  24. Farmer, T.C.; Doherty, M.F. Thermodynamic assessment of carbon dioxide emission reduction during fossil fuel derived energy production. Energy 2019, 177, 565–573. [Google Scholar] [CrossRef]
  25. Lu, W.Y.; Cao, Q.X.; Xu, B.; Adidharma, H.; Gasem, K.; Argyle, M.; Zhang, F.; Zhang, Y.L.; Fan, M.H. A new approach of reduction of carbon dioxide emission and optimal use of carbon and hydrogen content for the desired syngas production from coal. J. Clean. Prod. 2020, 265, 121786. [Google Scholar] [CrossRef]
  26. Mardani, A.; Liao, H.C.; Nilashi, M.; Alrasheedi, M.; Cavallaro, F. A multi-stage method to predict carbon dioxide emissions using dimensionality reduction, clustering, and machine learning techniques. J. Clean. Prod. 2020, 275, 122942. [Google Scholar] [CrossRef]
  27. Karlsson, I.; Rootzén, J.; Toktarova, A.; Odenberger, M.; Johnsson, F.; Göransson, L. Roadmap for decarbonization of the building and construction industry—a supply chain analysis including primary production of steel and cement. Energies 2020, 13, 4136. [Google Scholar] [CrossRef]
  28. Holappa, L. A general vision for reduction of energy consumption and CO2 emissions from the steel industry. Metals 2020, 10, 1117. [Google Scholar] [CrossRef]
  29. Patisson, F.; Mirgaux, O. Hydrogen ironmaking: How it works. Metals 2020, 10, 922. [Google Scholar] [CrossRef]
  30. Hui, C.; Wei-Dong, Z.; Ze-Jun, M.; Wei-Chun, Z.; Hong-Qi, W.; Kun-Tai, Z. Theoretical Analysis on Pressure Loss in Blast System of BF. Iron Steel 2011, 46, 22–25, 34. (In Chinese) [Google Scholar] [CrossRef]
  31. Moriya, K.; Takahashi, K.; Murao, A.; Sato, T.; Fukada, K. Effect of large amount of CO-injected gaseous reducing agent on combustibility of pulverized coal analyzed with non-contact measurement. ISIJ Int. 2020, 60, 1662–1668. [Google Scholar] [CrossRef]
  32. Chen, W.-H.; Hsu, C.-L.; Du, S.-W. Thermodynamic analysis of the partial oxidation of coke oven gas for indirect reduction of iron oxides in a blast furnace. Energy 2015, 86, 758–771. [Google Scholar] [CrossRef]
  33. Xu, C.C.; Cang, D.Q. A Brief Overview of Low CO2 Emission Technologies for Iron and Steel Making. J. Iron Steel Res. Int. 2010, 17, 1–7. [Google Scholar] [CrossRef]
  34. Wang, D.; Xu, J.; Ma, K.; Xu, Y.; Dang, J.; Kou, M.; Lv, X.; Wen, L. Innovative evaluation of CO-H2 interaction during gaseous wustite reduction controlled by external gas diffusion. Int. J. Hydrog. Energy 2017, 42, 14047–14057. [Google Scholar] [CrossRef]
  35. Hayashi, K.; Kasahara, S.; Kuribara, K.; Nakagaki, T.; Yan, X.L.; Inagaki, Y.; Ogawa, M. Process evaluation of use of high temperature gas-cooled reactors to an ironmaking system based on active carbon recycling energy system. ISIJ Int. 2015, 55 (Suppl. 2SI), 348–358. [Google Scholar] [CrossRef] [Green Version]
  36. Kato, Y. Carbon recycling for reduction of carbon dioxide emission from iron-making process. ISIJ Int. 2010, 50, 181–185. [Google Scholar] [CrossRef] [Green Version]
  37. Qi, Z.; Murakami, T.; Kasai, E. Gasification and reduction behavior of iron ore-carbon composite under high pressure. ISIJ Int. 2012, 52, 1778–1784. [Google Scholar] [CrossRef] [Green Version]
  38. Sato, K.; Noguchi, T.; Miki, T.; Sasaki, Y.; Hino, M. Effect of Fe3C on carburization and smelting behavior of reduced iron in blast furnace. ISIJ Int. 2011, 51 (Suppl. 8SI), 1269–1273. [Google Scholar] [CrossRef] [Green Version]
  39. Hanjie, G. Future study on the basic principle and the imagination on the ideal technology and equipment for non-coking Coal ironmaking process (II). Metall. Equip. 2015, 223, 1–9, 59. (In Chinese) [Google Scholar] [CrossRef]
  40. Hanjie, G. Future study on the basic principle and the imagination on the ideal technology and equipment for non-coking coal ironmaking process (I). Metall. Equip. 2015, 222, 1–7. (In Chinese) [Google Scholar] [CrossRef]
  41. Xiaoliu, W. Metallurgy of Iron and Steel, 3rd ed.; Ironmaking Part; Metallurgy Industry Press: Beijing, China, 2013. [Google Scholar]
  42. Sandler, S.I.; Woodcock, L.V. Historical observations on laws of thermodynamics. J. Chem. Eng. Data 2010, 55, 4485–4490. [Google Scholar] [CrossRef]
  43. Leicester, H.M. Germain henri hess and the foundations of thermochemistry. J. Chem. Educ. 1951, 28, 581–583. [Google Scholar] [CrossRef]
  44. Kulinich, V.I. Thermodynamic modeling of the blast-furnace smelting of hot metal. Steel Transl. 2007, 27, 356–361. [Google Scholar] [CrossRef]
  45. Barin, I.; Knacke, O.; Kubaschewski, O. Thermochemical Properties of Inorganic Substances; Supplement; Springer: Berlin/Heidelberg, Germany, 1977. [Google Scholar] [CrossRef]
  46. Barin, I.; Knacke, O. Thermochemical Properties of Inorganic Substances; Springer: Berlin/Heidelberg, Germany, 1973. [Google Scholar]
  47. Kubaschewski, O.; Evans, E.L.; Alcock, C.B. Metallurgical Thermochemistry, 5th ed.; Pergamon Press: New York, NY, USA, 1979. [Google Scholar]
  48. Kuangdi, X. Low carbon economy and iron and steel industry. Iron Steel 2010, 45, 1–12. (In Chinese) [Google Scholar] [CrossRef]
Figure 1. Schematic diagram of the initial state and the final state of ironmaking by carbon in the blast furnace (BF).
Energies 14 01999 g001
Figure 2. Schematic diagram of energy consumption of the ironmaking by carbon based on Hess’ law.
Energies 14 01999 g002
Figure 3. The standard Gibbs free energy and lowest reaction temperature of reduction reactions between carbon and iron oxides with single gas product generation.
Energies 14 01999 g003
Figure 4. The equilibrium relative gas partial pressure in reduction reactions between carbon and iron oxides with single gas product generation: (a) CO global; (b) CO local; (c) CO2 global; (d) CO2 local.
Energies 14 01999 g004aEnergies 14 01999 g004b
Figure 5. The standard reaction enthalpy of reduction reactions with single gas product generation as a function of temperature.
Energies 14 01999 g005
Figure 6. The standard Gibbs free energy of gasification reaction between carbon and CO2.
Energies 14 01999 g006
Figure 7. The equilibrium relative gas partial pressure of CO in the gasification reaction between carbon and CO2: (a) the sum value of relative gas partial pressure of CO and CO2 was varied with 0.4, 0.6, 0.8, 1.0, 1.2; (b) the sum value of relative gas partial pressure of CO and CO2 was 1.0.
Energies 14 01999 g007
Figure 8. The standard reaction enthalpy as a function of temperature: (a) the reaction of C(s) + CO2(g) = 2CO(g); (b) the reaction of C(s) + O2(g) = CO2(g).
Energies 14 01999 g008
Figure 9. The standard Gibbs free energy as a function of temperature: (a) the reaction of (m + 3)C(s) + 2Fe2O3(s) = 4Fe(s) + 2mCO(g) + (3 − m)CO2(g) (m = 0.0, 0.5, 1.0, 1.5, 2.0, 2.5, 3.0); (b) the reaction of (n + 2)C(s) + Fe3O4(s) = 3Fe(s) + 2nCO(g) + (2 − n)CO2(g) (n = 0.0, 0.5, 1.0, 1.5, 2.0); (c) the reaction of (p + 1)C(s) + 2FeO(s) = 2Fe(s) + 2pCO(g) + (1 − p)CO2(g) (p = 0.0, 0.2, 0.4, 0.6, 0.8, 1.0).
Energies 14 01999 g009aEnergies 14 01999 g009b
Figure 10. The equilibrium relative gas partial pressure of CO2 as a function of temperature of the reaction of (m + 3)C(s) + 2Fe2O3(s) = 4Fe(s) + 2mCO(g) + (3 − m)CO2(g) (m = 0.5, 1.0, 1.5, 2.0, 2.5): (a) global; (b) local.
Energies 14 01999 g010
Figure 11. The equilibrium relative gas partial pressure of CO2 as a function of temperature of the reaction of (n + 2)C(s) + Fe3O4(s) = 3Fe(s) + 2nCO(g) + (2 − n)CO2(g) (n = 0.5, 1.0, 1.5): (a) global; (b) local.
Energies 14 01999 g011
Figure 12. The equilibrium relative gas partial pressure of CO2 as a function of temperature of the reaction of (p + 1)C(s) + 2FeO(s) = 2Fe(s) + 2pCO(g) + (1 − p)CO2(g) (p = 0.2, 0.4, 0.6, 0.8): (a) global; (b) local.
Energies 14 01999 g012
Figure 13. The ratio of equilibrium gas partial pressure of CO and CO2 as a function of coupling parameter: (a) global; (b) local.
Energies 14 01999 g013
Figure 14. The variables as a function of coupling parameter: (a) C needed per mole iron produced; (b) equilibrium CO2 volume fraction.
Energies 14 01999 g014
Figure 15. The standard reaction enthalpy as a function of temperature: (a) the reaction of (m + 3)C(s) + 2Fe2O3(s) = 4Fe(s) + 2mCO(g) + (3 − m)CO2(g) (m = 0.0, 0.5, 1.0, 1.5, 2.0, 2.5, 3.0); (b) the reaction of (n + 2)C(s) + Fe3O4(s) = 3Fe(s) + 2nCO(g) + (2 − n)CO2(g) (n = 0.0, 0.5, 1.0, 1.5, 2.0); (c) the reaction of (p + 1)C(s) + 2FeO(s) = 2Fe(s) + 2pCO(g) + (1 − p)CO2(g) (p = 0.0, 0.2, 0.4, 0.6, 0.8, 1.0);.
Energies 14 01999 g015aEnergies 14 01999 g015b
Figure 16. The established flow diagram of the calculation of energy consumption of heating solid materials.
Energies 14 01999 g016
Figure 17. The energy consumption per ton liquid iron of varied coupling reactions.
Energies 14 01999 g017
Figure 18. The carbon consumption per ton of liquid iron of varied coupling reactions.
Energies 14 01999 g018
Figure 19. The CO2 output per ton of liquid iron of varied coupling reactions.
Energies 14 01999 g019
Figure 20. Schematic diagram of the ideal model of ironmaking by carbon.
Energies 14 01999 g020
Figure 21. The coupled process and separated process.
Energies 14 01999 g021
Table 1. The possible chemical reactions between the initial state and the final state.
Reaction TypeReaction EquationNumber
Direct reduction reaction with only CO generated 3 C ( s ) + Fe 2 O 3 ( s ) = 2 Fe ( s ) + 3 CO ( g ) (2)
4 C ( s ) + Fe 3 O 4 ( s ) = 3 Fe ( s ) + 4 CO ( g ) (3)
C ( s ) + FeO ( s ) = Fe ( s ) + CO ( g ) (4)
Direct reduction reaction with only CO2 generated 3 C ( s ) + 2 Fe 2 O 3 ( s ) = 4 Fe ( s ) + 3 CO 2 ( g ) (5)
2 C ( s ) + Fe 3 O 4 ( s ) = 3 Fe ( s ) + 2 CO 2 ( g ) (6)
C ( s ) + 2 FeO ( s ) = 2 Fe ( s ) + CO 2 ( g ) (7)
Gasification reaction C ( s ) + CO 2 ( g ) = 2 CO ( g ) (8)
Complete combustion reaction C ( s ) + O 2 ( g ) = CO 2 ( g ) (9)
Table 2. Thermodynamic parameters calculated by mathematical derivation.
SpeciesPhase H T 1 Ө
/(kJ/mol)
S T 1 Ө / ( J / ( mol K ) ) H 0 / ( kJ / mol ) I
/(J/mol)
Specific Heat Capacity ParameterTemperature RangeTransition
Enthalpy
/(J/mol)
Transition Entropy
/(J/(mol•K))
A1A2A3A4T1/KT2/K
Csolid0.0005.740−2106.4026.6590.10938.940−1.481−17.385298.1501100.0000.0000.000
13,993.97226.590−16,027.072170.78024.4390.435−31.6270.0001100.0004073.0000.0000.000
Fesolid, α0.00027.280−9267.465161.98528.175−7.318−2.89525.041298.150800.0000.0000.000
solid, α15,566.49956.91422,1874.519−1925.185−263.454255.810619.2320.000800.0001000.0000.0000.000
solid, α24,402.27166.70431,8137.899−4446.394−641.905696.3390.0000.0001000.0001042.0000.0000.000
solid, α27,302.66369.541−1,030,294.70813,538.4651946.255−1787.4970.0000.0001042.0001060.0000.0000.000
solid, α28,519.37970.700−68,549.061902.887132.490−77.2000.0000.0001060.0001184.0000.0000.000
solid, β34,207.45875.784−57.453127.88123.9918.3600.0000.0001184.0001665.000899.5600.761
solid, γ0.00027.280−9267.465161.98528.175−7.318−2.89525.0411665.0001809.00013,807.2007.632
FeOsolid−272,043.68060.752−288,683.263283.93150.8028.615−3.3100.000298.1501650.00024,058.00014.581
Fe3O4solid, α−1,118,383.200146.440−1,153,388.928493.62186.266208.9150.0000.000298.150866.0000.0000.000
solid, β−1,000,344.110357.057−1,174,264.6221202.180200.8320.0000.0000.000866.0001870.000138,072.00073.835
Fe2O3solid, α−825,503.20087.446−863,246.763602.36698.28277.822−14.8530.000298.150953.0000.0000.000
solid, β−732,685.790245.076−876,230.462938.770150.6240.0000.0000.000953.0001053.000669.4400.703
solid, γ−716,953.950260.809−860,742.892802.955132.6757.3640.0000.0001053.0001730.0000.0000.000
O2gas0.000205.037−9679.104−2.20529.9574.184−1.6740.000298.1503000.0000.0000.000
COgas−110,541.280197.552−119,209.213−6.02928.4094.100−0.0460.000298.1502500.0000.0000.000
CO2gas−393,505.200213.660−409,930.35789.47544.1419.037−8.5350.000298.1503000.0000.0000.000
H2Ogas−241,814.280188.724−251,122.37015.20529.99910.7110.3350.000298.1502500.000−241,814.280188.724
H2gas0.000130.583−8110.09152.81627.2803.2640.5020.000298.1503000.0000.000130.583
Table 3. The critical reaction temperature of reduction reactions between carbon and iron oxides with single gas product generation at one atmosphere (K).
Reaction EquationThe Relative Partial Pressure of COThe Relative Partial Pressure of CO2
0.010.100.250.500.751.000.010.100.250.500.751.00
3C(s) + Fe2O3(s) = 2Fe(s) + 3CO(g)756831866894911924
3C(s) + 2Fe2O3(s) = 4Fe(s) + 3CO2(g) 712783816843860872
4C(s) + Fe3O4(s) = 3Fe(s) + 4CO(g)798881919950969983
2C(s) + Fe3O4(s) = 3Fe(s) + 2CO2(g) 796885926960981997
C(s) + FeO(s) = Fe(s) + CO(g)832927970100610281044
C(s) + 2FeO(s) = 2Fe(s) + CO2(g) 8779941049109411231144
Table 4. The reaction energy consumption per ton metallic iron of reduction reactions with single gas product generation at 298–1650 K (GJ/t).
Reaction EquationTemperature/(K)
298117312731373147315731650
3C(s) + Fe2O3(s) = 2Fe(s) + 3CO(g)4.4104.2104.1744.1384.1034.0694.044
3C(s) + 2Fe2O3(s) = 4Fe(s) + 3CO2(g)2.1001.9401.9191.8981.8781.8601.848
4C(s) + Fe3O4(s) = 3Fe(s) + 4CO(g)4.0253.8403.8083.7773.7473.7193.699
2C(s) + Fe3O4(s) = 3Fe(s) + 2CO2(g)1.9721.8231.8041.7851.7691.7561.747
C(s) + FeO(s) = Fe(s) + CO(g)2.8842.8202.7932.7642.7342.7062.684
C(s) + 2FeO(s) = 2Fe(s) + CO2(g)1.3441.3071.2891.2701.2511.2331.220
Table 5. The energy consumption of heating the coupling reaction per ton iron (GJ/t).
Reaction EquationCoupling ParameterReduction Temperature/(K)
117312731373147315731650
(m + 3)C(s) + 2Fe2O3(s) =
4Fe(s) + 2mCO(g) + (3 − m)CO2(g)
m = 0.01.9401.9141.8981.8841.8711.863
m = 0.52.3182.2902.2712.2542.2402.229
m = 1.02.6972.6662.6452.6252.6082.595
m = 1.53.0753.0423.0182.9962.9762.961
m = 2.03.4533.4183.3923.3673.3443.327
m = 2.53.8313.7943.7653.7383.7123.693
m = 3.04.2104.1704.1384.1084.0804.059
(n + 2)C(s) + Fe3O4(s) =
3Fe(s) + 2nCO(g) + (2 − n)CO2(g)
n = 0.01.8231.8041.7851.7691.7561.747
n = 0.52.3272.3052.2832.2642.2462.235
n = 1.02.8322.8062.7812.7582.7372.723
n = 1.53.3363.3073.2793.2533.2283.211
n = 2.03.8403.8083.7773.7473.7193.699
(p + 1)C(s) + 2FeO(s) =
2Fe(s) + 2pCO(g) + (1 − p)CO2(g)
p = 0.01.3071.2891.2701.2511.2331.220
p = 0.21.6101.5901.5691.5481.5281.512
p = 0.41.9131.8911.8671.8451.8221.805
p = 0.62.2152.1912.1662.1412.1172.098
p = 0.82.5182.4922.4652.4382.4112.391
p = 1.02.8202.7932.7642.7342.7062.684
Table 6. The energy consumption of heating solid materials per ton iron before smelting (GJ/t).
Reaction EquationCoupling ParameterReduction Temperature/(K)
117312731373147315731650
(m + 3)C(s) + 2Fe2O3(s) =
4Fe(s) + 2mCO(g) + (3 − m)CO2(g)
m = 0.01.7701.8641.9602.0552.1502.222
m = 0.51.8051.9042.0052.1052.2052.282
m = 1.01.8391.9442.0502.1562.2612.342
m = 1.51.8741.9842.0952.2062.3172.402
m = 2.01.9092.0242.1412.2572.3732.462
m = 2.51.9442.0642.1862.3072.4282.521
m = 3.01.9792.1042.2312.3582.4842.581
(n + 2)C(s) + Fe3O4(s) =
3Fe(s) + 2nCO(g) + (2 − n)CO2(g)
n = 0.01.6961.7801.8651.9482.0302.093
n = 0.51.7421.8331.9252.0152.1052.173
n = 1.01.7891.8871.9852.0832.1792.252
n = 1.51.8351.9402.0452.1502.2532.332
n = 2.01.8821.9932.1062.2172.3272.412
(p + 1)C(s) + 2FeO(s) =
2Fe(s) + 2pCO(g) + (1 − p)CO2(g)
p = 0.01.4581.5251.5931.6631.7321.786
p = 0.21.4861.5571.6301.7031.7771.834
p = 0.41.5131.5891.6661.7431.8211.882
p = 0.61.5411.6211.7021.7841.8661.929
p = 0.81.5691.6531.7381.8241.9101.977
p = 1.01.5971.6851.7741.8641.9552.025
Table 7. The energy consumption per ton liquid iron (GJ/t).
Reaction EquationCoupling ParameterReduction Temperature/(K)
117312731373147315731650
(m + 3)C(s) + 2Fe2O3(s) =
4Fe(s) + 2mCO(g) + (3 − m)CO2(g)
m = 0.09.95210.02110.10010.18110.26310.328
m = 0.510.36510.43610.51810.60210.68710.753
m = 1.010.77810.85210.93711.02311.11111.179
m = 1.511.19111.26811.35611.44411.53511.605
m = 2.011.60411.68411.77411.86611.95812.031
m = 2.512.01712.10012.19312.28712.38212.457
m = 3.012.43112.51612.61112.70812.80612.883
(n + 2)C(s) + Fe3O4(s) =
3Fe(s) + 2nCO(g) + (2 − n)CO2(g)
n = 0.09.7619.8269.8929.95910.02810.081
n = 0.510.31210.38010.45010.52110.59310.649
n = 1.010.86310.93511.00811.08311.15811.217
n = 1.511.41311.48911.56611.64411.72311.785
n = 2.011.96412.04412.12412.20612.28812.353
(p + 1)C(s) + 2FeO(s) =
2Fe(s) + 2pCO(g) + (1 − p)CO2(g)
p = 0.09.0079.0569.1059.1569.2079.247
p = 0.29.3379.3889.4409.4939.5469.588
p = 0.49.6689.7219.7759.8309.8859.929
p = 0.69.99910.05410.11010.16710.22510.269
p = 0.810.32910.38710.44510.50410.56410.610
p = 1.010.66010.71910.78010.84110.90310.951
Table 8. The carbon consumption used as reduction agent for coupling reactions per ton of liquid iron (kg C/t).
Reaction EquationCoupling ParameterReduction Temperature/(K)
117312731373147315731650
(m + 3)C(s) + 2Fe2O3(s) =
4Fe(s) + 2mCO(g) + (3 − m)CO2(g)
m = 0.0160.714160.714160.714160.714160.714160.714
m = 0.5187.500187.500187.500187.500187.500187.500
m = 1.0214.286214.286214.286214.286214.286214.286
m = 1.5241.071241.071241.071241.071241.071241.071
m = 2.0267.857267.857267.857267.857267.857267.857
m = 2.5294.643294.643294.643294.643294.643294.643
m = 3.0321.429321.429321.429321.429321.429321.429
(n + 2)C(s) + Fe3O4(s) =
3Fe(s) + 2nCO(g) + (2 − n)CO2(g)
n = 0.0142.857142.857142.857142.857142.857142.857
n = 0.5178.571178.571178.571178.571178.571178.571
n = 1.0214.286214.286214.286214.286214.286214.286
n = 1.5250.000250.000250.000250.000250.000250.000
n = 2.0285.714285.714285.714285.714285.714285.714
(p + 1)C(s) + 2FeO(s) =
2Fe(s) + 2pCO(g) + (1 − p)CO2(g)
p = 0.0107.143107.143107.143107.143107.143107.143
p = 0.2128.571128.571128.571128.571128.571128.571
p = 0.4150.000150.000150.000150.000150.000150.000
p = 0.6171.429171.429171.429171.429171.429171.429
p = 0.8192.857192.857192.857192.857192.857192.857
p = 1.0214.286214.286214.286214.286214.286214.286
Table 9. The carbon consumption for coupling reactions per ton liquid iron (kg C/t).
Reaction EquationCoupling ParameterReduction Temperature/(K)
117312731373147315731650
(m + 3)C(s) + 2Fe2O3(s) =
4Fe(s) + 2mCO(g) + (3 − m)CO2(g)
m = 0.0462.116464.201466.602469.050471.546473.500
m = 0.5501.414503.582506.064508.593511.169513.183
m = 1.0540.713542.962545.526548.136550.791552.866
m = 1.5580.011582.343584.989587.679590.413592.549
m = 2.0619.309621.724624.451627.222630.036632.232
m = 2.5658.607661.105663.913666.764669.658671.915
m = 3.0697.906700.486703.376706.307709.280711.598
(n + 2)C(s) + Fe3O4(s) =
3Fe(s) + 2nCO(g) + (2 − n)CO2(g)
n = 0.0438.478440.447442.452444.492446.566448.187
n = 0.5490.875492.955495.068497.216499.396501.098
n = 1.0543.273545.463547.685549.939552.226554.009
n = 1.5595.671597.970600.301602.663605.056606.919
n = 2.0648.068650.478652.918655.387657.886659.830
(p + 1)C(s) + 2FeO(s) =
2Fe(s) + 2pCO(g) + (1 − p)CO2(g)
p = 0.0379.932381.409382.912384.442385.998387.214
p = 0.2411.370412.913414.482416.077417.696418.960
p = 0.4442.809444.418446.052447.711449.394450.707
p = 0.6474.247475.923477.622479.345481.092482.453
p = 0.8505.686507.427509.192510.979512.790514.200
p = 1.0537.125538.932540.762542.614544.488545.946
Table 10. The CO2 output per ton of liquid iron (kg/t).
Reaction EquationCoupling ParameterReduction Temperature/(K)
117312731373147315731650
(m + 3)C(s) + 2Fe2O3(s) =
4Fe(s) + 2mCO(g) + (3 − m)CO2(g)
m = 0.01265.8541273.4981282.3011291.2801300.4311307.595
m = 0.51284.9481292.8941301.9971311.2701320.7131328.099
m = 1.01304.0411312.2911321.6921331.2611340.9951348.604
m = 1.51323.1351331.6871341.3871351.2511361.2771369.108
m = 2.01342.2281351.0841361.0831371.2411381.5591389.613
m = 2.51361.3221370.4801380.7781391.2321401.8411410.117
m = 3.01380.4161389.8771400.4731411.2221422.1231430.622
(n + 2)C(s) + Fe3O4(s) =
3Fe(s) + 2nCO(g) + (2 − n)CO2(g)
n = 0.01226.7991234.0201241.3711248.8511256.4581262.400
n = 0.51252.2571259.8821267.6321275.5051283.5011289.740
n = 1.01277.7151285.7441293.8921302.1591310.5431317.079
n = 1.51303.1731311.6061320.1531328.8131337.5861344.418
n = 2.01328.6311337.4681346.4131355.4671364.6291371.758
(p + 1)C(s) + 2FeO(s) =
2Fe(s) + 2pCO(g) + (1 − p)CO2(g)
p = 0.01107.3681112.7841118.2981123.9081129.6131134.070
p = 0.21122.6431128.3011134.0541139.9001145.8381150.473
p = 0.41137.9181143.8191149.8101155.8921162.0641166.877
p = 0.61153.1931159.3361165.5671171.8851178.2901183.280
p = 0.81168.4681174.8531181.3231187.8771194.5151199.684
p = 1.01183.7431190.3701197.0791203.8691210.7411216.088
Publisher’s Note: MDPI stays neutral with regard to jurisdictional claims in published maps and institutional affiliations.

