Fuel Switch to LNG in Heavy Truck Traffic


Faculty of Mining, Geology and Petroleum Engineering, University of Zagreb, Pierottijeva 6, 10 000 Zagreb, Croatia
*
Author to whom correspondence should be addressed.
Energies 2019, 12(3), 515; https://doi.org/10.3390/en12030515
Submission received: 27 December 2018
/
Revised: 30 January 2019
/
Accepted: 2 February 2019
/
Published: 6 February 2019
(This article belongs to the Special Issue Selected Papers from SDEWES 2018 Conferences on Sustainable Development of Energy, Water and Environment Systems)
Abstract
:Liquefied natural gas (LNG) use as a fuel in road and maritime traffic has increased rapidly, and it is slowly entering railroad traffic as well. The trend was pushed by the state administrations of mainly EU countries and international organizations seeing LNG as a cost-effective and environmentally friendly alternative to diesel. Different infrastructural projects for the widespread use of LNG in transport have been launched around the world. The main goal of this paper was to analyze use of LNG as a fuel for heavy trucks. Different aspects of LNG chain were analyzed along with economical and ecological benefits of LNG application. Filling stations network for LNG were described for the purpose of comparative analysis of diesel and LNG heavy trucks. Conclusion has shown that using LNG as propellant fuel has numerous advantages over the use of conventional fuels. The higher initial investment of the LNG road vehicles could be amortized in their lifetime use, and in the long-term they are more affordable than the classic diesel vehicles. In addition to cost-effectiveness, LNG road vehicles reduce CO2 emissions. Therefore, the environmental goals in transport, not only of the member states but worldwide, could not be met without LNG in heavy truck traffic.
1. Introduction
The last two decades the global natural gas market has undergone major changes triggered by increased production of unconventional gas in the United States (US) [1]. The unconventional gas has influenced the price of natural gas globally, especially on the US market. The price affects the balance of the supply and demand and the market share of liquefied natural gas (LNG) on the global market is mainly driven by the price, but more and more it becomes the strategic and geopolitical issue [2,3]. Global gas demand is expected to grow 1.6% per annum over the next four years, reaching a level of nearly 4 billion cubic meters by 2022, compared to 3.63 × 10¹² m3 in demand in 2016 [4]. Industrial sector demand is becoming the main driver of gas consumption growth, replacing the electricity production sector, where renewable sources and coal compete the natural gas. Predictions show that the US, as the world’s largest consumer and natural gas producer, will account for 40% of the world’s additional gas production by 2022 thanks to the remarkable growth of domestic production. Not lately than 2022, US production would amount to 890 × 109 m3, or more than a one fifth of global gas production. Therefore, the large amounts of produced gas could be turned into LNG and sent worldwide for exports [4]. Large quantities of export LNG in the US could result in lower prices for natural gas in Europe, especially lower prices for LNG shipments coming to Europe [5]. Even without lower prices the number of LNG import terminals is increasing in Europe and with lower prices the expansion of the LNG market could be even bigger and LNG could be very favorable for use as a fuel for heavy trucks consequently [6,7]. So far, many studies have shown the economic and environmental benefits of using LNG as a fuel for heavy trucks. Arteconi et al. in their study from 2009 have analyzed the life-cycle greenhouse gas of LNG as a heavy vehicle fuel in Europe. They have compared the life cycle in terms of greenhouse gasses (GHG) emissions of diesel and LNG used as fuels for heavy-duty vehicles at the European market (then EU 15). They study revealed that numerous studies have reported different results depending on different assumptions. In their study, two possible LNG procurement strategies were considered in the case of LNG being traded at the regasification terminal or in the case of small-scale LNG. They determined that the use of terminal enables a 10% reduction in GHG emissions compared to diesel, while the emission from small-scale LNG are comparable to diesel ones [8].
Ou and Zhang in their study from 2013 have examined the primary fossil energy consumption and GHG emissions for natural gas based alternative vehicle fuels in China. The results of their study have shown that compressed natural gas (CNG) and LNG fueled vehicles have similar well-to-wheels energy use compared to conventional gasoline and diesel vehicles, but difference is emerging along with mileage. They also concluded that CNG and LNG vehicles emit 10–20% less GHG emissions than gasoline and 5–10% less than diesel vehicles. Due to lower content of carbon in natural gas than in petroleum, gas to liquid vehicles emit approximately 30% more GHG emissions than conventional vehicles but the carbon emission intensity of the LNG energy chain is highly sensitive to efficiency of natural gas liquefaction and process used [9]. The environmental impacts and benefits of LNG use in heavy trucks will be furthermore investigated in following sections.
Other studies during literature research reveal economic aspects of LNG use in transport sector. Different research that were related to use of natural gas in transport resulted in fact that LNG use is sensitive to the fuel price differentials. An increase in natural gas price will reduce the economic appeal of using LNG in transport. In the Energata study, the important factors that affect the economics of LNG in transport focusing on LNG vehicles versus diesel have been highlighted along with opinion on the effects of price increase on the future of natural gas vehicles. The study results showed that using LNG for transport would continue to make economic sense even in the case of price increase but resulting on payback time for a LNG vehicle owner. Overall, it was concluded that increasing environmental awareness, more government support like subsidies and stricter environmental regulations would influence on increase of natural gas in transport sector [10].
Madden et al. have conducted exhaustive research for CEDIGAZ, the International Association for Natural Gas, predicting that LNG as a fuel will capture a significant market share in the transport sector by 2035. They have observed the greatest potential in road transport, were annual demand was projected to 96 million tons per year in the base scenario, while demand in the marine transport of LNG was estimated to 77 million tons per annum (mtpa). The rail sector could add another 6 mtpa to global demand according to their predictions. They also stated that the development of LNG as a transport fuel faces a number of challenges including going hand in hand with the development of fueling infrastructure [11]. The fact that filling stations network have not been developed at all in South East Europe will be further more analyzed in following sections.
The Pfoser and al. in their latest research from 2018 discussed acceptance of LNG as an alternative fuel and have analyzed determinants and policy issues. Their study implied that transport sector contributed a quarter of the total greenhouse gas emissions in the EU-28 in 2015. Road transport was responsible for almost 73% of the total greenhouse gas emissions from transport [12]. Authors stated that several alternative fuel technologies have emerged recently. The main issue concerning the most of them are considerable restrictions in case of heavy trucks traffic or long distance transport. Electric vehicles offer short ranges and long recharging time limiting their application to urban transport and short distances. The high potential of hydrogen in reducing GHG emissions is on the other hand decreased with production costs of hydrogen that are still very high limiting wider application. The use of biofuels such as bioethanol and biodiesel is problematic due to land availability for their production [12]. Furthermore they also analyzed environmental benefits of introducing LNG as alternative fuel including the clean combustion of LNG causing nearly 99% less particle (PM) and sulfur oxide (SOx) emissions, around 80% less nitrogen oxides (NOx) and around 20% less CO2 compared to diesel fuel. They stated that emissions reduction could be even further enhanced by mixing liquefied methane from renewable resources into the fuel. Since transport sector represents the severe obstacles to compliance with European policy environmental targets, and road transport in particular, it is clear that any greenhouse gasses (GHG) reduction represents the step forward, which was the main reason for conducting proposed research concerning possibility of use of LNG in transport sector in South East European region. Since, measures for increasing share of LNG in transport use, not only road but also marine, river and railroad could bring environmental benefits and consequently increase competitive advantages of LNG it was necessary to investigate specific data of LNG road transport use and possibility of introducing LNG into transport sector of South East Europe [12,13]. In the Central and South Europe and also in the Republic of Croatia as a part of this region, there is currently no infrastructure for LNG use, but according to European regulations, the Government of the Republic of Croatia has adopted the law for alternative fuels and the LNG infrastructure development plan [14,15]. The similar situation is in other countries in region. Besides Spain, France, and West European countries, the LNG infrastructure network for LNG use in EU in transport is least-developed or it is not developed at all. Due to the facts that the increased volumes of LNG are available for export worldwide, that the flexibility of LNG carriers has increased lately, that the share of long-term contracts among LNG suppliers decreased, the world order of the global LNG market changes which make LNG more and more accessible and affordable and therefore suitable for widespread use.
2. LNG as a Fuel
Liquefaction of natural gas reduces its volume by approximately 600 times making it economical for transport. It is colorless and odorless, it is not toxic and does not corrode. LNG is produced from natural gas in the liquefaction plants where the liquefaction process begins with the separation of water, acid gases, and heavy hydrocarbons that would freeze in the process and become solid or damage the plant otherwise. LNG typically contains between 85 to 95% of methane, but may also contain other components, such as ethane, propane, butane, and nitrogen. Purified gas is then cooled into liquid state at −162°C, to reduce the volume and ease the transport. Liquefaction of one kilogram of natural gas or biomethane requires around 0.65–0.9 kWh of energy. LNG is then transported using ships specially designed for LNG transport. Upon reaching its destination most of LNG is turned back to gaseous state in regasification terminal, where LNG is heated and further transported by pipelines for industry consumers, households and energy transformation needs [16,17,18]. A smaller amount of LNG is used as a fuel in maritime and road transport [19]. Although the prices of such vehicles are higher, LNG as a fuel has many advantages over conventional diesel and compressed natural gas (CNG), which will be discussed later in this paper.
LNG’s highest heating value is estimated at 24 MJ/l while the lowest higher heating value of LNG is estimated at 21 MJ/l. LNG energy density is 2.4 times higher than compressed natural gas (CNG) and it is comparable to the energy intensity of propane, but it is only 60% of the diesel energy density and 70% of the gasoline energy density [20,21].
2.1. Field of Application
Both CNG and LNG are lighter than gasoline or diesel, but have a lower energy content, which means that a larger tank would be required for the same traveling distance. One liter of diesel fuel has the same energy value as 1.7 liters of LNG. Most significant difference between CNG and LNG is in density (LNG has a density of 466 kg/m3 at −162 °C and atmospheric pressure while CNG has a density of 215 kg/m3 at pressure of 250 bar and room temperature). It takes 2.4 liters of CNG to produce the same amount of energy as one liter of LNG. This makes the LNG better fuel when it comes to larger vehicles and vehicles that travel long distances. LNG has several advantages in transport, especially for high power engines [11,22]. The liquid state of the LNG allows a flow similar to the flow of diesel fuel thus resulting in faster filling up a tank comparing to CNG. So far, natural gas has been used as a fuel for heavy vehicles only in vehicles for local use, up to 450 kilometers from filling to filling, such as public transport and garbage removal. The reason is that 1 liter of diesel is equivalent to 5 liters of natural gas compressed to 250 bar. For this reason, the compressed gas fuel tank volume should be about five times larger than the diesel tank, which reduces the convenience for larger distances. This highlights the benefits of LNG, with 1.7 liters being enough to replace a liter of diesel. Also high power engines require high fuel injection pressure in the cylinder, and pressurizing LNG is far more efficient than the equivalent process for CNG [20,23].
The application of LNG in transport has its disadvantages and one of them that has to be taken into consideration is that its application has distance limitation. The 950- to 1200-kilometer fuel cycle between fuel filling is distance for the future filling stations networks planning. There are over 4.6 million heavy trucks and buses running for 340 days a year on average, which is an ideal market for LNG [24]. In addition, LNG has already been applied in maritime traffic, and in Norway it is also considered to be used in railway transport. Most likely, the CNG will be developed further in urban transport systems and delivery trucks, where the CNG is considered an attractive option. Nonetheless, there is a type of filling stations that can quickly and economically profitable generate large volumes of CNG from LNG (LNG-CNG filling station), which means that LNG could enter the CNG market as raw material. The LNG-CNG filling station is economically far more cost-effective than the CNG filling station as far as capital investment and maintenance is concerned and can fill the vehicle’s cargo tank much faster because the LNG is a liquid and requires less pressure drops for the same mass flow compared to gas. It should also be noted that the price of LNG is slightly higher than the CNG because it is technologically more demanding to produce [20]. Overall number of natural gas powered vehicles is still relatively small, and it is estimated to be below 5% of all vehicles [25].
2.2. Financial Aspects
Financial aspects of fuel use are the main reason for fuel switch and it is obvious that wider acceptance and consequently application of LNG in transport use should be analyzed firstly from the economical point of view. The LNG truck was about 30–40% more expensive than the diesel truck in 2013 according to energy analysts Enerdata. In the analysis a comparison of the fuel price per kilometer for an LNG truck and a diesel truck was made [10]. The data of the Enerdata analysis showed that the LNG truck is spending 0.138 USD per kilometer less than the diesel truck (Table 1).
Differential fuel costs are reduced to 28% (from the current level of 31%) if half of the price increase (rounded to 0.05 USD/km) is passed on to the end user. If a possible rise in fuel prices is calculated, the difference in fuel costs per kilometer would be reduced to 25%. Although the money-repayment period would be prolonged in the latter case, analysts believe that it is economically viable switching from diesel to LNG trucks [10]. In first example, if a new truck is taken into account (2017 Kenworth T370) that costs 158,943.00 $ assuming that the price of an equivalent LNG truck was 40% higher (222,520.00), the LNG truck would become more cost-effective than a conventional truck after 4 years and 2.5 months. After a decade the total savings would be around 87,000 USD. In the budget analysis, the annual distance travelled is 109,620.50 km [24].
In the second example, it was assumed that the new diesel truck would cost 80,000 euros, so its LNG alternative would cost 108,000 euros and that LNG truck would be 20% more expensive for maintenance. In this scenario, it was taken into account that the truck consumes 30 liters of diesel fuel per 100 kilometers or 25 kg of LNG per 100 kilometers. The price of diesel was 1.15 € per liter while the price of LNG is calculated as follows: at the Spanish hub, the LNG average price for the first quarter of 2017 was about 0.28 €/kg. According to the Competition Agency data, between 30–35% of the retail fuel price is at a wholesale price. If it is assumed that the wholesale price is 33% of the retail price, the price of 0.84 €/kg is obtained. In both cases, the trucks exceeded 110,000 km per year in the period of 15 years. Annual fuel and maintenance costs were calculated and shown in Table 2. Over 15 years, LNG truck would have saved around 138,000 euros and would become more cost effective after 2.16 years.
National Laboratory Argonne tested 18 LNG trucks over a 15-month period, and they concluded that LNG as a fuel allows significant reduction of costs and harmful emissions. Similar fuel consumption on the basis of equivalent energy during the study period was achieved in LNG trucks. On average, the fuel costs for LNG truck was around 48% less than for diesel trucks. With such cost estimates, the payback period is less than three years [26].
2.3. Ecological Aspects
The main switch in primary energy use or fuel use as it was previously mentioned was driven by economical aspects of it use. The main driver for fuel price in the future will not be supply and demand mechanism but more and more ecological aspects of fuel use. EU energy policy and environmental targets in energy sector represent the base for considering wider application of LNG in energy consumption in transitional period. The transport sector, as it was previously mentioned, represents one of the problematic issue since electrification of heavy-duty trucks in road traffic or marine transport is not an alternative in near future. Therefore, use of LNG represents alternative in transitional period towards sustainable energy society. The transport sector in the EU countries in 2009 was responsible for 20% of all emissions. One of the most obvious advantages of LNG as a fuel is visible if environmental considerations are taken into account [8,12,27,28,29,30,31,32,33]. The European Union encourages the development of alternative fuels to reduce carbon footprint [34]. Greenhouse gas emissions studies have been conducted during the lifecycle of diesel and LNG used in heavy road vehicles in Europe. The lifetime of the fuel is divided into three phases. The first phase is production, which also includes collecting and transportation, as well as diesel refining and LPG liquefaction, second phase is distribution, and the last phase is combustion. LNG liquefied at a large terminal produces about 10% less emissions than diesel fuel and LNG liquefied in a small plant produces around 3% less emissions than diesel fuel [8]. Apart from reducing CO2 emissions, SOX, NOX and particle emissions are also significantly reduced [35,36]. According to Kofod and Stephenson well to wheel GHG emissions from LNG trucks are around 19% lower than the ones from diesel truck and by using bio-LNG it’s possible to reduce GHG emissions up to 67% [37,38]. In China, the emissions were calculated based on the Tsinghua Fuel Lifecycle Analysis Model, a specifically designed fuel analysis instrument in China where the conclusion was that LNG powered vehicles have 5 to 10% less emissions than gasoline or diesel powered vehicles [9,27]. According to the research done by Song et al. usage of LNG trucks resulted in slight GHG reductions compared to a diesel trucks, estimated at approximately 8.0% based on the full life cycle [39]. Hao et al. said that one of the most effective strategies toward sustainable transportation is the promotion of natural gas vehicles with LNG as a very promising alternative. Compared to diesel vehicles, LNG vehicles tailpipe emissions can be more successfully controlled [40]. It is also important to notice that LNG powered heavy duty vehicles emit significantly less fine particles, which have a negative effect on human health, than conventional trucks [41]. Even though reductions of said greenhouse gasses are significant, climate benefits may be reduced or even delayed for decades due to loss of methane from gas supply chain. Methane impact on climate change is more than 25 times greater than same mass of CO2 over a 100-year period [42,43]. Thus, switch to LNG trucks may have negative impact on climate for next 200 years, even though usage of natural gas in other sectors may be beneficial at all time frames [44]. When switching from diesel to LNG heavy duty trucks, reduction in methane losses to the atmosphere may be needed to ensure climate benefits at all time frames. Until better data is available on magnitude of methane loss, impact of fuel switch is still uncertain [31]. Misra et al. report five tested technologies and results show that LNG trucks with the three-way catalyst have lower brake-specific NOx emissions. On the other hand, minimization of natural gas leakage into atmosphere during fueling and storing is crucial [45].
The main switch in primary energy use or fuel use as it was previously mentioned was driven by economical aspects of it use. The main driver for fuel price in the future will not be supply and demand mechanism but more and more ecological aspects of fuel use. EU energy policy and environmental targets in energy sector represent the base for considering wider application of LNG in energy consumption in transitional period. The transport sector, as it was previously mentioned, represents one of the problematic issue since electrification of heavy-duty trucks in road traffic or marine transport is not an alternative in near future. Therefore, use of LNG represents alternative in transitional period towards sustainable energy society. The transport sector in the EU countries in 2009 was responsible for 20% of all emissions. One of the most obvious advantages of LNG as a fuel is visible if environmental considerations are taken into account [8,12,27,28,29,30,31,32,33]. The European Union encourages the development of alternative fuels to reduce carbon footprint [34]. Greenhouse gas emissions studies have been conducted during the lifecycle of diesel and LNG used in heavy road vehicles in Europe. The lifetime of the fuel is divided into three phases. The first phase is production, which also includes collecting and transportation, as well as diesel refining and LPG liquefaction, second phase is distribution, and the last phase is combustion. LNG liquefied at a large terminal produces about 10% less emissions than diesel fuel and LNG liquefied in a small plant produces around 3% less emissions than diesel fuel [8]. Apart from reducing CO2 emissions, SOX, NOX and particle emissions are also significantly reduced [35,36]. According to Kofod and Stephenson well to wheel GHG emissions from LNG trucks are around 19% lower than the ones from diesel truck and by using bio-LNG it’s possible to reduce GHG emissions up to 67% [37,38]. In China, the emissions were calculated based on the Tsinghua Fuel Lifecycle Analysis Model, a specifically designed fuel analysis instrument in China where the conclusion was that LNG powered vehicles have 5 to 10% less emissions than gasoline or diesel powered vehicles [9,27]. According to the research done by Song et al. usage of LNG trucks resulted in slight GHG reductions compared to a diesel trucks, estimated at approximately 8.0% based on the full life cycle [39]. Hao et al. said that one of the most effective strategies toward sustainable transportation is the promotion of natural gas vehicles with LNG as a very promising alternative. Compared to diesel vehicles, LNG vehicles tailpipe emissions can be more successfully controlled [40]. It is also important to notice that LNG powered heavy duty vehicles emit significantly less fine particles, which have a negative effect on human health, than conventional trucks [41]. Even though reductions of said greenhouse gasses are significant, climate benefits may be reduced or even delayed for decades due to loss of methane from gas supply chain. Methane impact on climate change is more than 25 times greater than same mass of CO2 over a 100-year period [42,43]. Thus, switch to LNG trucks may have negative impact on climate for next 200 years, even though usage of natural gas in other sectors may be beneficial at all time frames [44]. When switching from diesel to LNG heavy duty trucks, reduction in methane losses to the atmosphere may be needed to ensure climate benefits at all time frames. Until better data is available on magnitude of methane loss, impact of fuel switch is still uncertain [31]. Misra et al. report five tested technologies and results show that LNG trucks with the three-way catalyst have lower brake-specific NOx emissions. On the other hand, minimization of natural gas leakage into atmosphere during fueling and storing is crucial [45].
2.4. Safety Aspects
During history, LNG was misperceived as unsafe fuel since its liquefaction process in the first half of the 20th century was characterized by fatal accidents. But development of LNG industry after the 1950s and all scientific record show that LNG has been used for years without a major incident, so it can be considered as a relatively safe fuel [18,23]. As mentioned before, LNG has no color, is non-toxic or carcinogenic, and may explode only indoors at a concentration of 5% to 15% [46]. However, some special security measures are needed. LNG is cryogenic and dangerous if it comes into contact with skin or eyes, which is why it is imperative to use visor, gloves and other forms of protection when working with LNG. Compared to other fuels, LNG is very safe when all the regulations are followed including best business practices [47].
2.5. Comparison to Other Alternatives
At this moment, there is no alternative powertrain or fuel that is economically attractive for long haul application, except for LNG trucks. Diesel fuel economy in traversed distance per equivalent of liter of diesel of LNG trucks with compression ignition is similar to diesel trucks, while LNG trucks with spark ignition have somewhat lower fuel economy (22% to 28% lower than diesel trucks). Hybridization of both LNG and diesel trucks improve fuel economy, but not significantly for long haul (3%–6%).
When it comes to CO2 emissions, LNG trucks can compete with diesel hybrid trucks and LNG trucks with compression ignition fare better than even fuel cell and battery electric trucks.
When it comes to breakeven price, as mentioned before, LNG trucks fare better than conventional diesel trucks and hybrids are not attractive option, except for diesel vehicles with a day cycles [48]. CNG and CNG hybrid trucks are also economically attractive options, but only for medium duty and urban applications [49].
3. LNG Application in Road Traffic
LNG vehicles are increasingly being considered and used, in road, maritime, railway traffic. In the use of such vehicles, the most significant is China, which in 2017 had more than 230,000 LNG trucks and around 3000 filling stations (CNG and LNG). There was 540 percent increase of sales of LNG heavy trucks in first seven months of the 2017 which accounts around 39,000 new trucks. Also, China plans to increase a number of filling stations to around 12,000 stations by 2020. Locations and types of this filling stations are carefully chosen using premade studies [50]. That way LNG trucks would spend 40% of the total Chinese consumption of LNG [51,52,53,54]. Vehicle use of natural gas is considered to be a high priority by policy enacted in a year 2007 by National Development and Reform Commission of China [55]. US currently has 144 LNG filling stations across the country (76 public) and plans to build 38 new ones [56]. In Europe there are around 1500 LNG trucks along with around 100 LNG filling stations. Filling infrastructure is most developed in Northwest Europe (UK, Netherlands and Norway) [57]. In 2016, 81% of LNG-CNG filling stations in Europe were built in the Netherlands, the United Kingdom, and Spain. In the rest of the Europe, the building of LNG and LNG-CNG stations begun in 2014 [58,59,60,61,62]. Current number of filling stations can be seen on Figure 1 (yellow are filling stations that are planned or in construction) [63].
Within this paper, an analysis of the impact of LNG trucks on ecological and financial aspects for the European Union has been conducted. According to Kofod and Stephenson, well to wheel GHG emissions from LNG trucks are on average 19% less than the diesel ones. They claim that LNG trucks for 1 MJ of energy used produce 211.7 grams of CO2 equivalent (CO2eq), while a diesel trucks produce 262 grams of CO2 equivalent for 1 MJ of energy used [37]. These numbers were used in the calculation of annual GHG emission for one truck. The annual GHG emissions were obtained by multiplying annual mileage, average fuel consumption, and the heating value of one liter of diesel or one kilogram of LNG and said CO2 emission equivalent for 1 MJ of energy used. The Table 3 shows the selected parameters for the calculation of annual GHG emissions.
Annual GHG emissions per truck and emission reduction per truck depending on annual mileage expressed in tonnes of CO2eq are shown in the Table 4.
Due to the lack of data on the average annual mileage at EU level, several values ranging from 70,000 to 130,000 km are assumed for annual mileage. The value of 70,000 km was chosen by the author’s experience on the national market, while the value of 130,000 km was selected due to average annual mileage for Dutch distribution services [64]. Average fuel consumption and heating values were chosen based on author’s experience.
Over the past two years, around 300,000 new trucks are registered annually in the EU, considering that number, it was possible to calculate annual emission reduction presuming that some of the new diesel trucks would be replaced by LNG trucks [65]. An analysis was made based on several different LNG truck shares in the total number of new trucks in the EU with the assumption that all other trucks are diesel trucks. Proposed shares of LNG trucks were 5%, 10%, 15%, 20%, 25%, 30%, and 50%. GHG emissions reduction depending on the annual mileage of the vehicle and LNG truck share expressed in 1000 tonnes of CO2eq is shown in Table 5.
Emission reduction was obtained by multiplying the emission reduction per truck, total number of new trucks in the EU and LNG truck share.
As noted above, apart from the ecological, the financial impact of LNG trucks in the EU was also analyzed in this paper. Within this analysis, annual fuel costs per truck for five different diesel prices and five different LNG prices were calculated depending on the annual mileage. The annual fuel costs per truck cost was obtained by multiplying the annual mileage, fuel price and fuel consumption shown in Table 3. These annual costs depending on annual mileage and fuel prices are shown in Table 6.
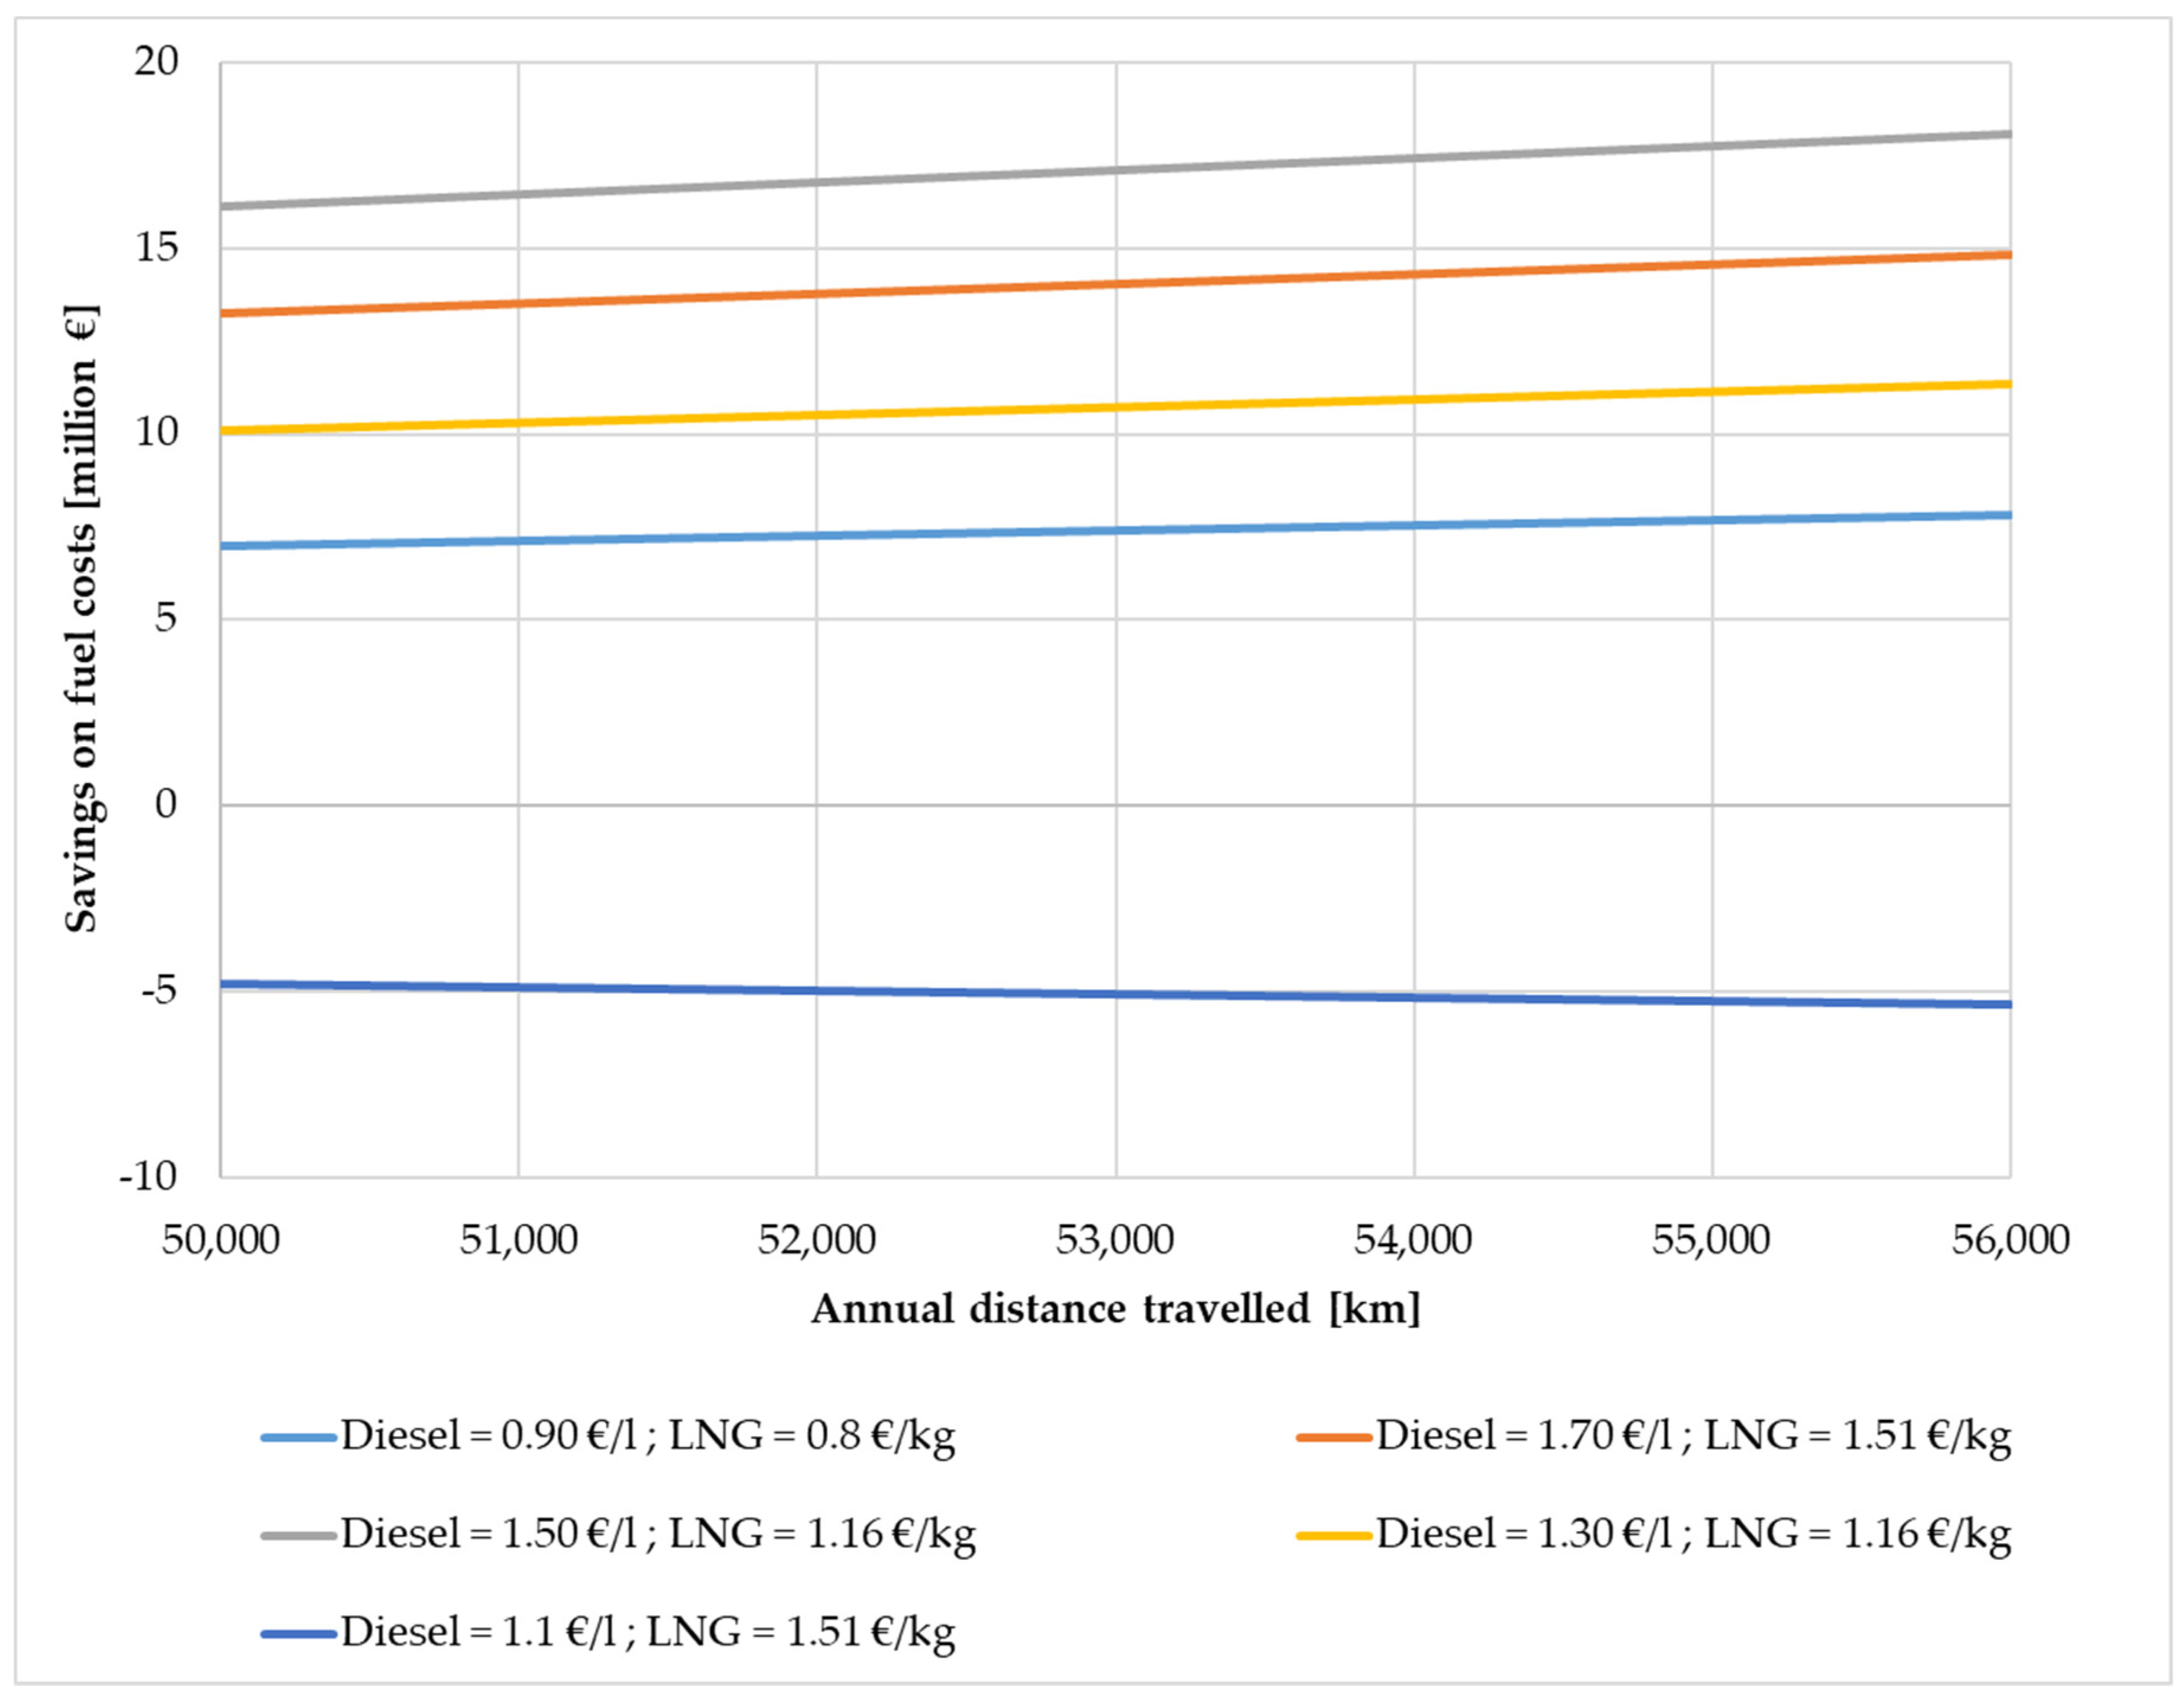
After calculating fuel costs per truck for several different fuel prices, five different price scenarios were created. In these scenarios, it is assumed that all 300,000 trucks in EU are LNG trucks. From the Figure 2 it can be seen that scenario “Diesel = 1.70 €/l; LNG = 1.16 €/kg” has the greatest savings because of the biggest diesel–LNG price ratio. Using this scenario with the assumption that all the trucks in the EU are LNG trucks with the annual mileage of 100,000 km, annual fuel cost savings on the EU level would be over 6.5 billion Euros. On the other side, using scenario “Diesel = 1.10 €/l; LNG = 1.51 €/kg” with the same assumptions as for the previous scenario, annual fuel cost savings would be negative, i.e. losses would be around 1.43 billion Euros on the EU level.
Since it is not practical to assume that all trucks in the EU will be LNG trucks, therefore by using the above stated calculations it is possible to calculate fuel savings for any LNG truck share and price scenarios. For example: A diesel truck that exceeds 124,000 km per year has an annual fuel cost of 55,800 € if the price of diesel is 1.5 €/l. The LNG truck for same mileage as the diesel one has annual fuel costs around 41,300 € if the price of LNG is 1.33 €/kg. It is clear that LNG truck annual fuel cost savings are around 14,500 €. For quantifying this savings for a larger area or region, calculated savings per truck needs to be multiplied with the number of LNG trucks in that area or region.
3.1. Filling Stations
Type of LNG stations can be divided in 3 groups: those that can fill LNG as liquid, as gas (LNG-CNG) or as both (LNG and LNG-CNG) [54,66,67]. Each of these filling stations can be made in a permanent, mobile, or semi-mobile configuration. Each configuration has its own advantages and disadvantages [68,69]. Permanent stations are usually the most technologically advanced and can support the provision of more vehicles but they require larger initial investment. The ideal type of station depends on the current and anticipated demand for LNG and the available technology. Countries that have larger fleets of LNG trucks and have some form of LNG charging infrastructure in already established routes, have simpler selection of location for a permanent station [68].
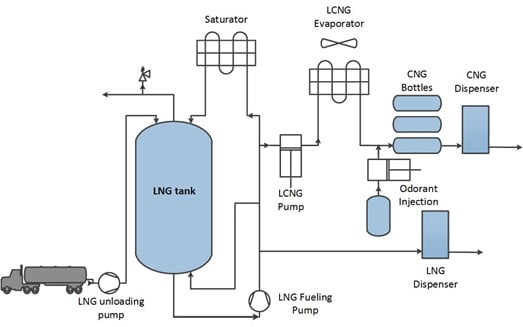
Typical LNG station consists of cryogenic tank for LNG, in the size of 60–70 m3, cryogenic submerged centrifugal pumps, dispenser with the proper certificates, connected to the system for charging, cooling system that keeps the LNG cold, gas discharge detection equipment, the control system that supports remote access, evaporator, odorizing unit, and dispenser for CNG [68]. LNG stations are structurally similar to conventional diesel and gasoline stations, since they both deliver liquid fuel [70] (Figure 3).
3.2. LNG Heavy Trucks
Most popular LNG heavy trucks on the European market that are currently available are Iveco Stralis Natural Power, Volvo FM Metan Diesel, Hardstaff Merceds Benz Actros and Scania G 340 LNG. Most of these trucks have several parallel LNG fuel tanks set up similarly to the classic diesel side rail. Containers are set to operate in parallel and the operator does not have to fill them separately [72,73,74]. The system has one connection for fuel delivery and one connection for ventilation to the filling station. Other parts of the system include interlaced pipe and pipe systems, heat exchanger, and several fuel control devices such as automatic fuel shut-off valve, pressure regulator, tank fuel level indicator, and lights that will light up in the cabin in a case of low temperature or low pressure in the tank. Some systems use pumps, and some, such as the Agility Fuel Solutions system, use the pressure of the tank itself to successfully supply the engine with the required fuel [75].
Large number of LNG systems in trucks don’t use pumps. When the engine is running, the natural gas under pressure goes out of the tank to the engine. Cold pressurized fuel passes through a heat exchanger [76] that uses heat from the engine coolant to evaporate the liquid and turn it into gas. When it comes out of the heat exchanger, the fuel is hot, under pressure of the tank, ready to burn in the engine [77]. An additional big advantage of LNG is that the cold energy of the fuel can be used for air conditioning [78]. It is important to note that most of LNG engine designs are not from “clean sheet”, but are converted versions of existing conventional fuel engine design. For that reason, there were many issues with commercial LNG engines compared to diesel engines, like poor torque at low speed and bad performance during acceleration [79]. One issue that causes this is low volumetric efficiency due to gasification process as well as bad boosting pressure at low speed and turbo-lag during acceleration. Certain changes were suggested to improve overall performance of LNG engines, especially during accelerating, or driving uphill. These problems can be mended by introducing intake air supply device coupled to a LNG engine intake system which could significantly improve engine torque and transient response. Performance could be further improved by adjusting the fuel-injection quantity, as well as optimizing spark timing [80]. Also, the LNG engine performance depends on the proportion of methane in the LNG mixture [81].
4. LNG Application in Croatia
Central and East Europe (East from Austria) only have few LNG filling stations. To describe the situation in the region Croatia was used since it has a great geostrategic position with the location on the East–West road map with the connection sea ports connection. In the Republic of Croatia, LNG fuel infrastructure does not exist at the moment and there are not any registered vehicles powered by LNG. In last few years Croatian government founded company that is currently working on building the LNG regasification terminal on island Krk, Croatia. The purpose of that terminal will be to increase diversification and security of natural gas supply [82]. On the other side, in 2016 there were 208 registered cars, 84 trucks, 10 mopeds, 6 motorcycles, 108 buses, and 11 CNG powered tractors, along with the infrastructure of two filling stations, in Zagreb and Rijeka [14]. Also, in 2016, a total of 57,911 vehicles were used in the Republic of Croatia that are using liquefied petroleum gas as a fuel, out of which 56,914 cars, 875 trucks, 8 mopeds and motorcycles, 16 buses, and 98 tractors and non-road mobile machinery [15]. From this, it is evident that there is a willingness of consumers to use alternative fuels. In 2017 there were 28,672 heavy trucks registered in Croatia and the number of new heavy trucks doubled in last five years [83]. Currently there are around 2000 new heavy trucks every year. Considering this, it is evident that there is a great potential for using LNG as a fuel for heavy trucks in road traffic. One Croatian company is currently working on the construction of the first LNG filling station in Croatia. Depending on the interest of transport companies Zagreb was chosen as a first location. The European Union encourages the construction of the said station with a 50% co-financing from the Connecting Europe Facility (CEF) program. The same company plans to build additional 11 filling stations throughout Croatia by 2025. The problem in Croatia, unlike in Germany, France and some other EU member states, is a shortage of incentives for purchasing LNG vehicles that would encourage transport companies to buy these vehicles.
In order to align with the EU Directive 2014/94/EU Croatian Parliament has passed the Law on Establishment of Alternative Fuels Infrastructure (09/12/2018). The third article of the law defines the terms to which the law applies, and LNG and CNG are defined as alternative fuels, along with hydrogen, liquefied petroleum gas, biomethane, and others [14]. The fourth article states that the National Policy Framework is to be established within six months of its entry into force. The National Policy Framework was adopted at a government session on the 6 April 2017. One part of the National Policy Framework related to the establishment of the LNG fuel infrastructure for heavy trucks requires following: “With the aim of facilitating the traffic of heavy trucks on main roads in the Republic of Croatia the infrastructure for the supply of LNG for heavy trucks must be available at the outskirts of the cities of Zagreb and Rijeka by 31 December 2025 and by 31 December 2030 in cities Split, Ploče, Slavonski Brod, Zadar, and Osijek (Figure 4), unless it is shown by 2020 for Zagreb and Rijeka and by 2025 for the other listed cities, that there is complete lack of demand. In the case of sufficient demand, it is possible to foresee the setting up of mobile units for the supply of heavy trucks by LNG on motorways at the edge of the cities near the motorway” [15]. The main problem of the road transport not only in Croatia but in all other Eastern Countries is that it has been redirected to marine transport via Kopar and Trieste port (Slovenia and Italy) replacing the great share of heavy road transport. The stricter environmental protection legislation for marine transport dating from 2020 will certainly increase the price of marine transport. On the other hand, some other infrastructure projects like Pelješki most in Croatia (that is on EU PCI—Project of Common Interest) list will result in finishing highway infrastructure in Croatia. Furthermore, Montenegro, and Albania highway projects will result in an Ionian–Adriatic road direction that will compete not only with marine transport but also other road routes like Italian route and therefore will have direct result in a new road direction development requiring filling stations infrastructure. Higher density of road transport will consequently lead to development of alternative fuels infrastructure development.
The use of LNG as a fuel for heavy trucks would result in a reduction of emissions, thus supporting the aims of several strategic documents of the European Union member states but also nonmember states such as: Europe 2020, White paper 2011—Roadmap to a Single European Transport Area, Clean Energy for All Europeans and National Energy Strategies of the Countries [84,85,86,87].
As for the EU, an analysis of the impact of LNG trucks on ecological and financial aspects for the Republic of Croatia has been developed in this chapter. The analysis methodology is the same as in the previous chapter and all parameters except annual mileage from Table 3 were also used in this analysis. For annual mileage, data was taken from the Center for Vehicles of Croatia database stating the average annual mileage for trucks in the Republic of Croatia is around 52,000 km [83]. Due to the accurate data on the annual mileage, a smaller range of annual mileage was taken as opposed to the EU example. Annual GHG emissions per truck and emission reduction per truck depending on annual mileage expressed in tonnes of CO2eq for the Republic of Croatia are shown in the Table 7.
In the past few years, about 2000 new trucks are registered annually in the Republic of Croatia and concerning this data, it was possible to calculate annual GHG emission reduction for the same LNG trucks shares like in the EU example. GHG emissions reduction depending on the annual mileage of the vehicle and LNG truck share expressed in 1000 tonnes of CO2eq is shown in Table 8.
For financial aspects, the same methodology, prices and parameters were used as in the EU example except for annual mileage, which was taken from the Center for Vehicles of Croatia. The annual fuel costs per truck depending on annual mileage and fuel prices are shown in Table 9.
After calculating average truck fuel costs for several different fuel prices, five different price scenarios were created (Figure 5). These scenarios are a bit different from the EU ones, with the same assumption that all trucks in Croatia were LNG trucks. As previously, some scenarios predict a substantial saving on fuel costs, while some predict losses. In the author’s opinion, the most realistic price scenario for Croatia is “Diesel = 1.30 €/l; LNG = 1.16 €/kg”. This scenario predicts annual fuel costs savings for LNG truck around 5250 €. For quantifying costs savings, the same methodology as before can be used.
5. Conclusions
The use of LNG in heavy trucks traffic certainly represents the contribution of the gas industry in CO2 emissions reduction in the transportation sector. The environmental advantages over conventional fuels for heavy trucks, despite higher initial investment price for the vehicles, give an advantage to LNG over diesel fuels, especially in terms of legislation banning diesel in EU countries. As the reduction of exhaust emissions and decarbonization of the energy sector are among the strategic goals of the European Union, LNG and other alternative fuels have been promoted through different projects and legal incentives. As was analyzed in the paper, the transport sector represents the severe obstacles to compliance with European policy environmental targets, especially in road transport, therefore calculated greenhouse gases’ reduction represents contribution to EU emission reduction goals. The results of conducted research show that increased share of LNG use in road transport could bring environmental and financial benefits and consequently increase competitive advantages of LNG. However, the expansion of LNG as a fuel in the European Union has not been widely spread and not introduced at all in of Southeast Europe, especially due to lack of infrastructure. The undeveloped fuel filling infrastructure and the lack of LNG use as a fuel in road traffic in this region represent Circulus Vitiosus. The LNG vehicles have not been purchased due to lack of infrastructure, and there is no infrastructure because there are not enough vehicles to provide this infrastructure. The undefined provisions of the legal regulations certainly do not help and therefore the harmonization of the regulations along with wider LNG promoting actions with incentives implemented will be needed in the future. Numerous projects implemented across the European Union can be a good example of measures that can be undertaken to allow the use of LNG as a fuel. Southeastern Europe, truck fleet operators, vessels, barges, and a wider public could have increased environmental and economical benefits from encouraging LNG as an alternative fuel, especially considering the possibility of building LNG terminal in Croatia that will possibly supply all filling stations in the Southeastern European region. Development of an LNG filling station network could connect the whole Europe in LNG road chain terms and therefore would result in increasing role of natural gas as a transitional fuel in transportation sector. This must be also accompanied by broader LNG acceptance, which is an important requirement for developing adequate and effective strategy measures for the introduction of LNG into a specific market in this case Southeast Europe. Measures should include stimulation of LNG demand, increasing the availability of LNG by introducing new terminals and filling stations and by diversification of LNG supply routes and finally improving ecological effects of LNG use as alternative fuel, as was also suggested in the research study conducted by Pfoser et al in 2018. Methodology developed in the paper including results of this research could help in developing national and regional energy scenarios and stating energy strategy goals concerning alternative fuels at specific market.
Author Contributions
Conceptualization, D.K.S. and B.D.; Methodology, I.S.; Software, I.S.; Validation, I.S., D.K.S. and B.D.; Formal Analysis, I.S. and L.J.; Investigation, I.S., D.K.S., B.D. and L.J.; Resources, D.K.S. and L.J.; Data Curation, I.S. and B.D.; Writing-Original Draft Preparation, I.S. and B.D.; Writing-Review & Editing, I.S., D.K.S., B.D. and L.J.; Visualization, I.S. and L.J.; Supervision, D.K.S.; Project Administration, I.S. and L.J.; Funding Acquisition, D.K.S.
Funding
This research was conducted within ESCOM Project. Project is funded by the Environmental Protection and Energy Efficiency Fund with the support of the Croatian Science Foundation grant number PKP-2016-06-6917. Publication process is supported by the Development Fund of the Faculty of Mining, Geology and Petroleum Engineering, University of Zagreb.
Conflicts of Interest
The authors declare no conflict of interest. The funders had no role in the design of the study; in the collection, analyses, or interpretation of data; in the writing of the manuscript, or in the decision to publish the results
References
- Karasalihović Sedlar, D.; Hrnčević, L.; Brkić, V. Impact of unconventional gas production on LNG supply and demand. Rudarsko-geološko-naftni zbornik 2010, 22, 37–45. [Google Scholar]
- Nosić, A.; Karasalihović Sedlar, D.; Jukić, L. Oil and Gas Futures and Options Market. Rudarsko-geološko-naftni zbornik 2017, 32, 38. [Google Scholar]
- Ledenko, M.; Velić, J.; Karasalihović Sedlar, D. Analysis of oil reserves, production and oil price trends in 1995, 2005, 2015. Rudarsko-geološko-naftni zbornik 2018, 33, 42. [Google Scholar] [CrossRef]
- IEA. IEA Sees Global Gas Demand Rising to 2022 as Us Drives Market Transformation. 2017. Available online: http://www.iea.org/newsroom/news/2017/july/iea-sees-global-gas-demand-rising-to-2022-as-us-drives-market-transformation.html (accessed on 28 August 2018).
- Asche, F.; Oglend, A.; Osmundsen, P. Gas versus oil prices the impact of shale gas. Energy Policy 2012, 47, 117–124. [Google Scholar] [CrossRef]
- Smajla, I.; Karasalihović Sedlar, D.; Drljača, B.; Jukić, L. Application of liquefied natural gas in road traffic in the Republic of Croatia. In Proceedings of the 13th SDEWES conference, Palermo, Italy, 30 September–4 October 2018. [Google Scholar]
- Calderon, M.; Illing, D.; Veiga, J. Facilities for bunkering of liquefied natural gas in ports. Transp. Res. Procedia 2016, 14, 2431–2440. [Google Scholar] [CrossRef]
- Arteconi, A.; Brandoni, C.; Evangelista, D.; Polonara, F. Life—Cycle greenhouse gas analysis of LNG as a heavy vehicle fuel in Europe. Appl. Energy 2010, 87, 2005–2013. [Google Scholar] [CrossRef]
- Ou, X.; Zhang, X. Life-cycle Analyses of Energy Consumption and GHG Emissions of Natural Gas-Based Alternative Vehicle Fuels in China. J. Energy 2013, 2013, 268263. [Google Scholar] [CrossRef]
- Enerdata. Effect of Price Reforms on the Demand of LNG in Transport in China. 2014. Available online: https://www.enerdata.net/publications/executive-briefing/china-lng-price-reforms-effets.html (accessed on 28 August 2018).
- Madden, M.; White, N.; Le Fevre, C. LNG in Transportation; INIS-FR—15-0528; CEDIGAZ: Paris, France, 2014; Volume 46. [Google Scholar]
- Pfoser, S.; Schauer, O.; Costa, Y. Acceptance of LNG as an alternative fuel: Determinants and policy implications. Energy Policy 2018, 120, 259–267. [Google Scholar] [CrossRef]
- Ozbilen, A.; Dincer, I.; Hosseini, M. Chapter 4.1—Comparative Life Cycle Environmental Impact Assessment of Natural Gas and Conventional Vehicles. Exergetic Energetic Environ. Dimens. 2018, 913–934. [Google Scholar]
- Novine, N. Zakon o Uspostavi Infrastrukture za Alternativna Goriva; Narodne Novine: Zagreb, Croatia, 2016. [Google Scholar]
- Novine, N. Odluka o Donošenju Nacionalnog Okvira Politike za Uspostavu Infrastrukture i Razvoj Tržišta Alternativnih Goriva u Prometu; Narodne Novine: Zagreb, Croatia, 2017. [Google Scholar]
- Andersson, H.; Christiansen, M.; Fagerholt, K. Transportation Planning and Inventory Management in the LNG Supply Chain. Energy Nat. Resour. Environ. Econ. 2010, 427–439. [Google Scholar] [CrossRef]
- GIIGNL. Basic Properties of LNG; LNG Information Paper No. 1; GIIGNL: Paris, France, 2009. [Google Scholar]
- Foss, M.M. An Overview on Liquefied Natural Gas (LNG), Its Properties, the LNG Industry, and Safety Considerations; Center for Energy Economics: Austin, TX, USA, 2012. [Google Scholar]
- Wan, C.; Yan, X.; Zhang, D.; Yang, Z. A novel policy making aid model for the development of LNG fuelled ships. Transp. Res. Part A Policy Pract. 2019, 119, 29–44. [Google Scholar] [CrossRef]
- Bloomers, P.; Oulette, P. LNG as a Fuel for Demanding High Horsepower Engine Applications: Technology and Approaches; Westport Innovations Inc.: Vancouver, BC, Canada, 2013. [Google Scholar]
- Coetzer, J. A new high energy density battery system. J. Power Sources 1986, 18, 377–380. [Google Scholar] [CrossRef]
- Cheenkachorn, K.; Chedthawut, P.; Choi, G.H. Performance and emissions of a heavy-duty diesel engine fuelled with diesel and LNG (liquid natural gas). Energy 2013, 53, 52–57. [Google Scholar] [CrossRef]
- Siu, N.; Herring, J.S.; Cadwallader, L.; Recce, W.; Byers, J. Qualitative Risk Assessment for an LNG Refueling Station and Review of Relevant Safety Issues; No. INEEL/EXT-97-00827-Rev. 2; Idaho National Engineering Lab: Idaho Falls, ID, USA, 1998. [Google Scholar]
- AFDC. Average Annual Vehicle Miles Traveled of Major Vehicle Categories. 2017. Available online: https://www.afdc.energy.gov/data/10309 (accessed on 28 August 2018).
- Chala, G.T.; Abd Aziz, A.R.; Hagos, F.Y. Natural Gas Engine Technologies: Challenges and Energy Sustainability Issue. Energies 2018, 11, 2934. [Google Scholar] [CrossRef]
- Argonne National Laboratory. Case Study—Liquefied Natural Gas, Argonne; Argonne National Laboratory: Lemont, IL, USA, 2013. [Google Scholar]
- Yan, X.; Crookes, R.J. Life cycle analysis of energy use and greenhouse gas emissions for road transportation fuels in China. Renew. Sustain. Energy Rev. 2009, 13, 2505–2514. [Google Scholar] [CrossRef]
- Burel, F.; Taccani, R.; Zuliani, N. Improving sustainability of maritime transport through utilization of Liquefied Natural Gas (LNG) for propulsion. Energy 2013, 57, 412–420. [Google Scholar] [CrossRef]
- Banawan, A.A.; Morsy El Gohary, M.; Sadek, I.S. Environmental and economical benefits of changing from marine diesel oil to natural-gas fuel for short-voyage high-power passenger ships. Proc. Inst. Mech. Eng. Part M J. Eng. Marit. Environ. 2010, 224, 103–113. [Google Scholar] [CrossRef]
- Pfoser, S.; Aschauer, G.; Simmer, L.; Schauer, O. Facilitating the implementation of LNG as an alternative fuel technology in landlocked Europe: A study from Austria. Res. Transp. Bus. Manag. 2016, 18, 77–84. [Google Scholar] [CrossRef]
- Camuzeaux, J.R.; Alvarez, R.A.; Brooks, S.A.; Browne, J.B.; Sterner, T. Influence of methane emissions and vehicle efficiency on the climate implications of heavy-duty natural gas trucks. Environ. Sci. Technol. 2015, 49, 6402–6410. [Google Scholar] [CrossRef]
- Wegrzyn, J.; Gurevich, M. Liquefied Natural Gas for Trucks and Buses; No. 2000-01-2210; SAE International: Warrendale, PA, USA, 2000. [Google Scholar]
- Osorio-Tejada, J.L.; Llera-Sastresa, E.; Scarpellini, S. Liquefied natural gas: Could it be a reliable option for road freight transport in the EU? Renew. Sustain. Energy Rev. 2017, 71, 785–795. [Google Scholar] [CrossRef]
- European Commission. Clean Transport—Support to the Member States for the Implementation of the Directive on the Deployment of Alternative Fuels Infrastructure—Good Practice Examples; European Commission: Brussels, Belgium, 2016. [Google Scholar]
- Baltic Transport Journal 2011. The Best Solution Is LNG. Available online: http://cleantech.cnss.no/wp-content/uploads/2011/11/LNG-articles-Baltic- Transport-Journal-October-2011.pdf (accessed on 28 August 2018).
- Sharafian, A.; Talebian, H.; Blomerus, P.; Herrera, O.; Merida, W. A review of liquefied natural gas refueling station designs. Renew. Sustain. Energy Rev. 2017, 69, 503–513. [Google Scholar] [CrossRef]
- Kofod, M.; Stephenson, T. Well-to Wheel Greenhouse Gas Emissions of LNG Used as a Fuel for Long Haul Trucks in a European Scenario. Conf. Pap. 2013. [Google Scholar] [CrossRef]
- Alamia, A.; Magnusson, I.; Johnsson, F.; Thunman, H. Well-to-wheel analysis of bio-methane via gasification, in heavy duty engines within the transport sector of the European Union. Appl. Energy 2016, 170, 445–454. [Google Scholar] [CrossRef]
- Song, H.; Ou, X.; Yuan, J.; Yu, M.; Wang, C. Energy consumption and greenhouse gas emissions of diesel/LNG heavy-duty vehicle fleets in China based on a bottom-up model analysis. Energy 2017, 140, 966–978. [Google Scholar] [CrossRef]
- Hao, H.; Liu, Z.; Zhao, F.; Li, W. Natural gas as vehicle fuel in China: A review. Renew. Sustain. Energy Rev. 2016, 62, 521–533. [Google Scholar] [CrossRef]
- Giechaskiel, B. Solid Particle Number Emission Factors of Euro VI Heavy-Duty Vehicles on the Road and in the Laboratory. Int. J. Environ. Res. Public Health 2018, 15, 304. [Google Scholar] [CrossRef] [PubMed]
- Anderson, B.; Bartlett, K.B.; Frolking, S.; Hayhoe, K.; Jenkins, J.C.; Salas, W.A. Methane and Nitrous Oxide Emissions from Natural Sources; United States Environmental Protection Agency: Washington, DC, USA, 2010. [Google Scholar]
- Clark, N.N.; McKain, D.L.; Johnson, D.R.; Wayne, W.S.; Li, H.; Akkerman, V.; Sandoval, C.; Covington, A.N.; Mongold, R.A.; Hailer, J.T.; et al. Pump-to-Wheels Methane Emissions from the Heavy-Duty Transportation Sector. Environ. Sci. Technol. 2017, 51, 968–976. [Google Scholar] [CrossRef]
- U.S. Environmental Protection Agency. Inventory of U.S. Greenhouse Gas Emissions and Sinks: 1990−2010, EPA Publication 430-R-12-001; U.S. Environmental Protection Agency: Washington, DC, USA, 2012. [Google Scholar]
- Misra, C.; Ruehl, C.; Collins, J.F.; Chernich, D.; Herner, J. In-use NOx emissions from diesel and liquefied natural gas refuse trucks equipped with SCR and TWC respectively. Environ. Sci. Technol. 2017, 12, 6981–6989. [Google Scholar] [CrossRef]
- Kumar, S.; Kwon, H.T.; Choi, K.H.; Lim, W.; Cho, J.H.; Tak, K.; Moon, I. LNG: An eco-friendly cryogenic fuel for sustainable development. Appl. Energy 2011, 88, 4264–4273. [Google Scholar] [CrossRef]
- Luo, D.-X. Safety Guarantee System for Natural Gas Supply Based on Multi-functional LNG Station. Gas Heat 2008, 3, 024. [Google Scholar]
- Zhao, H.; Burke, A.; Zhu, L. Analysis of Class 8 Hybrid-Electric Truck Technologies Using Diesel, LNG, Electricity, and Hydrogen, as the Fuel for Various Applications; Research Report—UCD-ITS-RR-13-25; Institute of Transportation Studies, World Electric Vehicle Symposium and Exhibition (EVS27): Barcelona, Spain, 2013. [Google Scholar]
- Burke, A.; Zhu, L. Analysis of Medium Duty Hybrid-Electric Truck Technologies Using Electricity, Diesel, and CNG/LNG as the Fuel for Port and Delivery Applications; University of California-Davis, Institute of Transportation Studies: Davis, CA, USA, 2014. [Google Scholar]
- Li, Y.; Li, W.; Yu, Y.; Bao, L. Planning of LNG Filling Stations for Road Freight: A Case Study of Shenzhen. Transp. Res. Procedia 2017, 25, 4580–4588. [Google Scholar] [CrossRef]
- NGV Global. China Heavy Duty Natural Gas Truck Demand Surges. 2017. Available online: https://www.ngvglobal.com/blog/china-heavy-duty-natural-gas-truck-market-surges-0930 (accessed on 29 August 2018).
- Xing, Y.; Liu, M.-E. Status quo and prospect analysis on LNG industry in China. Nat. Gas Ind. 2009, 1, 043. [Google Scholar]
- He, T.; Huang, H.; Lin, X.; Li, L. Application analysis and marketing proposals of the LNG vehicles and gas filling stations in China. Nat. Gas Ind. 2010, 9, 026. [Google Scholar]
- Chen, S.P.; Xie, G.F.; Li, Q.Y.; Chang, K. Comparison among LNG, CNG and L-CNG Filling Stations. Gas Heat 2007, 7, 006. [Google Scholar]
- Ma, L.; Geng, J.; Li, W.; Liu, P.; Li, Z. The development of natural gas as an automotive fuel in China. Energy Policy 2013, 62, 531–539. [Google Scholar] [CrossRef]
- AFDC. Alternative Fueling Station Locator. 2018. Available online: https://www.afdc.energy.gov/stations/#/find/nearest (accessed on 14 December 2018).
- GIE. LNG Map. 2017. Available online: https://www.gie.eu/index.php/gie-publications/maps-data/lng-map (accessed on 14 December 2018).
- Le Fevre, C.N. The Prospects for Natural Gas as a Transportation Fuel in Europe; Oxford Institute for Energy Studies: Oxford, UK, 2014. [Google Scholar]
- Giamouridis, A.; Paleoyannis, S. Security of Gas Supply in South Eastern Europe: Potential Contribution of Planned Pipelines, LNG and Storage; Oxford Institute for Energy Studies: Oxford, UK, 2011. [Google Scholar]
- Simmer, L.; Aschauer, G.; Schauer, O.; Pfoser, S. LNG as an alternative fuel: The steps towards European implementation. Wit Trans. Ecol. Environ. 2014, 186, 887–898. [Google Scholar]
- Vehrs, T. LNG as future transport fuel in Europe. In Proceedings of the 4th Annual Baltic Energy Summit, Tallinn, Estonia, 14–15 November 2012. [Google Scholar]
- Prontera, A. European Energy Security and the Politics of LNG Development in Southern Europe and the Mediterranean; Conference Paper; UACES: London, UK, 2016. [Google Scholar]
- LNG Blue Corridors. LNG Stations in Europe. Available online: http://lngbc.eu/ (accessed on 17 December 2018).
- Vermeulen, R.; Verbeek, R.; van Goethem, S.; Smokers, R. Emissions Testing of Two Euro VI LNG heavy-Duty Vehicles in the Netherlands: Tank-to-Wheel Emissions. TNO report 2017. TNO 2017 R11336. Available online: https://repository.tudelft.nl/view/tno/uuid:4b1cb389-868b-4a0c-91e2-81599242db5c/ (accessed on 23 January 2019).
- ACEA. Commercial Vehicle Statistical Press Releases. Available online: https://www.acea.be/statistics/tag/category/commercial-vehicles-registrations (accessed on 23 January 2019).
- He, H.; Lin, W.; Gu, A.Z. Preliminary Technical Study on L/CNG Stations. Nat. Gas Ind. 2007, 27, 126. [Google Scholar]
- Luo, D.-X. Technical Study of Multifunction LNG Station. Gas Heat 2008, 6, 034. [Google Scholar]
- Gallego, J.; Lebrarto, J.; Leclercq, N. LNG Stations Regulations. State of the Art; LNG-BC D4; European Commission: Brussels, Belgium, 2013. [Google Scholar]
- Qian, W.B.; Zhang, Y.; Li, D.; Yuan, G. Techno-economic Comparison between L-CNG Filling Station and CNG Filling Station. Gas Heat 2012, 4, 027. [Google Scholar]
- Boyer, M.L. CNG/LNG Filling Station. U.S. Patent No. 9,551,461, 2017. Available online: https://patents.google.com/patent/US20150013831 (accessed on 7 December 2018).
- SafBon. CNG/LNG (Compressed Natural Gas/Liquefied Natural Gas) Filling Station. Available online: http://www.safbon.com/Index/lists/catid/34.html (accessed on 16 December 2018).
- Kalet, G.; Gustafson, K. LNG Delivery System. U.S. Patent No. 5,373,702, 20 December 1994. [Google Scholar]
- Bassi, A. Liquefied Natural Gas (LNG) as Fuel for Road Heavy Duty Vehicles Technologies and Standardization; No. 2011-24-0122; SAE International: Warrendale, PA, USA, 2011. [Google Scholar]
- Chandler, K.; Norton, P.; Clark, N. Alternative Fuel Truck Evaluation Project-Design and Preliminary Results; No. 981392; SAE International: Warrendale, PA, USA, 1998. [Google Scholar]
- Agility Fuel Solutions, LNG Fuel Systems. 2018. Available online: https://agilityfuelsolutions.com/ (accessed on 30 August 2018).
- Neeser, T.A.; Hedegard, K.W. LNG Delivery System for Gas Powered Vehicles, Minnesota Valley Engineering, Inc. U.S. Patent 5,127,230, 18 February 1992. [Google Scholar]
- Chart Industries. LNG Vehicle Fuel Tank System Operations Manual. 2013. Available online: http://files.chartindustries.com/3835849_LNG-Operations-Manual-Final-Draft_010515_web.pdf (accessed on 30 August 2018).
- Yan, F.; Yi, W.; Xu, B.; Luo, Y. Study on the Characteristics of Heat Exchanger for Cold Energy Recovery in LNG Vehicles. Energy Procedia 2016, 104, 487–491. [Google Scholar] [CrossRef]
- Nwafor, O.M.I. Effect of advanced injection timing on the performance of natural gas in diesel engine. Sadhana 2000, 25, 11–20. [Google Scholar] [CrossRef]
- Tang, Q.; Fu, J.; Liu, J.; Zhou, F.; Yuan, Z.; Xu, Z. Performance improvement of liquefied natural gas (LNG) engine through intake air supply. Appl. Ther. Eng. 2016, 103, 1351–1361. [Google Scholar] [CrossRef]
- Chen, Z.; Zhang, F.; Xu, B.; Zhang, Q.; Liu, J. Influence of methane content on a LNG heavy-duty engine with high compression ratio. Energy 2017, 128, 329–336. [Google Scholar] [CrossRef]
- Veselić, M.; Karasalihović Sedlar, D.; Hrnčević, L. LNG regasification terminals access capacity analysis for security of European natural gas supply. Rudarsko-geološko-naftni zbornik 2011, 23, 25–38. [Google Scholar]
- Centar za vozila Hrvatske. Statistika. Available online: https://www.cvh.hr/tehnicki-pregled/statistika/ (accessed on 24 January 2019).
- European Commission. EUROPA 2020; European Commission: Brussels, Belgium, 2010. [Google Scholar]
- European Commission. White Paper 2011—Roadmap to a Single European Transport Area; European Commission: Brussels, Belgium, 2011. [Google Scholar]
- European Commission. Clean Energy for All Europeans; European Commission: Brussels, Belgium, 2016. [Google Scholar]
- Hrvatski Sabor. Strategija Energetskoj Razvoja Republike Hrvatske; Hrvatski Sabor: Zagreb, Croatia, 2009. [Google Scholar]
Figure 1.
Current and planned LNG filling stations in Europe (EU) [63].
Figure 1.
Current and planned LNG filling stations in Europe (EU) [63].

Figure 2.
Saving on fuel costs for five different price scenarios on EU level.

Figure 3.
Schematics of typical LNG/CNG (compressed natural gas) filling station [71].
Figure 3.
Schematics of typical LNG/CNG (compressed natural gas) filling station [71].

Figure 4.
Infrastructure for the supply of LNG for heavy trucks from the National Policy Framework [6].
Figure 4.
Infrastructure for the supply of LNG for heavy trucks from the National Policy Framework [6].

Figure 5.
Saving on fuel costs for five different price scenarios on Republic of Croatia level.


Table 1.
Comparison of fuel costs per km for diesel and liquefied natural gas (LNG) truck.
| Fuel Type | Fuel Consumption Per km | Fuel Price | Fuel Cost Per km |
|---|---|---|---|
| LNG | 0.46 m3/km | 0.666 USD/m3 | 0.306 USD/km |
| Diesel | 0.39 l/km | 1.125 USD/l | 0.444 USD/km |
Table 2.
Annual fuel and maintenance costs comparison for diesel and LNG truck.
| Fuel Type | Fuel Cost | Maintenance Cost | Total |
|---|---|---|---|
| LNG | 23 100 € | 11 484 € | 34 584 € |
| Diesel | 37 950 € | 9570 € | 47 520 € |
Table 3.
Parameters for calculation of annual greenhouse gasses (GHG) emissions.
| Annual mileage (km) | 70,000–130,000 |
| Average diesel fuel consumption (l/100 km) | 30 |
| Average LNG consumption (kg/100 km) | 25 |
| Diesel lower heating value (MJ/l) | 36 |
| LNG lover heating value (MJ/kg) | 48.6 |
| Diesel GHG emissions (gCO2eq/MJ) | 262 |
| LNG GHG emissions (gCO2eq/MJ) | 211.7 |
Table 4.
Annual liquefied natural gas (LNG) truck GHG emission reduction.
| Annual Mileage (km) | 70,000 | 80,000 | 90,000 | 100,000 | 110,000 | 120,000 | 130,000 |
|---|---|---|---|---|---|---|---|
| Diesel missions (tonne of CO2eq) | 198.07 | 226.37 | 254.66 | 282.96 | 311.26 | 339.55 | 367.85 |
| LNG emissions (tonne of CO2eq) | 180.05 | 205.77 | 231.49 | 257.22 | 282.94 | 308.66 | 334.38 |
| Emission reduction per truck (tonne of CO2eq) | 18.02 | 20.60 | 23.17 | 25.74 | 28.32 | 30.89 | 33.47 |
Table 5.
GHG emission reduction for different LNG truck shares on EU level.
| New Trucks Emission Reduction (1000 tonnes of CO2eq) | ||||||||
|---|---|---|---|---|---|---|---|---|
| Annual mileage (km) | 70,000 | 80,000 | 90,000 | 100,000 | 110,000 | 120,000 | 130,000 | |
| Share of LNG trucks in new trucks | 5% | 270.32 | 308.93 | 347.55 | 386.17 | 424.78 | 463.40 | 502.02 |
| 10% | 540.63 | 617.87 | 695.10 | 772.33 | 849.57 | 926.80 | 1004.04 | |
| 15% | 810.95 | 926.80 | 1042.65 | 1158.50 | 1274.35 | 1390.20 | 1506.05 | |
| 20% | 1081.27 | 1235.74 | 1390.20 | 1544.67 | 1699.14 | 1853.60 | 2008.07 | |
| 25% | 1351.59 | 1544.67 | 1737.75 | 1930.84 | 2123.92 | 2317.01 | 2510.09 | |
| 30% | 1621.90 | 1853.60 | 2085.30 | 2317.01 | 2548.71 | 2780.41 | 3012.11 | |
| 50% | 2703.17 | 3089.34 | 3475.51 | 3861.67 | 4247.84 | 4634.01 | 5020.18 | |
Table 6.
Annual fuel costs for diesel and LNG truck.
| Annual Fuel Costs Per Truck (€) | ||||||||
|---|---|---|---|---|---|---|---|---|
| Annual mileage (km) | 70,000 | 80,000 | 90,000 | 100,000 | 110,000 | 120,000 | 130,000 | |
| Diesel price (€/l) | 0.90 | 18,900 | 21,600 | 24,300 | 27,000 | 29,700 | 32,400 | 35,100 |
| 1.10 | 22,050 | 25,200 | 28,350 | 31,500 | 34,650 | 37,800 | 40,950 | |
| 1.30 | 27,300 | 31,200 | 35,100 | 39,000 | 42,900 | 46,800 | 50,700 | |
| 1.50 | 30,450 | 34,800 | 39,150 | 43,500 | 47,850 | 52,200 | 56,550 | |
| 1.70 | 33,600 | 38,400 | 43,200 | 48,000 | 52,800 | 57,600 | 62,400 | |
| LNG price (€/kg) | 0.80 | 14,000 | 16,000 | 18,000 | 20,000 | 22,000 | 24,000 | 26,000 |
| 0.98 | 16,333 | 18,667 | 21,000 | 23,333 | 25,667 | 28,000 | 30,333 | |
| 1.16 | 20,222 | 23,111 | 26,000 | 28,889 | 31,778 | 34,667 | 37,556 | |
| 1.33 | 22,556 | 25,778 | 29,000 | 32,222 | 35,444 | 38,667 | 41,889 | |
| 1.51 | 24,889 | 28,444 | 32,000 | 35,556 | 39,111 | 42,667 | 46,222 | |
Table 7.
Annual LNG truck GHG emission reduction.
| Annual Mileage (km) | 50,000 | 52,000 | 54,000 | 56,000 |
| Diesel emissions (tonne of CO2eq) | 141.48 | 147.14 | 152.80 | 158.46 |
| LNG emissions (tonne of CO2eq) | 128.61 | 133.75 | 138.90 | 144.04 |
| Emission reduction (tonne of CO2eq) | 12.87 | 13.39 | 13.90 | 14.42 |
Table 8.
GHG emission reduction for different LNG truck shares on Republic of Croatia level.
| New Trucks Emission Reduction (1000 tonnes of CO2eq) | |||||
|---|---|---|---|---|---|
| Annual Mileage (km) | 50,000 | 52,000 | 54,000 | 56,000 | |
| Share of LNG trucks in new trucks | 5% | 1.29 | 1.34 | 1.39 | 1.44 |
| 10% | 2.57 | 2.68 | 2.78 | 2.88 | |
| 15% | 3.86 | 4.02 | 4.17 | 4.33 | |
| 20% | 5.15 | 5.35 | 5.56 | 5.77 | |
| 25% | 6.44 | 6.69 | 6.95 | 7.21 | |
| 30% | 7.72 | 8.03 | 8.34 | 8.65 | |
| 50% | 12.87 | 13.39 | 13.90 | 14.42 | |
Table 9.
Annual fuel costs for diesel and LNG truck.
| Annual Fuel Costs Per Truck (€) | |||||
|---|---|---|---|---|---|
| Annual Mileage (km) | 50,000 | 52,000 | 54,000 | 56,000 | |
| Diesel price (€/l) | 0.90 | 13,500 | 14,040 | 14,580 | 15,120 |
| 1.10 | 15,750 | 16,380 | 17,010 | 17,640 | |
| 1.30 | 19,500 | 20,280 | 21,060 | 21,840 | |
| 1.50 | 21,750 | 22,620 | 23,490 | 24,360 | |
| 1.70 | 24,000 | 24,960 | 25,920 | 26,880 | |
| LNG price (€/kg) | 0.80 | 10,000 | 10,400 | 10,800 | 11,200 |
| 0.98 | 11,667 | 12,133 | 12,600 | 13,067 | |
| 1.16 | 14,444 | 15,022 | 15,600 | 16,178 | |
| 1.33 | 16,111 | 16,756 | 17,400 | 18,044 | |
| 1.51 | 17,778 | 18,489 | 19,200 | 19,911 | |
© 2019 by the authors. Licensee MDPI, Basel, Switzerland. This article is an open access article distributed under the terms and conditions of the Creative Commons Attribution (CC BY) license (http://creativecommons.org/licenses/by/4.0/).
Share and Cite
MDPI and ACS Style
Smajla, I.; Karasalihović Sedlar, D.; Drljača, B.; Jukić, L. Fuel Switch to LNG in Heavy Truck Traffic. Energies 2019, 12, 515. https://doi.org/10.3390/en12030515
AMA Style
Smajla I, Karasalihović Sedlar D, Drljača B, Jukić L. Fuel Switch to LNG in Heavy Truck Traffic. Energies. 2019; 12(3):515. https://doi.org/10.3390/en12030515
Chicago/Turabian StyleSmajla, Ivan, Daria Karasalihović Sedlar, Branko Drljača, and Lucija Jukić. 2019. "Fuel Switch to LNG in Heavy Truck Traffic" Energies 12, no. 3: 515. https://doi.org/10.3390/en12030515
Note that from the first issue of 2016, this journal uses article numbers instead of page numbers. See further details here.