Analysis of Regional Differences and Influencing Factors on China’s Carbon Emission Efficiency in 2005–2015


1
College of Urban and Environmental Sciences, Peking University, Beijing 100871, China
2
Freie Universität Berlin, Department of History and Cultural Studies, Institute of Sinology, Fabeckstraße 23-25, 14195 Berlin, Germany
3
Shenzhen Environmental Science and New Energy Technology Engineering Laboratory, Tsinghua-Berkeley Shenzhen Institute, Shenzhen 518055, China
*
Author to whom correspondence should be addressed.
Energies 2019, 12(16), 3081; https://doi.org/10.3390/en12163081
Submission received: 4 June 2019
/
Revised: 21 July 2019
/
Accepted: 23 July 2019
/
Published: 9 August 2019
(This article belongs to the Collection Energy Economics and Policy in Developed Countries)
Abstract
:With the challenge to reach targets of carbon emission reduction at the regional level, it is necessary to analyze the regional differences and influencing factors on China’s carbon emission efficiency. Based on statistics from 2005 to 2015, carbon emission efficiency and the differences in 30 provinces of China were rated by the Modified Undesirable Epsilon-based measure (EBM) Data Envelopment Analysis (DEA) Model. Additionally, we further analyzed the influencing factors of carbon emission efficiency’s differences in the Tobit model. We found that the overall carbon emission efficiency was relatively low in China. The level of carbon emission efficiency is the highest in the East region, followed by the Central and West regions. As for the influencing factors, industrial structure, external development, and science and technology level had a significant positive relationship with carbon emission efficiency, whereas government intervention and energy intensity demonstrated a negative correlation with carbon emission efficiency. The contributions of this paper include two aspects. First, we used the Modified Undesirable EBM DEA Model, which is more accurate than traditional methods. Secondly, based on the data’s unit root testing and cointegration, the paper verified the influencing factors of carbon emission efficiency by the Tobit model, which avoids the spurious regression. Based on the results, we also provide several policy implications for policymakers to improve carbon emission efficiency in different regions.
1. Introduction
Global warming has attracted the attention of politicians and scholars as it has severely affected the survival and development of human beings. According to the assessment results of the UN Intergovernmental Panel on Climate Change (IPCC), greenhouse gases, specifically CO2, are the main cause of global warming [1,2]. Hence, carbon emission reduction has become a consensus by the international community. As the largest carbon emitter, China has more pressure to reduce its carbon emission. According to the 2018 BP Statistical Review of World Energy, the average growth rate per annum of CO2 emission is 3.2% in mainland China from 2006 to 2016. Its CO2 emissions reach 9232.6 million tons in 2017, occupying 27.6 percent of the global emission amount [3]. Based on the Global Carbon Budget 2016 released by the Global Carbon Project (GCP), the carbon dioxide emissions per unit economic outputs of China is 0.65 kg CO2 per-year dollars, which is 1.8 times that of the United States and 2.8 times that of the European Union [4]. Therefore, the carbon dioxide emissions per unit GDP in China is also higher than that of developed countries.
As the carbon emission reduction has become an urgent task, China pledged to reduce carbon dioxide emissions per unit of GDP at the Copenhagen Climate Change Conference in December 2009 [5,6]. The national government also set up a target of reducing carbon emissions per unit of GDP by 20% in its thirteenth Five-Year Social and Economic Plan [7]. However, China has relied on an energy-intensive, heavy, industry-based developmental pattern for decades [8,9]. The path dependence of its economic structure makes it challenging to achieve this goal, and one suitable solution is to improve carbon emission efficiency.
However, China is a vast country with many regions, owning multifaceted features in its economic structure and resource endowment. The national government needs to formulate policies about carbon emission reduction at the regional level. The evaluation of the regional differences and influencing factors on the Chinese carbon emission efficiency has attracted the attention of scholars recently. Wang and Zhou et al. in 2013 found that CO2 emission performance on the provincial was the higher in southeastern coastal areas but lower in central and western inland regions. They also stated that their carbon emission performance has increased by different rates after 2001 [10]. Their evidence is also consistent with the recent finding on the regional low-carbon economic development by Chu and Geng et al. in 2019. The recent study also showed that the eastern region still had a higher degree of low-carbon economic development than the central and western regions [11]. Zhong et al. in 2012 also discovered that China’s total-factor carbon emission performance contains significant regional characteristics, and low carbon emission performance in the central and west regions [12].
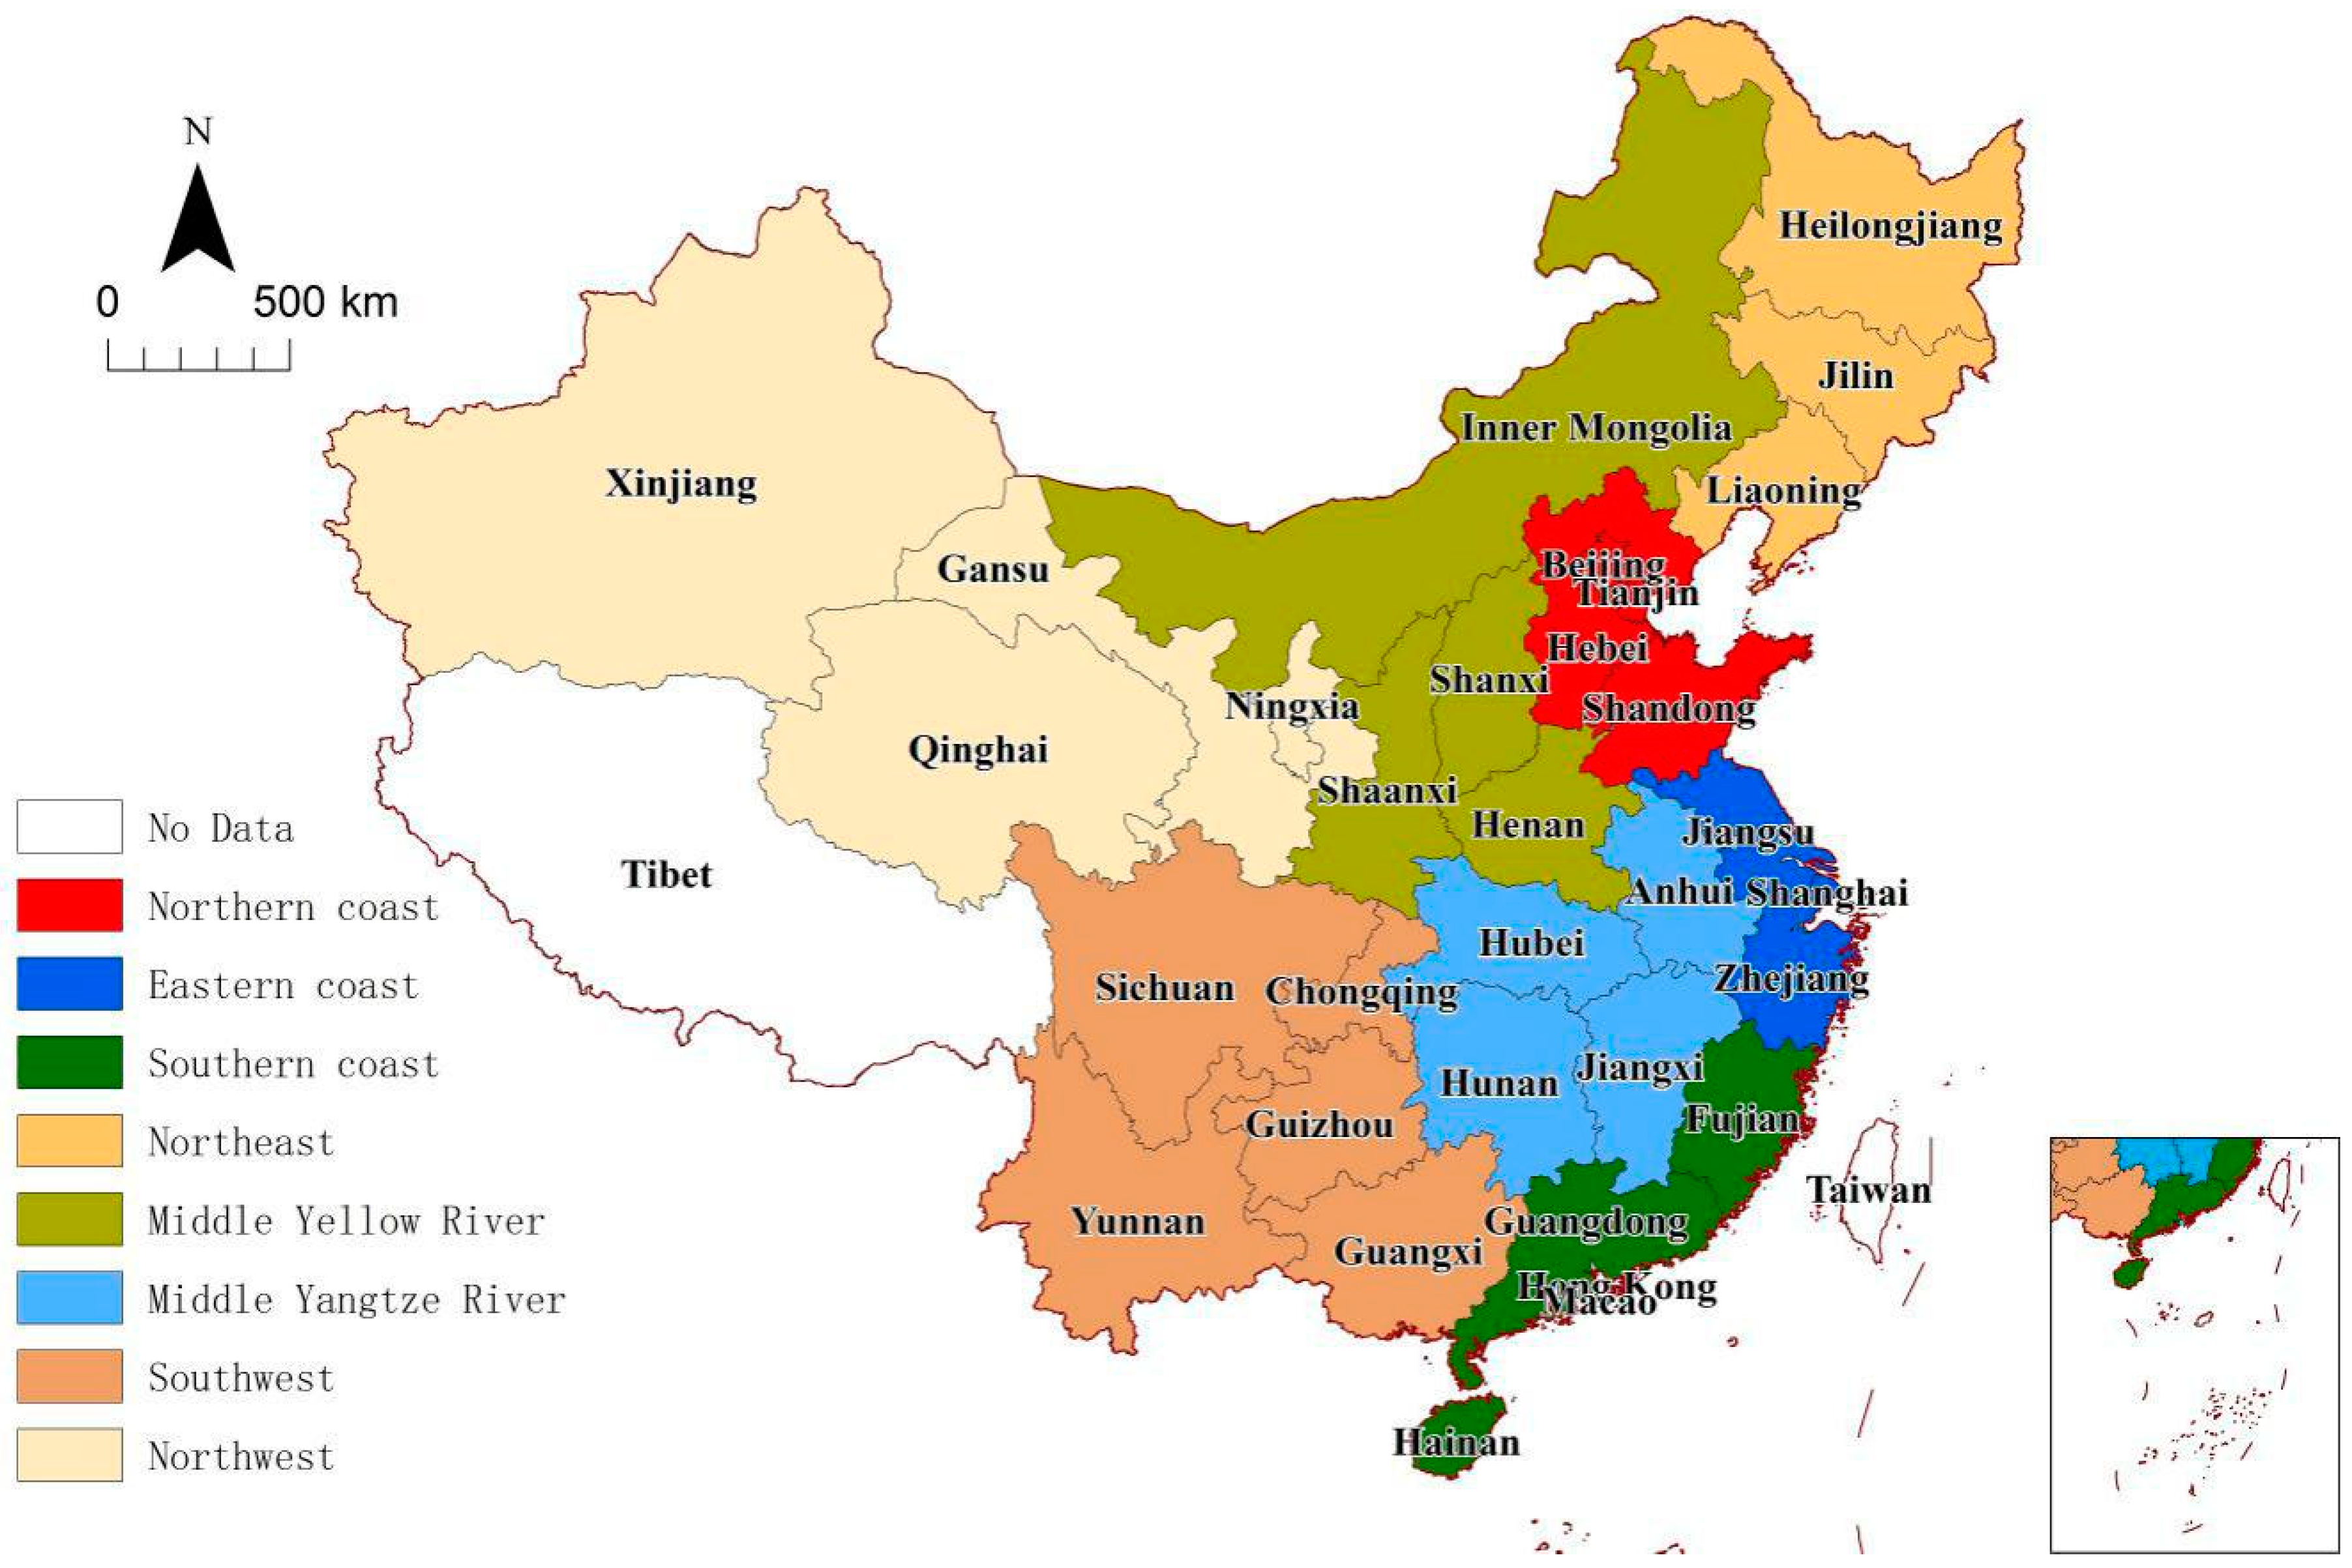
Until now, most of the studies have divided Chinese 30 provinces into three areas (East, Central, and West regions) based on geographical position rather than on economic characteristics, which cannot accurately reflect the state of regional carbon emission efficiency in China. In 2015, the Development Research Center of the State Council (DEC) classified Chinese provinces into eight economic regions (Northern coast, Eastern coast, Southern coast, Northeast, Middle Yellow River, Middle Yangtze River, Southwest, and Northwest) based on their geographical position, economic development level, and resource endowment [13]. This paper has chosen to investigate the disparity of carbon emission efficiency in the above eight economic regions proposed by the DRC.
As for the method to measure the carbon emission efficiency, the Charnes–Cooper–Rhodes (CCR); Banker, Chames, and Cooper Mode (BCC); or slacks-based measure (SBM) model have been widely adopted by scholars [14,15,16]. However, these methods have their advantages as well as insufficiencies [16,17,18,19,20,21,22,23]. Therefore, we used the Modified Undesirable Epsilon-based measure (EBM) DEA Model to calculate the carbon emission efficiency to overcome their shortcomings [16,19,23,24]. Based on the analysis of the regional difference in the carbon emission efficiency, we verified the influencing factors by the Tobit model [25]. This research aims to analyze the regional differences and influencing factors on China’s carbon emission efficiency from 2005 to 2015, based on the Modified Undesirable EBM DEA Model and Tobit model.
The basic structure of the rest of the paper is as follows. Section 2 will review the definition, measurement, and influencing factors of carbon emission efficiency. Section 3 will introduce the research method. Section 4 will present indicator selection and its data source. Section 5 will analyze the carbon emission efficiency in eight Chinese regions by the used the Modified Undesirable EBM DEA Model. Section 6 will adopt a Tobit model to verify the influencing factors of carbon emission efficiency. Finally, Section 7 will conclude and state the research limitations.
2. Literature Review
In recent years, carbon emission efficiency has become an important research issue in academic circles, and the main topics cover the definition, measurement, and influencing factors of carbon emission efficiency.
At present, there is no unified agreement on the definition of carbon emission efficiency by scholars. The definition of carbon emission efficiency stems from the method of calculation, such as the single-factor indicator method or total-factor indicator method [6]. The dominant types of single-factor indictor method include carbon dioxide emissions per unit of GDP, carbon dioxide emissions per unit of energy consumption, and carbon dioxide emissions per capita. Specifically, Kaya and Yokobori first proposed the concept of carbon production efficiency in 1993, which is the ratio of total GDP to the total amount of carbon emission [26]. Meilnik and Goldembergbet proposed the concept of the carbonization index in 2009, which is the ratio that the total amount of carbon emission to the total consumption of energy [27]. Sun (2005) proposed the carbon intensity, which calculates the ratio of CO2 emissions to GDP [28]. Based on the concept of frontier production, the total-factor indicator method for carbon emission consists of both input and output indicators. Meanwhile, some scholars regarded carbon emission as an undesirable output indicator to evaluate carbon emission efficiency [29,30,31,32,33].
The main methods of evaluating carbon emission efficiency include parametric and nonparametric ones. As for the parametric methods, Aigner and Lovell proposed the Stochastic Frontier Approach (SFA) by using a stochastic frontier production function to evaluate the technical efficiency in 1977 [34]. Later, SFA has become one of the most commonly used parametric methods. The disadvantage of this parameter method is the requirement for a particular functional form assumption for the frontier. Thus, possible incorrect functional forms can cause inaccurate results [10,35,36,37,38,39].
As for the nonparametric method, the DEA is a common nonparametric method for evaluating the relative efficiency of several Decision-Making Units (DMUs). Unlike SFA, DEA is a deterministic method that also has many advantages, which has the capability of handling multiple inputs and outputs [14]. In other words, the DEA keeps the input and output of DMUs unchanged by adopting the effective sample [40]. On the other hand, DEA does not require any specification of the functional form of the frontier, therefore more scholars use the DEA approach and its various modified modes to study carbon emission efficiency. These models they adopted can be classified into three types, radial model, nonradial model, and Directional Distance Function Model (DDFM)s [41].
(A) Radial model, namely CCR or BCC, which are the basic models of the DEA approach proposed in 1978 and 1984, respectively. After widely application in the literature, these methods have also been adopted in the Chinese context recently. Wei et al. in 2010 used the CCR model for measuring changes in total carbon emission efficiency of provinces in China from 1986 to 2008 [42]. Zhong et al., in 2012, applied BCC model to measure static carbon emission performance of China’s 29 provinces from 1995 to 2009 [12]. However, CCR or BCC model requires that all the inputs change in the same proportion, which ignores nonradial slacks and is contrary to reality [17,19,23,24].
(B) Nonradial model (SBM). To solve the weakness of CCR or BCC model, Tone proposed a nonradial Slacks-Based Measure that was able to calculate efficiency with slacks of input and output variables. SBM has been widely applied to evaluate carbon emissions efficiency and abatement potential recently. Chu and Geng et al. in 2019 applied the SBM to measure the carbon emission efficiency in 30 provinces of China from 2005 to 2017 [11]. Some other scholars also have conducted relevant research using SBM DEA model [21,43,44].
(C) Directional Distance Function Model (DDFM). The DDFM approach was put forward by Chung et al. (1997), which allows proportional expansion of desirable outputs and shrinking of undesirable outputs and inputs [41]. Some scholars attempted to apply these models to calculate the carbon emissions efficiency [45,46].
In addition to the definition and measurement of the carbon emission efficiency, influencing factors also have attracted academic attention. The common factors adopted include industrial structure, energy structure, openness, and one of primary research methods is the measurement method. The widely adopted one is the Economic Measurement Method, which employed both the spatial econometric model and the nonspatial econometric models. The spatial econometric model includes Spatial Lag Model (SLM) [47], Spatial Error Model (SEM) [47], and Spatial Durbin Model (SDM) [48], which are suitable to the case of the DUMs with obvious spatial correlations. For instance, Chuai et al. in 2012 analyzed the SLM between carbon emissions from energy consumption and their influencing factors in Chinese regions from 1997 to 2009. They stated that GDP and population are the two leading factors, which can strengthen the spatial autocorrelation of carbon emissions [49]. Ma and Chen et al. in 2015 established the SEM to perform an empirical study on the influence factors of carbon emissions efficiency by using panel data from 30 provinces from 1998 to 2011. They argued that the economic scale, industry structure, and energy consumption structure hurt carbon emission efficiency, while opening-up, enterprise ownership structure, and government intervention play a positive role in efficiency [50]. Cheng et al. in 2014 applied the SDM to examine the dominating factors of China’s carbon intensity from energy consumption from 1997 to 2010 [51]. The leading approach of the nonspatial econometric model is the Tobit model [25], also called the “limited dependent variable model”, or the “check model”. It considers the trend of continuous variable variation with limited dependent variables [25,26,52]. Wang at al. in 2019, used the Tobit model to analyze the influencing factors of carbon emission performance and the technology gap ratio of carbon emission in 30 provinces in China. They stated that influencing factors have various impacts on the carbon emission efficiency in the Chinese regions [53]. Some other scholars also investigated the carbon emission efficiency by using Tobit studies recently [54,55,56].
The above studies have provided a useful reference for further study on China’s carbon emission efficiency. However, these studies also have the following limitations. From the perspective of the calculation method, Radial models, such as the CCR or BCC model, fail to consider the effect of nonradial slacks on the technical efficiency and cannot realize the factor decomposition in evaluating the efficiency, which can lead to biased estimation results. For the nonradial SBM-DEA model, the slacks are not necessarily proportional to the inputs or outputs, and the DUMs can lose the proportionality in the original inputs or outputs [17,19,23,24].
Based on the above problems, the improvements in this paper are as follows. We used the nonoriented the Modified Undesirable EBM DEA Model to investigate carbon emission efficiency. The Modified Undesirable EBM DEA Model is based on the EBM model. Tone introduced an EBM approach in 2010 to combine the radial model and nonradial model, which is more in line with reality [23]. As the EBM model cannot solve the problem related to undesirable outputs, Li and Chiu et al. (2019) extended the EBM model into the Modified Undesirable EBM DEA Model to deal with them [17,19,24].
3. Research Method
3.1. The Definition of Carbon Emission Efficiency
In a broad sense, carbon emission is an abbreviated concept of greenhouse gas emissions, which includes CO2 (carbon dioxide), CH4 (methane), N2O (nitrous oxide), HFCs (hydrofluorocarbons), PFCs (perfluorocarbons), and SF6 (sulfur hexafluoride) [57]. Generally, carbon emission is regarded as CO2 emission because carbon dioxide in the greenhouse effect is the principal greenhouse gas. As CO2 is also the main greenhouse gas in China, this paper chose the latter definition.
As the single-factor indictor method does not consider the coupling between the various production factors, it ignores the influence of various factors such as labor force and energy consumption [6]. To improve the evaluation result accuracy, we used the total-factor indicator method. Carbon emission efficiency is defined as a production system for creating more goods output and less CO2 emissions while consuming fewer resources, such as labor, energy, and capital.
3.2. The Modified Undesirable EBM DEA Model
Because Tone and Tsutsui’s EBM did not consider any undesirable factors [23], Li and Chiu et al. combined the EBM DEA and an undesirable factor into the Modified Undesirable EBM DEA Model [17,19,24]. The paper applies it for the evaluation of the carbon emission efficiency of 30 provinces across mainland Chinese from 2005 to 2015.
Suppose n DMUk (k = 1,2, …, n) and m type inputs Xj (x1j,x2j, …, xmj) can produce s type outputs Yj (y1j,y2j, …, ymj). Li and Chiu et al.’s nonoriented, Modified Undesirable EBM DEA Model evaluates the technical efficiency γ* of DMU (Xo, Yo) by solving the following linear program [17,19,21,23,24].
where xi0 and yi0 are the ith input and the ith output when calculating the oth DMU, respectively; si− stands for the slack variable of input; sg and sb are the slacks of desired output and undesired output, respectively; and is the weight of input i, which satisfies . and indicate the weights of the desired output i and the undesired output i, respectively, which satisfy . εx represents the combination of radial θ and nonradial slack, and εy denotes the combination of radial φ and nonradial slack. γ*, which is the optimal solution in the EBM model and stands for the technical efficiency value of the DMU. With the value range between 0 and 1, the DMU is in the efficient state (if γ* = 1) or the nonefficient state (if γ* < 1). An inefficient DMU can reach the production frontier by reducing inputs and undesirable outputs or expanding desirable outputs.
3.3. Tobit Model
As defined above, the value of efficiency from the Modified Undesirable EBM DEA Model falls between the interval 0 and 1, which makes Y a limited dependent variable. If the Ordinary Least Squares (OLS) model is used to calculate the parameter, estimating results will be biased and consistent [6,25,40]. We utilized the Tobit regression model (1958) to analyze the influencing factors of carbon emission efficiency, which can estimate the parameters by using maximum likelihood estimation [25]. The structural equation of Tobit model was given as
In Equation (2), i stands for the ith DMU. Y* is the latent variable and Yi stands for a limited dependent variable. Yi is the latent variable, Xi is the explanatory variable, β represents the correlation coefficient, and u is the random error with the distribution of N(0, σ2). We calculated the regression coefficients by using maximum likelihood estimation in the Stata12.0 software.
4. Data Source and Indicator Selection
This paper investigated 30 provinces, municipalities, or autonomous regions (except Tibet) in China from 2005 to 2015. We selected the annual data of capital stock, labor force, and energy consumption as three inputs according to production processes and the prior research results [6,11,21,43,44]. We treated gross domestic product (GDP) as a desirable output and CO2 emission as an undesirable output. The inputs and outputs are explained as follows.
- Capital stock. The paper estimated the capital stock by using the perpetual inventory method, defined as follows [58].where Ki,t and Ii,t stand for the capital stock and the gross fixed capital formation of the ith province in the tth year, respectively. δ is the depreciation rate of capital stock, and is set to 9.6% in accordance with previous studies [59]. The provincial data of capital stock were converted into the 2005 constant price. The capital stock data of provinces in 2005 was expressed as followsAll data of the gross fixed capital formation as well as the price index of fixed-asset investment in Chinese provinces were from the China Statistical Yearbook (2006–2016).
- Labor force. The paper adopted the total amount of employees in three industries as the labor force variable. The data on the provincial level were collected from the statistical yearbook (2006–2016).
- Energy consumption. This paper chose the energy consumption of each province as the input index. The data were collected from China’s Energy Statistical Yearbook (2006–2016).
- GDP. To diminish the impact of inflation, we convert the provincial GDP into the 2005 constant price. The data came from the China Statistical Yearbook (2006–2016).
This paper calculated the carbon emissions from seven types of fossil energy, such as coal, coke, gasoline, kerosene diesel, fuel oil, and natural gas referring to the National Greenhouse Gas Emissions Inventory introduced by IPCC in 2006. The types of the fuels are classified according to the prior research results [6,8,11,20]. The formula for calculating CO2 emissions from fossil fuels is [62]
where CE represents the total CO2 emissions, ALCV stands for the average low calorific value, CCF denotes the carbon content factor, and COF is carbon oxidation factor. The number (44/12) represents the ratio of the molecular weight of CO2 (44) to the molecular weight of carbon. The subscript i stands for the energy source. The data of energy consumption were collected from the China Energy Statistical Yearbook (2006–2016). The data of the average low-order calorific, carbon content factor, and carbon oxidation factor were from the China Energy Statistical Yearbook and National Greenhouse Gas Emission Inventory Guide (2006) [62] and Guidelines for Provincial Greenhouse Gas Inventories in China (2011) [63], as shown in Table 1.
The formula for calculating carbon emissions from the process of cement production is
In Formula (6), CC represents the total amount of CO2 emissions during the process of cement production, Q stands for the total amount of cement production, and EFC represents the carbon emissions emission coefficient of cement production, the value of EFC is 527 kgCO2/t [64]. The all indicators were listed in Table 2.
5. Analysis of Regional Differences in Carbon Efficiency
5.1. Overall Characteristics of Chinese Carbon Emission Efficiency
The carbon emission efficiencies of 30 provinces of China during the period of 2005 to 2015 were calculated by Equations (1)–(3). The results are listed in Table 3.
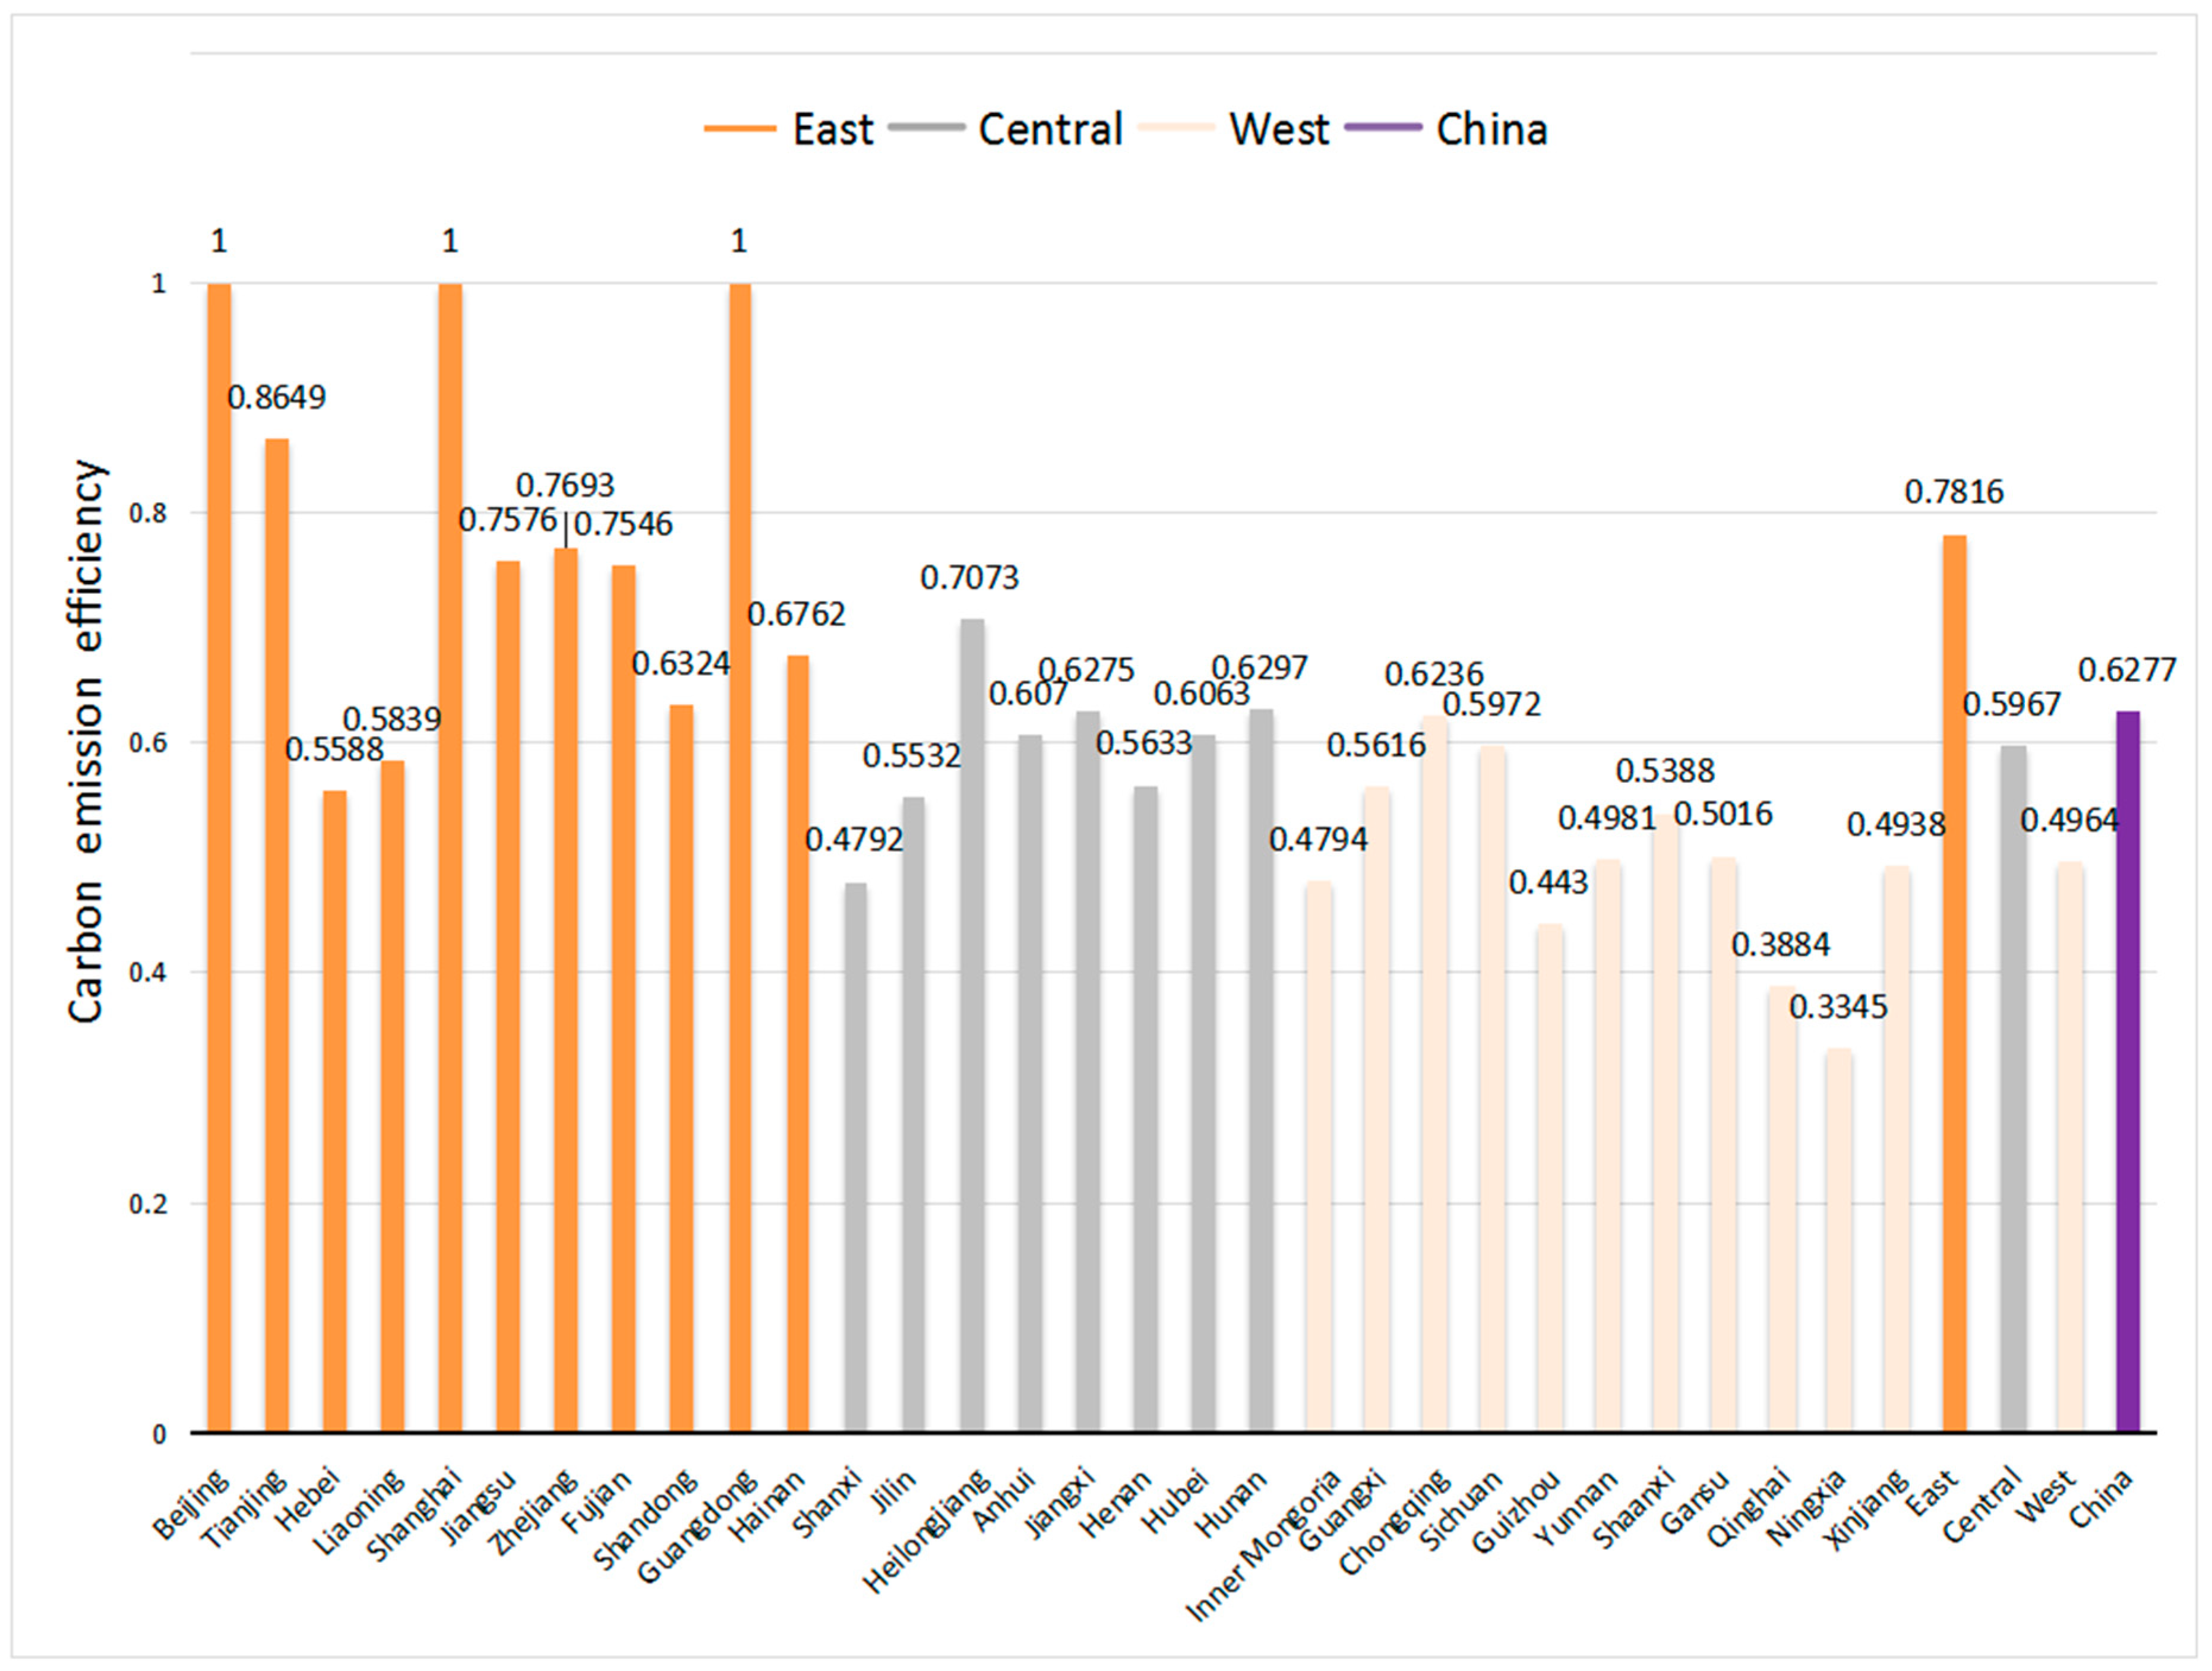
According to Table 3 and Figure 1, the carbon emission efficiency of 30 provinces was generally low from 2005 to 2015, with an average value of 0.6277. Only 11 provinces (Beijing, Shanghai, Guangdong, Tianjin, Zhejiang, Jiangsu, Fujian, Heilongjiang, Hainan, Shandong, and Hunan) performed better than the national average efficiency value. Yunnan, Xinjiang, Inner Mongolia, Shanxi, Guizhou, Qinghai, and Ningxia owned very low levels of carbon emission efficiency, which all were less than 0.5, indicating that most provinces still face the challenge of energy saving and emission reduction.
5.2. Regional Differences of Carbon Emission Efficiency: East, Central, and West
Figure 2 shows that (1) the eastern regions had the highest level of carbon emission efficiency—0.7816—followed by the central region (0.5967) and the western region (0.4964). (2) As for the eastern region, the carbon emission efficiency values for Beijing, Shanghai, and Guangdong in the eastern zone were 1, which showed that these provinces are the front runners in carbon emission efficiency and can benchmark for others. The carbon emission efficiency of the eastern provinces’ was higher than the national average, except Hebei and Liaoning. (3) For the central region, Heilongjiang had the highest level of carbon emission efficiency (0.7072), which was little below the frontier. Shanxi had the minimum level of carbon emission efficiency (0.4792), which performed slightly worse than Hebei (the one with the lowest level in the eastern region). As for the western region, Chongqing had the highest level of carbon emission efficiency in the region, but its performance was worse than that of Heilongjiang. Ningxia had the lowest average efficiency in the whole country.
5.3. Regional Differences in Carbon Emission Efficiency: A Comparison of Eight Comprehensive Economic Regions
In this subsequent analysis, Chinese provinces are divided into eight regions (Figure 3) in line with the division of the State Council to analyze the regional differences in carbon efficiency further. The carbon emission efficiency of eight regions is shown in Table 4.
Table 4 shows that (1) from 2005 to 2015, Northern, Eastern, and Southern coastal regions had a higher level of carbon emission efficiency than other regions, with an average efficiency of 0.7640, 0.8102, and 0.8423, respectively. Northeast and Middle Yangtze River had an average carbon emission efficiency of 0.6148 and 0.6176, respectively. Middle Yellow River, Southwest, and Northwest kept the carbon emission efficiency at a low level, and these regions’ average efficiencies were 0.5152, 0.5447, and 0.4296, respectively. (2) In a comparison of the provinces with the highest efficiency level in every region, the leading ones in Northern, Eastern, and Southern coastal regions were Beijing, Shanghai, and Guangdong, all of which are on the production frontier. Heilongjiang had the highest value of carbon emission efficiency in Northeast, with an average value of 0.7073, which was a little more than the national average while far below those of Beijing, Shanghai, and Guangdong. The provinces with higher carbon emission efficiency in the Middle Yangtze River and Southwest were Hunan and Chongqing. Those provinces’ average values were all smaller than 0.7 and far below the average level of frontier provinces. The most efficient provinces of Middle Yellow River and Northwest were Henan and Ningxia, and they held the value of more than 0.5, far from the frontier level. (3) The gap of carbon emission efficiency in the interior of the Northern coast and Southern coast was more substantial than other regions. The efficiency of Hebei and Hainan were lower than the average level of Northern and Southern coasts. The difference in carbon emission efficiency in the interior of the Middle Yangtze River was the smallest of the eight regions.
Several factors have contributed to these regional differences. First, Northern, Eastern, and Southern coastal regions are in the eastern part of China, which are the earliest areas exposed to open-up policy, and are more conducive to the introduction of foreign advanced technology, intelligence, equipment, experience, and capital. On the one hand, many universities and research institutes in the coastal regions play a crucial role in innovation activities. On the other hand, coastal regions own well-established transportation infrastructure, solid industrial foundation, and abundant human capital, which have attracted the introduction of other production factors from abroad. Therefore, a high level of production technology in the coastal regions results in high carbon emissions efficiency.
Second, many provinces in the Northeast and Middle Yangtze River belong to the Central area in China. The openness, education, and science and technology level of these provinces is lower than those of the coastal regions. As the old industrial bases in China, the Northeast region’s economic pillar is heavy industry, which is responsible for much of CO2, SO2, and COD emissions. Driven by the “Rise of Central China” Strategy (The Rise of Central China Plan is a policy to accelerate the development of its central regions in 2004, which covers six provinces: Shanxi, Henan, Anhui, Hubei, Hunan, and Jiangxi.), Middle Yangtze River has set up four national industrial transfer demonstration zones, which introduced many manufacturing industries from the coastal areas. These industries are characterized by high pollution and energy consumption, which leads to high carbon emissions inevitably.
Third, many provinces in the Middle Yellow River, Southwest, and Northwest belong to Western China. Their unfavorable geographic locations limit the introduction of foreign advanced technology, intelligence, equipment, experience, and capital. With the deepening of the reform and opening-up policy, the brain drain in these regions can be found by more talents moving to the eastern and central parts of China for better opportunities, which increase the difficulty improve the production technology and carbon emission efficiency.
6. Influence Factors of Carbon Emission Efficiency Based on the Tobit Regression
6.1. Determinants of Carbon Emission Efficiency
Based on the regional characteristics of carbon emission efficiency, we used the Tobit regression model to analyze their influencing factors. The influencing factors were selected by referring to previous studies, including government regulations, industrial structure, foreign trade level, foreign capital utilization level, energy intensity, and science and technology [6,8,11,53,65,66,67,68,69,70,71,72,73,74,75,76,77,78,79,80,81,82,83,84,85,86,87,88,89]. Furthermore, we compared the results with our prejudgments of each influencing factor. The data were collected from the China Statistical Yearbook (2006–2016).
6.1.1. Government Intervention in the Economy
We chose the government intervention in the economy as an independent variable, consistent with previous studies [6,11]. In China, the government’s macro-control policies have a significant impact on economic performance. For instance, the macro-control policies influence the resources allocation and industrial transfer among regions, which also impact the carbon emission reduction possesses indirectly. Additionally, if the macro-control policies promote the development of energy-saving industries, they will contribute to carbon emission efficiency. However, there is no agreed indicator for the government intervention policies, and we have adopted the proportion of the local financial expenditure to GDP as the proxy for the level of government intervention.
6.1.2. Industrial Structure
More recent attention has also focused on the relationship between industrial structure and carbon emission efficiency [66,67,68,69,70,71]. The higher proportion of tertiary industry in industrial structure can result in low energy consumption and carbon emissions. Therefore, this paper postulated that industrial structure is one factor to explain regional differences in carbon emission efficiency. This paper used the proportion of the local value-added of the tertiary industry to GDP as the proxy for the industrial structure.
6.1.3. Foreign Trade Level
In the process of globalization, China’s foreign trade volume has escalated after the opening-up policy in 1978. A growing body of literature has investigated the relationship between carbon emission efficiency and foreign trade level [11,72,73]. The opinions about the relationship between carbon emission efficiency and foreign trade level are contradictory in literature. Some scholars claimed foreign trade is a driving force to promote the carbon emission efficiency, because Chinese enterprises are under the pressure of international competition to improve their product and service quality. Their improvement efforts facilitate energy saving and resources consumption. Other scholars insisted that the industries in many Midwest provinces still export products with high resources consumption, which increase corresponding carbon emission. Therefore, the effect of foreign trade level worth further investigating, and we adopted the proportion of the local import and export trade to GDP as its proxy.
6.1.4. The Foreign Capital Utilization Level
The absorption of foreign capitals is an essential factor in the economic development and technological progression of developing countries. Currently, a considerable amount of research has been published on this topic [74,75,76,77,78]. On the one hand, the foreign capital may accompany a transfer of pollution-intensive industries from developed countries to developing countries less stringent environmental regulations, which gives rise to the problem of carbon leakage (the Pollution Haven Hypothesis) [79]. On the other hand, FDI is a “complex” of capital, technology, organization, and marketing networks [80]. FDI may also introduce advanced production technologies and management methods from aboard, which improve carbon emission efficiency indirectly. To investigate the impact of foreign capital utilization level, we adopted the proportion of local foreign direct investment to GDP to evaluate the degree of foreign capital utilization.
6.1.5. Energy Intensity
Some scholars also emphasized the impact of energy intensity on carbon emission efficiency [81,82,83,84,85]. Energy intensity is calculated as units of energy per unit of GDP. Low energy intensity indicates a lower cost of converting energy into GDP and accompanied by higher carbon emission efficiency. As energy intensity has a stronger impact on CO2 emissions, this paper has chosen energy intensity as one of the influencing factors for carbon emission efficiency.
6.1.6. Science and Technology Level
The recently published studies also described the relationship between science and technology level and carbon emission efficiency [11,86,87,88]. Adopting advanced technology, equipment, manufacturing models, or procedures can improve energy usage efficiency with a low cost, and thus enhance carbon emission efficiency. One precondition to improving science and technology level is to increase research and development (R&D) input. Liu and Xia et al. in 2018 stated that increasing technological expenditure can promote carbon emission efficiency growth [89]. Wang and Zhao et al. in 2019 found that R&D investments have a vital role in CO2 emission reduction [53]. Therefore, this paper chose the local R&D expenditure to GDP as a proxy for the science and technology level.
Table 5 will show the concrete definition of variable index.
6.2. Unit Root Test and Cointegration Test
Before proceeding to any econometric analysis, we tested the existence of unit roots in all variables first. In a non-stationary time series, the outstanding regression relationship between a variable and another random variable may result in spurious regression [90]. This paper adopted the LLC [91], IPS [92], Fisher-ADF [93], and PP-ADF [94] panel unit root test to determine the stability of the variables. In Table 6, results showed that four variables are not smooth level through the test, but all became stationary at the 1% significance level and rejected the null hypothesis of “existing unit root” at the significance level within 1% after taking first differences. This implies that all variables are stationary at the first difference, and there can be a long-term equilibrium relationship among all the variables.
If all variables remain non-stationary until the first-order difference, this analysis proceeds with the cointegration test. The paper used the Pedroni panel cointegration to determine whether the panel data had a cointegration relationship [95]. The test results are shown in Table 7.
Table 7 presented the panel cointegration test results for all variables. These results showed that four of the six statistics rejected the null hypothesis of no cointegration at the 1% significance level. Hence, the paper concluded that there was a constant long-run equilibrium relationship among carbon emission efficiency, government intervention in the economy, industrial structure, foreign trade level, foreign capital utilization level, energy intensity, and science and technology level in China from 2005 to 2015.
6.3. Explaining Carbon Emission Efficiency: Tobit Regression Results
Based on the above results, this paper evaluated the impact of above influencing factors on the carbon emission efficiency in China. The Tobit regression model assumed that
where CEEi,t represents the carbon emission efficiency value of the ith province in the tth year, β0, β1, β2,…, β6 stands for the unknown coefficients, and ui,t is a random disturbance term. The parameters were estimated by Stata12.0 software. The results are given in Table 8.
Government intervention was significant at the 1% level, with a regression coefficient of 0.461083, which indicates that government intervention influences carbon emission efficiency negatively. This result is consistent with a study in 2011 [96] and a recent one in 2019 [11]. From 2005 to 2015, the proportion of financial expenditure to GDP gradually increased from 18.11% to 25.63%, as the Chinese government took the proactive fiscal policy measures to intervene in the market economy. The results showed that the government’s excessive intervention in the economy was not conducive to the improvement of carbon emission efficiency.
The industrial structure is positively related to carbon emission efficiency in a non-significant way, implying that industrial structure only improves carbon emission efficiency to a certain extent. There was a significant positive correlation between foreign trade and carbon emission efficiency with a coefficient rate of 0.8143128. This finding is consistent with the study by Zhu and Du et al. in 2013 [97], as well as Wang and Ma’s in 2018 [55]. This result supported that the development of foreign trade can improve China’s carbon emission efficiency.
Foreign capital utilization level plays a positive role in improving carbon emission efficiency, and the result is significant at the 1% level, which implies the Pollution Haven Hypothesis fails in the Chinese context. The results echo the findings by Perkins and Neumayer in 2009 [98], as well as Wang and Ye in 2019 [99], suggesting the Chinese provinces need to take measures to attract more FDI.
The estimated coefficient of the energy intensity is significantly negative (at the 1% level), which is in accord with our assumption that the decline in energy intensity can improve carbon emission efficiency, also consistent with the policy of energy intensity reduction in its Thirteenth Five-Year plan in 2016. The coefficient score of science and technology was significantly positive, indicating that the science and technology development was conducive to the improvement of carbon emission efficiency.
7. Conclusions and Discussions
This paper presented the analysis of regional differences and influencing factors on China’s carbon emission efficiency from 2005 to 2015 by adopting the Modified Undesirable EBM DEA Model and Tobit model. The results showed that (1) most Chinese provinces generally have low carbon emission efficiencies levels. The average value of 30 provinces’ carbon emission efficiency was 0.6277. Only 11 provinces had a higher level than the national average level. Therefore, energy saving and emission reduction in China are still challenging for governments. (2) Significant differences in carbon emission efficiency exist across the three regions in China. The Eastern region ranked the top, with the average efficiency was 0.7816, followed by the Central region (0.5967) and the Western region (0.4964). (3) Northern, Eastern, and Southern coastal regions had a higher level of carbon emission efficiency, followed by Northeast and Middle Yangtze River and Middle Yellow River. The Southwest and Northwest had the lowest level of carbon emission efficiency. (4) In the results from Tobit regression, foreign trade level, foreign capital utilization level, and science and technology level all had significant positive effects on carbon emission efficiency. Government intervention and energy intensity negatively affected the carbon emission efficiency in a significant way. The relationship between industrial structure and carbon emission efficiency had a non-significant positive result. The theoretical contribution of this manuscript is to adopting the Modified Undesirable EBM DEA Model, which is more accurate than traditional methods, such as CCR, BCC or SBM model. Moreover, based on the data’s unit root testing and cointegration, the paper verified the influencing factors of carbon emission efficiency by the Tobit model, which avoids the spurious regression.
Based on the above analysis, we raised several policy implications to improve carbon emission efficiency. When making full use of foreign trade and FDI, governments can reduce the import and export of high-energy and emission products and support the foreign trade of high-tech and environmentally friendly products. The governments can also optimize the energy structure and increase investment in science and technology. The government can adjust industrial structure by promoting the tertiary sector and reduce the development of manufacturing with high pollution and emission. Additionally, governments can promote low carbon industries by providing subsidies or special findings.
As the regions have different carbon emission efficiencies, the local governments should make use of their strengths. The provincial and municipal governments of the eastern provinces should fully tap the potential of energy saving and emission reduction based on their original economic development level. As for the local governments of the central and western provinces, they can make use of their industrial legacies and combine their advantages with the import of foreign capital. In this foreign capital attraction process, the local governments should restrict pollution-intensive industries with environmental regulations, and attract high-tech industries through FDI. The provincial and municipal governments should strengthen the monitoring and supervision of pollutant emissions with improved evaluation system and punishment mechanism for carbon emission efficiency.
However, the limitations of the research remain in the data collection. We calculated the provincial capital stock and CO2 emissions due to lacking data in the provincial statistical yearbook. The accuracy of the research result can be improved if the central and local Statistical Bureau to disclose statistics on the provincial capital stock and CO2 emissions. Future research can analyze various industrial sectors’ carbon emission efficiency in the next study period, which further reflects the regional differences in carbon emission efficiency in various industrial sectors.
Author Contributions
Conceptualization, L.Z.; Methodology, L.Z., H.H. and Y.L.; Software, L.Z.; Validation, H.L.; Formal Analysis, L.Z. and H.L.; Investigation, L.Z. and Y.Z.; Resources, H.H.; Data Curation, L.Z. and Y.L.; Writing – Original Draft Preparation, L.Z. and H.L.; Writing – Review & Editing, L.Z., H.L. and Y.Z.; Visualization, L.Z. and Y.L.; Project Administration, L.Z. and Y.L.
Acknowledgments
The authors are grateful for the supervision and help from Prof. Pengjun Zhao. This research was funded by the NSFC, project No. 41571147. The publication of this article was funded by Freie Universität Berlin.
Conflicts of Interest
The authors declare no conflict of interest.
References
- IPCC. Climate Change 2007: Synthesis Report; Cambridge University Press: Cambridge, UK, 2007. [Google Scholar]
- Edenhofer, O.; Pichs-Madruga, R.; Sokona, Y.; Farahani, E.; Kadner, S.; Kadner, K.; Seyboth, A.; Adler, I.; Baum, S.; Myhre, G.; et al. Climate Change 2014: Mitigation of Climate Change; Working Group III Contribution to the IPCC Fifth Assessment Report; Cambridge University Press: Cambridge, UK, 2015. [Google Scholar]
- BP. Statistical Review of World Energy; BP: London, UK, 2018. [Google Scholar]
- The Global Carbon Project (GCP). Global Carbon Budget 2017. Earth Syst. Sci. Data 2018, 10, 405–448. Available online: https://www.earth-syst-sci-data.net/10/405/2018/ (accessed on 25 July 2019). [CrossRef] [Green Version]
- Xie, L.; Chen, C.L.; Yu, Y.H. Dynamic Assessment of Environmental Efficiency in Chinese Industry: A Multiple DEA Model with a Gini Criterion Approach. Sustainability 2019, 11, 2294. [Google Scholar] [CrossRef]
- Wang, S.; Wang, H.; Zhang, L.; Dang, J. Provincial Carbon Emissions Efficiency and Its Influencing Factors in China. Sustainability 2019, 11, 2355. [Google Scholar] [CrossRef]
- The 13th Five-Year Plan for Economic and Social Development of the People’s Republic of China (2016–2020); The Central Compilation and Translation Bureau: Beijing, China, 2016.
- Meng, Z.S.; Wang, H.A.; Wang, B.N. Empirical Analysis of Carbon Emission Accounting and Influencing Factors of Energy Consumption in China. Int. J. Environ. Res. Public Health 2018, 15, 2467. [Google Scholar] [CrossRef] [PubMed]
- Feng, F.; Peng, L.L. Is There Any Difference in the Effect of Different R and D Sources on Carbon Intensity in China? Sustainability 2019, 11, 1701. [Google Scholar] [CrossRef]
- Wang, Q.W.; Zhou, P.; Shen, N.; Wang, S.S. Measuring Carbon Dioxide Emission Performance in Chinese Provinces: A Parametric Approach. Renew. Sustain. Energy Rev. Dev. 2013, 21, 324–330. [Google Scholar] [CrossRef]
- Chu, X.X.; Geng, H.; Guo, W. How Does Energy Misallocation Affect Carbon Emission Efficiency in China? An Empirical Study Based on the Spatial Econometric Model. Sustainability 2019, 11, 2115. [Google Scholar] [CrossRef]
- Zhong, Y.Y.; Zhong, W.Z. China’s Regional Total Factor Carbon Emission Performance and Influencing Factors Analysis. J. Bus. Econ. 2012, 1, 85–96. [Google Scholar] [CrossRef]
- Wang, M. Key Issues in China’s Development; China Development Press: Beijing, China, 2005.
- Charnes, A.; Cooper, W.W.; Rhodes, E. Measuring the Efficiency of Decision Making Units. Eur. J. Oper. Res. 1978, 2, 429–444. [Google Scholar] [CrossRef]
- Banker, R.D.; Charnes, R.F.; Cooper, W.W. Some Models for Estimating Technical and Scale Inefficiencies in Data Envelopment Analysis. Manag. Sci. 1984, 30, 1078–1092. [Google Scholar] [CrossRef] [Green Version]
- Tone, K. A Slacks-based Measure of Efficiency in Data Envelopment Analysis. Eur. J. Oper. Res. 2001, 130, 498–509. [Google Scholar] [CrossRef]
- Li, Y.; Chiu, Y.H.; Lin, T.Y. The Impact of Economic Growth and Air Pollution on Public Health in 31 Chinese Cities. Int. J. Environ. Res. Public Health 2019, 16, 393. [Google Scholar] [CrossRef]
- Qu, Y.; Yu, Y.; Appolloni, A.; Li, M.; Liu, Y. Measuring Green Growth Efficiency for Chinese Manufacturing Industries. Sustainability 2017, 9, 637. [Google Scholar] [CrossRef]
- Li, Y.; Chiu, Y.H.; Lin, T.Y. Energy and Environmental Efficiency in Different Chinese Regions. Sustainability 2019, 11, 1216. [Google Scholar] [CrossRef]
- Tian, Z.; Ren, F.R.; Xiao, Q.W.; Chiu, Y.H.; Lin, T.Y. Cross-Regional Comparative Study on Carbon Emission Efficiency of China’s Yangtze River Economic Belt Based on the Meta-Frontier. Int. J. Environ. Res. Public Health 2019, 16, 619. [Google Scholar] [CrossRef]
- Yang, L.; Wang, K.L.; Geng, J.C. China’s Regional Ecological Energy Efficiency and Energy Saving and Pollution Abatement Potentials: An Empirical Analysis Using Epsilon-Based Measure Model. J. Clean. Prod. 2018, 194, 300–308. [Google Scholar] [CrossRef]
- Cui, Q.; Li, Y. CNG2020 Strategy and Airline Efficiency: A Network Epsilon-Based Measure with Managerial Disposability. Int. J. Sustain. Transp. 2018, 12, 313–323. [Google Scholar] [CrossRef]
- Tone, K.; Tsutsui, M. An Epsilon-Based Measure of Efficiency in DEA-A Third Pole of Technical Efficiency. European. J. Oper. Res. 2010, 207, 1554–1563. [Google Scholar] [CrossRef]
- Li, Y.; Chiu, Y.H.; Lu, L.C. New Energy Development and Pollution Emissions in China. Int. J. Environ. Res. Public Health 2019, 16, 1764. [Google Scholar] [CrossRef]
- Tobin, J. Estimation of relationships for limited dependent variables. Econometrica 1958, 26, 24–36. Available online: https://search.proquest.com/docview/214674441?OpenUrlRefId=info:xri/sid:baidu&accountid=13151 (accessed on 25 July 2019). [CrossRef]
- Kaya, Y.; Yokobori, K. Global Environment, Energy, and Economic Development; United Nations University: Tokyo, Japan, 1993. [Google Scholar]
- Mielnik, O.; Goldemberg, J. Communication the Evolution of the Carbonization Index in Developing Countries. Energy Policy 1999, 27, 307–308. [Google Scholar] [CrossRef]
- Sun, J.W. The Decrease of CO2 Emission Intensity is Decarbonization at National and Global Levels. Energy Policy 2005, 33, 975–978. [Google Scholar] [CrossRef]
- Li, Z.L. Analysis on Regional Carbon Emission Efficiency Measurement and Influence Factors in China. Master’s Thesis, China University of Mining & Technology, Beijing, China, 2014. [Google Scholar]
- Zofit, J.L.; Prieto, A.M. Environmental Efficiency and Regulatory Standards: The Case of CO2 Emissions from OECD Industries. Resour. Energy Econ. 2001, 23, 63–83. [Google Scholar] [CrossRef]
- Wang, K.; Wei, Y.M.; Zhang, X. A Comparative Analysis of China’s Regional Energy and Emission. Performance: Which is the Better Way to Deal with Undesirable Outputs? Energy Policy 2012, 46, 574–584. [Google Scholar] [CrossRef]
- Zhou, G.; Chung, W.; Zhang, Y. Measuring Energy Efficiency Performance of China’s Transport Sector: A Data Envelopment Analysis Approach. Expert Syst. Appl. 2014, 41, 709–722. [Google Scholar] [CrossRef]
- Yao, X.; Zhou, H.; Zhang, A.; Li, A.J. Regional Energy Efficiency, Carbon Emission Performance and Technology Gaps in China: A Meta-frontier Non-Radial Directional Distance Function Analysis. Energy Policy 2015, 84, 142–154. [Google Scholar] [CrossRef]
- Aigner, D.; Lovell, C.A.K.; Schmidt, P. Formulation and Estimation of Stochastic Frontier Production Function Models. J. Econ. 1977, 6, 21–37. [Google Scholar] [CrossRef]
- Lee, S.; Kim, C. Estimation of Association between Healthcare System Efficiency and Policy Factors for Public Health. Appl. Sci. 2018, 8, 2674. [Google Scholar] [CrossRef]
- Greene, W. Reconsidering heterogeneity in panel data estimators of the stochastic frontier model. J. Econ. 2005, 126, 269–303. [Google Scholar] [CrossRef]
- Cullinane, K.; Song, D.W.; Gray, R. A stochastic frontier model of the efficiency of major container terminals in Asia: Assessing the influence of administrative and ownership structures. Transp. Res. Part A 2002, 36, 743–762. [Google Scholar] [CrossRef]
- Zheng, J.; Zhang, H.Q.; Xing, Z.C. Re-Examining Regional Total-Factor Water Efficiency and Its Determinants in China: A Parametric Distance Function Approach. Water 2018, 10, 1286. [Google Scholar] [CrossRef]
- Cullinane, K.; Wang, T.F.; Song, D.W.; Ji, P. The technical efficiency of container ports: Comparing data envelopment analysis and stochastic frontier analysis. Transp. Res. Part A Policy Pract. 2006, 40, 354–374. [Google Scholar] [CrossRef]
- Wang, S.Q.; Zhou, L.; Wang, H.; Li, X.C. Water Use Efficiency and Its Influencing Factors in China: Based on the Data Envelopment Analysis (DEA)-Tobit Model. Water 2018, 10, 832. [Google Scholar] [CrossRef]
- Chung, Y.H.; Fare, R.; Grosskopf, S. Productivity and Undesirable Outputs: A Directional Distance Function Approach. J. Environ. Manag. 1997, 51, 229–240. [Google Scholar] [CrossRef] [Green Version]
- Wei, M.; Cao, M.F.; Jiang, J.R. Determinants of Long-run Carbon Emission Performance. J. Quant. Tech. Econ. 2010, 9, 43–52+81. Available online: http://en.cnki.com.cn/Article_en/CJFDTOTAL-SLJY201009006.htm (accessed on 25 July 2019).
- Wang, Y.; Duan, F.M.; Ma, X.J.; He, L.C. Carbon Emissions Efficiency in China: Key Facts from Regional and Industrial Sector. J. Clean. Prod. 2019, 206, 850–869. [Google Scholar] [CrossRef]
- Li, K.; Lin, B. Metafroniter Energy Efficiency with CO2 Emissions and its Convergence Analysis for China. Energy Econ. 2015, 48, 230–241. [Google Scholar] [CrossRef]
- Huo, T.; Ren, H.; Cai, W.; Feng, W.; Tang, M.; Zhou, N. The Total-Factor Energy Productivity Growth of China’s Construction Industry: Evidence from the Regional Level. Nat. Hazards 2018, 1–24. [Google Scholar] [CrossRef]
- Wei, Y.G.; Li, Y.; Wu, M.Y.; Li, Y.B. The Decomposition of Total-Factor CO2 Emission Efficiency of 97 Contracting Countries in Paris Agreement. Energy Econ. 2019, 78, 365–378. [Google Scholar] [CrossRef]
- Anselin, L. Spatial Econometrics: Methods and Models; Kluwer Academic Publishers: Dordrecht, The Netherlands, 1988. [Google Scholar]
- Lesage, J.; Pace, R.K. Introduction to Spatial Econometrics; CRC Press: New York, NY, USA, 2009. [Google Scholar]
- Chuai, X.W.; Huang, X.J.; Wang, W.J.; Wen, J.Q.; Chen, Q.; Peng, J.W. Spatial Econometric Analysis of Carbon Emissions from Energy Consumption in China. J. Geogr. Sci. 2012, 22, 630–642. Available online: https://link.springer.com/article/10.1007/s11442-012-0952-z (accessed on 25 July 2019). [CrossRef]
- Ma, D.L.; Chen, Z.C.; Wang, L. Spatial Econometrics Research on Inter-Provincial Carbon Emissions Efficiency in China. Renew. Sustain. Energy Rev. 2015, 25, 67–77. Available online: http://en.cnki.com.cn/Article_en/CJFDTotal-ZGRZ201501010.htm (accessed on 25 July 2019).
- Cheng, Y.Q.; Wang, Z.Y.; Ye, X.Y.; Wei, D. Spatiotemporal Dynamics of Carbon Intensity from Energy Consumption in China. J. Geogr. Sci. 2014, 24, 631–650. Available online: http://en.cnki.com.cn/Article_en/CJFDTotal-ZGDE201404004.htm (accessed on 25 July 2019). [CrossRef]
- Yi, T.; Tong, L.; Qiu, M.H.; Liu, J.P. Analysis of Driving Factors of Photovoltaic Power Generation Efficiency: A Case Study in China. Energies 2019, 12, 355. [Google Scholar] [CrossRef]
- Wang, Y.; Zhao, T.; Wang, J.A.; Guo, F.; Kan, X.; Yuan, R. Spatial Analysis on Carbon Emission Abatement Capacity at Provincial Level in China from 1997 to 2014: An Empirical Study Based on SDM Model. Atmos. Pollut. Res. 2019, 10, 97–104. [Google Scholar] [CrossRef]
- Shi, S.A.; Xia, L.; Meng, M. Energy Efficiency and Its Driving Factors in China’s Three Economic Regions. Sustainability 2017, 9, 2059. [Google Scholar] [CrossRef]
- Wang, S.J.; Ma, Y.Y. Influencing Factors and Regional Discrepancies of the Efficiency of Carbon Dioxide Emissions in Jiangsu, China. Ecol. Indic. 2018, 90, 460–468. [Google Scholar] [CrossRef]
- Gai, M.; Cao, G.Y.; Tian, C.S.; Ke, L.N. Decoupling Analysis of Energy Carbon Emissions and Regional Economic Growth in the Liaoning Coastal Economic Belt. Resour. Sci. 2014, 36, 1267–1277. Available online: http://www.cnki.com.cn/Article/CJFDTOTAL-ZRZY201406020.htm (accessed on 25 July 2019).
- Takakai, F.; Kobayashi, M.; Sato, T.; Yasuda, K.; Kaneta, Y. Effects of Forage Rice Cultivation on Carbon and Greenhouse Gas Balances in a Rice Paddy Field. Atmosphere 2018, 9, 504. [Google Scholar] [CrossRef]
- Goldsmith, R.M. A Perpetual Inventory of National Wealth. Stud. Income Wealth 1951, 14, 5–73. Available online: http://www.nber.org/books/unkn51-2 (accessed on 25 July 2019).
- Zhang, J.; Wu, G.Y.; Zhang, J.P. The Estimation of China’s Provincial Capital Stock: 1952–2000. Econ. Res. J. 2004, 10, 35–44. Available online: http://en.cnki.com.cn/Article_en/CJFDTOTAL-JJYJ200410004.htm (accessed on 25 July 2019).
- Zhao, Z.Y.; Yang, C.F. The Decomposition Analysis on the Driving Factors of China’s Carbon Emission. Chin. Soft Sci. 2012, 6, 175–183. Available online: http://en.cnki.com.cn/Article_en/CJFDTotal-SEJJ201106005.htm (accessed on 25 July 2019).
- Hu, Y.; Liu, J.F.; Hu, W.; Zhang, Z. Regional Variance, Trend Evolution and Factors of China’s Carbon Emission Intensity Based on 30 Provinces (cities and districts)’ 1997–2012 Panel Data. Resour. Dev. Mark. 2016, 18, 7–13. Available online: http://www.en.cnki.com.cn/Article_en/CJFDTotal-ZIYU201605002.htm (accessed on 25 July 2019).
- IPCC. Guidelines for National Greenhouse Gas Inventories; Cambridge University Press (IPCC Secretariat): Cambridge, UK, 2006. [Google Scholar]
- National Development and Reform Commission. Guidelines for Provincial Greenhouse Gas Inventories in China. Available online: http://www.tanjiaoyi.com/article-27200-1.html (accessed on 31 May 2019).
- Liu, J.P.; Ge, H.X.; Wang, Y.R.; Chen, J.Z.; Wang, H. Dynamic Evaluation of Carbon Emission Efficiency in China’s Provinces Based on Cross Efficiency DEA Model. Resour. Dev. Mark. 2017, 33, 1041–1057. Available online: http://www.en.cnki.com.cn/Article_en/CJFDTotal-ZTKB201709004.htm (accessed on July 2019).
- Tang, D.C.; Zhang, Y.; Bethel, B.J. An Analysis of Disparities and Driving Factors of Carbon Emissions in the Yangtze River Economic Belt. Sustainability 2019, 11, 2362. [Google Scholar] [CrossRef]
- Li, Y.M.; Zhang, L.; Cheng, X.L. A Decomposition Model and Reduction Approaches for Carbon Dioxide Emissions in China. Resour. Sci. 2010, 32, 218–222. Available online: http://en.cnki.com.cn/article_en/cjfdtotal-zrzy201002006.htm (accessed on 25 July 2019).
- Zhang, Y.J.; Liu, Z.; Zhang, H.; Tan, T.-D. The impact of Economic Growth, Industrial Structure and Urbanization on Carbon Emission Intensity in China. Nat. Hazards 2014, 73, 579–595. Available online: https://link.springer.com/article/10.1007/s11069-014-1091-x (accessed on 25 July 2019). [CrossRef]
- Cheng, Z.H.; Shi, X.A. Can Industrial Structural Adjustment Improve the Total-Factor Carbon Emission Performance in China? Int. J. Environ. Res. Public Health 2018, 15, 2291. [Google Scholar] [CrossRef]
- Lin, B.Q.; Chen, T.; Li, Y.Q.; Song, H.H.; Ma, Z.X. Research on the Effects of Urbanization on Carbon Emissions Efficiency of Urban Agglomerations in China. J. Clean. Prod. 2018, 197, 1374–1781. [Google Scholar] [CrossRef]
- Wang, S.; Liu, X.; Zhou, C.; Hu, J.; Ou, J. Examining the impacts of socioeconomic factors, urban form, and transportation networks on CO2 emissions in China’s megacities. Appl. Energy 2017, 185, 189–200. [Google Scholar] [CrossRef]
- Mi, Z.; Wei, Y.M.; Wang, B.; Meng, J.; Liu, Z.; Shan, Y.; Liu, J.; Guan, D. Socioeconomic impact assessment of China’s CO2 emissions peak prior to 2030. J. Clean. Prod. 2017, 142, 2227–2236. [Google Scholar] [CrossRef]
- Shui, B.; Harriss, R.C. The Role of CO2 Embodiment in US–China Trade. Energy Policy 2006, 34, 4063–4068. [Google Scholar] [CrossRef]
- Weber, C.L.; Peters, G.P.; Guan, D.; Hubacek, K. The Contribution of Chinese Exports to Climate Change. Energy Policy 2008, 9, 3572–3577. [Google Scholar] [CrossRef]
- Lee, J.W. The Contribution of Foreign Direct Investment to Clean Energy Use, Carbon Emissions and Economic Growth. Energy Policy 2013, 55, 483–489. [Google Scholar] [CrossRef]
- Pazienza, P. The impact of FDI in the OECD manufacturing sector on CO2 emission: Evidence and policy issues. Environ. Impact Assess. Rev. 2019, 77, 66–68. [Google Scholar] [CrossRef]
- Fan, B.; Zhang, Y.; Li, X.Z.; Miao, X. Trade Openness and Carbon Leakage: Empirical Evidence from China’s Industrial Sector. Energies 2019, 12, 1101. [Google Scholar] [CrossRef]
- Zhu, H.; Duan, L.; Guo, Y.; Yu, K. The effects of FDI, economic growth and energy consumption on carbon emissions in ASEAN-5: Evidence from panel quantile regression. Econ. Model. 2016, 58, 237–248. [Google Scholar] [CrossRef] [Green Version]
- Tamazian, A.; Chousa, J.P.; Vadlamannati, K.C. Does higher economic and financial development lead to environmental degradation: Evidence from BRIC countries. Energy Policy 2009, 37, 246–253. [Google Scholar] [CrossRef]
- Arik, L.; Taylor, M.S. Unmasking the Pollution Haven Effect. Int. Econ. Rev. 2008, 49, 223–254. [Google Scholar] [CrossRef]
- Zhou, Y.; Fu, J.T.; Kong, Y.; Wu, R. How Foreign Direct Investment Influences Carbon Emissions, Based on the Empirical Analysis of Chinese Urban Data. Sustainability 2018, 10, 2163. [Google Scholar] [CrossRef]
- Liu, N.; Ma, Z.J.; Kang, J.D. Changes in Carbon Intensity in China’s Industrial Sector: Decomposition and Attribution Analysis. Energy Policy 2015, 87, 28–38. [Google Scholar] [CrossRef]
- Fan, F.Y.; Lei, Y.L. Decomposition Analysis of Energy-Related Carbon Emissions from the Transportation Sector in Beijing. Transp. Res. Part D Transp. Environ. 2016, 42, 135–145. [Google Scholar] [CrossRef]
- Shuai, C.Y.; Chen, X.; Wu, Y. Identifying the key Impact Factors of Carbon Emission in China. Results from a Largely Expanded Pool of Potential Impact Factors. J. Clean. Prod. 2018, 175, 612–623. [Google Scholar] [CrossRef]
- Meng, B.; Xue, J.; Feng, K.; Guan, D.; Fu, X. China’s inter-regional spillover of carbon emissions and domestic supply chains. Energy Policy 2013, 61, 1305–1321. [Google Scholar] [CrossRef]
- Fan, T.; Luo, R.; Fan, Y.; Zhang, L.; Chang, X. Study on Influence Factors for carbon Dioxide Emissions in China’s Chemical Industry with LMDI Method. China Soft Sci. 2013, 3, 166–174. Available online: http://en.cnki.com.cn/Article_en/CJFDTotal-ZGRK201303016.htm (accessed on 25 July 2019).
- Zhang, P.Y.; He, J.J.; Hong, X.; Zhang, W.; Qin, C.Z.; Pang, B.; Li, Y.Y.; Liu, Y. Regional-Level Carbon Emissions Modelling and Scenario Analysis: A STIRPAT Case Study in Henan Province, China. Sustainability 2017, 9, 2342. [Google Scholar] [CrossRef]
- Zhu, C.Z.; Gao, D.W. A Research on the Factors Influencing Carbon Emission of Transportation Industry in “the Belt and Road Initiative” Countries Based on Panel Data. Energies 2019, 12, 2405. [Google Scholar] [CrossRef]
- Liu, W.D.; Xu, X.M.; Niu, D.X. Research on the Impact of Technology Import and Technology Innovation on the Peak of Carbon Emissions in China. Technol. Econ. Manag. Res. 2016, 9, 3–9. Available online: http://www.en.cnki.com.cn/Article_en/CJFDTOTAL-JXJG201609001.htm (accessed on 25 July 2019).
- Liu, S.; Xia, X.H.; Chen, X.Y. Assessing Urban Carbon Emission Efficiency in China: Based on the Global Data Envelopment Analysis. Energy Procedia 2018, 152, 762–767. [Google Scholar] [CrossRef]
- Gu, A.; Zhang, Y.; Pan, B.L. Relationship between Industrial Water Use and Economic Growth in China: Insights from an Environmental Kuznets Curve. Water 2017, 9, 556. [Google Scholar] [CrossRef]
- Levin, A.; Lin, C.; Chu, C. Unit Root Tests in Panel Data: Asymptotic and Finite Sample Properties. J. Econom. 2002, 108, 1–24. Available online: https://www.sciencedirect.com/science/article/pii/S0304407601000987 (accessed on 25 July 2019). [CrossRef]
- Im, K.S.; Pesaran, M.H.; Shin, Y.C. Testing for Unit Roots in Heterogeneous Panels. J. Econ. 2003, 115, 53–74. [Google Scholar] [CrossRef]
- Dickey, D.A.; Fuller, W.A. Distribution of the Estimators for Autoregressive Time Series with A Unit Root. J. Am. Stat. Assoc. 1979, 366, 427–431. [Google Scholar] [CrossRef]
- Phillips, P.C.B.; Perron, P. Testing for A Unit Root in Time Series Regression. Biometrika 1988, 75, 335–346. [Google Scholar] [CrossRef]
- Pedroni, P. Critical Values for Cointegration Tests in Het-erogeneous Panels with Multiple Regressors. Oxf. Bull. Econ. Stat. 1999, 61, 653–670. Available online: https://www.scirp.org/reference/ReferencesPapers.aspx?ReferenceID=2340557 (accessed on 25 July 2019). [CrossRef]
- Du, K.; Zou, C.Y. Regional Disparity, Affecting Factors and Convergence Analysis of Carbon Dioxide Emission Efficiency in China: On Stochastic Frontier Model and Panel Unit Root. Zhejiang Soc. Sci. 2011, 11, 32–43+156. Available online: http://en.cnki.com.cn/Article_en/CJFDTotal-ZJSH201111007.htm (accessed on 25 July 2019).
- Zhu, D.J.; Du, K.R. Foreign Trade, Economic Growth and the Efficiency of Carbon Emission in China. J. Shanxi Financ. Econ. Univ. 2013, 35, 1–11. Available online: http://en.cnki.com.cn/Article_en/CJFDTOTAL-SXCJ201305000.htm (accessed on 25 July 2019).
- Perkins, R.; Neumayer, E. Transnational Linkages and the Spillover of Environment-Efficiency into Developing Countries. Glob. Environ. Chang. 2009, 19, 375–383. [Google Scholar] [CrossRef]
- Wang, Z.X.; Ye, D.J.; Zheng, H.H.; Lv, C.Y. The Influence of Market Reform on the CO2 Emission Efficiency of China. J. Clean. Prod. 2019, 225, 236–247. [Google Scholar] [CrossRef]
Figure 1.
The schematic diagram of carbon emission efficiency intervals in 30 provinces of China.

Figure 2.
Carbon emission efficiency in China’s three major economic zones.

Figure 3.
The schematic diagram of the eight economic zones of China.


Table 1.
The carbon emission factors of various types of fossil fuels.
| Fuel Type | Coal | Coke | Gasoline | Kerosene | Diesel | Fuel Oil | Natural Gas |
|---|---|---|---|---|---|---|---|
| ALCV (kj/kg) | 20,908 | 28,435 | 43,070 | 43,070 | 42,652 | 41,816 | 38,931 |
| CCF (kg/Tj) | 95,333 | 107,000 | 70,000 | 71,500 | 74,100 | 77,400 | 56,100 |
| COF(%) | 92.30 | 92.80 | 98.60 | 98.00 | 98.20 | 98.50 | 99.00 |
Table 2.
Carbon emission efficiency measurement index system.
| Indicator Type | Primary Indicators | Secondary Indicators |
|---|---|---|
| Input indicator | Capital | Capital stock (unit: 100 million yuan) |
| Labor | Total number of employees in three industries (unit: 10,000) | |
| Energy | Total energy consumption (unit: 10,000 tons of standard coal) | |
| Output indicator | Desired outcomes | GDP (unit: 100 million yuan) |
| Undesired outcomes | CO2 (emissions unit: 104 tons) |
Table 3.
Carbon emission efficiency of 30 provinces in China from 2005 to 2015.
| Regions | 2005 | 2006 | 2007 | 2008 | 2009 | 2010 |
| Beijing | 1 | 1 | 1 | 1 | 1 | 1 |
| Tianjing | 0.8580 | 0.8276 | 0.8165 | 0.8083 | 0.7897 | 0.8050 |
| Hebei | 0.6260 | 0.5545 | 0.5517 | 0.5337 | 0.5415 | 0.5603 |
| Shanxi | 0.5719 | 0.4794 | 0.4806 | 0.4601 | 0.4598 | 0.4779 |
| Inner Mongoria | 0.4858 | 0.4605 | 0.4672 | 0.4620 | 0.4814 | 0.4984 |
| Liaoning | 0.6123 | 0.5778 | 0.5754 | 0.5572 | 0.5723 | 0.6046 |
| Jilin | 0.6085 | 0.5731 | 0.5716 | 0.5452 | 0.5433 | 0.5535 |
| Heilongjiang | 1 | 1 | 0.6864 | 0.6563 | 0.6715 | 0.6919 |
| Shanghai | 1 | 1 | 1 | 1 | 1 | 1 |
| Jiangsu | 0.8052 | 0.7765 | 0.7710 | 0.7304 | 0.7319 | 0.7546 |
| Zhejiang | 0.8400 | 0.8029 | 0.7874 | 0.7423 | 0.7319 | 0.7622 |
| Anhui | 0.6770 | 0.6056 | 0.5962 | 0.5601 | 0.5706 | 0.6024 |
| Fujian | 0.8219 | 0.8044 | 0.7919 | 0.7459 | 0.7278 | 0.7585 |
| Jiangxi | 0.6771 | 0.6282 | 0.6195 | 0.5953 | 0.6026 | 0.6220 |
| Shandong | 0.6444 | 0.6208 | 0.6235 | 0.6001 | 0.6118 | 0.6368 |
| Henan | 0.6553 | 0.5852 | 0.5763 | 0.5504 | 0.5511 | 0.5567 |
| Hubei | 0.6484 | 0.5766 | 0.5726 | 0.5622 | 0.5852 | 0.6069 |
| Hunan | 0.7000 | 0.6077 | 0.6006 | 0.5779 | 0.6019 | 0.6287 |
| Guangdong | 1 | 1 | 1 | 1 | 1 | 1 |
| Guangxi | 0.6613 | 0.6081 | 0.5975 | 0.5725 | 0.5704 | 0.5569 |
| Hainan | 0.8204 | 0.7686 | 0.7502 | 0.6841 | 0.6761 | 0.6974 |
| Chongqing | 0.5854 | 0.5670 | 0.5732 | 0.5586 | 0.5835 | 0.6178 |
| Sichuan | 0.6362 | 0.5655 | 0.5582 | 0.5243 | 0.5494 | 0.5835 |
| Guizhou | 0.4972 | 0.4089 | 0.4082 | 0.3868 | 0.4142 | 0.4466 |
| Yunnan | 0.5873 | 0.5052 | 0.5011 | 0.4786 | 0.4940 | 0.5027 |
| Shaanxi | 0.5993 | 0.5480 | 0.5409 | 0.5290 | 0.5323 | 0.5355 |
| Gansu | 0.5664 | 0.4806 | 0.4731 | 0.4477 | 0.4767 | 0.4989 |
| Qinghai | 0.4256 | 0.3845 | 0.3809 | 0.3790 | 0.3951 | 0.4160 |
| Ningxia | 0.3693 | 0.3311 | 0.3308 | 0.3260 | 0.3386 | 0.3469 |
| Xinjiang | 0.5726 | 0.5192 | 0.5147 | 0.4922 | 0.5005 | 0.5093 |
| East | 0.8207 | 0.7939 | 0.7880 | 0.7638 | 0.7621 | 0.7799 |
| Central | 0.6923 | 0.5944 | 0.5880 | 0.5634 | 0.5732 | 0.5925 |
| West | 0.5442 | 0.4890 | 0.4860 | 0.4688 | 0.4851 | 0.5011 |
| China | 0.6851 | 0.6289 | 0.6239 | 0.6022 | 0.6102 | 0.6277 |
| Regions | 2011 | 2012 | 2013 | 2014 | 2015 | mean |
| Beijing | 1 | 1 | 1 | 1 | 1 | 1 |
| Tianjing | 0.8087 | 0.8000 | 1 | 1 | 1 | 0.8649 |
| Hebei | 0.5603 | 0.5382 | 0.5798 | 0.5586 | 0.5424 | 0.5588 |
| Shanxi | 0.4802 | 0.4593 | 0.4966 | 0.4662 | 0.4388 | 0.4792 |
| Inner Mongoria | 0.4883 | 0.4595 | 0.5063 | 0.4819 | 0.4820 | 0.4794 |
| Liaoning | 0.6010 | 0.5680 | 0.6081 | 0.5759 | 0.5701 | 0.5839 |
| Jilin | 0.5435 | 0.5301 | 0.5561 | 0.5343 | 0.5255 | 0.5532 |
| Heilongjiang | 0.6986 | 0.6601 | 0.7093 | 0.6697 | 0.6368 | 0.7073 |
| Shanghai | 1 | 1 | 1 | 1 | 1 | 1 |
| Jiangsu | 0.7330 | 0.7153 | 0.7750 | 0.7736 | 0.7674 | 0.7576 |
| Zhejiang | 0.7442 | 0.7295 | 0.7812 | 0.7761 | 0.7650 | 0.7693 |
| Anhui | 0.6139 | 0.5903 | 0.6330 | 0.6256 | 0.6018 | 0.6070 |
| Fujian | 0.7281 | 0.7029 | 0.7603 | 0.7390 | 0.7198 | 0.7546 |
| Jiangxi | 0.6264 | 0.6109 | 0.6444 | 0.6458 | 0.6302 | 0.6275 |
| Shandong | 0.6397 | 0.6138 | 0.6782 | 0.6527 | 0.6350 | 0.6324 |
| Henan | 0.5528 | 0.5414 | 0.5619 | 0.5407 | 0.5243 | 0.5633 |
| Hubei | 0.6153 | 0.5970 | 0.6525 | 0.6353 | 0.6178 | 0.6063 |
| Hunan | 0.6386 | 0.6200 | 0.6654 | 0.6523 | 0.6337 | 0.6297 |
| Guangdong | 1 | 1 | 1 | 1 | 1 | 1 |
| Guangxi | 0.5397 | 0.5117 | 0.5327 | 0.5195 | 0.5077 | 0.5616 |
| Hainan | 0.6644 | 0.6078 | 0.6229 | 0.5868 | 0.5600 | 0.6762 |
| Chongqing | 0.6405 | 0.6290 | 0.7162 | 0.6967 | 0.6913 | 0.6236 |
| Sichuan | 0.6162 | 0.6067 | 0.6528 | 0.6438 | 0.6328 | 0.5972 |
| Guizhou | 0.4655 | 0.4451 | 0.4845 | 0.4717 | 0.4447 | 0.4430 |
| Yunnan | 0.5013 | 0.4750 | 0.5008 | 0.4775 | 0.4559 | 0.4981 |
| Shaanxi | 0.5367 | 0.5156 | 0.5468 | 0.5237 | 0.5192 | 0.5388 |
| Gansu | 0.5112 | 0.4952 | 0.5381 | 0.5266 | 0.5033 | 0.5016 |
| Qinghai | 0.4163 | 0.3889 | 0.3923 | 0.3582 | 0.3352 | 0.3884 |
| Ningxia | 0.3430 | 0.3284 | 0.3478 | 0.3203 | 0.2973 | 0.3345 |
| Xinjiang | 0.5035 | 0.4655 | 0.4852 | 0.4478 | 0.4218 | 0.4938 |
| East | 0.7709 | 0.7523 | 0.8005 | 0.7875 | 0.7782 | 0.7816 |
| Central | 0.5962 | 0.5761 | 0.6149 | 0.5962 | 0.5761 | 0.5967 |
| West | 0.5057 | 0.4837 | 0.5185 | 0.4971 | 0.4810 | 0.4964 |
| China | 0.6270 | 0.6068 | 0.6476 | 0.6300 | 0.6153 | 0.6277 |
Table 4.
Carbon emission efficiency in the Chinese eight regions.
| Regions | Provinces | Value | Regions | Provinces | Value |
|---|---|---|---|---|---|
| Northern coast | Beijing | 1 | Middle Yellow River | Shanxi | 0.4792 |
| Tianjin | 0.8649 | Inner Mongolia | 0.4794 | ||
| Hebei | 0.5588 | ||||
| Shandong | 0.6324 | Henan | 0.5633 | ||
| mean | 0.7640 | Shaanxi | 0.5388 | ||
| Mean | 0.5152 | ||||
| Eastern coast | Shanghai | 1 | Middle Yangtze River | Anhui | 0.6070 |
| Jiangsu | 0.7576 | Jiangxi | 0.6275 | ||
| Zhejiang | 0.7693 | Hubei | 0.6063 | ||
| mean | 0.8423 | Hunan | 0.6297 | ||
| Mean | 0.6176 | ||||
| Southern coast | Fujian | 0.7546 | Southwest | Guangxi | 0.5616 |
| Guangdong | 1 | Chongqing | 0.6236 | ||
| Hainan | 0.6762 | Sichuan | 0.5972 | ||
| mean | 0.8103 | Guizhou | 0.4430 | ||
| Yunnan | 0.4981 | ||||
| Mean | 0.5447 | ||||
| Northeast | Liaoning | 0.5839 | Northwest | Ningxia | 0.5016 |
| Jilin | 0.5532 | Gansu | 0.3884 | ||
| Heilongjiang | 0.7073 | Qinghai | 0.3345 | ||
| mean | 0.6148 | Xinjiang | 0.4938 | ||
| Mean | 0.4296 |
Table 5.
Influencing factors.
| Explanatory Variable | Variables’ Definition and Unit | Prejudgment | Key References |
|---|---|---|---|
| Government intervention in the economy (GIE) | The proportion of the local financial expenditure to GDP (%) | Unknown | [6,11] |
| Industrial structure (IS) | The proportion of the local added value of the tertiary industry to GDP (%) | Positive | [66,67,68,69,70,71] |
| Foreign trade level (FTL) | The proportion of the local import and export trade to GDP (%) | Unknown | [11,72,73] |
| Foreign capital utilization level (FCUL) | The proportion of the local foreign direct investment to GDP (%) | Unknown | [74,75,76,77,78,79,80] |
| Energy intensity (EI) | 10,000 yuan GDP standard coal consumption (yuan/tons of standard coal) | Negative | [81,82,83,84,85] |
| Science and technology level (STL) | The proportion of the local R&D expenditure to GDP (%) | Positive | [11,53,86,87,88,89] |
Table 6.
Panel unit root test results.
| LLC | IPS | Fisher-ADF | PP-ADF | |
|---|---|---|---|---|
| CEE | −13.9912 *** | −8.15403 *** | 155.223 *** | 202.149 *** |
| GIE | −1.15188 | 4.99367 | 20.0210 | 36.1092 |
| IS | 6.28823 | 7.88391 | 21.5548 | 19.3982 |
| FTL | −2.48395 *** | 1.40910 | 41.2505 | 44.3308 |
| FCUL | −7.04262 *** | −2.20561 ** | 88.6931 *** | 150.166 *** |
| EI | −2.24391 *** | 4.94331 | 26.1251 | 37.3777 |
| STL | −2.86846 *** | 1.52624 | 48.4451 | 77.5646 * |
| △CEE | −19.0895 *** | −11.2225 *** | 221.242 *** | 371.516 *** |
| △GIE | −11.0323 *** | −6.73075 *** | 155.873 *** | 190.270 *** |
| △IS | −5.75004 *** | −1.35639 * | 78.7522 * | 101.827 *** |
| △FTL | −12.2580 *** | −5.97896 *** | 150.454 *** | 208.309 *** |
| △FCUL | −11.9671 *** | −5.06193 *** | 133.507 *** | 156.930 *** |
| △EI | −15.1595 *** | −9.84822 *** | 205.206 *** | 242.850 *** |
| △STL | −14.9755 *** | −8.24486 *** | 187.069 *** | 244.140 *** |
Note: ***, **, * representing variables significant at 1%, 5%, and 10%, respectively.
Table 7.
Panel cointegration test results.
| Panel-V-Stat | Panel-Rho-Stat | Panel-PP-Stat | Panel-ADF-Stat | |
|---|---|---|---|---|
| within-dimension | −1694.92 | 4.901894 | −15.11433 *** | −2.657887 *** |
| between-dimension | 7.692484 | −22.66525 *** | −2.098071 *** |
Note: *** representing variables significant at 1%, respectively.
Table 8.
Tobit regression results.
| Variable | Coefficient | Std. Err. | Z-Statistic | P > |z| | [95% Conf. Interval] | |
|---|---|---|---|---|---|---|
| DGI | −0.461083 *** | 0.0585006 | −7.88 | 0.000 | −0.5757416 | −0.3464233 |
| IS | 0.0076522 | 0.0836948 | 0.09 | 0.927 | −0.1563865 | 0.171691 |
| FTL | 0.0881033 *** | 0.0230223 | 3.83 | 0.000 | 0.0429804 | 0.1332263 |
| FCUL | 0.8143128 *** | 0.236718 | 3.44 | 0.000 | 0.350354 | 6.832712 |
| EI | −0.043391 *** | 0.0110785 | −3.92 | 0.003 | −0.0651047 | −0.0216776 |
| STL | 4.95859 *** | 0.9562014 | 5.19 | 0.003 | 3.084472 | 6.629005 |
Note: *** representing variables significant at 1%, respectively.
© 2019 by the authors. Licensee MDPI, Basel, Switzerland. This article is an open access article distributed under the terms and conditions of the Creative Commons Attribution (CC BY) license (http://creativecommons.org/licenses/by/4.0/).
Share and Cite
MDPI and ACS Style
Zeng, L.; Lu, H.; Liu, Y.; Zhou, Y.; Hu, H. Analysis of Regional Differences and Influencing Factors on China’s Carbon Emission Efficiency in 2005–2015. Energies 2019, 12, 3081. https://doi.org/10.3390/en12163081
AMA Style
Zeng L, Lu H, Liu Y, Zhou Y, Hu H. Analysis of Regional Differences and Influencing Factors on China’s Carbon Emission Efficiency in 2005–2015. Energies. 2019; 12(16):3081. https://doi.org/10.3390/en12163081
Chicago/Turabian StyleZeng, Liangen, Haiyan Lu, Yenping Liu, Yang Zhou, and Haoyu Hu. 2019. "Analysis of Regional Differences and Influencing Factors on China’s Carbon Emission Efficiency in 2005–2015" Energies 12, no. 16: 3081. https://doi.org/10.3390/en12163081
Note that from the first issue of 2016, this journal uses article numbers instead of page numbers. See further details here.