
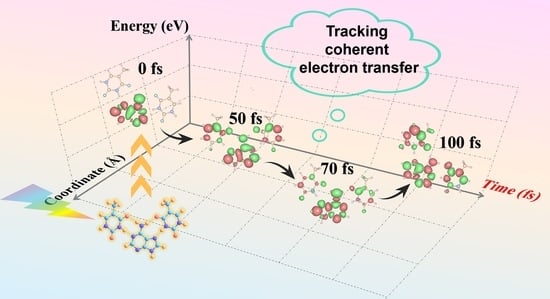
Short-Range Charge Transfer in DNA Base Triplets: Real-Time Tracking of Coherent Fluctuation Electron Transfer

Institute of Atomic and Molecular Physics, Jilin University, Changchun 130012, China
*
Author to whom correspondence should be addressed.
Molecules 2023, 28(19), 6802; https://doi.org/10.3390/molecules28196802
Submission received: 25 August 2023
/
Revised: 19 September 2023
/
Accepted: 22 September 2023
/
Published: 25 September 2023
(This article belongs to the Special Issue Theoretical Study on Luminescent Properties of Organic Materials)
Abstract
:The short-range charge transfer of DNA base triplets has wide application prospects in bioelectronic devices for identifying DNA bases and clinical diagnostics, and the key to its development is to understand the mechanisms of short-range electron dynamics. However, tracing how electrons are transferred during the short-range charge transfer of DNA base triplets remains a great challenge. Here, by means of ab initio molecular dynamics and Ehrenfest dynamics, the nuclear–electron interaction in the thymine-adenine-thymine (TAT) charge transfer process is successfully simulated. The results show that the electron transfer of TAT has an oscillating phenomenon with a period of 10 fs. The charge density difference proves that the charge transfer proportion is as high as 59.817% at 50 fs. The peak position of the hydrogen bond fluctuates regularly between −0.040 and −0.056. The time-dependent Marcus–Levich–Jortner theory proves that the vibrational coupling between nucleus and electron induces coherent electron transfer in TAT. This work provides a real-time demonstration of the short-range coherent electron transfer of DNA base triplets and establishes a theoretical basis for the design and development of novel biological probe molecules.
1. Introduction
The photoinduced short-range electron transfer of DNA base triplets plays an important role in clinical diagnosis, in the identification of biological bases, and in gene replication and mutation [1,2,3,4,5]. There is increasing research focused on exploring the mechanism of short-range electron transfer [6,7,8]. The short-range coherent superexchange charge transfer proposed by Giese et al. can perfectly explain the continuous electron transfer process of DNA base triplets [9]. Subsequently, it has been reported that the sustained electron transfer in DNA base triplets consists of a series of short-range tunneling processes [10]. It follows that tracking the electron moving of the DNA base triplets is absolutely helpful for understanding the short-range electron transfer.
Thymine-adenine-thymine (TAT) is a representative base triplet, which consists of one charge donor and two charge acceptors [11,12,13,14,15,16]. Adenine (A) is oxidized and can be used as a hole carrier, while thymine (T) is reduced and regarded as an electron carrier [17,18]. T and A form a dimer through the Watson–Crick structure, and the third base T is parallel to A and connected by hydrogen bonds to form a stable base triplet structure [19,20,21,22]. At present, the charge transfer of TAT base triplets at short-range is thought to be caused by superexchange [23,24]. When superexchange predominates over charge transfer, the hole directly tunnels from the donor to the acceptor using the base pairs as virtual states [25]. Renaud et al. simulated charge transfer with less than seven AT base pairs, demonstrating that hole migration does, indeed, occur through a superexchange mechanism [26]. Until now, the subject of TAT short-range charge transfer research has concentrated on the hole migration. It is worth noting that short-range electron transfer also plays an irreplaceable role in gene replication and mutation. When a DNA strand contains fewer than four or five bases, the charge transfer process can be considered short-range [27]. However, few reports have been made about how electrons are transferred in the short-range charge transfer of a TAT base triplet, which prevents the further exploration of the basic mechanism of genetic information. It is not conducive to the application of the biological electronic devices that recognize DNA bases in clinical diagnosis.
Here, the nuclear–electron interaction during short-range electron transfer at TAT is simulated using ab initio molecular dynamics in conjunction with Ehrenfest dynamics. It is discovered that the electron transfer of TAT exhibits a distinct periodic vibration behavior with a duration of 10 fs. The time-dependent Kohn–Sham eigenvalues, N-H bond vibration, and hydrogen bond strength are calculated with time. The evolution processes of charge density differences, transition density matrix, and hole–electron distribution at critical time points are presented. In addition to classifying the localized excitation and charge transfer excitation, the hole–electron separation degree and overlap degree are quantified. Moreover, the calculated real-time Marcus–Levich–Jortner theory gives the free energy and reorganization energy at different times. The results demonstrate that the strong vibrational nucleus–electron coupling causes the coherent migration of the electron in the TAT base triplet. The findings add to the investigation of the coherent effects in related biological systems and offer a beneficial comprehension of the coherent electron transfer dynamics of DNA base triplets.
The current work mainly focuses on exploring the long-range hole transfer process of DNA base triplets, but the electron transfer process under short-range conditions is rarely reported. The aim of this study is to explore the physical mechanism of short-range charge transfer in TAT base triplets. It is revealed that the nuclear–electron vibronic coupling induces the coherence of the short-range charge transfer of TAT base triplets.
The paper is organized as follows. In the next section, we show the trend of molecular orbital energy over time and quantify the distribution of electrons and holes. The Marcus–Levich–Jortner theory is applied to reveal the mechanism of TAT short-range electron transfer. The third section summarizes the content of the paper, and the last section describes the calculation method in detail.
2. Results and Discussion
2.1. Photoinduced Charge Transfer
The structure of TAT is displayed in Figure 1a. To more faithfully simulate the electron transfer dynamics of TAT, we fixed N4, N12, and N25. Such fixing can prevent complicated translational damage to the equilibrium position as well as maintain the relative distance between the donor and acceptor. Similar research has demonstrated that, if fixed methods are not employed, the electron transfer process will be impeded [28]. Various functionals and basis sets are selected to ensure the accuracy of the simulation. Table S3 shows that the TAT absorption peak calculated by B3LYP/TZVP level is in good agreement with the experimental results (260 nm) [29,30]. The absorption spectrum of the TAT base triplet is shown in Figure 1b. It is proved that the molecular structure is simulated, and that the functional and basis set selected are reasonable and effective. The frontier molecular orbitals provide a very clear view of the distribution of charge in different molecular orbitals [31,32]. Figure 1c reveals the molecular orbitals involved in the photoinduced charge transfer process of TAT. Upon excitation, the electron on donor (A) begins to change the occupied orbitals. The HOMO distribution decreases, the LUMO distribution increases, the LUMO + 1 distribution increases, and, eventually, the charge relocates in the LUMO + 2 orbital. The HOMO at A drops to 0 and the LUMO, LUMO + 1 at T1 and T2 increase to 1, indicating that TAT is locally excited. When the Franck–Condon region is in transient excitation, the system begins to move towards a more desirable geometry. So the change in molecular orbitals from LUMO, LUMO + 1 and LUMO + 2 may be related to electron transfer.
The evolution of orbital energy over time can clearly clarify the whole process of coherent electron transfer [33,34,35,36,37]. Figure 1d is a schematic diagram of the time evolution of the orbital energy of TAT. At the beginning of electron transfer, the part far away from Franck-Condon region will undergo a rapid relaxation process. So that the orbital energies of LUMO + 1 and LUMO are closer to each other, which corresponds to the occurrence of nuclear motion. As the orbital energy approaches, the orbital energies oscillate regularly over time, with a period of about 10 fs. The vibrational nuclear–electron coupling makes the orbital energy change periodically, which leads to the occurrence of coherent electron transfer in TAT. The electron coupling strength () changes in response to nuclear motion. The and the distance between the donor and the acceptor () are closely related. The specific relationship is as follows: and form an e-exponential relationship, which can be obtained using the Marcus theoretical formula [38]:
where β marks the exponential decay constant. The change in over time is displayed in Figure 1e. Obviously, the decreasing distance of proves that the nuclear–electron coupling strength increases regularly with time. It suggests that there is a strong coupling between the nucleus and the electron of the TAT base triplet. In addition, it is worth noting that the distance of AT1 is significantly smaller than that of AT2, which is caused by the asymmetry of the TAT structure. In order to determine which type of bond vibration coupling promotes coherent electron transfer, infrared vibrational spectra are plotted, as shown in Figure S2. It is found that the bonds located around 3000 cm−1 move periodically with time, and these bonds belong to the N-H bonds near the hydrogen bond grid.
Figure 1f plots the electronegativity variation trend of atoms near the hydrogen bond grid. At 0 fs, the electronegativity of N10 is greater than that of N15 and N21, indicating that the donor (A) has the strongest ability to attract electrons and the charge is completely distributed on the donor (A). At 9 fs, the electronegativity of N15 and N21 increases, stating that the acceptor (T1, T2) has a stronger ability to attract electrons, and there is an obvious charge distribution on the acceptor. The electronegativity of 40 fs is similar to that of 9 fs, but the electronegativity of N21 is slightly larger than that of N15, manifesting that the charge distribution on T2 is larger than that on T1. At 50 fs, the electronegativity of N10 is smaller, while the electronegativity of N15 and N21 is basically equal, and both show a trend of increasing. This means that the distribution of charge on the donor (A) decreases, and the distribution of charge on the acceptor (T1, T2) is increased and uniform. In short, in the period from 0 fs to 100 fs, the electronegativity values of N10, N15, and N21 atoms all show regular oscillations with a period of about 10 fs.
2.2. Reduced Density Gradient
Regular changes in electronegativity will inevitably lead to change in the strength of the hydrogen bond. The evolution of the reduced density gradient (RDG) of electron density with time is an intuitive way of showing the change in hydrogen bond strength [39,40]. The hydrogen bond strengths of the TAT base triplet at different times are depicted in Figure 2 and the oscillating process of the N-H bonds near the hydrogen bond grid are observed in Figure S3. Blue represents the weak hydrogen bond interaction. Red denotes steric hindrance. The values around green represent van der Waals forces. It is observed that the hydrogen bond peak is at −0.041 at 0 fs. From 3 fs to 9 fs, the peak position of the hydrogen bond shifts from −0.042 to −0.039, and the corresponding hydrogen bond is stretched. From 22 fs to 40 fs, the system has a peak position from −0.037 to −0.045. The strengthening of the hydrogen bond corresponds to the compression of bonds such as N21-H40 and N10-H39. The hydrogen bond peak of 50 fs is again shifted to the right to −0.040. This denotes that the hydrogen bond strength decreases and the corresponding N15-H29 and N10-H38 are in a tensile state. From 70 fs to 90 fs, the hydrogen bond strength increases again, and the position of the peak corresponds to a left shift from −0.043 to −0.056. The peak position stabilized at about −0.05 at 100 fs. During 0–100 fs, the peak position of the hydrogen bond fluctuates regularly between −0.040 and −0.056. The periodic changes in hydrogen bond strength and bond length once again confirm that the charge transfer of TAT base triplets is coherent.
2.3. Charge Density Difference Analysis
To quantify the dynamic coherent charge transfer, we visualize the charge density difference (CDD) using a three-dimensional real space analysis method. Figure 3 and Movie S1 describe the time-dependent distribution of the coherent charge of TAT, and the specific proportion of charge transfer is shown in Table S4. The decreasing regions of CDD belong to photoinduced holes and are shown in green. The regions of increased CDD correspond to coherent electron transfer and are represented in red. The charge is completely concentrated on donor A at 0 fs. The electron is gradually transferred to the acceptor T1 at 3 fs, marking the start of coherent electron transfer. From 3 to 9 fs, more charge is being transferred from A to T1 and T2. It is worth noting that the charge distributions at T1 and T2 are very similar and uniform, indicating that the coherent electron transfer of TAT is synergistic rather than competitive. At this point, the charge transfer proportion increases to 25.102%. The charge is almost all concentrated on A at 22 fs, which proves that a new cycle has entered at this time. At 40 fs, the charge is gradually transferring from the donor to the acceptor, but the charge distribution at T1 is more than that at T2. This expresses that the distribution of the charge at the acceptor is not simultaneous. At 50 fs, more charge is found at T1 and T2, which attests to the fact that coherent charge transfer is already near the end of a cycle. The corresponding charge transfer proportion is the largest at 59.817%. At 70 fs, the charge of A increases and the charge of T1 and T2 decrease again. However, at 90 fs, most of the charge is transferred to T1 and T2 again, and the charge transfer proportion is at 27.363%. At 100 fs, the charge coexists at the donor and acceptor, and the charge distribution is widest at the acceptor. Over time, the charge delocalizes between the donor and acceptor. The oscillation time of Figure 1d,f is compatible with the periodic change in CDD. Furthermore, we notice that the charge is distributed around the heavy atoms during the entire periodic oscillation from 0 fs to 100 fs (Supplementary Materials). Therefore, a better grasp of the microscopic mechanism of coherent charge transfer can be gained by visualizing the charge distribution around heavy atoms.
2.4. Transition Density Matrix Analysis
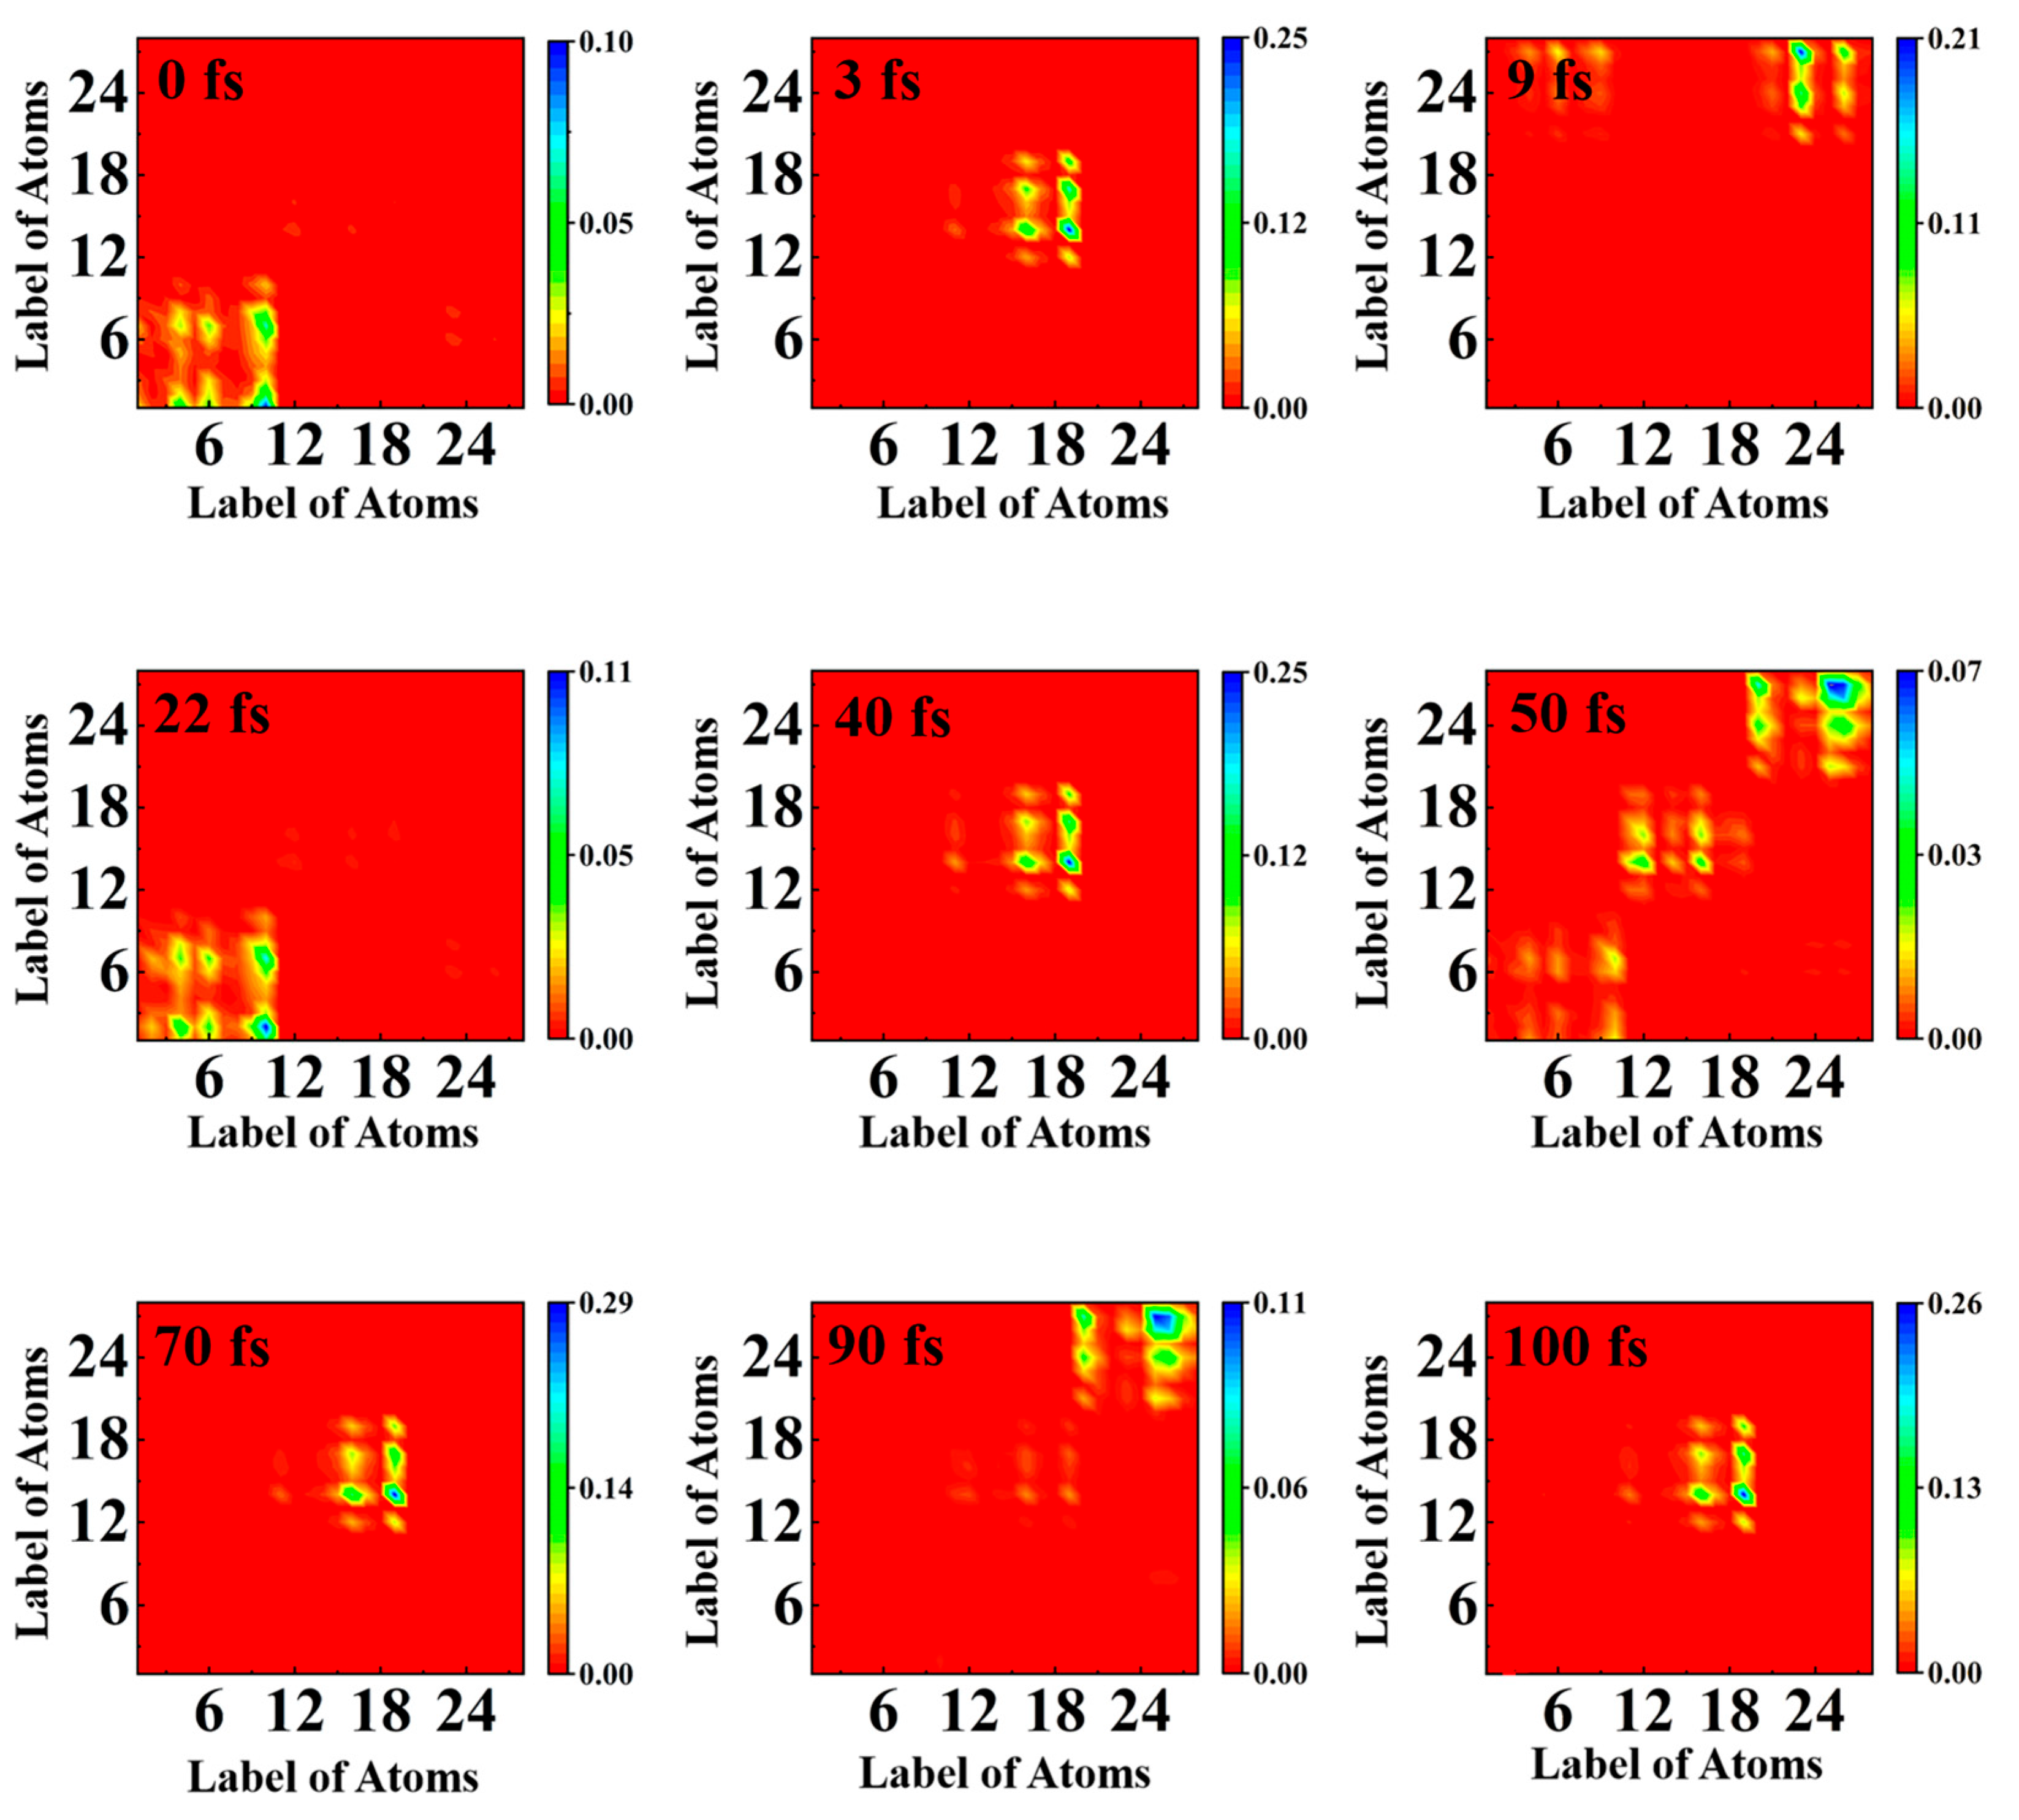
The electron–hole coherence can be accurately observed by analyzing the transition density matrix (TDM) in two-dimensional real space [41,42,43,44]. Since hydrogen does not contribute much to the overall charge transfer process, the effect of hydrogen is ignored. Figure 4 depicts the change in TDM in TAT. The abscissa is the source of electron (green). The ordinate represents the potential location of the electron during the transition (blue). At 0 fs, element (10, 1) accounts for the largest proportion, which expresses the electron transition from N10 to C1, the charge is completely populated on donor (A), and the electron–hole coherence is stronger at A. At 3 fs, the element (19, 14) accounts for the largest proportion, representing the transfer of electrons from O19 to C14, and coherent charge transfer begins to occur. This result is consistent with Figure 3. At 9 fs, the proportion of (23, 27) is the largest, showing that the electron is moving from O23 to C27, and the electron-hole coherence is stronger at T1 and T2. At 22 fs, the element converge at (10, 2), which means that the electron is back on A again, is the transition from N10 to N2. The electron transition at 40 fs is similar to that at 3 fs, focusing on the O19 and C14 of acceptor T1. The most clear is that at 50 fs, the elements have an obvious distribution on A, T1, and T2, illuminating that the charge is gradually transferred from A to T1 and T2 at this moment. The electron–hole coherence is present throughout the molecule. At 70 fs, the electron is concentrated on (19, 24) again, and the charge is transferred periodically. At 90 fs, the charge is concentrated in the T1 and T2 regions. At 100 fs, the element is again concentrated at (19, 24), ready to start a new round of periodic oscillation. During a period of 100 fs, it seems as though the electron is being transferred back and forth between the donor and the acceptor, and the electron–hole coherence varies periodically.
2.5. Hole–Electron Analysis and Marcus–Levich–Jortner Theory
Hole–electron analysis can investigate the transition characteristics of coherent charge transfer at different times, as shown in Figure 5a. The electrons are in green, and blue is used for holes. The corresponding parameters describing the electronic excited states are listed in Figure 5b–d. Where the D index is the hole–electron distance, the overlap of the hole–electron is represented by the symbol Sr and the t index indicates the degree of hole–electron separation. The findings demonstrate that the D index approaches the Sr index at 0 fs, 22 fs, 50 fs, and 90 fs, while the t index is unmistakably negative. Moreover, both the hole delocalization index (HDI) and electron delocalization index (EDI) are much smaller. This explains why their hole distribution and electron distribution are more uniform and have obvious delocalization characteristics. All this evidence proves that TAT is in a locally excited state at these times. In this kind of excitation, the main distribution range of hole–electron is approach, the overlap degree is very high, and the hole–electron distribution is not obviously separated. On the contrary, at 3 fs, 9 fs, 40 fs, 70 fs, and 100 fs, the difference between D is large. The electron–hole center distance is far away, which expresses that TAT is undergoing charge transfer excitation at these moments. The relatively small Sr index indicates that the hole–electron overlap degree is small and the hole and electron are highly separated. The t index is positive, indicating that hole–electron separation is obvious at this time. A high separation degree can effectively strengthen electron excitation and promote the occurrence of coherent electron transfer in TAT. The corresponding HDI values and EDI values are relatively large, and the degree of delocalization of the holes and electrons is low. This implies that these moments include charge transfer excitation. It is clear that coherent electron transfer depends, critically, on the local excited states and charge transfer states of TAT, which change frequently throughout time.
Marcus–Levich–Jortner expression is widely used to explain the dynamics of vibrational coupling and charge recombination in donor–acceptor systems [45,46]. The following is how the Marcus–Levich–Jortner expression functions [47,48,49]:
where represents the rate of electron transfer, reflects the Boltzmann constant, and h is the Planck constant. The reaction temperature and electron coupling strength of the system are expressed by and , respectively. The reorganization energy and free energy of the system can be evinced in terms of and . Theoretically, it should be possible to account for all molecular vibrational frequencies , hence a list of all possible vibrational energy levels ν is required. Since the most efficient location for electron transfer is the donor and acceptor interface, the simplest method is to select the appropriate frequency and define the effective Huang–Rhys factor as and . The key physical quantities of electron transfer rate can be calculated based on the Marcus–Levich–Jortner theory. When the electronic state of the system changes, the internal reorganization energy changes because of the relaxation of the geometric structure. The intramolecular reorganization energy is represented by the following formula [50]:
Among them, and are the optimized negative electron energies based on the neutral molecular structure and the anionic structure, respectively. The energy of the and neutral molecular are optimized based on the anionic and neutral molecular structures. The reorganization energy is shown in Figure 5e at various times. The value of the reorganization energy λ oscillates regularly from 0.01 a.u. to 0.05 a.u., which further reveals the coherent property of the electron transfer process of TAT. The conformation of TAT in the excited state will change, which will cause the change in the free energy of the system. is the change in total free energy after the electron is transferred from the donor to the acceptor. can be described in two parts: one is exciton dissociation energy () and the other is charge recombination energy (). The Rehm–Weller equation can be used to express the value of [51]:
is the lowest excited state energy of the donor, and is the exciton binding energy. The function expression of is as follows [52]:
represents the ionization potential of the donor, and reflects the electron affinity of the recipient. The calculation results are displayed in Figure 5f. Both and oscillate regularly over time, with surprisingly consistent trends. This shows that coherent electron transfer in TAT is driven by the strong nuclear–electron coupling.
3. Conclusions
In summary, we use ab initio molecular dynamics and Ehrenfest dynamics to simulate the coherent electron transfer of TAT base triplets. Interestingly, it is discovered that the TAT base triplet electron transfer exhibits clear periodic oscillation with a period of 10 fs. The Kohn–Sham eigenvalues, hydrogen bond strength, and transition density matrices with time also exhibit periodic oscillations of 10 fs. An RDG analysis shows that the peak position of the hydrogen bond fluctuates regularly between −0.040 and −0.056. A CDD analysis elucidates a gradual shift in charge distribution from the donor (A) to the acceptor (T1 and T2), and quantifies the maximum charge transfer proportion of 59.817%. TDM tracks and visualizes the specific distribution of the electron and hole. By examining the hole–electron separation and overlap, as well as categorizing the locally excited and charge transfer states, it is found that charge transfer excitation promotes the electron coherent transfer of TAT. The results of free energy and reorganization energy indicate that the strong nuclear–electron coupling vibration drives the coherent transfer of electrons. It provides a real-time demonstration of the short-range coherent electron transfer of DNA base triplets and offers a useful understanding of coherence effects in biological systems.
4. Computational Details
The microscopic process of coherent electron transfer of TAT is visualized using first principles [53]. The geometry of TAT base triplets was optimized using the Gaussian 09 package [54]. To obtain the optimized electronic structures, Becke’s three-parameter hybrid exchange functions were combined with the Lee–Yang–Parr (B3LYP) gradient-corrected correlation functional. The basis set was the triple-ζvalence (TZVP) with a single set of polarization functions [55]. Using the Octopus program, the optimized molecular configuration was simulated using Ehrenfest dynamics and the correlation real-time, time-dependent density functional theory (RT-TDDFT) equation was solved [56,57]. The specific calculation process is shown in Figure S4. We simulate the core electron using Troullier–Martins pseudopotential [58]. The nucleus was widely propagated in Ehrenfest formalism. The time-dependent Kohn–Sham equation is coupled to the nuclear motion equation using the Ehrenfest Hamiltonian. The Ehrenfest dynamics provide a quantum force term as the mean field in the classical equation of nuclear motion to explain the nuclear–electron interaction [59]. It is a good way to explain the ultrafast charge delocalization and rearrangement. In order to approximate the evolution operator, the approximate enforced time reversal symmetry algorithm is used, and the related Hamiltonian exponents are counted using Taylor series expansion [60]. The initial photoinduced electron configuration of Ehrenfest dynamics is produced by moving an electron from the highest occupied molecular orbital (HOMO) to the virtual lowest unoccupied molecular orbital (LUMO) (see Figure 1c and Figure S1). The linear response TDDFT verifies that these orbitals contribute the most to the dominant optical transition. The following formula is used to monitor the coherent charge transfer process over time [61]:
Here, represents the electron density, and and represent the type of spin. The number of electrons and the Kohn–Sham molecular orbitals are represented by and , respectively. Although the total spin of the TAT base triplet is about 0, upon excitation, the spin distribution of the system will show spin region and spin region. By calculating the difference between and , we give the change in charge density with time to visualize these dynamics. From Tables S1 and S2, the total energy is converged to near 0.1 eV for a radius of 4.5 Å and a spacing of 0.15 Å, which produced a 122 Ry cut off. The step sizes of TAT are adjusted to 1 attosecond in order to compare the evolution of nucleus and electron throughout time correctly. The kinetic energy increases throughout the trajectory as a result of the relaxation from the Franck–Condon point, and the initial nuclear velocities are set to zero. In our simulations, the degrees of freedom for the electronic and nuclear systems propagate on the same time grid. Moreover, the analysis of the reduced density gradient, the transition density matrix, and the hole–electron coupling depends on the Multiwfn program and VMD software [62,63,64].
Supplementary Materials
The following supporting information can be downloaded at: https://www.mdpi.com/article/10.3390/molecules28196802/s1, Different functionals and basis sets were tested and calculated, the infrared vibrational spectra changed over time, and the optimized TAT structure coordinates were displayed in the supporting information. Movie S1: The CDD of the simulated TAT from 0 fs to 100 fs. Table S1 Select different radius values corresponding to the energy. Table S2 Select different spacing values corresponding to the energy. Table S3 The maximum absorption peak of TAT was calculated by different functionals and basis sets (Exp = 260 nm [29,30]). Upper half: We change the functional, keeping the basis set TZVP. Lower half: We change the basis set keeping the functional B3LYP. Figure S1. The relative molecular orbitals and energy under different functionals. Figure S2. Evolution of infrared vibrational spectra of charge donor (A) and acceptor (T1 and T2) over time. Figure S3. The time-dependent dynamics of N-H bonds near the hydrogen bond grid is obtained with the Gaussian 09 package at the B3LYP (TZVP) level. The optimized coordinates of TAT.
Author Contributions
Conceptualization, L.Z.; Validation, Q.L.; Formal analysis, Y.W., L.Y. and M.G.; Investigation, L.Z. and H.Y.; Writing—original draft, L.Z.; Writing—review and editing, Y.S.; Supervision, Y.S.; Funding acquisition, Y.S. All authors have read and agreed to the published version of the manuscript.
Funding
This work was supported by the National Basic Research Program of China (Grant No. 2019YFA0307701), the Nature Foundation of Jilin Province (20230101011JC), and the National Natural Science Foundation of China (No. 12374236).
Institutional Review Board Statement
Not applicable.
Informed Consent Statement
Not applicable.
Data Availability Statement
Not applicable.
Conflicts of Interest
The authors declare no conflict of interest.
Sample Availability
Not applicable.
References
- Kawai, K.; Hayashi, M.; Majima, T. Hole Transfer in LNA and 5-Me-2′-deoxyzebularine-Modified DNA. J. Am. Chem. Soc. 2012, 134, 9406–9409. [Google Scholar] [CrossRef] [PubMed]
- Xu, G.L.; Zhao, H.; Reboud, J.L.; Cooper, J.M. Cycling of Rational Hybridization Chain Reaction to Enable Enzyme-Free DNA-Based Clinical Diagnosis. ACS Nano 2018, 12, 7213–7219. [Google Scholar] [CrossRef] [PubMed]
- Karakaidos, P.; Karagiannis, D.; Rampias, T. Resolving DNA Damage: Epigenetic Regulation of DNA Repair. Molecules 2020, 25, 2496. [Google Scholar] [CrossRef] [PubMed]
- Lewis, F.D.; Wu, T.F.; Zhang, Y.F.; Letsinger, R.L.; Greenfield, S.R.; Wasielewski, M.R. Distance-dependent electron transfer in DNA hairpins. Science 1997, 277, 5326. [Google Scholar] [CrossRef] [PubMed]
- Peluso, A.; Caruso, T.; Landi, A.; Capobianco, A. The Dynamics of Hole Transfer in DNA. Molecules 2019, 24, 4044. [Google Scholar] [CrossRef] [PubMed]
- Menacher, F.; Rubner, M.; Berndl, S.; Wagenknecht, H.A. Thiazole Orange and Cy3: Improvement of Fluorescent DNA Probes with Use of Short Range Electron Transfer. J. Org. Chem. 2008, 73, 4263–4266. [Google Scholar] [CrossRef] [PubMed]
- Marquetand, P.; Nogueira, J.; Mai, S.; Plasser, F.; González, L. Challenges in Simulating Light-Induced Processes in DNA. Molecules 2017, 22, 49. [Google Scholar] [CrossRef]
- Szabla, R.; Kruse, H.; Stadlbauer, P.; Sponer, J.; Sobolewski, A.L. Sequential electron transfer governs the UVinduced self-repair of DNA photolesions. Chem. Sci. 2018, 9, 3131–3140. [Google Scholar] [CrossRef]
- Giese, B.; Wessely, S.; Spormann, M.; Lindemann, U.; Meggers, E.; Beyerle, M.E.M. On the Mechanism of Long-Range Electron Transfer through DNA. Angew. Chem. Int. Ed. 1999, 38, 7. [Google Scholar] [CrossRef]
- Giese, B.; Amaudrut, J.; Köhler, A.K.; Spormann, M.; Wessely, S. Direct observation of hole transfer through DNA by hopping between adenine bases and by tunnelling. Nature 2001, 412, 6844. [Google Scholar] [CrossRef]
- Chen, H.; Meena; McLaughlin, L.W. A Janus-Wedge DNA Triplex with A-W1-T and G-W2-C Base Triplets. J. Am. Chem. Soc. 2008, 130, 13190–13191. [Google Scholar] [CrossRef] [PubMed]
- Lin, S.H.; Fujitsuka, M.; Majima, T. Sequence-Dependent Photocurrent Generation through Long-Distance Excess-Electron Transfer in DNA. Angew. Chem. Int. Ed. 2016, 55, 8715–8717. [Google Scholar] [CrossRef] [PubMed]
- Zhang, Y.; Xie, P.; He, X.H.; Han, K.L. Self-Consistent Polarization of the Boundary in the Redistributed Charge and Dipole Scheme for Combined Quantum-Mechanical and Molecular-Mechanical Calculations. J. Chem. Theory Comput. 2016, 3, 1378–1398. [Google Scholar] [CrossRef] [PubMed]
- Lee, J.Y.; Terakawa, T.; Qi, Z.; Steinfeld, J.B.; Redding, S.; Kwon, Y.H.; Gaines, W.A.; Zhao, W.X.; Sung, P.; Greene, E.C. Base triplet stepping by the Rad51/RecA family of recombinases. Science 2015, 349, 6251. [Google Scholar] [CrossRef] [PubMed]
- Shao, C.; Lu, H.T.; Zhang, X.; Yu, C.; Tohyama, T.; Lu, R.F. High-Harmonic Generation Approaching the Quantum Critical Point of Strongly Correlated Systems. Phys. Rev. Lett. 2022, 128, 047401. [Google Scholar] [CrossRef] [PubMed]
- Zhang, Y.; Chen, X.N.; Yin, S.H.; Ma, Y.H.; Yang, S.Q. Excess-electron capture and energy transfer to bulk water for aqueous DNA nucleotide. Phys. Chem. Chem. Phys. 2023, 25, 471–477. [Google Scholar] [CrossRef] [PubMed]
- Fujitsuka, M.; Majima, T. Charge transfer dynamics in DNA revealed by time-resolved spectroscopy. Chem. Sci. 2017, 8, 1752–1762. [Google Scholar] [CrossRef]
- Landi, A.; Borrelli, R.; Capobianco, A.; Peluso, A. Transient and Enduring Electronic Resonances Drive Coherent Long Distance Charge Transport in Molecular Wires. J. Phys. Chem. Lett. 2019, 10, 1845–1851. [Google Scholar] [CrossRef]
- Lee, H.T.; Carr, C.E.; Khutsishvili, I.; Marky, L.A. Effect of Loop Length and Sequence on the Stability of DNA Pyrimidine Triplexes with TAT Base Triplets. J. Phys. Chem. B 2017, 121, 9175–9184. [Google Scholar] [CrossRef]
- Carr, C.E.; Ganugula, R.; Shikiya, R.; Soto, A.M.; Marky, L.A. Effect of dC→d(m5C) substitutions on the folding of intramolecular triplexes with mixed TAT and C+GC base triplets. Biochimie 2018, 146, 156–165. [Google Scholar] [CrossRef]
- Keppler, M.D.; James, P.L.; Neidle, S. DNA sequence specificity of triplex-binding ligands. J. Biochem. 2003, 270, 4982–4992. [Google Scholar] [CrossRef]
- Reiling-Steffensmeier, C.; Marky, L.A. Chapter Sixteen-The Complementarity of the Loop to the Stem in DNA Pseudoknots Gives Rise to Local TAT Base-Triplets. Methods Enzymol. 2016, 567, 413. [Google Scholar] [PubMed]
- Natali, M.; Campagna, S.; Scandola, F. Photoinduced electron transfer across molecular bridges: Electron- and hole-transfer superexchange pathways. Chem. Soc. Rev. 2014, 43, 4005–4018. [Google Scholar] [CrossRef] [PubMed]
- Yu, J.; Horsley, J.R.; Abell, A.D. A controllable mechanistic transition of charge transfer in helical peptides: From hopping to superexchange. RSC Adv. 2017, 7, 42370–42378. [Google Scholar] [CrossRef]
- Grozema, F.C.; Tonzani, S.; Berlin, Y.A.; Schatz, G.C.; Siebbeles, L.D.A.; Ratner, M.A. Effect of Structural Dynamics on Charge Transfer in DNA Hairpins. J. Am. Chem. Soc. 2008, 130, 5157–5166. [Google Scholar] [CrossRef] [PubMed]
- Renaud, N.; Berlin, Y.A.; Lewis, F.D.; Ratner, M.A. Between Superexchange and Hopping: An Intermediate Charge-Transfer Mechanism in Poly(A)-Poly(T) DNA Hairpins. J. Am. Chem. Soc. 2013, 135, 3953–3963. [Google Scholar] [CrossRef] [PubMed]
- Fujitsuka, M.; Majima, T. Hole and excess electron transfer dynamics in DNA. Phys. Chem. Chem. Phys. 2012, 14, 11234–11244. [Google Scholar] [CrossRef]
- Menzel, J.P.; Groot, H.J.M.; Buda, F. Photoinduced Electron Transfer in Donor-Acceptor Complexes: Isotope Effect and Dynamic Symmetry Breaking. J. Phys. Chem. Lett. 2019, 10, 6504–6511. [Google Scholar] [CrossRef]
- Banyasz, A.; Ketola, T.; Martínez-Fernández, L.; Improta, R.; Markovitsi, D. Adenine radicals generated in alternating AT duplexes by direct absorption of low-energy UV radiation. Faraday Discuss. 2018, 207, 181–197. [Google Scholar] [CrossRef]
- Lewis, F.D.; Zhu, H.H.; Daublain, P.; Fiebig, T.; Raytchev, M.; Wang, Q.; Shafirovich, V. Crossover from Superexchange to Hopping as the Mechanism for Photoinduced Charge Transfer in DNA Hairpin Conjugates. J. Am. Chem. Soc. 2006, 128, 791–800. [Google Scholar] [CrossRef]
- Yu, F.B.; Li, P.; Li, G.Y.; Zhao, G.J.; Chu, T.S.; Han, K.L. A Near-IR Reversible Fluorescent Probe Modulated by Selenium for Monitoring Peroxynitrite and Imaging in Living Cells. J. Am. Chem. Soc. 2011, 133, 11030–11033. [Google Scholar] [CrossRef]
- Zhang, Y.; Wang, J.Y.; Yang, S.Q. Notable effect of water on excess electron attachment to aqueous DNA deoxyribonucleosides. Phys. Chem. Chem. Phys. 2019, 21, 8925–8932. [Google Scholar] [CrossRef] [PubMed]
- Uzawa, Y.; Wang, Z. Coherent multiple charge transfer in a superconducting NbN tunnel junction. Phys. Rev. Lett. 2005, 95, 017002. [Google Scholar] [CrossRef] [PubMed]
- Qian, C.; Yu, C.; Jiang, S.C.; Zhang, T.; Gao, J.C.; Shi, S.; Pi, H.Q.; Weng, H.M.; Lu, R.F. Role of Shift Vector in High-Harmonic Generation from Noncentrosymmetric Topological Insulators under Strong Laser Fields. Phys. Rev. X 2022, 12, 021030. [Google Scholar] [CrossRef]
- Falke, S.M.; Rozzi, C.A.; Brida, D.; Maiuri, M.; Amato, M.; Ephraim, S.; DeSio, A.; Rubio, A.; Cerullo, G.; Molinari, E.; et al. Coherent ultrafast charge transfer in an organic photovoltaic blend. Science 2014, 344, 1001. [Google Scholar] [CrossRef] [PubMed]
- Zhu, L.X.; Zhou, Q.; Cao, B.F.; Li, B.; Wang, Z.R.; Zhang, X.L.; Yin, H.; Shi, Y. Theoretical reconsideration of the mechanism of the excited state proton transfer of indigo carmine in water. J. Mol. Liq. 2022, 347, 118365. [Google Scholar] [CrossRef]
- Newton, M.D. Bridge-Mediated Electron Transfer and Multiple Reaction Coordinates. Isr. J. Chem. 2004, 44, 83. [Google Scholar] [CrossRef]
- Zhou, P.W.; Tang, Z.; Li, P.; Liu, J.Y. Unraveling the Mechanism for Tuning the Fluorescence of Fluorescein Derivatives: The Role of the Conical Intersection and nπ* State. J. Phys. Chem. Lett. 2021, 12, 6478–6485. [Google Scholar] [CrossRef]
- Zhu, L.X.; Zhou, Q.; Wan, Y.F.; Li, Q.; Wan, Y.; Yin, H.; Shi, Y. The dynamical temporal behaviors of guanine–cytosine coherent charge transfer. Phys. Chem. Chem. Phys. 2023, 25, 10661–10670. [Google Scholar] [CrossRef]
- Zhang, Y.H.; Duan, Y.P.; Song, L.L.; Zheng, D.Y.; Zhang, M.X.; Zhao, G.J. Charge-transfer mobility and electrical conductivity of PANI as conjugated organic semiconductors. J. Chem. Phys. 2017, 147, 114905. [Google Scholar] [CrossRef]
- Yang, Y.; Chen, J.S.; Liu, J.Y.; Zhao, G.J.; Liu, L.; Han, K.L.; Cook, T.R.; Stang, P.J. Photophysical Properties of a Post-Self-Assembly Host/Guest Coordination Cage: Visible Light Driven Core-to-Cage Charge Transfer. J. Phys. Chem. Lett. 2015, 6, 1942–1947. [Google Scholar] [CrossRef] [PubMed]
- Zhou, P.W.; Han, K.L. Unraveling the Detailed Mechanism of Excited-State Proton Transfer. Acc. Chem. Res. 2018, 51, 1681–1690. [Google Scholar] [CrossRef] [PubMed]
- Wolstenholme, C.H.; Hu, H.; Ye, S.T.; Funk, B.E.; Jain, D.; Hsiung, C.H.; Ning, G.; Liu, Y.; Li, S.; Zhang, X. AggFluor: Fluorogenic Toolbox Enables Direct Visualization of the Multi-Step Protein Aggregation Process in Live Cells. J. Am. Chem. Soc. 2020, 142, 17515–17523. [Google Scholar] [CrossRef] [PubMed]
- Amenabar, I.; Poly, S.; Goikoetxea, M.; Nuansing, W.; Lasch, P.; Hillenbrand, R. Hyperspectral infrared nanoimaging of organic samples based on Fourier transform infrared nanospectroscopy. Nat. Commun. 2017, 8, 14402. [Google Scholar] [CrossRef] [PubMed]
- Redmore, N.P.; Rubtsov, I.V.; Therien, M.J. Synthesis, Electronic Structure, and Electron Transfer Dynamics of (Aryl) ethynyl-Bridged Donor-Acceptor Systems. J. Am. Chem. Soc. 2003, 125, 87698778. [Google Scholar] [CrossRef] [PubMed]
- Campos-Gonzalez-Angulo, J.A.; Ribeiro, R.F.; Yuen-Zhou, J. Resonant catalysis of thermally activated chemical reactions with vibrational polaritons. Nat. Commun. 2019, 10, 4685. [Google Scholar] [CrossRef] [PubMed]
- Marcus, R.A.; Sutin, N. Electron transfers in chemistry and biology. Biochim. Biophys. Acta 1985, 811, 265–322. [Google Scholar] [CrossRef]
- Barbara, P.F.; Meyer, T.J.; Ratner, M.A. Contemporary Issues in Electron Transfer Research. J. Phys. Chem. 1996, 100, 13148–13168. [Google Scholar] [CrossRef]
- Jortner, J. Temperature dependent activation energy for electron transfer between biological molecules. J. Chem. Phys. 1976, 64, 4860. [Google Scholar] [CrossRef]
- Kavarnos, G.; Turro, N. Photosensitization by reversible electron transfer: Theories, experimental evidence, and examples. Chem. Rev. 1986, 86, 401–449. [Google Scholar] [CrossRef]
- Lemaur, V.; Steel, M.; Beljonne, D.; Bredas, J.L.; Cornil, J. Photoinduced Charge Generation and Recombination Dynamics in Model Donor/Acceptor Pairs for Organic Solar Cell Applications: A Full Quantum-Chemical Treatment. J. Am. Chem. Soc. 2005, 127, 6077–6086. [Google Scholar] [CrossRef]
- Bredas, J.L.; Beljonne, D.; Coropceanu, V.; Cornil, J. Charge-Transfer and Energy-Transfer Processes in π-Conjugated Oligomers and Polymers: A Molecular Picture. Chem. Rev. 2004, 104, 4971–5004. [Google Scholar] [CrossRef] [PubMed]
- Stefanucci, G.; Leeuwen, R. Nonequilibrium Many-Body Theory of Quantum Systems: A Modern Introduction; Cambridge University Press: Cambridge, UK, 2013. [Google Scholar]
- Frisch, M.J.; Trucks, G.W.; Schlegel, H.B.; Scuseria, G.E.; Robb, M.A.; Cheeseman, J.R.; Scalmani, G.; Barone, V.; Mennucci, B.; Petersson, G.A.; et al. Gaussian 09, Revision B. 02; Gaussian, Inc.: Wallingford, CT, USA, 2009. [Google Scholar]
- Sousa, S.F.; Fernandes, P.A.; Ramos, M.J. General performance of density functionals. J. Phys. Chem. A 2007, 111, 10439–10452. [Google Scholar] [CrossRef]
- Castro, A.; Appel, H.; Oliveira, M.; Rozzi, C.A.; Andrade, X.; Lorenzen, F.; Marques, M.A.L.; Gross, E.K.U.; Rubio, A. Octopus: A tool for the application of time-dependent density functional theory. Phys. Status Solidi B Basic Res. 2006, 243, 2465. [Google Scholar] [CrossRef]
- Andrade, X.; Rodriguez, J.A.; Strubbe, D.A.; Oliveira, M.J.T.; Nogueira, F.; Castro, A.; Muguerza, J.; Arruabarrena, A.; Louie, S.G.; Guzik, A.A. Time-Dependent Density-Functional Theory in Massively Parallel Computer Architectures: The Octopus Project. J. Phys. Condens. Matter. 2012, 24, 233202. [Google Scholar] [CrossRef] [PubMed]
- Troullier, N.; Martins, J.L. Efficient pseudopotentials for plane-wave calculations. Phys. Rev. B 1991, 43, 1993. [Google Scholar] [CrossRef]
- Andrade, X.; Castro, A.; Zueco, D.; Alonso, J.L.; Echenique, P.; Falceto, F.; Rubio, Á. Modified Ehrenfest formalism for efficient large-scale ab initio molecular dynamics. J. Chem. Theory Comput. 2009, 5, 728–742. [Google Scholar] [CrossRef]
- Castro, A.; Marques, M.A.L.; Rubio, A. Propagators for the time-dependent Kohn-Sham equations. J. Chem. Phys. 2004, 121, 3425. [Google Scholar] [CrossRef]
- Eisenmayer, T.J.; Buda, F. Real-time Simulations of Photoinduced Coherent Charge Transfer and Proton-Coupled Electron Transfer. ChemPhysChem 2014, 15, 3258–3263. [Google Scholar] [CrossRef]
- Lu, T.; Chen, F.W. Multiwfn: A multifunctional wavefunction analyzer. J. Comput. Chem. 2012, 33, 580. [Google Scholar] [CrossRef]
- Liu, Z.Y.; Lu, T.; Chen, Q.X. An sp-hybridized all-carboatomic ring, cyclo[18]carbon: Electronicstructure, electronic spectrum, and optical nonlinearity. Carbon 2020, 165, 461–467. [Google Scholar] [CrossRef]
- Humphrey, W.; Dalke, A.; Schulten, K. VMD: Visual molecular dynamics. J. Mol. Graph. 1996, 14, 33–38. [Google Scholar] [CrossRef]
Figure 1.
(a) Structure of TAT base triplet. Blue: C; Orange: H; Pink: O; Purple: N. (b) Absorption spectrum of TAT base triplet. (c) The molecular orbitals involved in charge transfer. Blue for holes, and green for electrons. (d) Time evolution of molecular orbitals LUMO, LUMO + 1, and LUMO + 2 involved in coherent charge transfer process. (e) The distance between the donor and acceptor varies with time. (f) The electronegativity of N10, N15, and N21 over time.

Figure 2.
Graph of the function values of the TAT base triplet. The assignment of each peak on the gradient isosurface. The red circle marks the peak of the hydrogen bond.
Figure 2.
Graph of the function values of the TAT base triplet. The assignment of each peak on the gradient isosurface. The red circle marks the peak of the hydrogen bond.

Figure 3.
Visualizing the time-dependent evolution of coherent charge transfer in TAT base triplets. Simulation of CDD evolution over time. The pink represents electrons, and the green represents holes.
Figure 3.
Visualizing the time-dependent evolution of coherent charge transfer in TAT base triplets. Simulation of CDD evolution over time. The pink represents electrons, and the green represents holes.

Figure 4.
The distribution of holes and electrons with time is observed by using the two-dimensional real space method. The TDM heat maps of the electron’s movement with time.
Figure 4.
The distribution of holes and electrons with time is observed by using the two-dimensional real space method. The TDM heat maps of the electron’s movement with time.

Figure 5.
Dynamic evolution of hole–electron interaction analysis and Marcus theory of TAT base triplet with time. (a) The distribution of electrons (green) and holes (blue) over time. (b) The numerical variation of the electron–hole distance D and the corresponding Sr. (c) Dynamic evolution of numerical t of electron–hole separation degree. (d) The corresponding evolution of HDI and EDI. (e) Change in reorganization energy over time. (f) Evolution of free energy and over time.

Disclaimer/Publisher’s Note: The statements, opinions and data contained in all publications are solely those of the individual author(s) and contributor(s) and not of MDPI and/or the editor(s). MDPI and/or the editor(s) disclaim responsibility for any injury to people or property resulting from any ideas, methods, instructions or products referred to in the content. |
© 2023 by the authors. Licensee MDPI, Basel, Switzerland. This article is an open access article distributed under the terms and conditions of the Creative Commons Attribution (CC BY) license (https://creativecommons.org/licenses/by/4.0/).
Share and Cite
MDPI and ACS Style
Zhu, L.; Li, Q.; Wan, Y.; Guo, M.; Yan, L.; Yin, H.; Shi, Y. Short-Range Charge Transfer in DNA Base Triplets: Real-Time Tracking of Coherent Fluctuation Electron Transfer. Molecules 2023, 28, 6802. https://doi.org/10.3390/molecules28196802
AMA Style
Zhu L, Li Q, Wan Y, Guo M, Yan L, Yin H, Shi Y. Short-Range Charge Transfer in DNA Base Triplets: Real-Time Tracking of Coherent Fluctuation Electron Transfer. Molecules. 2023; 28(19):6802. https://doi.org/10.3390/molecules28196802
Chicago/Turabian StyleZhu, Lixia, Qi Li, Yongfeng Wan, Meilin Guo, Lu Yan, Hang Yin, and Ying Shi. 2023. "Short-Range Charge Transfer in DNA Base Triplets: Real-Time Tracking of Coherent Fluctuation Electron Transfer" Molecules 28, no. 19: 6802. https://doi.org/10.3390/molecules28196802