Financial Statement Preparation – General Ledger
Babak Rosenthal Mohammadi
Accredited General Manager, Toyota Motor Sales U.S.A. | Automotive E-commerce Innovator
Introduction
The General Ledger serves as the backbone of any financial system, meticulously capturing every transaction and enabling businesses to generate detailed financial statements. This practice of recording and analyzing becomes especially pivotal for complex operations like car dealerships, where myriad transactions occur daily. Our aim here is to delve deep into the Toyota Dealer Financial Statement, grounded in its General Ledger, to glean insights and understand the core financial health of the operation.
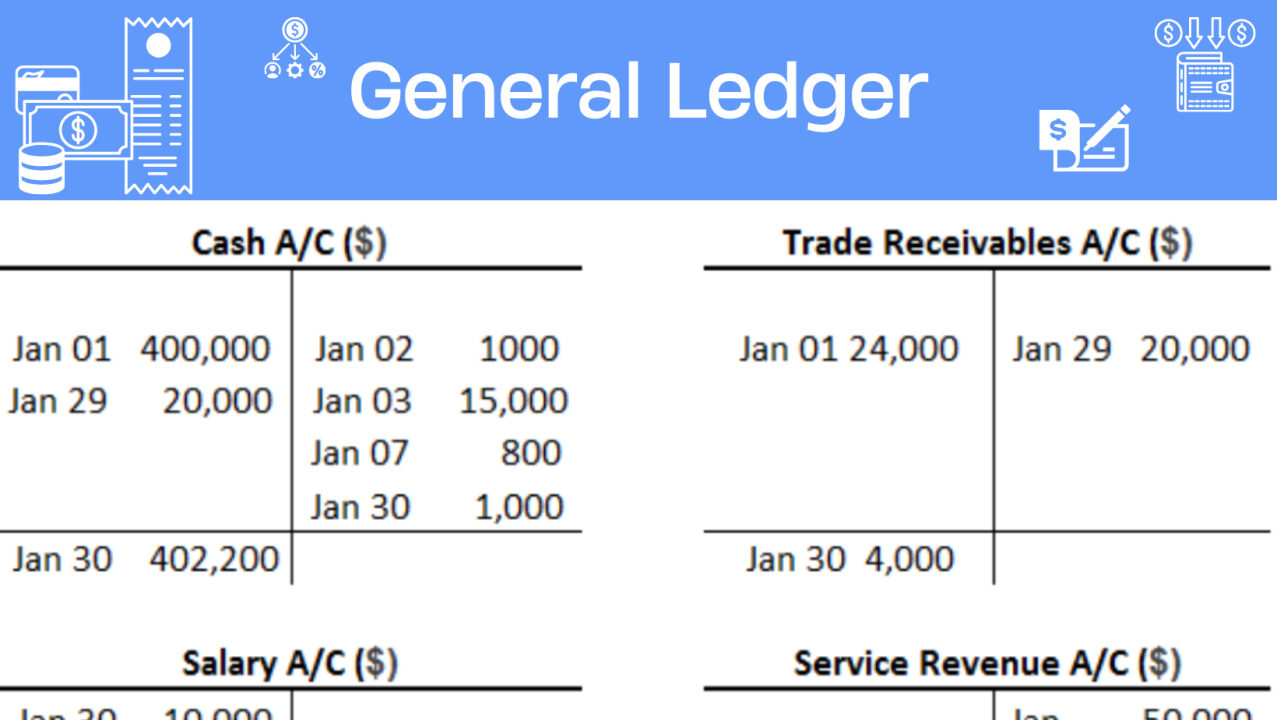
The general ledger is a systematic record, segmented by account types, detailing all the financial transactions within a specified period. Every transaction affects two accounts – a debit in one and a corresponding credit in another, ensuring the ledger remains balanced. It’s this meticulous recording, organization, and balancing act that sets the stage for comprehensive financial statement preparation.
Note: For our exploration, we will be referencing the TOYOTA DEALER ACCOUNTING SYSTEM. While this information is tailored for Toyota dealerships, the foundational accounting concepts apply universally across all manufacturers. Link to: Toyota-Dealer-Financial-Statement-Example-3.pdf
1. Purpose and Design of the Financial Statement: The Toyota Dealer Financial Statement is tailored to deliver a clear, comprehensive summary of all dealership transactions. It results from a series of systematic steps that transform individual financial activities into aggregated financial insights.
2. Recording Transactions: Each financial activity, from minor cash receipts to major vehicle sales, is promptly documented. Depending on the dealership’s operational preferences, this recording can occur electronically or manually. The primary repositories for this data are diverse journals or specific ledger accounts.
3. Month-End Summarization: As each accounting period (typically a month) concludes, there’s a need to consolidate the data. Every General Ledger account is reviewed, summarized, and brought to a closing balance, ready for the next period.
4. Adherence to Descriptive Norms: For the data to be consistent and comparable, transactions need classification as per predefined descriptions. These are detailed in Sections C – H of the manual, acting as a guidepost to ensure uniformity across various transaction types.
5. The Imperative of Trial Balance: The General Ledger’s health is ascertained before the detailed Financial Statement comes into form. This health check, termed “Taking a Trial Balance,” ensures that the ledger is balanced, with debits matching credits. Only with this assurance can the financial statement preparation proceed seamlessly.
(Page Reference: Before Page 1, as a preliminary step)
6. Data Presentation Nuances:
Balance Sheet: Provides a static view of the accounting period’s end. Here, Assets, Liabilities, and Net Worth are displayed, reflecting the dealership’s financial stature. (Page Reference: Page 1)
Operating Statement: Unlike the Balance Sheet, the Operating Statement is dynamic, capturing data across two spectrums – the current month and the year-to-date. This duality mandates the General Ledger to maintain both sets of data distinctly. (Page Reference: Pages 2 to 6)
7. Ledger Account Integration: The Financial Statement aims to be exhaustive. Hence, every General Ledger account, primary or subsidiary, needs representation. Some might be standalone, while others, due to their nature, could be aggregated or subtotaled. Guidance on sourcing these aggregated figures is provided within the statement, ensuring clarity.
8. Post-Preparation Validation: Once the Financial Statement is populated with data, a series of validation checks ensures its accuracy:
Cross-Validation: Elements like Total Sales, Gross Profit, and Departmental Profit (Loss) are cross-validated for consistency. (Page Reference: Pages 2 and 3)
Profit Alignment: A key metric, the Total Net Profit (or Loss), is compared across the statement to ensure coherence. (Page Reference: Pages 1 and 2)
Sales and Profit Verification: A detailed comparison across various pages guarantees that sales and gross profit numbers are consistent. (Page Reference: Pages 2 to 6)
Yearly Aggregation: A crucial validation for year-to-date figures is comparing them with the aggregation of individual monthly data. (Page Reference: Pages 2 to 6)
Through these meticulous steps, the Toyota Dealer Financial Statement offers a panoramic view of the dealership’s financial activities, ensuring informed decision-making for stakeholders.
Key Financial Metrics
Understanding the financial health and performance of a dealership is crucial for its effective management, future planning, and decision-making. Here are some key financial metrics that provide insights into the dealership’s profitability, liquidity, efficiency, and solvency:
1. Gross Profit Margin: (Page Reference: Pages 2 to 6)
Description: Represents the percentage of total sales that exceed the cost of goods sold.
Formula: Gross Profit / Total Sales * 100
2. Net Profit Margin: (Page Reference: Page 2)
Description: Indicates the percentage of total sales that remains after all expenses have been deducted.
Formula: Net Profit / Total Sales * 100
3. Current Ratio: (Page Reference: Page 1)
Description: Assesses a dealership’s short-term liquidity by comparing its current assets to its current liabilities.
Formula: Current Assets / Current Liabilities
4. Inventory Turnover Ratio: (Page Reference: Page 1 under Inventories)
Description: Measures how often the dealership’s inventory is sold and replaced over a specified period, indicating the efficiency of inventory management.
Formula: Cost of Goods Sold / Average Inventory
5. Debt-to-Equity Ratio: (Page Reference: Page 1 under Liabilities and Net Worth)
Description: Evaluates the proportion of total liabilities relative to shareholders’ equity, giving insights into the dealership’s leverage and financial structure.
Formula: Total Liabilities / Shareholder’s Equity
6. Return on Assets (ROA): (Page Reference: Page 2)
Description: Determines how effectively the dealership’s assets are being used to generate profits.
Formula: Net Income / Average Total Assets
7. Expense Ratios: (Page Reference: Pages 2 and 3)
Description: These ratios ascertain the proportion of each expense relative to total sales, helping in cost management.
Formula: Individual Expense / Total Sales * 100
8. Year-to-Date Performance: (Page Reference: Pages 2 to 6)
Description: Captures the cumulative financial metrics, summing all monthly figures up to the current month, providing a broader view of the dealership’s performance over the year.
9. Departmental Profitability Ratios: (Page Reference: Pages 4 to 6)
Description: Break down profitability by department (e.g., New Vehicle, Used Vehicle, Service, etc.), revealing the most and least profitable areas of the dealership.
By closely monitoring these financial metrics, dealership management can garner a deep understanding of operational efficiency, financial stability, and areas of potential improvement.