Data science is an interdisciplinary field that uses scientific techniques, procedures, algorithms, and structures to extract know-how and insights from established and unstructured information.
This article explores the integral components of data science, from data collection to programming languages, unveiling the crucial pillars shaping modern analytics.
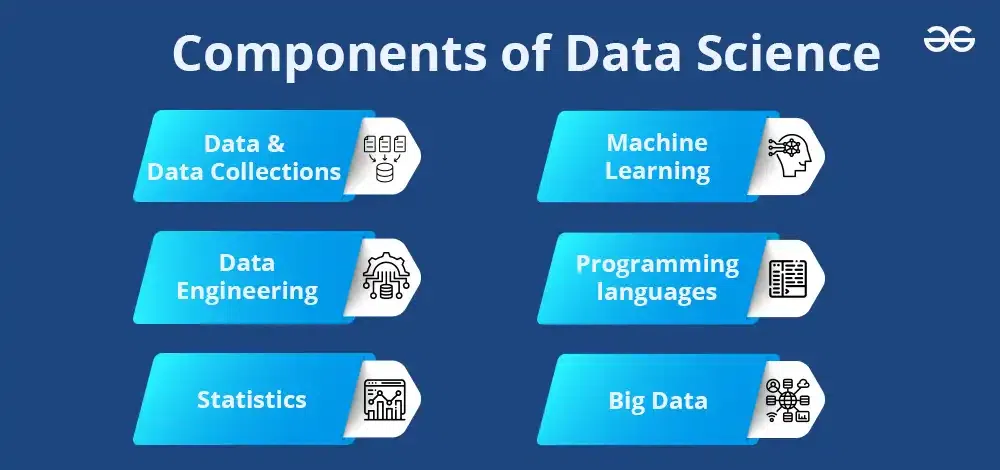
Main Components of Data Science
1. Data and Data Collections
The first step in every data science endeavor is to get the necessary datasets needed to address the business problem at hand or answer a specific question. Structured data and unstructured data are two major categories of data.
Structured Data
Structured data refers to information that resides in a fixed field within a database or spreadsheet. Examples includes relational databases, excel files, CSV files, and any other tabular datasets where each data element has a pre-defined type and length. Standard methods to access structured data are:
- Connecting to relational databases like MySQL.
- Loading Excel sheets and CSV files into notebooks like Jupyter and R Studio.
- Using APIs to connect to structured data sources.
- Accessing data warehouses like Amazon Redshift, Google BigQuery.
Unstructured Data
Unstructured data refers to information that does not fit into a predefined data model and does not have data types assigned to its elements. This comprises text documents, PDF files, photos, videos, audio files, presentations, emails, log files, and webpages, among other things. Accessing unstructured data brings additional complexity, standard methods include:
- Data scraping and crawling techniques to extract data from websites through libraries like Scrapy and Beautiful Soup.
- Leveraging optical character recognition on scanned documents and PDFs to lift data.
- Speech-to-text translation of audio and video files using APIs like YouTube Data API.
- Accessing email inbox through IMAP and POP protocols.
- Reading text files, word documents, and presentations stored in internal environments
- Querying NoSQL databases like MongoDB that contain unstructured document data
Once access to required datasets is established according to access-rights protocols and regulations, data extraction can begin using appropriate programmatic methods like SQL, APIs, or web scraping techniques.
2. Data Engineering
Data engineering designs, develops, and manages the infrastructure for storing, and processing data efficiently.
Real-world data obtained from businesses could be more consistent and complete. Data cleaning and preparation is an important step performed to transform raw data accessed from diverse sources into high-quality datasets ready for analysis.
Some common data issues that need to be resolved are:
- Missing values which could indicate a data capture or an extraction issue
- Incorrect data types like text when a numerical value was expected
- Duplicates which can skew analysis
- Data inconsistencies due to mergers, system migrations, etc.
- Outliers that fall outside expected statistical distributions
- Apply data normalization techniques
Spotting and fixing insufficient data proactively is essential before analysis to ensure accurate insights and correct models. During cleaning and preparation, it is also essential to preserve meta-information on how raw data was transformed into analysis-ready forms. Maintaining data provenance ensures analytical transparency for future reference.
Once data conditioning is complete, the next component is data analysis and modeling to unearth vital findings.
3. Statistics
Statistics is a foundational pillar of data science, providing the theoretical framework for data analysis and interpretation. As a crucial component, it encompasses methods for summarizing and interpreting data, inferential techniques for drawing conclusions, and hypothesis testing for validating insights.
In data science, statistical methods aid in uncovering patterns, trends, and relationships within datasets, facilitating informed decision-making. Descriptive statistics illuminate the central tendencies and distributions of data, while inferential statistics enable generalizations and predictions. A comprehensive understanding of statistical concepts is imperative for data scientists to extract meaningful insights, validate models, and ensure the robustness and reliability of findings in the data-driven decision-making process.
Statistical models apply quantitative methods to data in order to showcase key traits, patterns, and trends. Some examples are:
4. Machine Learning
Machine learning serves as an indispensable component within the broader field of data science, representing a paradigm shift in analytical methodologies. It involves the utilization of sophisticated algorithms to enable systems to learn and adapt autonomously based on data patterns, without explicit programming. This transformative capability allows for the extraction of meaningful insights, predictive modeling, and informed decision-making.
In a professional context, machine learning plays a pivotal role in uncovering complex relationships within vast datasets, contributing to a deeper understanding of data dynamics. Its integration within data science methodologies enhances the capacity to derive actionable knowledge, making it an instrumental tool for businesses and researchers alike in addressing intricate challenges and making informed strategic decisions.
Machine learning models enable the prediction of unseen data by training on large datasets and dynamically improving predictive accuracy without being explicitly programmed. Types of machine learning models include:
5.Programming languages (Python, R, SQL)
Programming languages such as Python, R, and SQL serve as integral components in the toolkit of a data scientist.
Python
Widely adopted for tasks ranging from data cleaning and preprocessing to advanced machine learning and statistical analysis, Python provides a seamless and expressive syntax. Libraries such as NumPy, pandas, and scikit-learn empower data scientists with efficient data manipulation, exploration, and modeling capabilities.
Additionally, the popularity of Jupyter Notebooks facilitates interactive and collaborative data analysis, making Python an indispensable tool for professionals across the data science spectrum.
R
R, a specialized language designed for statistical computing and data analysis, is a stalwart in the data science toolkit. Recognized for its statistical packages and visualization libraries, R excels in exploratory data analysis and hypothesis testing.
With an extensive array of statistical functions and a rich ecosystem of packages like ggplot2 for data visualization, R caters to statisticians and researchers seeking robust tools for rigorous analysis. Its concise syntax and emphasis on statistical modeling make R an ideal choice for projects where statistical methods take precedence.
SQL
Structured Query Language (SQL) stands as the foundation for effective data management and retrieval. In the data science landscape, SQL plays a pivotal role in querying and manipulating relational databases. Data scientists leverage SQL to extract, transform, and load (ETL) data, ensuring it aligns with the analytical objectives.
SQL’s declarative nature allows for efficient data retrieval, aggregation, and filtering, enabling professionals to harness the power of databases seamlessly. As data is often stored in relational databases, SQL proficiency is a fundamental skill for data scientists aiming to navigate and extract insights from large datasets.
6. Big Data
Big data refers to extremely large and diverse collections of data that are:
- Voluminous: The size of the data is massive, often in terabytes or even petabytes. Traditional data processing methods struggle to handle such large volumes.
- Varied: Big data comes in various forms, including structured (e.g., databases), semi-structured (e.g., JSON files), and unstructured (e.g., text documents, images, videos). This variety adds complexity to data analysis.
- Fast-growing: The volume, variety, and velocity (speed of data generation) of big data are constantly increasing, posing challenges in storage, processing, and analysis.
Conclusion
Together, these pillars enable data scientists to reliably extract powerful insights from data that can inform planning and strategizing in diverse business functions ranging from marketing, sales, and finance to operations and human resources.
Share your thoughts in the comments
Please Login to comment...