 Sanita Dhaubanjar1,2*
 Arthur F. Lutz2Wouter Julius Smolenaars3
 Sonu Khanal4Muhammad Khalid Jamil3,5
 Hester Biemans3
 Fulco Ludwig3
 Arun Bhakta Shrestha1
 Walter W. Immerzeel2
- 1International Center for Integrated Mountain Development (ICIMOD), Lalitpur, Nepal
- 2Department of Physical Geography, Universiteit Utrecht, Utrecht, Netherlands
- 3Environmental Sciences Group, Wageningen University and Research, Wageningen, Netherlands
- 4Future Water, Wageningen, Netherlands
- 5Pakistan Agricultural Research Council, Islamabad, Pakistan
Introduction: Despite ambitious plans to quadruple hydropower generation in the Indus basin, a quantitative assessment of the impact of climate change on hydropower availability in the basin is missing. To address this gap, we combine downscaled CMIP6 projections with the Hydropower Potential Exploration (HyPE) model to quantify future hydropower potential available in the upper Indus basin.
Methods: HyPE uses a spatial cost-minimization framework to evaluate four classes of hydropower potential, namely theoretical, technical, financial and sustainable, considering various constraints on the siting and sizing of two run-of-river hydropower plant configurations.
Results: Under future discharge projections, all classes of potential increase while subbasin changes align with the spatial patterns projected in hydro-climatology. Theoretical potential changes by 3.9–56 %, technical potential by −2.3–46.8 %, financial potential by −8.8–50.4 % and sustainable potential by −6.1–49.7 %. A small decline is observed in the northwestern subbasins where increase in potential is lower than in the southeast. In contrast, with increasing variability in the Indian Summer Monsoon in the future, the southeastern subbasins have the strongest increase in sustainable potential accompanied by higher increase in plant size, decrease in costs and higher variability. The southeastern Satluj subbasin is the hotspot where sustainable potential has the highest increase of up to 145 %. The northwestern Kabul subbasin has the highest decrease of up to −27 %. The Swat subbasin has the lowest variability in sustainable potential while the Jhelum and Indus main subbasins remain the subbasins with the cheapest potential into the future. The performance of future sustainable portfolios differ from the performance of historical portfolios by −11.1–39.9 %.
Discussion: Hence, considering future climate in the present-day planning of hydropower will lead to improved performance under a majority of scenarios. The sufficiency of hydropower potential to fulfill energy security depends on future population growth. Energy availability is projected to decline in the northwest as population increases faster than hydropower potential. The per capita sustainable potential In the Kabul subbasin reduces to a third of the historical value. A socio-hydrological approach is necessary to address the complexity of achieving sustainable and equitable hydropower development in the Indus basin under such spatial mismatch between hydropower availability and energy demand in a resource-limited world.
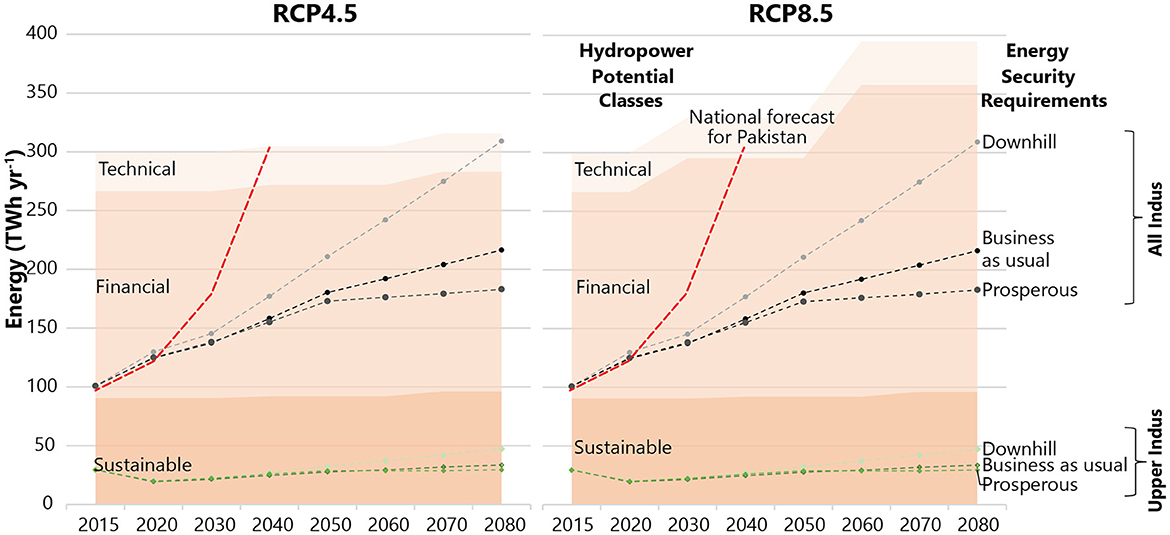
Graphical Abstract. A comparison of the HyPE model estimates of the technical, financial and sustainable hydropower potential in the upper Indus in the future with available projections for energy security requirements in the upper and the entire Indus.
1 Introduction
Climate change will affect hydropower generation and subsequent achievement of energy security globally (Gernaat et al., 2021; Wasti et al., 2022). Future changes in precipitation and temperature will alter runoff partitioning into surface and groundwater, ultimately affecting the timing and amount of discharge available for hydropower. Such impact of climate change on hydropower generation is expected to be more significant at the national and local scales than at the global or continental scales (Kumar et al., 2011; Wasti et al., 2022). For South Asia, global studies agree on an increase in hydropower generation under future climate change though the magnitude of change vary spatially (Hamududu and Killingtveit, 2012; Labriet et al., 2015; van Vliet et al., 2016a; Zhang et al., 2018; Paltán et al., 2021). However, the coarse spatial resolution in these global studies are unable to resolve the spatial and temporal heterogeneity in the precipitation and temperature of mountain catchments like the Upper Indus Basin (UIB) (Collier and Immerzeel, 2015; Rounce et al., 2020). Consequently, the representation of glacier, snow and permafrost dynamics remain simplistic increasing the uncertainty in the flow and sediment regimes simulated by global models for glacierized catchments (Viviroli et al., 2011; Lutz et al., 2016a; Momblanch et al., 2019; Stigter et al., 2021; Arenson et al., 2022). Local, high-resolution assessments are crucial for effectively characterizing these dynamics of cryosphere and hydrology and understanding their spatio-temporal impact on hydropower potential (Schaefli, 2015; Cherry et al., 2017). Furthermore, local-scale studies are also imperative to quantitatively represent the socio-hydrological nature of hydropower development in hydropower decision-making (Nüsser and Baghel, 2017).
The transboundary Indus basin (Figure 1) stands out with its ambitious hydropower development plan, surpassing other South Asian basins (Harlan and Hennig, 2022). Many regional studies agree that climate change will alter the volume, variability and seasonality of future runoff in the Indus basin (Bocchiola et al., 2011; Lutz et al., 2014, 2016a; Khanal et al., 2021; Nie et al., 2021; Nazeer et al., 2022). Despite this consensus, climate change impacts and future hydro-climatological risks are not considered in strategic hydropower planning in the UIB where the majority of the hydropower potential in the Indus lies. In practice, national policies rely on historical flow duration curves (FDCs) as the basis for sizing of individual hydropower plants (GoP, 2015). Hydropower portfolios based on historical discharge are used in national energy generation expansion planning models to optimize the scheduling of plants (CEA, 2018; NTDC, 2019, 2022). Such models identify optimal pathways indicating when and where investments should be made in hydropower plants. In their hydropower scheduling, these models also compare the cost efficiency of hydropower with other energy generation options under multiple future demand forecast scenarios. National energy expansion plans with decadal planning horizons are updated annually in Pakistan (NTDC, 2019, 2022) and every five years in India (CEA, 2018) using national demand forecasts for 15+ years. Hence, status quo hydropower planning only incorporates the future when comparing the competitiveness of hydropower to other energy sources in fulfilling projected energy demands. Furthermore, in India, future climate considerations in the energy policies primarily revolve around the expansion of hydropower to increase the share of renewables, reduce carbon emissions and increase energy efficiency of the national energy mix (CEA, 2018). Beyond that, current policies thus do not mandate the use of future hydro-climatology in the sizing or siting of tentative hydropower plants that are the basis of national energy planning.
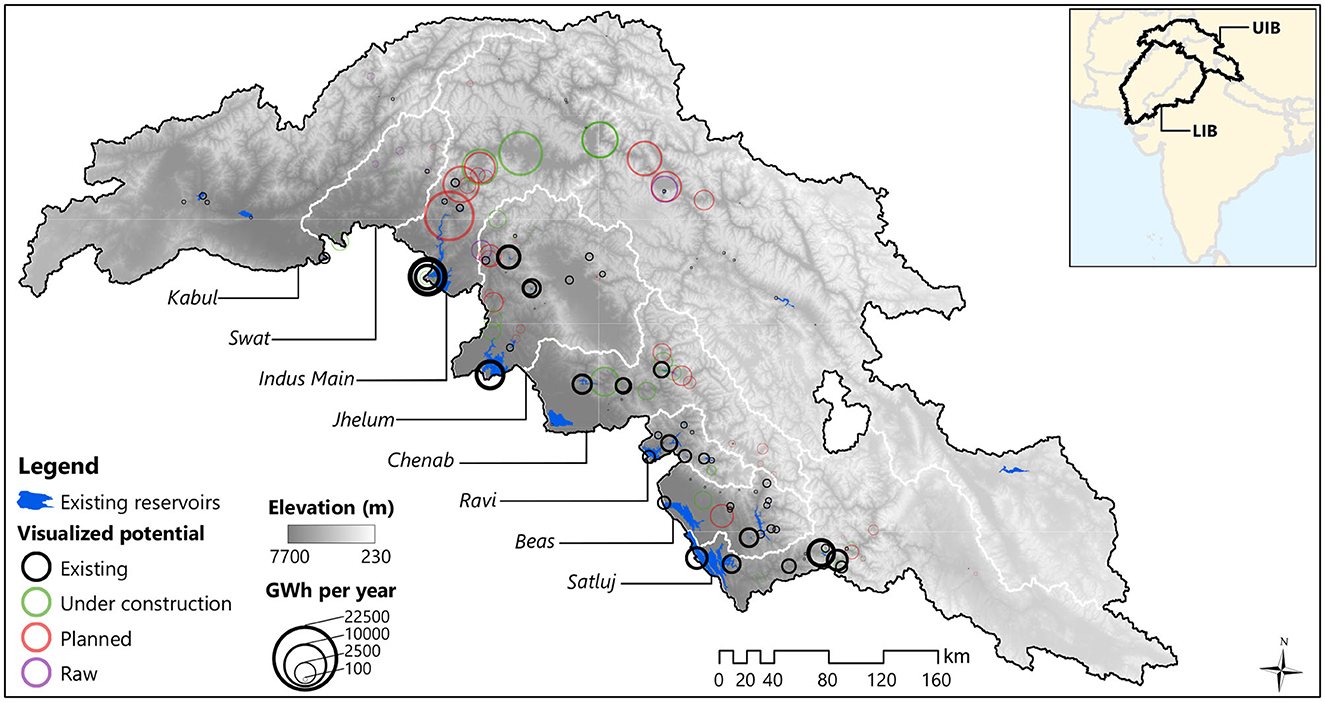
Figure 1. The visualized potential portfolio (Dhaubanjar et al., 2023) spread across the subbasins within the upper Indus basin overlaid on the HydroSHEDs DEM map (Lehner et al., 2008). Existing reservoirs data set from Lehner et al. (2011). Inset map shows the delineation of upper and lower Indus basin (UIB and LIB) used in this study and country boundaries from GADM v3.4.
In the Indus basin and beyond, the majority of climate impact assessments highlight the hydro-climatic risk posed by climate change but provide limited guidance for the siting and sizing of hydropower plants. Climate studies predominantly focus on the change in generation performance of existing hydropower plants in the future at global (van Vliet et al., 2016b; Ng et al., 2017; Turner et al., 2017b), regional (Lehner et al., 2005; Madani and Lund, 2010; Koch et al., 2011; Kao et al., 2015; Patro et al., 2018; Qin et al., 2020b; Zhao et al., 2023) or plant (Schaefli et al., 2007; Vicuña et al., 2011; Chilkoti et al., 2017; Qin et al., 2020a; Marahatta et al., 2022; Obahoundje et al., 2022) scales. In the UIB, only a few plant-scale studies explore the performance of existing hydropower plants under climate change. Casale et al. (2020) analyse future generation performance for seven plants in the Kabul subbasin, Mishra et al. (2020) study one plant in the Indus main subbasin, Shirsat et al. (2021) study two plants in the Beas subbasin and Ali et al. (2018), Chuphal and Mishra (2023) study a variety of plants in the Indian part of the UIB. On the other hand, there are studies that evaluate change in theoretical hydropower potential. The earliest studies used changes in discharge as a proxy for the impact of climate change on hydropower potential at global (Hamududu and Killingtveit, 2012) or smaller scales (Filion, 2000; Lehner et al., 2005; Aronica and Bonaccorso, 2013). More recently, higher resolution gridded analysis have allowed for more explicit assessment of future theoretical hydropower potential. However, these remain focused on the global scale (Labriet et al., 2015; van Vliet et al., 2016a; Paltán et al., 2021). Gernaat et al. (2021) further quantify global future technical and financial potential under climate change which are more useful in hydropower planning than the theoretical potential. While these future potential studies reveal hotspots where hydropower is favorable in the future, coarse spatial resolution and lack of representation of local socio-economic and legal constraints can render such climate impact analysis moot for informing local-level hydropower investment decisions at national or sub-national scales (Schaefli, 2015). In contrast, Yousuf et al.'s (2017) optimal plant sizing in Kabul, Ray et al.'s (2018) plant sizing for Nepal and Almeida et al.'s (2021) ranking of proposed plants considering future discharges demonstrate explicit ways to use future hydro-climatology in local hydropower planning. The absence of a comprehensive basin-scale assessment that incorporates local constraints at the plant-scale, while considering future changes in hydrology, represents a significant gap in strategic hydropower planning in the Indus basin.
In parallel, innovations have been made to couple climate-energy or climate-water-energy systems to include vulnerability to climate change in energy planning (Turner and Voisin, 2022). These consider hydropower portfolios alongside other thermal or renewable energy sources to develop optimal pathways to fulfill future demands and minimize carbon emissions (Parkinson and Djilali, 2015; de Queiroz et al., 2016; Turner et al., 2017a; Carvallo et al., 2020). Pereira-Cardenal et al. (2014) and van Vliet et al. (2016a,b) used climate-water-energy coupled models to address trade-offs in vulnerabilities of water and energy systems including hydropower under climate change. Similar coupled models have also been applied to optimize hydropower reservoir operation considering the water-energy-food-environment (WEFE) nexus for storage hydropower plants in the Indus basin (Vinca et al., 2021; Ilyas et al., 2022) and elsewhere (Jeuland, 2010; Almeida et al., 2022). These applications of coupled models demonstrate the flexibility of optimization models to evaluate hydropower options for many performance criteria at a basin-scale. However, including the siting, sizing and configuring of hydropower plants alongside the optimal scheduling of different energy sources will add considerable computational burden and complexity. Hence, it is typical that the identification of potential sites and the optimal scheduling of their development are separated into two steps. For strategic hydropower planning, in the first step climate-optimal hydropower potential sites can be identified by optimizing the siting, sizing and configuring hydropower plants throughout the basin considering historical and future hydro-climatology. Thereafter, in the second step energy models can be used to schedule which and when these climate-optimal hydropower plants should be developed alongside other energy sources. National energy generation expansion planning is already being conducted by the UIB riparian countries with a siloed focus on energy systems (CEA, 2018; NTDC, 2019, 2022). A priori identification of a climate-optimal portfolio that includes broader sustainability considerations considering linkages between Sustainable Development Goals (SDGs) and the WEFE nexus will provide a superior starting point to improve the analysis of hydropower development within the existing energy expansion planning frameworks in the UIB (Dhaubanjar et al., 2021).
To this end, we use Dhaubanjar et al.'s (2023) integrated river basin management based framework to quantify theoretical, technical, financial and sustainable potential for run-of-river (RoR) hydropower development in the UIB under future climate. We hypothesize that incorporating climate change in the optimal siting, sizing and configuring of RoR plants from the outset results in hydropower portfolios that perform better than those based only on historical climate. Our first novelty is the quantification of future hydropower potential in the UIB to characterize the spatial variations across the basin. Thereafter, our second novelty is the analysis of the difference between the portfolios optimized for historical and future hydro-climatologies to explore the value added by considering future hydro-climatology in early hydropower planning. Such performance evaluation allows the assessment of the differences between portfolios based on historical and future hydro-climatology, a critical step that is missing in previous global or local hydropower potential studies. Quantitative hydropower studies are also criticized for propagating technocratic biases in hydropower decision-making without considering ways it can worsen existing inequalities (WCD, 2000; Geheb and Suhardiman, 2019; Crootof et al., 2021). Beyond biophysical factors, hydropower development is also bounded by socio-political, governance and development processes at sub-national and national scales in the Indus basin (Akhter, 2015; Melsen et al., 2018). Socio-hydrological assessments emphasize that hydropower planning should not only consider the physical transformation of rivers but also the societal transformation of land, water, and energy governance systems (Nüsser and Baghel, 2017). Hence, our third novelty is the quantitative analysis of the future interactions between future hydropower potential and society from a socio-hydrological perspective (Nüsser et al., 2012; Sivapalan et al., 2012). Our quantification of the future hydropower cost-curves for the UIB combined with a critical exploration of the sufficiency of hydropower potential in the UIB under future climate and socio-economic development scenarios can inform the sustainable and equitable development of hydropower to achieve energy security toward the SDG 7 in the Indus basin and beyond.
2 Study area
Originating in the High Mountain Asia (HMA), the Indus basin covers over a million square kilometers spread across Pakistan (47 %), India (39 %), China (8 %) and Afghanistan (6 %) (FAO, 2011). The basin is home to the largest earth-filled dam in the world and a global hotspot for hydropower development. Our inventory found that national plans across the riparian countries in the Indus basin report a visualized potential of 369.4 TWh yr−1 (Figure 1) consisting of hydropower plants listed as existing (89 TWh yr−1), under-construction (85 TWh yr−1), planned (173 TWh yr−1) for future development or raw (195 TWh yr−1) plants without concrete development plans (Dhaubanjar et al., 2023). Nearly all of this four-fold expansion in existing hydropower generation lies in the UIB. The landscape is characterized by extreme topographical variations, 235-8600 masl within a 390,000 km2 expanse (Lehner et al., 2008), due to the Karakoram mountains on the northwest and the Hindu Kush Himalayas in the northeast covering seven of the world's highest peaks after the Everest (FAO, 2011). Global studies also find that 80 % of the hydropower potential in the Indus basin is concentrated in the UIB (Gernaat et al., 2017; Hoes et al., 2017). In contrast, the lower Indus basin (LIB) comprises fertile flatlands with extensive irrigated agriculture and the majority of the basin's urban areas, both of which are the primary demand centers for water and energy. Hence, we focus our resource potential analysis only in the hydropower rich UIB.
Under future climate, the most important biophysical driver of change in hydropower potential will be the changes in the UIB hydrology. The hydro-climatology in the UIB is characterized by a strong north-south variation due to the steep elevation gradients and an east-west variation driven by different precipitation regimes (Ahmad et al., 2012; Bookhagen, 2016; Lutz et al., 2016a; Nie et al., 2021). The Indian Summer Monsoon dominates in the east causing summer rains with decreasing influence toward the northwest as monsoon winds are constrained by the northern mountains. The winter western disturbances dominate in the west causing winter and spring precipitation that alter the glacier and snow accumulation and melt patterns in the west more than in the east. Future projections for the UIB show higher precipitation, earlier snowmelt and increased glacier melt (Bocchiola et al., 2011; Nepal and Shrestha, 2015; Lutz et al., 2016a; Wijngaard et al., 2017; Khanal et al., 2021; Nie et al., 2021). However, the hydrological response to these projections are spatio-temporally uneven. These studies note that in a majority of the subbasins, such future projections may result in a minor increase or decrease in projected river discharges in the summer and a higher increase in discharges in the other seasons. Higher autumn and winter precipitation and/or earlier meltwater result in varying shifts in the monthly discharge peaks across the subbasin. In the northern glacierised basins, the increase in meltwater causes an increase in dry season flows. In the southern basins, precipitation increases dry season flows only slightly in the west but more strongly in the east. The intermediate basins, particularly the Indus main, are influenced by a combination of both monsoon and westerlies (Nepal and Shrestha, 2015; Lutz et al., 2016a). Lutz et al. (2016a) note that some of these subbasins may see upto 40 % decline in monthly discharge in the dry season. Glaciers are shrinking faster and more significantly in the HKH than in the Karakoram. Such glacier wasting is projected to result in the peaking of glacier melt by mid-century followed by a decline in meltwater contribution by the end of the century (Nie et al., 2021). As subbasins shift from being glacier-modulated to rain-dominated, higher increases in discharge are observed in the southeastern subbasins and under the higher emission Representative Concentration Pathways (RCP) 8.5 climate scenario than the lower emission RCP 4.5 as summer monsoon becomes more variable in the future. What remains is to evaluate the impact of such projections for climate change on hydropower generation in the UIB.
3 Methods
3.1 Preparation of climate projections
For historical climate forcing, we use the 5 km reference climate dataset prepared by Khanal et al. (2021) for the HMA based on the European Center for Medium-Range Weather Forecasts (ECMWF) ERA5 climate data (Hersbach et al., 2020). Khanal et al. (2023) find that ERA5 dataset, available from 1979 to 2018 at 31 km spatial resolution, provide the most acceptable representation of precipitation for the UIB (Dahri et al., 2021) while the temperature grid show a cold bias over the HMA (Ji and Yuan, 2020). To obtain higher resolution forcing for the hydrological modeling, Khanal et al. (2021) used spatial interpolation to smooth the ERA5 precipitation to 5 km grids while the temperature grids were downscaled using a digital elevation model at 5 km based on HydroSHEDS (Lehner et al., 2008) and vertical temperature lapse rates. Furthermore, to overcome the frequently reported cold bias in ERA5 over the HMA, Khanal et al. (2021) bias-corrected the temperature using MODIS snow cover data. Details on preparation of the historical climate forcing are described in Sections 3.2.1 and 3.3.1 of Khanal et al. (2021).
For future climate projections, we use a variation of Lutz et al.'s (2016b) advanced envelope approach to select future Global Climate Models (GCM) simulations from the Coupled Model Intercomparison Project Phase 6 (CMIP6) (Eyring et al., 2016) multimodel ensemble. We started by shortlisting all GCM runs in CMIP6 that had daily temperature (mean, maximum and minimum) and precipitation (sum) for three RCPs. At the time of our study, there were 15, 14, and 17 GCMs respectively for the three RCPs 4.5, 7.0, and 8.5 representing future climate scenarios under low, medium and high levels of global carbon emissions. From these, we select four GCMs from each RCP ensemble from CMIP6 ensembles based on the weighting of two factors: the range of projections in the ensemble and the individual model skill in simulating the historical climate to consider the full range of projections provided by reliable ensembles.
For each RCP ensemble, we determine the 10th and 90th percentile from the projections for temperature and precipitation change (ΔT and ΔP) between 2071–2100 and 1985–2014 over the entire Indus basin. These establish the four corners of the ensemble range of temperature and precipitation projections representing Warm Wet, Warm Dry, Cold Wet, Cold Dry future scenarios. For each GCM we calculate a range score as the Euclidean distance to each corner, where distances are normalized over the full range of ΔT and ΔP projections. For skill score, the Mean Absolute Error (MAE) is calculated over the monthly climatology of the historical GCM simulations against the ERA5 based historical climate forcing data (Khanal et al., 2021). MAE is calculated for mean temperature and monthly precipitation sum for each month for individual ERA5 grid cells covering the Indus basin, and subsequently averaged. The MAE for temperature and precipitation are multiplied to obtain a combined skill score for each GCM. The range score and skill score of each GCM are averaged and inverted to obtain a final score and for each corner the GCM with the best score is selected (Table 1). Precipitation sum and air temperature (mean, maximum and minimum) for the selected GCMs are empirical-statistically downscaled and bias-corrected using quantile mapping applied at daily time step and 5 km resolution (Themeßl et al., 2011; Lutz et al., 2019). Thus, we generate bias-corrected climate projections for 24 scenarios processing the four corners models from the three RCPs for two future time horizons.
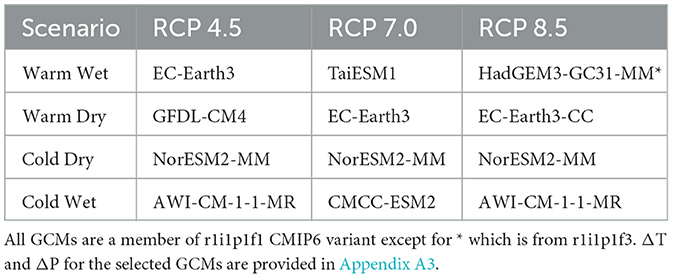
Table 1. GCMs selected as representative for the four corners under the three RCPs.
3.2 Preparation of hydrological projections
Using the prepared historical and future climate forcing, discharge data is prepared for three time horizons: Historical (1979–2018), mid-future (2036–2065) and far-future (2066–2095). To simulate discharge, historical and future climate data are used as forcing in a calibrated spatially distributed cryosphere-hydrology model (SPHY v3) (Khanal et al., 2021). The model, run at a resolution of 5 km, explicitly simulates glacier and snow melt processes to capture the melt dynamics in addition to the rainfall runoff and base flow (Khanal et al., 2021). The model was rigorously calibrated using a 3-step approach, where parameters related to snow-sublimation were calibrated to remote sensing snow cover, parameters related to melt processes were calibrated to remote sensing glacier mass balance and remaining parameters to observed discharge, to avoid equifinality, a common problem in the simulation of high mountain hydrology (Pellicciotti et al., 2012). The model performance, evaluated by comparing simulated discharge to observed discharge at two locations in the UIB, show good fit. The model is described in detail in Khanal et al. (2021).
The daily runoff maps simulated by the SPHY model at 5 km resolution are aggregated to generate monthly and long-term monthly average runoff maps for the historical and the two future time horizons. Thereafter, these 5 km runoff maps are downscaled to generate discharge maps at 500 m using a flow accumulation based routing algorithm (Gernaat et al., 2017). Additionally, the long-term monthly average discharge maps are used to generate the monthly FDC at each grid cell for the hydropower potential analysis.
3.3 Exploration of hydropower potential
We use the Hydropower Potential Exploration (HyPE) model (Dhaubanjar et al., 2021) at 500 m resolution to quantify four classes of RoR hydropower potential: theoretical, technical, financial and sustainable using simulated monthly long-term average discharges for the historical and 24 future discharge scenarios. We limit our analysis to RoR plants because the development of storage reservoirs is restricted by the Indus Water Treaty (IWT, UN-Treaty Services, 1960) with hydropower development plans already causing conflicts between riparian countries in the transboundary UIB. Theoretical potential (Ptheoretical in Equation 1) represents the maximum energy that can be generated by using all naturally available head and discharge. For technical, financial and sustainable potential, HyPE evaluates the optimal combination of two RoR plant configurations, diversion power plant (DP) and river power plant (RP) using Equations 2–3 (Gernaat et al., 2017). DP configuration uses an intake to divert river water into a powerhouse while RP uses dams with minimal ponding storage for peaking hydropower generation (Dhaubanjar et al., 2023).
Here, ρ is the density of water (kg m−3); g is the gravitational acceleration (9.8 m s−2); Zs are the elevations representing head-drop (m) for each configuration. hf is the friction losses (m) in the diversion pipe for DPs. Qyr, inlet is the simulated annual average discharge (m3s−1) at the upstream inlet. Qdesign is design discharge (m3s−1) and CF is annual average plant capacity factor (unitless). For theoretical potential, η is the overall efficiency considered 100% assuming that the theoretical plant can run at full capacity year-round. ηgen and ηdist, gridtype are electricity generation and distribution efficiencies where the latter further distinguishes between on and off grid plants. t is hours of plant operation (8760 h yr−1).
The technical potential represents the technologically feasible plants that can be built by accounting for technological constraints in hydropower design. First, Equations 2–3 are used with cost functions from Gernaat et al. (2017) to evaluate the cost of energy generation at prices adjusted to the 2010 US dollar level. At each site, costs are evaluated for building both the RP and the DP plant configurations. For the DPs, costs are evaluated for all possible inlet-outlet combination and penstock sizes. For the RPs, all combination of dam height and width are evaluated. The configurations for both options with the minimal cost are then selected. Thereafter, at the basin-level, optimal combinations of RP and DP are selected across all sites to minimize basin-level production cost. We define the full portfolio of optimal RP and DP plants as the total technical potential.
Financial potential considers only plants with unit production costs below 0.10 $ kWh−1, which represents the threshold up to which hydropower remains cost-competitive compared to other energy sources. Finally, sustainable potential goes beyond these technical and financial parameters to identify plants that remain cost-competitive after accounting for constraints imposed by other anthropogenic usage of land and water, environmental flow requirements (e-flows), geo-hazard risks [for earthquake, landslide and Glacial Lake Outburst Flood (GLOF)], socio-economic preferences and local policies that impact the sustainability of hydropower.
We start with the UIB HyPE model setup under the historical hydrology and the policy assumptions for the mixed energy focus scenario and risk-averse geo-hazard representation from our previous study (Dhaubanjar et al., 2023). Dhaubanjar et al. (2023) validated that the historical HyPE model provides reasonable estimates comparable to other studies on theoretical, technical and financial potential at similar spatio-temporal resolution. For the evaluation of future theoretical potential, Equation 1 is applied across 500 m river segments, which is the shortest distance between two grid points that can be represented by our 500 m discharge maps. For other potential classes, under the mixed energy focus scenario assumptions, the model is parameterized to search for large DPs and RPs in the primary rivers split into 4 km segments, large DPs in the secondary rivers also split into 4 km segment and small DPs (< 50 MW) in the tertiary rivers split into 2 km segment. These segment length were chosen based on our previous finding that finer river segments are better for identifying smaller plants in the cost optimization (Dhaubanjar et al., 2023). Large plants are assumed to be on-grid systems while small plants are off-grid. Alongside, risk-averse geo-hazard representation applies a conservative geo-hazards policy whereby no new hydropower plants are allowed in the areas with high risk for either of earthquake, landslide or GLOF. Building hydropower plants in other areas requires hazard mitigation costs scaled based on risk level. The cost functions and parameterization of the policy assumptions are also differentiated between the river classes and plant types (size, configuration, off/on grid) as discussed further in Dhaubanjar et al. (2023). Detailed description of physical, technical, financial, socio-political, environmental and sustainable constraints considered in HyPE to quantify the various hydropower potential classes are discussed in Dhaubanjar et al. (2021).
The UIB HyPE model is populated with future discharge while keeping all other data and parameters the same to evaluate optimal hydropower portfolios under future scenarios. The design discharge thresholds, defined as QXX (flow exceeded XX% of the time) are the most critical parameter set at Q30 for large RPs, Q25 for large DPs and Q80 for small DPs based on close discussion with hydropower experts in the Indus basin (Dhaubanjar et al., 2021, 2023). At each grid cell in the basin, the monthly FDC is used to identify the three design discharge. Thereafter, the CFs are computed based on the design discharge and long-term monthly discharges. For sustainable potential, 30 % of discharge is deducted as e-flow allocation (Gernaat et al., 2017). Hence, for each climate scenario, the HyPE model provides an optimal hydropower portfolio which presents the cost optimal combination of large RPs, large DPs and small DPs throughout the UIB.
3.4 Simulation of hydropower performance
As HyPE model is based on long-term monthly averages, the inter-annual variability in monthly discharge is poorly represented. Hence, we conduct an additional simulation of the performance of optimal hydropower portfolios under the monthly discharge time series. Such simulation reveals how hydropower generation will differ in reality from the long-term averages due to variability in monthly discharge. We evaluate hydropower performance in terms of the annual hydropower generation of each portfolio under historical and future monthly discharges. The hydropower potential represents the design energy generation under average conditions while hydropower performance provides a measure of actual energy generation that can be expected in the plant. For each plant in a portfolio, the design discharge is compared with the future discharge time series to evaluate the future CFs and subsequently the monthly hydropower generation each year. Thereafter, we compare the mean and extreme (10th and 90th percentile) performance of the historical and the future portfolios under the 24 future discharge scenarios.
3.5 Energy sufficiency
In a final step, we combine the hydropower potential and performance for the future with decadal population and energy security requirements projected by Smolenaars et al. (2021) for the Indus basin to understand the sufficiency of hydropower potential to achieve energy security. Smolenaars et al. (2021) regionalize the global projection for Shared Socio-economic Pathways (SSPs) to align them with the future socio-economic development narratives envisioned for the region (Wester et al., 2019) under the optimistic low population growth “SSP1-Prosperous”, middle-of-the-way “SSP2-Business as usual” and the pessimistic high population growth “SSP3-Downhill” scenarios. As per the narratives, the three SSPs are mapped to three corresponding RCPs as: SSP1+RCP4.5, SSP2+RCP7.0, SSP3+RCP8.0 to represent future scenarios of climate and socioeconomic changes. Smolenaars et al. (2021) established energy security requirements assuming strictly domestic energy required at a minimum of 0.60 and 0.26 MWh per capita per year for urban and rural populations respectively based on national studies for the riparian countries. We also compare the population projections with the number of people who can achieve energy security through available hydropower potential assuming the minimum energy security requirement of 0.60 MWh per year per capita. However, the factors considered in determining these minimum energy security requirement thresholds for different countries and diversity of lifestyles remain debated (Spreng, 2005; Arto et al., 2016). To address this issue, we additionally evaluate energy availability. Energy availability considers the technical, financial and sustainable hydropower potential available per capita. Thus, we evaluate the sufficiency of hydropower potential to meet the future energy needs in terms of population that can be energy secure, energy availability and affordability of hydropower potential in the future.
4 Results
4.1 Changes in hydropower potential
By forcing the HyPE model with long-term monthly average discharges for historical and 24 future scenarios, we quantify the future theoretical, technical, financial and sustainable hydropower potential in the UIB. For all four types of hydropower potential, an increase is projected as a result of an increase in future discharges (Figure 2 and Table 2). These increases are higher in the far-future and for the higher emission scenarios. Far-future projections are inherently associated with the higher uncertainty in future projections over further time-horizons. A small decline (-8.8 to -0.9 %) is observed only for RCP 4.5 in the Cold Dry scenario. By the end of the century, under the wettest climate projection of RCP 8.5 Warm Wet scenario, the historical theoretical potential of 1565 TWh yr−1 increases to 2444 TWh yr−1 (56.2 % change from historical) while the technical, financial and sustainable potential increase to 440 (46.8 % change from historical), 400 (50.4 %) and 135 (49.7 %) TWh yr−1 respectively. The change in potential is higher in the far (-2.3 to 50.4 %) than in the mid (-8.6 to 28.0 %) future with the strongest changes observed for RCP 8.5 in the far-future and RCP7.0 in the mid-future. As expected, values are often highest for the Warm Wet models and lowest for the Cold Dry.
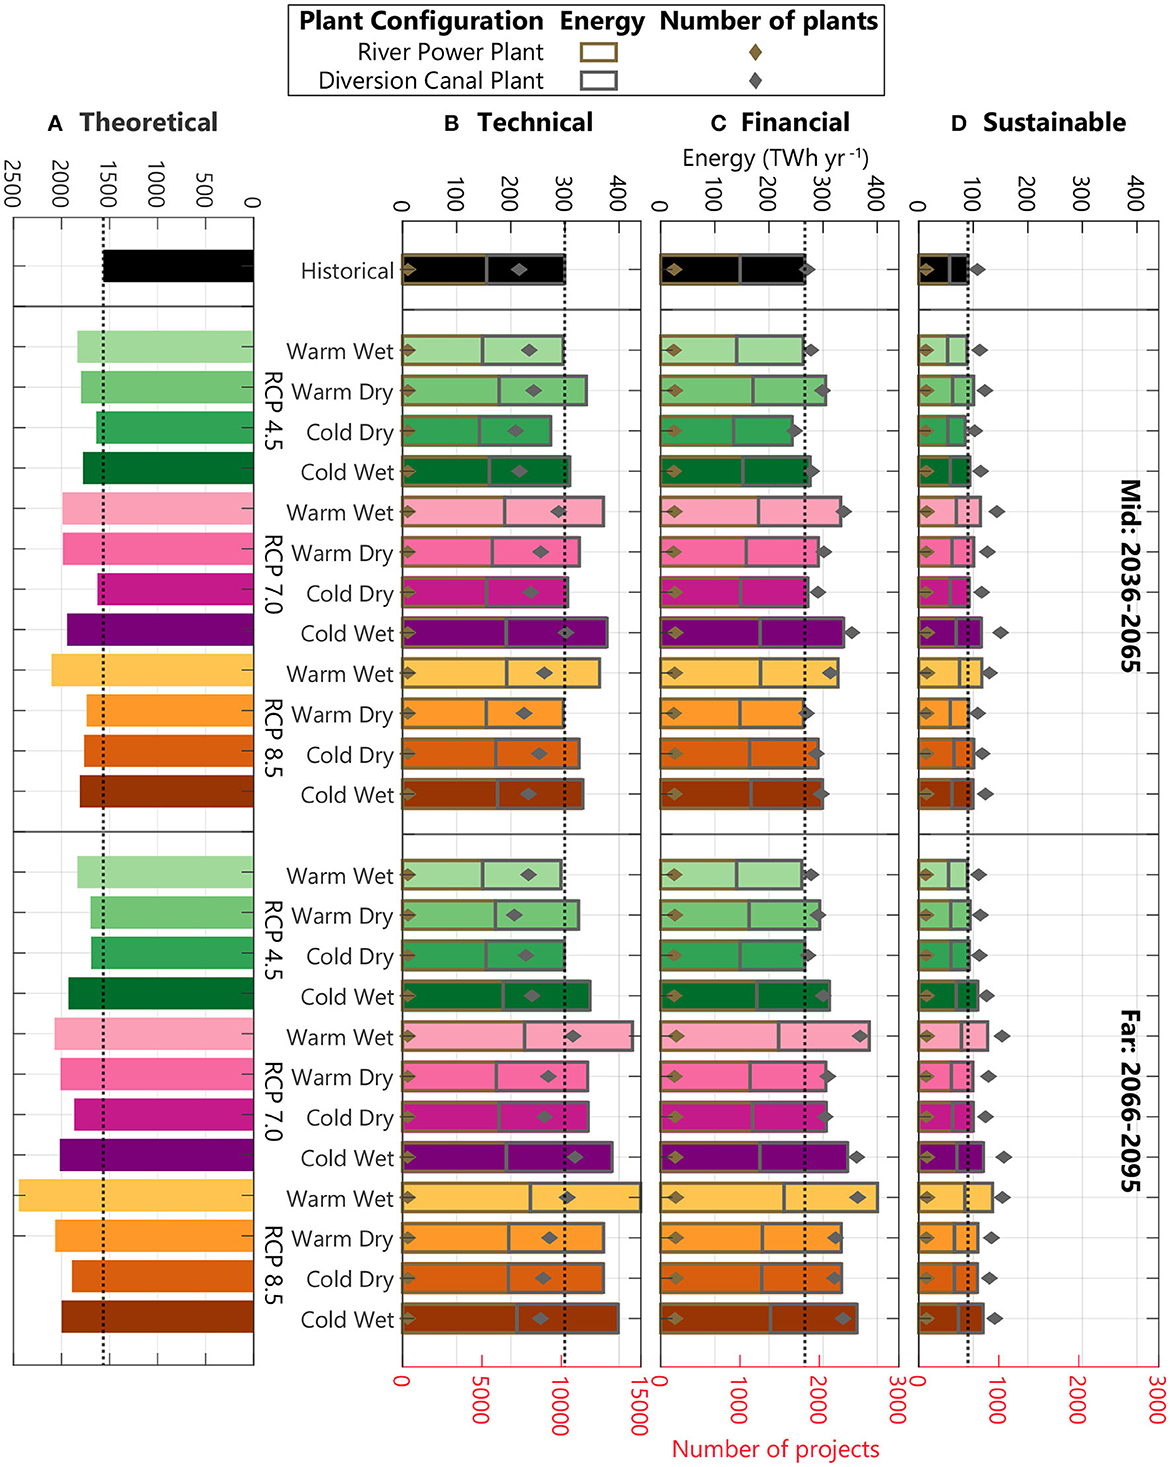
Figure 2. Historical and future hydropower potential in the upper Indus basin. Panels from left to right show basin-scale total (A) theoretical, (B) technical, (C) financial and (D) sustainable potential in TWh yr−1 in the top axis. For technical, financial, sustainable potential, the panels also show the division between the two plant configurations (river power and diversion canal plants). Proportion of the two plant configurations is shown for energy by stacked bars read from the top axis and number of projects by stacked points (◇) read from the bottom axis. Historical potential is indicated by black bar and black dotted line.
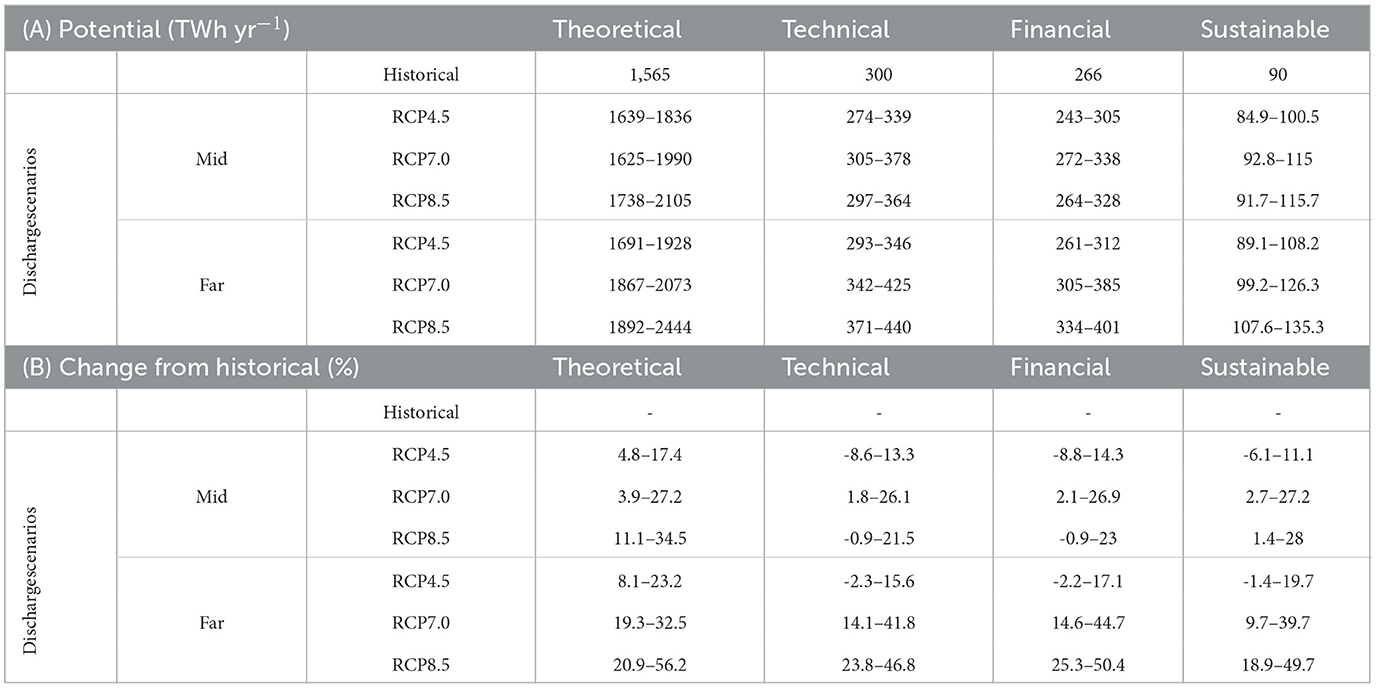
Table 2. Range (minimum-maximum) in basin hydropower potential across the four future discharge scenarios for each RCP for the theoretical, technical, financial and sustainable potential. (A) total potential, (B) relative change from historical potential.
At the basin-scale, theoretical potential shows slightly more variability and uncertainty in the future while other potential classes have similar relative changes (Table 2B). Theoretical potential has higher changes (3.9–56.2 %) especially for the far-future compared to technical (-8.6–46.8 %) or sustainable (-6.1–49.7 %) potential (Table 2B). In contrast, the difference between the four potential classes remains comparable with the technical potential ranging from 16 to 20 % and the sustainable potential from 5 to 6 % of the theoretical potential respectively under the historical and future scenarios. The constraints applied for technical, financial and sustainable potential evaluation results in many grid cells being removed from hydropower development while theoretical potential includes all grid cells in the basin (Dhaubanjar et al., 2021). This larger domain can explain the larger variability and higher sensitivity of theoretical potential to climate change.
The change in potential is not uniform across the UIB with an increasing northwest-to-southeast trend in potential (Figure 3). Similar to the basin-scale potential, a majority of the subbasin potential increases with higher magnitudes further into the future (see Appendix A1 for all potential classes and Figure 3A for sustainable potential). However, higher increases are observed when moving from the northwestern Kabul to the southeastern Satluj subbasins in Figure 3B). The Satluj and Indus main subbasins show the highest relative increases across all four potential classes at above 25 % for most cases which exceed the basin-scale changes (Figure 4). For the RCP 8.5 Warm Dry scenario, the sustainable potential increases by 145 % in the Satluj subbasin (Figure 4I). In contrast, for the Kabul subbasin (Figure 4B) a decline of upto -14 % is projected for the theoretical potential and -27 % for the sustainable potential. The difference between the subbasins is highest for the sustainable potential (Figure 4B) and lowest for technical potential.
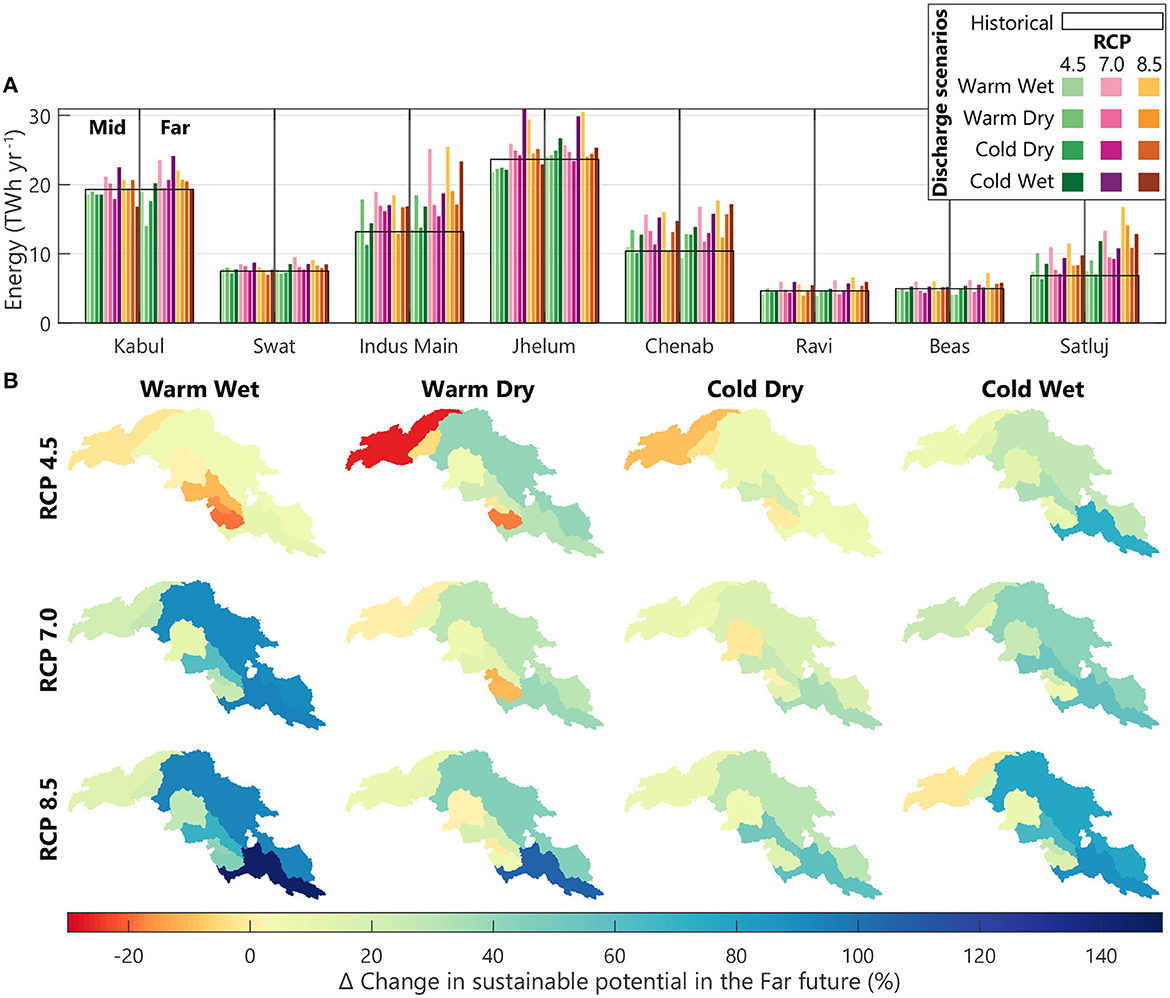
Figure 3. Historical and future sustainable potential across the UIB subbasins. (A) Bar plots indicate total potential under historical and 24 future discharge scenarios. (B) Spatial plot shows change in sustainable potential in the far-future scenarios compared to historical potential.
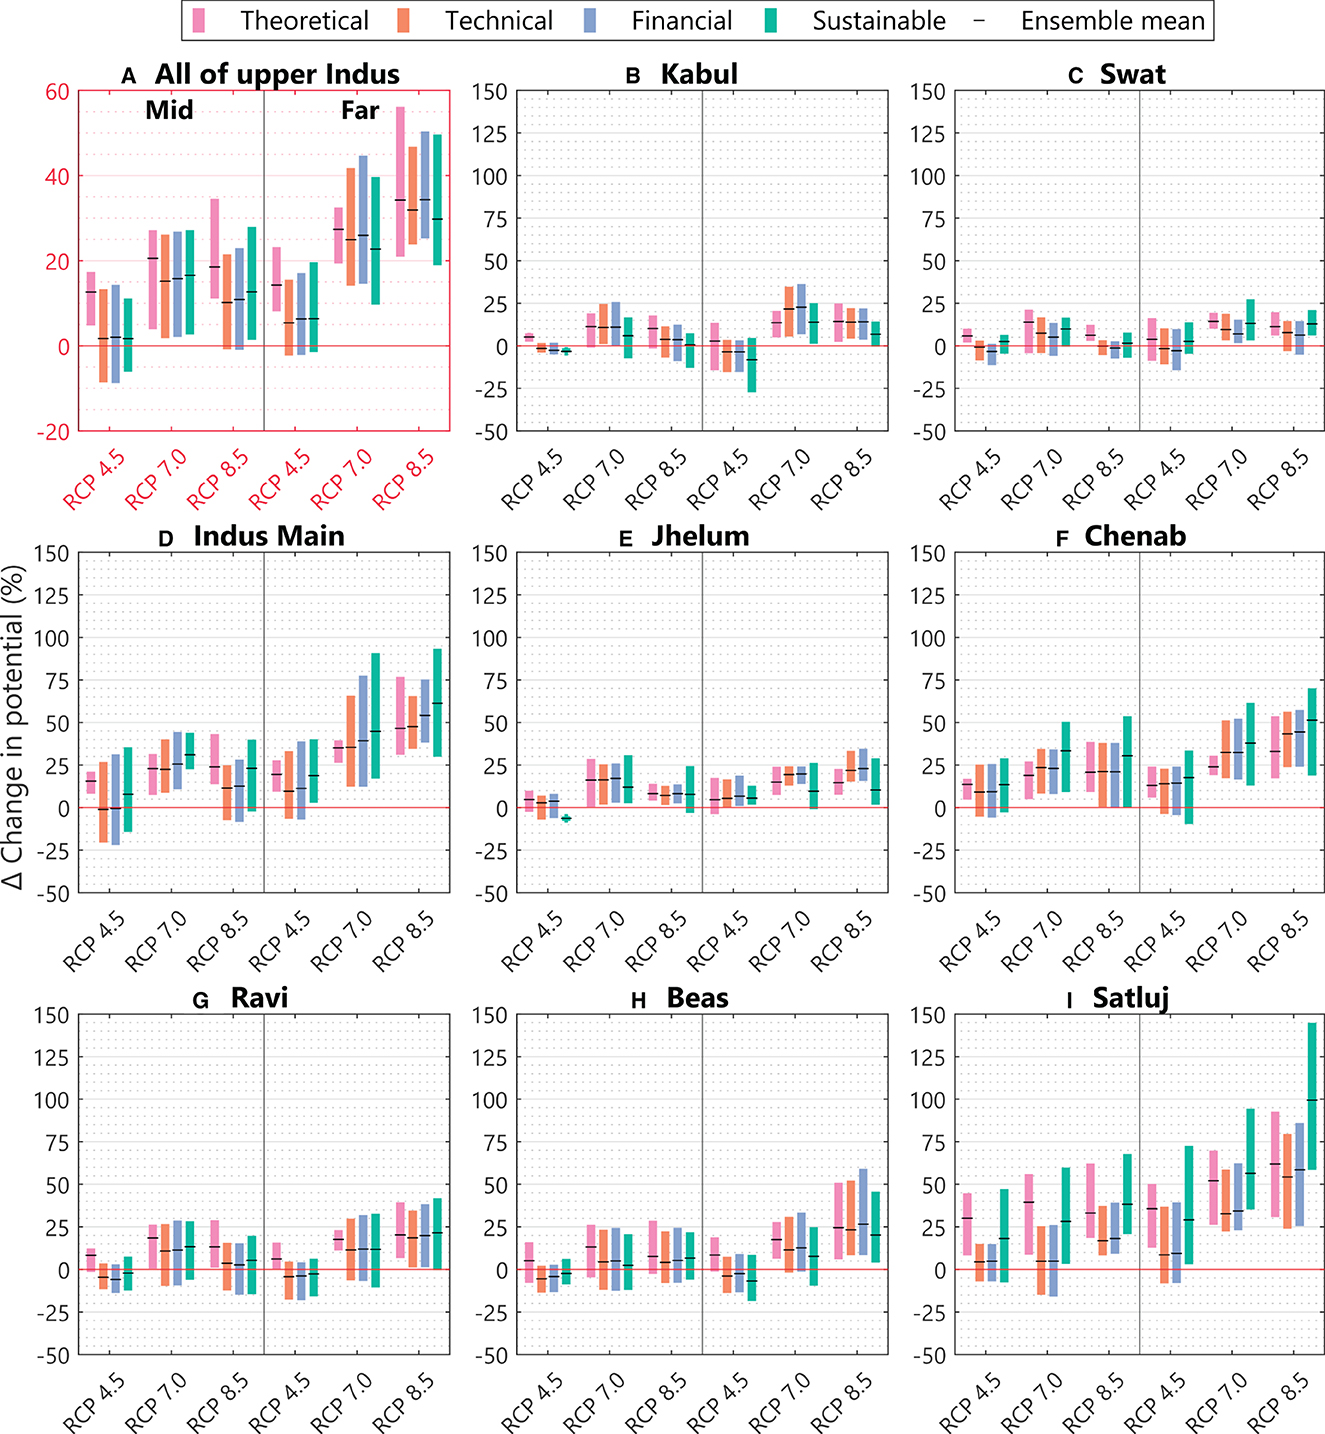
Figure 4. Change in theoretical, technical, financial and sustainable hydropower potential from historical to future scenarios. Panel (A) shows basin-scale changes while panels (B-I) show subbasin changes. The bars show the range in changes between the four climate models for the three RCPs and the two future time horizons. See Appendix A1 for absolute magnitude of each potential.
Higher increases in potential in the southeastern subbasins (Satluj, Beas, Ravi, Chenab and Indus main) are also accompanied by a larger spread across the climate models and the RCPs (Figure 4). This results in the relative change in sustainable potential exceeding that in the theoretical potential which is opposite of the pattern observed at the basin-scale where theoretical potential changes are the strongest. Drastic increases in sustainable potential observed in the Satluj (Figure 4I) and Chenab (Figure 4F) subbasins for RCP 7.0 and 8.5 indicate that there are hotspots with higher discharge variability. Plants in the sustainable potential portfolio may fall in these specific hotspots and have higher change in potential than plants in technical or theoretical potential. The variability and the difference between the four classes of potential are lower in the northwestern subbasins (Kabul, Swat, Jhelum). Overall, the Swat (Figure 4C) subbasin shows the least variability while the Satluj subbasin shows the most variability under climate change.
The change in number and size of RP and DP plants under each potential also shows a similar spatial pattern (Figure 5). Plant size refers to the annual energy generation capacity of a plant. At the basin-scale, future portfolios show high increase in overall RP potential but a small change in the number of RPs. For the DPs, the opposite is observed with a higher increase in the number of DPs (Figure 2). The RP potential changes between -13.5 and -81 TWh yr−1, whereas the change in the number of plants varies between -22–27 only. Alongside, the DP potential changes from -12.4–59.4 TWh yr−1, but the change in the number of plants ranges between -306–3529. We also find that the minimum and maximum plant sizes under the historical and future portfolios remain similar, but the medians vary (Table A1). Due to the steep increase in the number of DPs, the median size does not change notably fluctuating between ±20 %. Meanwhile, for RPs, the plants are getting larger with median plant sizes increasing by 65% under the technical portfolios and ranging between -9.8–33.9 % in the sustainable portfolios (Figure 5A).
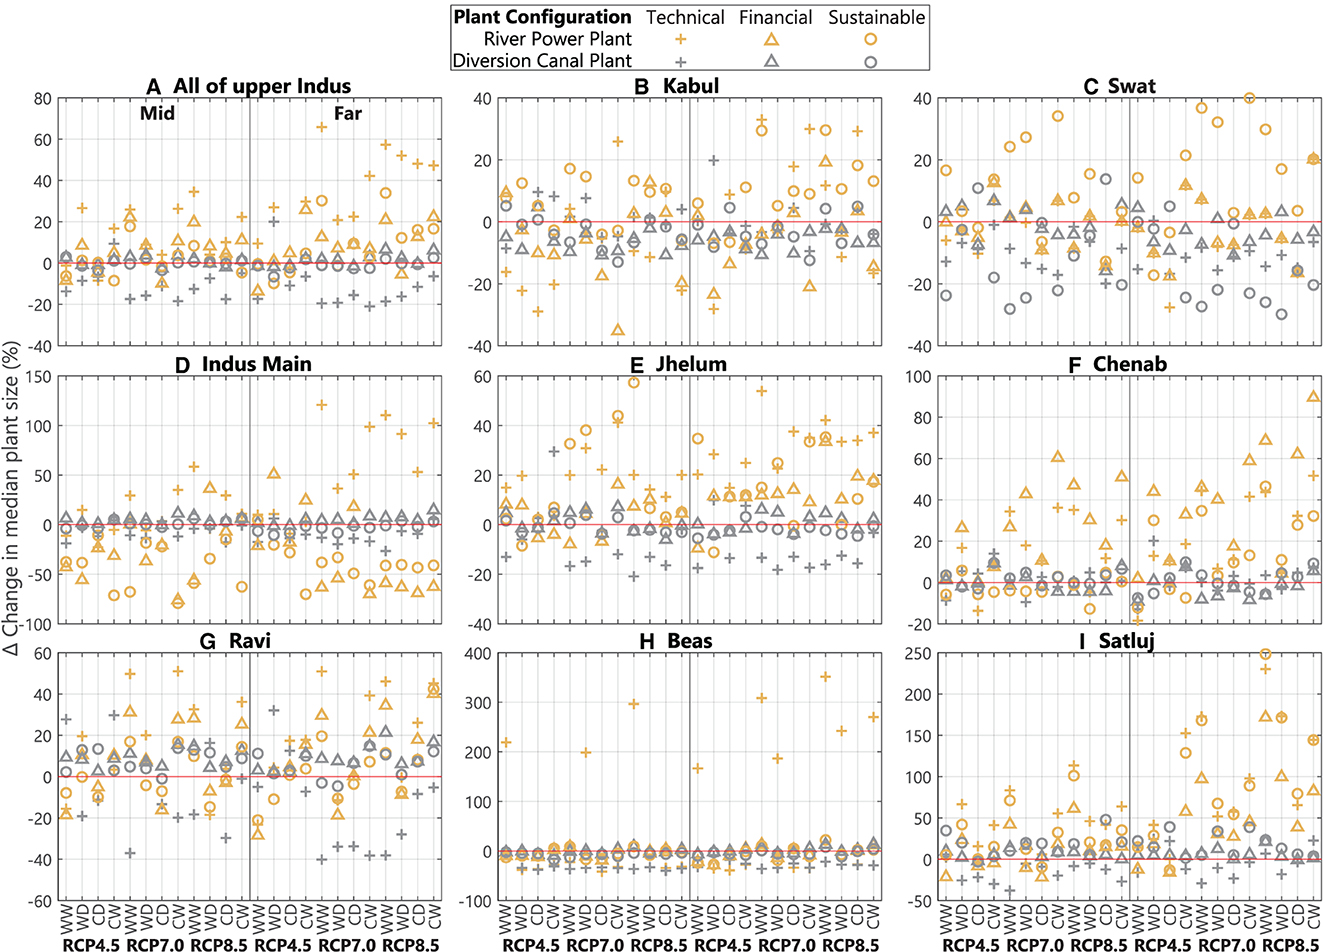
Figure 5. Changes in median plant sizes, i.e., annual average generation, in the future potential portfolios compared to historical portfolio. Panel (A) shows basin-scale changes while the rest show subbasin changes (B–I). The axis limits are not uniform. WW, Warm Wet; WD, Warm Dry; CW, Cold Wet; CD, Cold Dry.
Across the subbasin, changes in median RPs sizes are larger than at the basin-scale, in particular in the southeastern subbasins especially for technical more than sustainable portfolios (Figures 5B–I). The southeastern Satluj and Beas subbasins show the highest change in RP sizes up to 200 % for technical portfolios while DP sizes fluctuate between -40 and -50 %. In the northwestern Kabul, Swat and Jhelum subbasins, RP median sizes vary by ±40 % while DP is mostly decreasing. Meanwhile, RP potential in the Indus main subbasin changes substaintially with decrease up to -60 % while increases are observed only for far-future climates under technical potential. As the largest subbasin in the UIB spanning east-to-west, it is likely that the spatial variability in climate within the Indus main subbasin lowers the median RP sizes. The technical, financial and sustainable portfolios have similar sizes for the northwestern subbasins which indicates that plants of various sizes show similar sensitivity to climate change. This is in contrast with the east where the largest RPs existing only in the technical portfolios emerge as more sensitive than the RPs in the sustainable portfolios.
It is also interesting that as RPs get larger, basin-scale median RP costs decline (-17.5 to -1.9 %) faster than for DPs (-6.6 to -1.1 %) under financial and sustainable portfolios (Appendix A2). However, the changes in cost exhibit a lower spread than the change in sizes. Hence, the northwest-to-southeast difference shows a reduction in cost in the west varying by ±20 % and in the east by ±50 % except for the Indus main subbasin that shows up to +173 % increase in the RP costs with decreasing RP sizes.
4.2 Dependencies between future hydropower and climate
The patterns observed in the future hydropower potential are directly linked to future climate and hydrological changes. We find that the strongest increases in theoretical potential are associated with future discharge scenarios with the strongest increases in precipitation and to some extent with higher temperature (Appendix A3). The relative change in discharge and theoretical potential (< 60 %) is higher than the change in precipitation (< 30 %). Furthermore, the increases in potential are more pronounced for higher elevation (Appendix A4) similar to Gyanwali et al. (2020). This is reasonable for mountainous catchments where the impact of climate change on discharge is expected to be stronger than in lower altitudes due to the combined effect of increased variability in precipitation and changes in meltwater dynamics due to higher temperatures (Ahmad et al., 2012; Cherry et al., 2017; Wasti et al., 2022).
The northwest-to-southeast variance in hydropower potential changes also aligns with the increase in spatial variability in hydro-climatology projected under future climate (Section 2). In Figure 6, the shift in the FDCs show that northwestern basins become more westerlies-driven while southeastern subbasins become monsoon-dominated with declines in discharge only in RCP 4.5. Kabul and other northwestern subbasins experience a stronger increase in low flows due to the increase in winter westerly precipitation or earlier meltwater (Appendix A5). Only limited relative increases in high flows are observed. In contrast, the Satluj and southeastern subbasins experience strong increases in monsoon-driven high flows but only a small increase in low flow similar to Ali et al. (2018). The low flow increase is consistent across all subbasins and the Q80 design discharge increases everywhere (Figure 7). This implies that smaller rivers will have more water to justify small DP development in the future, albeit the discharge may be characterized by high variability. Meanwhile, the Q30 and Q40 design discharges increase more in the southeastern subbasins where large RPs and large DPs sizes are projected to get notably larger. Only in the Indus main subbasin, a consistent decline in Q30 is observed which results in the reduction in the size of large RPs here. Thus, the variability and spatial patterns observed across the historical and future portfolios are strongly linked to climate change.
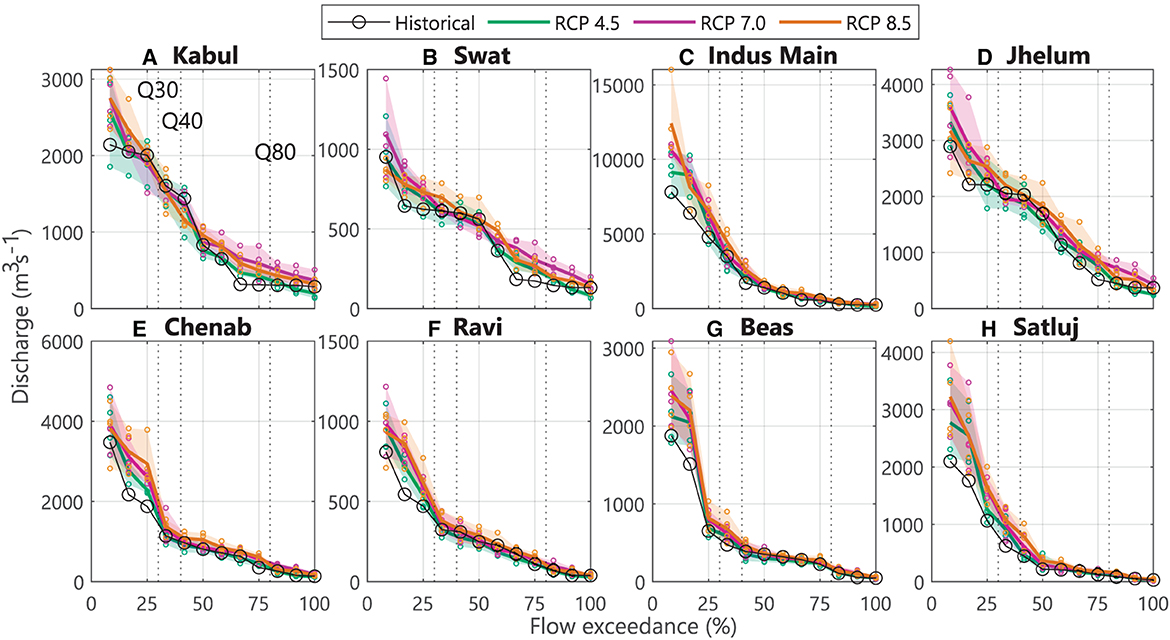
Figure 6. Monthly FDC for discharge at the subbasin outlets in the far-future. Panels (A–H) show FDCs for the eight subbasins. Solid lines show the means while shading shows min-max range for the four climate models for each RCP. The axis limits are not uniform. See Appendix A5 for relative changes between historical and future FDCs.
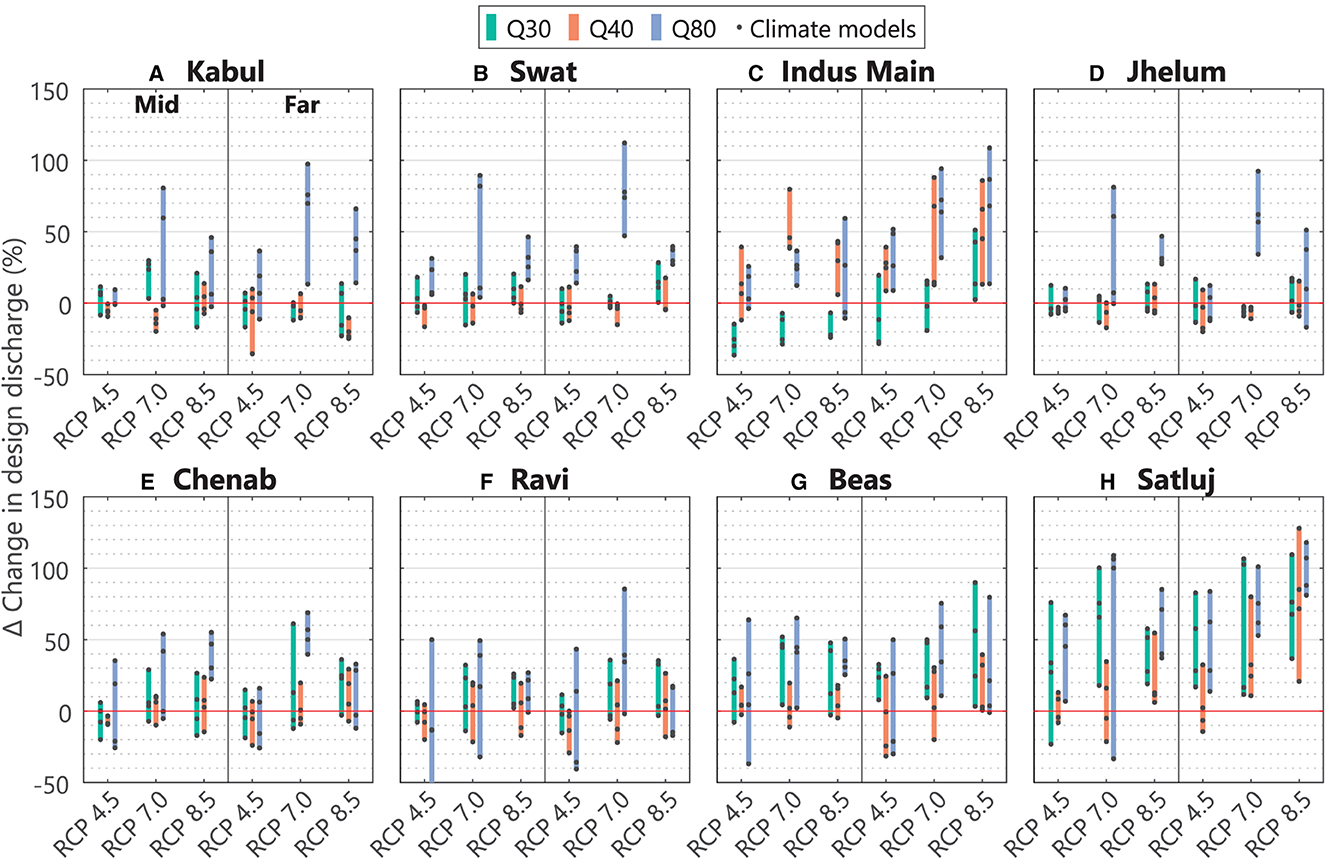
Figure 7. Change in the three design discharges (QXX, flow exceeded xx% of the time) at the subbasins in the future scenarios compared to historical values. Panels (A–H) show changes for the eight subbasins.
4.3 Changes in hydropower performance
The hydropower potential optimized by the HyPE model represents the optimal energy that can be generated under long-term monthly average discharges. In contrast, we evaluate hydropower performance as actual annual generation by these potential portfolios under monthly discharge time series. We find that hydropower potential overestimates actual performance because the mean performance of historical and future portfolios in Table 3 is lower than their respective hydropower potential in Table 2. For technical portfolios, the mean performances across all future scenarios range between 257 – 376 TWh yr−1 while the potential are higher at 274-440 TWh yr−1. Similarly, for sustainable portfolios the mean performances range from 80.5–117.3 TWh yr−1 while potential ranges between 84.9 – 135.3 TWh yr−1. Only for the wet years, represented here by the 90th percentile in Figure 8, the performance is close to the potential. Also, annual production across the portfolios are similar for dry years (10th percentile) than for wet years (90th percentile) because the size of plants in the portfolios vary. The increase in flows in the wet years can only be harnessed by portfolios with larger plants, i.e. portfolios optimized for a wetter future.
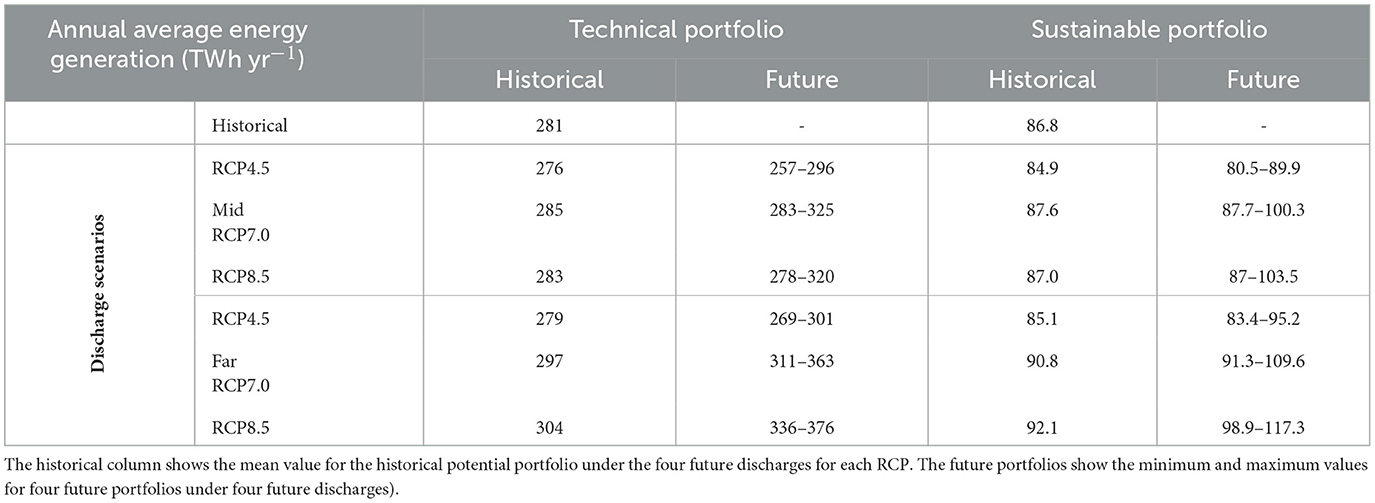
Table 3. Hydropower performance across the historical and future climate scenarios for technical and sustainable portfolios in Figure 9 in terms of mean annual hydropower generation.
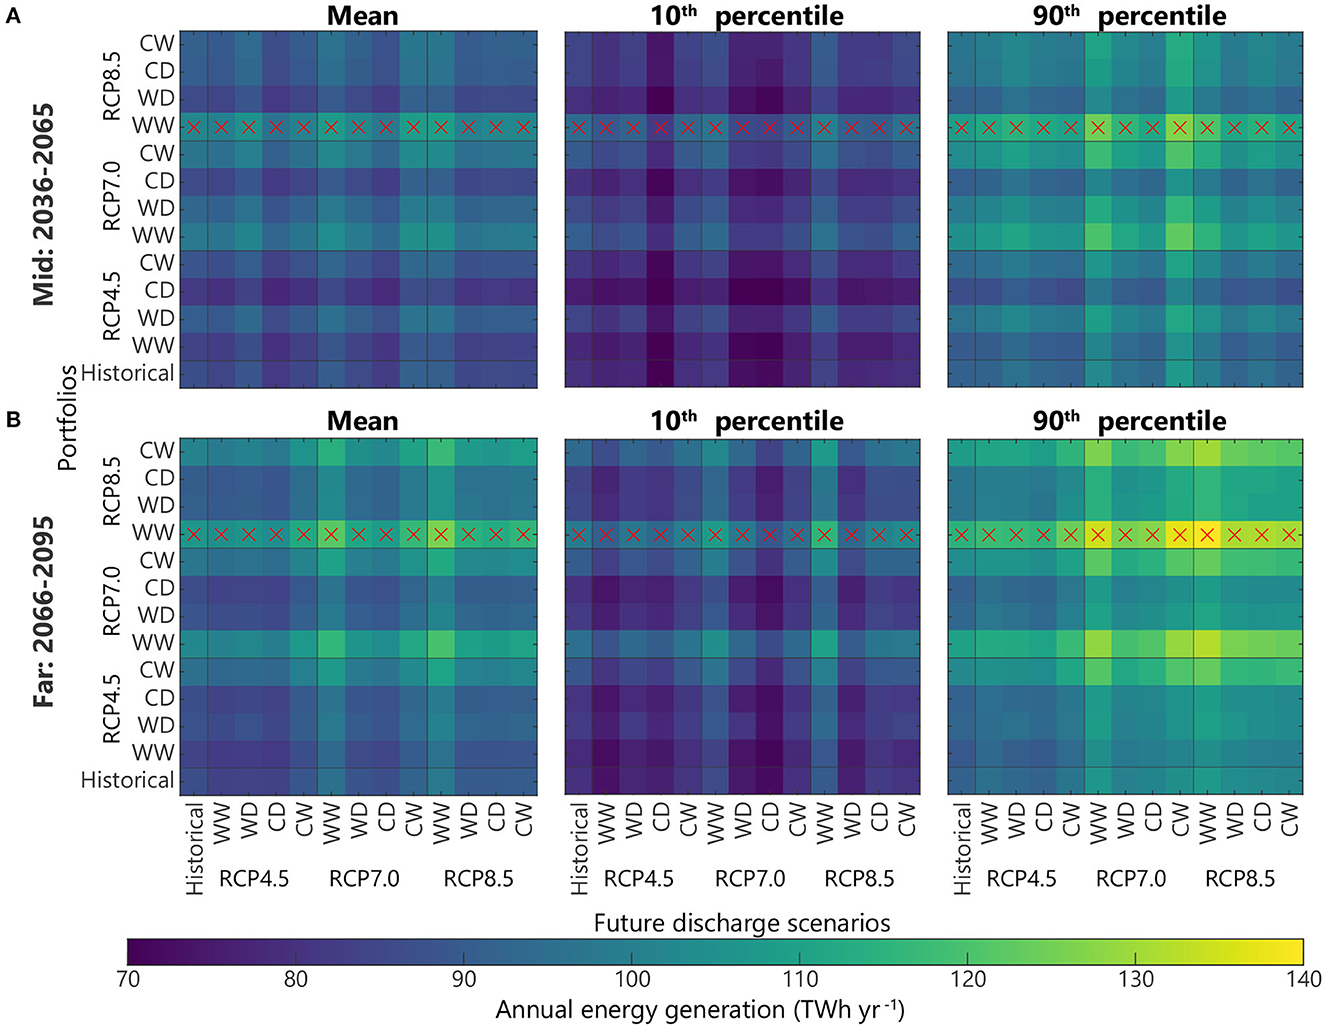
Figure 8. Comparison of mean and extreme (10th and 90th percentile) performance of all sustainable hydropower portfolio under future discharge scenarios in terms of annual energy generation for (A) mid and (B) far future time horizons. WW, Warm Wet; WD, Warm Dry; CW, Cold Wet; CD, Cold Dry. The best performing portfolio under each future discharge scenario is indicated by a ‘×'.
Contrary to our expectations, even the portfolios optimized for a specific future discharge scenario do not emerge as the best performing ones. This observation highlights that the inter-annual variability is inadequately captured in the HyPE optimization based on the long-term monthly average values. Instead, the future portfolios perform better than the historical portfolio, at annual (Figure 8) and monthly (Appendix A6) scale, especially in the far-future and during the wet years. Under the historical discharge, the mean generation of 86.6 TWh yr−1 for the historical sustainable portfolio is exceeded by all the future portfolios that generate up to 117.3 TWh yr−1 in RCP 8.5. Under future discharges, future sustainable portfolios exceed historical portfolio performance by higher values. Mean performance of the future portfolios differ from historical portfolios by -11.1–39.9 %. Historical performance is exceeded by 18.8–39.7 % for the 10th percentile and -6.1–44.4 % for the 90th percentile. The difference in performance between the technical portfolios are a few percentage points lower. The portfolio of the RCP 8.5 Warm Wet scenario performs the best for mean or extreme years, in the mid and far future for both technical and sustainable potential, but it is also the one with the largest standard deviation under each discharge scenario (Appendix A7). Only for the driest future scenarios (e.g. 10th percentile under the mid-future or RCP 4.5 Cold Dry), the future portfolios perform worse than the historical portfolio. Future portfolios from the drier scenarios (Warm/Cold Dry) show similarities to the historical performance as discharge in drier models are closer to historical discharge. Wetter scenarios (Warm/Cold Wet) with more discharge have portfolios with larger plants (Figure 5) that can consistently perform better than the historical portfolios over the years. Annual performance of future portfolios also have a stronger increasing trend than historical portfolios most pronounced for RCP 8.5 scenarios. By the end of the century, the annual technical (sustainable) generation for the historical portfolio ranges between 265–355 TWh yr−1 (82–106 TWh yr−1) with far-future mean growth rate of 1.09 % (1.26 %) per year. The best future portfolio with larger plants easily exceeds this performance reaching 346–450.8 TWh yr−1 (104–140 TWh yr−1) with higher trends during the far-future of 1.12–1.13% (1.29–1.51 %) per year.
The annual hydropower generation time series further demonstrate that the inter-annual variability in performance is determined by climate change. Under the same discharges, the future portfolios are generally able to generate more energy than historical ones indicated by the shifts in the solid ensemble means (Figure 9). However, the spread in energy generation across the portfolios, indicated by the ensemble bands, remain comparable between the historical and future portfolios. Variability increases consistently across all portfolios further into the future. In Figure 9 and Figure A7, the variability in generation is larger between discharge scenarios for one portfolio than between portfolios for the same discharge. Furthermore, sustainable potential portfolios show less variability than technical portfolios for the same discharges. This indicates that climate driven discharge variations are the main driver of variability in generation which may be minimized by the choice of portfolios rather than future discharge scenario. Sustainable portfolios show better climate robustness with higher growth rates and lower variability than technical potential under climate change.
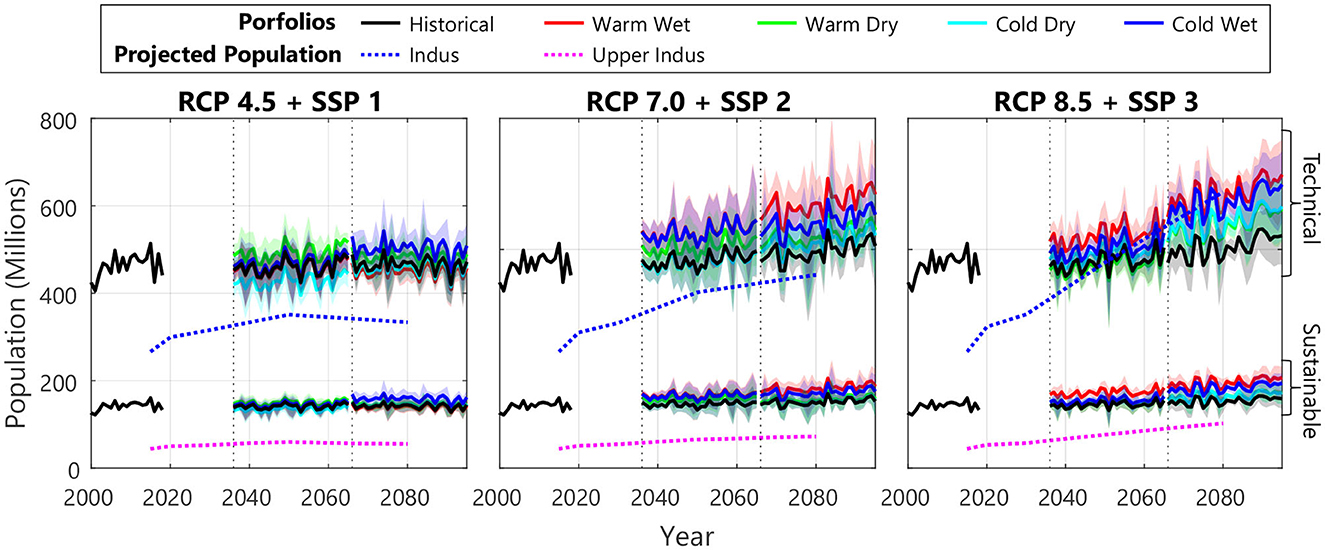
Figure 9. Sufficiency of annual hydropower annual generation by historical and future portfolios in the UIB under different climate change and population scenarios. Each panel compares the energy secure population provided with the minimum energy security requirements by hydropower generation to the projected population (Smolenaars et al., 2021) for the UIB and the Indus basin. Solid line represents the ensemble mean and shading represents the spread for the performance each portfolio under four discharge scenarios for the RCP.
4.4 Changes in energy sufficiency
By the end of the century, the population is projected to be between 55.3-102 million in the UIB and between 334-631 million in the whole Indus basin (Smolenaars et al., 2021). Comparing the energy secure population under future hydropower generation with future population, it is clear that hydropower in the UIB can support the achievement of energy security in the UIB and the whole Indus basin to a far extent (Figure 9). Sustainable potential portfolios can support 133 million people in the historical scenario and 90-247 million people in the future scenarios, which would only be sufficient to fulfill energy security in the UIB. In the RCP 4.5+SSP1, trend in hydropower generation for the technical portfolio is similar to the population growth trend in SSP1 where both increase until the mid-future and decrease in the far-future. In RCP 7.0 + SSP2, the historical technical portfolio can achieve energy security for the Indus basin population, due to climate-driven increases in hydropower generation. However, in RCP 8.5 + SSP3, the basin population growth will exceed generation growth due to which energy security for the entire Indus basin population can only be achieved by the future technical portfolio for the Warm Wet scenarios.
Looking beyond the minimum energy security threshold, across the subbasins in the UIB, future per capita availability of hydropower potential varies inversely with future population (Figure 10). Population and hydropower potential are already unevenly distributed at present. They are projected to diverge further in the future. In the northwestern subbasins (Kabul, Swat and Jhelum) as well as Beas, only decline ≤ -60 % in historical energy availability is projected as population increases faster than subbasin potential, especially in the far-future. Under such projections, the historical per capita technical (sustainable) potential in the Kabul subbasin with the highest population growth will drop from 3.423 MWh yr−1 (1.67 MWh yr−1)-to 0.85 MWh yr−1 (0.35 MWh yr−1) in the far-future for RCP 4.5 Warm Dry. In the southeastern Satluj and Beas subbasins, the reverse effect is observed where low population growth and high increase in monsoon-driven hydropower generation results in the doubling of historical per capita sustainable potential in the RCP 8.5 Warm Wet scenario. In the Indus main and Chenab subbasin, both increases and decreases from ±40 % is observed across the various scenarios.
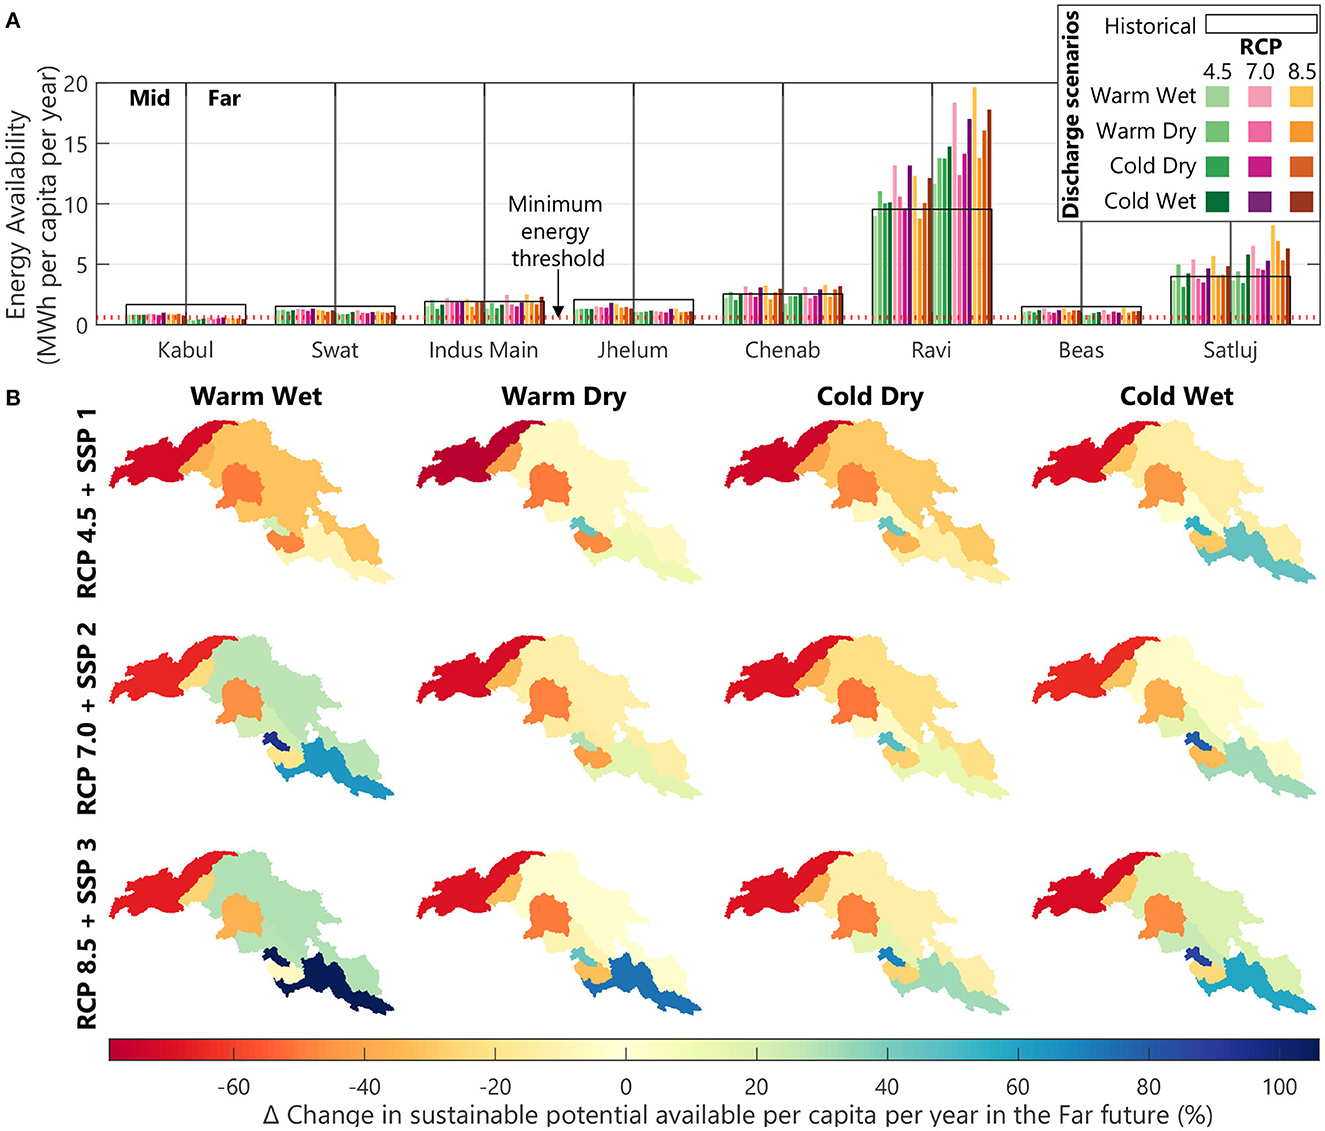
Figure 10. Per capita availability of sustainable hydropower potential in the future. (A) Subbasin values for the future in colored bars overlaid by historical values in overarching black bars. (B) Relative change per capita energy in the far-future RCP+SSP combinations compared to historical availability.
To a far extent, hydropower remains cost-competitive at the basin level though affordability varies across the subbasins. Basin-scale cost curves in Figure 11 summarize the differences observed in the historical and future hydropower portfolios in terms of plant size, plant costs and hydropower potential. In general, more hydropower is available at a lower price farther into the future. The lowest cost is observed for the RCP 8.5 Warm Wet scenario which has some of the largest plants while the highest costs are observed for the RCP 4.5. At the basin level, the cost of fulfilling historical energy demand of 130 TWh yr−1 in 2020 by hydropower will be nearly halved from 0.035 to 0.02 $ kWh−1 by 2080. To meet the 2040 demand in Pakistan, 300 TWh energy could be supplied when the technical potential is realized at less than 0.045 $ kWh−1. By 2080, the highest energy security requirements in the UIB and Indus basin can be met at a lower price with the cheapest future technical portfolios costing < 0.014 $ kWh−1 and < 0.043 $ kWh−1 respectively. Historical technical portfolios will cost similar for serving UIB but significantly higher at < 0.25 $ kWh−1 for serving the Indus basin. However, the decline in costs vary across the subbasins (Figure 12). The southeastern Satluj, Chenab and Indus main subbasins show a higher shift in the future cost curves from the historical ones as well as higher spread than cost curves for the Kabul and Swat subbasins. The Jhelum and Indus main subbasins remain the cheapest basins to develop both the technical and sustainable potential in the future. For the sustainable portfolios, the southeastern Satluj subbasin has the strongest shift in the future cost curve where the costs of the first 5 TWh yr−1 are halved while they remain similar in the northwestern Kabul subbasin. With this, the sustainable potential in the Satluj subbasin becomes cheaper than in the Chenab and Kabul subbasins for the initial 12 TWh yr−1 after which Kabul becomes the third-cheapest subbasin.
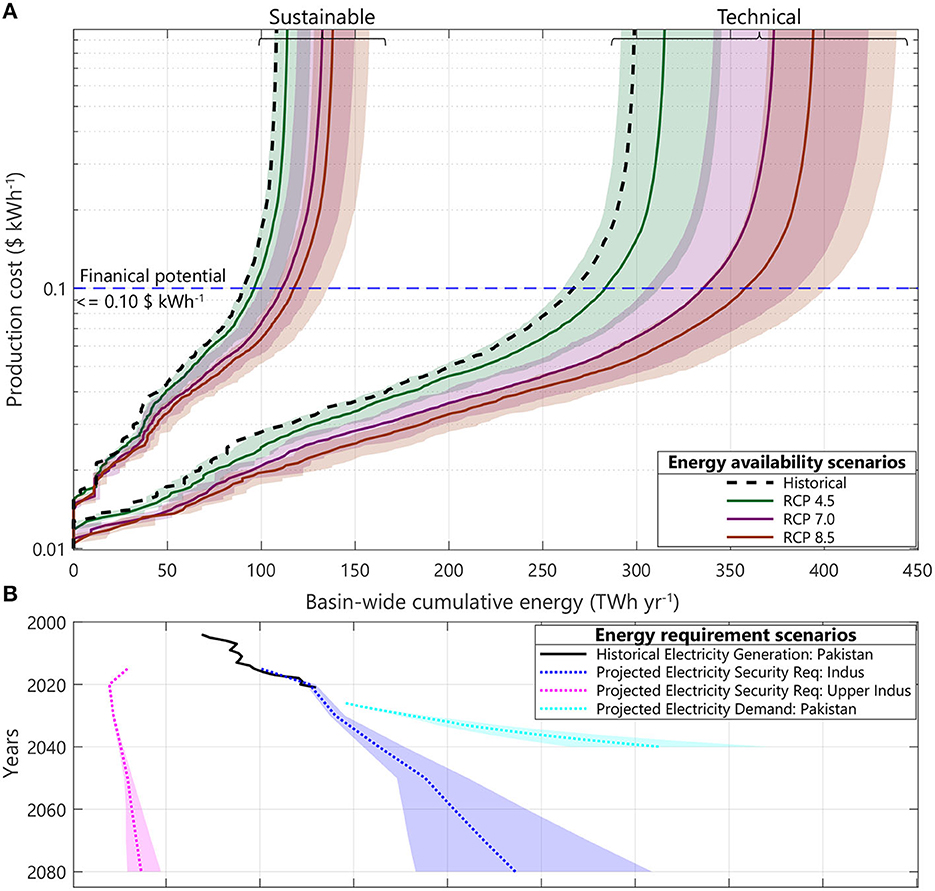
Figure 11. Affordability and sufficiency of historical and future hydropower potential portfolios. (A) Basin cost curves for hydropower supply portfolios. Dotted lines show the cost curve for the historical portfolio. Solid line shows the mean and shading shows the range across the four future discharge scenarios for each RCP in the far-future. (B) Projected future energy requirements for fulfilling minimum household electricity security requirements from Smolenaars et al. (2021) and historical and future electricity demand for Pakistan from NTDC (2019). Dotted lines show values for the intermediate scenario and shading shows the range across three scenarios available in both data sources.
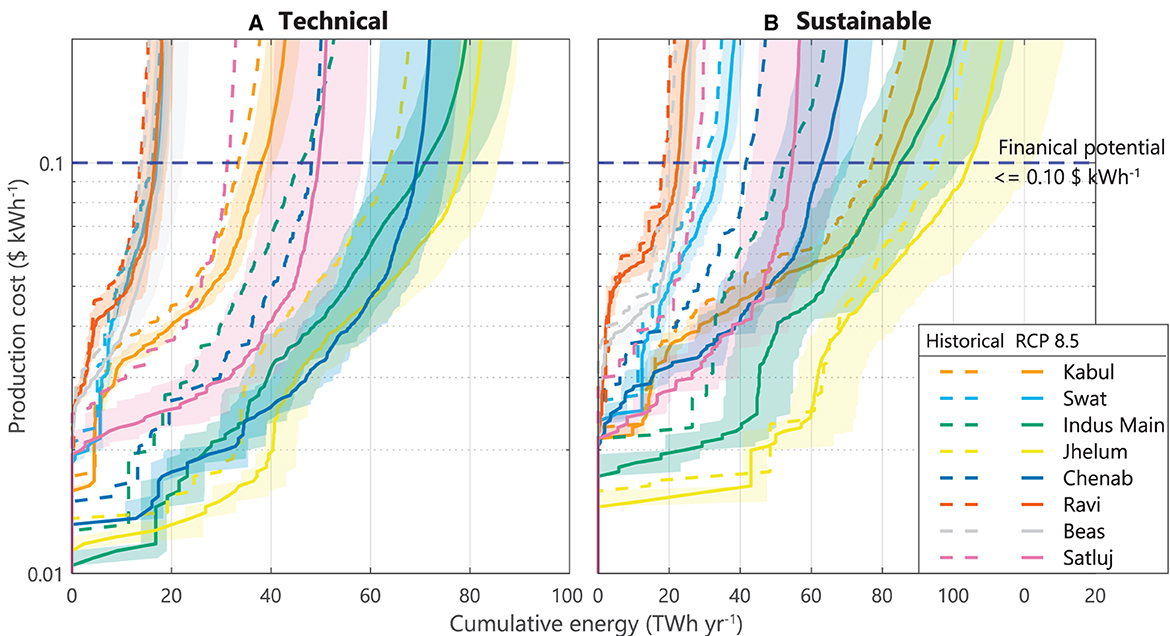
Figure 12. Shift in the subbasin hydropower cost curves for RCP 8.5 in the far-future for (A) Technical and (B) Sustainable potential classes. Dotted lines show the cost curve for the historical portfolio. Solid line shows the mean and shading shows the range across the four future scenarios.
5 Discussion
5.1 Comparison with other studies
Our assessment presents the first high-resolution, basin-scale quantification of hydropower potential in the Indus basin under multiple future climate scenarios also accounting for future socio-economic changes and the associated growth in energy demand. The direction and spatial pattern of future changes in hydropower potential found in our study are consistent with studies at global, basin and plant scale. However, the changes we identify are generally larger. The increase in the theoretical hydropower potential we observe are consistent with those reported for South Asia in coarser global studies (Hamududu and Killingtveit, 2012; Labriet et al., 2015; van Vliet et al., 2016a; Zhang et al., 2018; Paltán et al., 2021). At the basin-scale, technical and financial potential change percentages in Table 2B indicate slightly higher values compared to those reported for Asia-Pacific by Gernaat et al. (2021) in the mid-future scenario (-12.1 to -10.3%). Furthermore, our changes for the far-future scenario are significantly higher compared to the reported values (-12.5 to -25.8%). At the subbasin scale, global studies (Hamududu and Killingtveit, 2012; van Vliet et al., 2016a; Zhang et al., 2018) also support our findings of the northwest-to-southeast spatial pattern reporting increases in potential in the east (>20%) and decreases in the west (>-20%). Plant-scale studies in the northern Kabul subbasin [0.36–4.08 % in Yousuf et al. (2017), Casale et al. (2020)] also reported lower changes in the future hydropower generation of existing plants than that in the eastern Beas [-5 to 40 % in Shirsat et al. (2021)] and Satluj [0.82–36 % in Ali et al. (2018), Chuphal and Mishra (2023)] subbasins under climate change.
Lack of standardization of the definition of hydropower potential classes and methodological differences related to the climate models, the hydrological input and assumptions on design discharge thresholds complicate the comparison between different studies. The higher magnitude we observe are plausible given the wetter projections in the CMIP6 climate model ensemble and the improved discharge simulation (Khanal et al., 2021). Made to our use of a high spatial resolution coupled cryosphere-hydrological model provides significant improvement to the representation of cryospheric processes in the simulation of discharge in the upper Indus basin which are poorly represented in global models (Momblanch et al., 2019; Khanal et al., 2021).
5.2 Limitations
The hydropower portfolios we identify are an important starting point for hydropower development planning. However, our approach based on a cost-minimisation algorithm includes several simplifications and assumptions to conduct a desktop exploration of hydropower potential. Our simulation of both hydropower potential and performance assumes constant efficiencies. In reality, turbine performance, hydropower generation and transmission are dynamic processes whose efficiencies vary with discharge, tailwater elevation, reservoir level and head. Turbines also have minimum flow thresholds for operation, but we only explicitly represent the maximum thresholds in terms of design discharges. These simplifications overestimate the actual generation but provide sufficient evidence to rank sites across the basin under multiple criteria.
Furthermore, there are uncertainties in the estimation of hydropower generation that propagate from climate and hydrological models. Hydro-climatic models are known to have high uncertainties in simulating the climate and hydrology in data-scarce mountainous regions such as the HMA due to complexities in capturing the cryospheric processes, orographic effects and monsoon dynamics (Ahmad et al., 2012; Nie et al., 2021; Wasti et al., 2022). At a global scale, Gernaat (2019) find that climate models are a greater source of uncertainty than hydrological models for hydropower simulation. Cherry et al. (2017), Schaefli et al. (2019) and Turner and Voisin (2022) highlight uncertainties in discharge simulation by hydrological models as a key bottleneck in hydropower assessment, particularly when working at finer spatio-temporal resolution. In our hydropower potential analysis, the uncertainty in the climate projections is demonstrated by the range in the hydropower cost curves seen in Figure 11 for the different climate scenarios. Alongside, Figure 9 contrasts the inter-annual and intra-annual variability in hydrological simulation even within individual climate scenarios. Innovations in cryosphere-hydrology modeling remain necessary to improve the hydrological models to capture the variability in discharge in the UIB (Momblanch et al., 2019; Orr et al., 2022). For instance, although the SPHY model we use is superior in its representation of small scale cryosphere-hydrology processes than discharge simulation methods used in most hydropower studies, it remains weak in its representation of permafrost and snowmelt dynamics (Lutz et al., 2016a; Khanal et al., 2021). Similarly, an ensemble of hydrological models can be used alongside climate models to explore the relative uncertainty added by climate vs. hydrological models for the UIB context.
This paper focused on the uncertainty in future hydropower potential related to the spread in future climate projections. However, there are also uncertainties stemming from the accuracy of the various input datasets used in the HyPE. Uncertainty in these input datasets primarily derived from other studies are largely unknown. Hence, it is infeasible to quantify how these uncertainties may propagate to our hydropower potential estimates and this should be a topic for future studies. We argue, however, that the inclusion of these data into the assessment of hydropower potential assessment is a significant step forward compared to earlier studies where many of these constraints were not systematically addressed.
Although increasing average discharge is positive for hydropower generation, climate change is also expected to increase the hydrological and cryospheric geo-hazard risks (Chapagain et al., 2021; Li et al., 2022; Wasti et al., 2022). Our study on hydropower potential based on annual generation only addressed annual extremes. We did not find notable differences in the long-term average performances. However, differences may emerge when analysing dry and wet months separately (Arias et al., 2020; Mishra et al., 2020) or exploring extreme flows (Paltán et al., 2021). We also observe the impact of deglaciation on discharge in RCP 4.5 where Warm Dry scenario portfolios perform better than Warm Wet portfolios in the mid-century, however the hydropower generation declines from mid to far future as glacier melt declines (Figure 9). Nevertheless, increases in discharge under deglaciation may not always lead to increasing hydropower generation, because plants will spill the additional discharge above their design discharge threshold. The spatio-temporal variation in the role of glaciers for hydropower generation across the UIB subbasins can be disaggregated by evaluating the contribution of different water balance components to hydropower generation (Schaefli et al., 2019) and the change in areas available for hydropower due to glacial melting (Farinotti et al., 2019). We also do not represent the change in future risk of compounding cryospheric geo-hazards like GLOF, landslide and other mass movement that pose structural risks to hydropower infrastructure or their daily operation (Schwanghart et al., 2016; Li et al., 2022). Deglaciation will also increase sediment fluxes and subsequent geo-hazards that are poorly understood (Cherry et al., 2017; Wasti et al., 2022) and not represented in HyPE. Advances in modeling the sediment dynamics and their integration in HyPE could produce more accurate assessment of geo-hazard risks than using historical susceptibility maps.
Our study expands the scope of hydropower exploration by integrating the HyPE model with climate projections, thus incorporating future climate considerations into hydropower decision-making processes. However, besides climate, other factors represented in HyPE will also change in the future. For instance, the cost of hardware, labor or resettlements will vary which will affect the DP and RP costs differently (Dhaubanjar et al., 2023). Furthermore, changes in current land use and expansion of road and transmission networks will alter the cost-competitiveness of hydropower development in currently remote areas. In order to isolate the impact of climate change on hydropower potential, we use the same cost functions and maps for land use and infrastructure extents in the cost minimization for historical or future hydrology. While future costs may change with inflation, hydropower projects also have high risks for cost overruns, especially for large projects (Ansar et al., 2014). Similarly, from socio-hydrological perspective, our use of the current aspirations of local stakeholder for hydropower development in the future is debatable. Changes in socio-political preference for configuration and size of hydropower plants over time will affect the hydropower potential (Dhaubanjar et al., 2023). Hence, further scenario analysis that include these evolving socio-economic factors is necessary to understand if they amplify or attenuate the spatially varying impact of climate change on hydropower potential across the UIB.
5.3 Implications for hydropower development
Our quantification shows that future climate will have varied impact on hydropower potential in different parts of the basin, as well as on different plant configurations. We also demonstrate that using future climate and hydrological projections in the present-day design of hydropower portfolios improves their performance under a broad spectrum of climate scenarios when compared to portfolios based on historical hydro-climatology. Hence, the hydropower development policies of riparian countries in the UIB should require the use of future projections for selecting the design discharges when sizing hydropower plants, at the national or the individual plant scale. Design discharge is one of the most sensitive parameters in potential assessment in the UIB (Yousuf et al., 2017; Dhaubanjar et al., 2023) and elsewhere (Gernaat et al., 2017). Our analysis demonstrates that using design discharge based on historical discharge results in under-designed systems for the wetter futures that appear more likely in our projection ensembles. Furthermore, given the variation in projections across different climate scenarios, it is also important that policies require the use of multiple scenarios considering a larger variety of plausible climates to consider the uncertainty in future hydro-climatic projects in hydropower design decisions.
The current absence of a fixed design discharge threshold for hydropower sizing in the UIB countries is a favorable policy that should be maintained into the future. Nonetheless, three thresholds we select, Q40/Q80 for small/large DP and Q30 for large RP, are based of the stakeholder preferences for design discharges (Dhaubanjar et al., 2023). Some of these preferences should be reconsidered. DP plants will be undervalued by the use of historical Q40 and Q80 in most subbasins as discharges increase in the future (Figure 7). In particular, using future Q80 adds many small DPs to the portfolios (Figure 2). As low flows generally increase throughout the subbasins, a higher discharge should be for considered for small DPs especially in the northwestern subbasins. For instance, using a Q70 threshold will lower the number of small DPs but increase the median size of DP in future portfolios and increase the capacity to harness the increase in future flows throughout the year. Other plant-scale studies also confirm that existing plants become undersized for the higher discharges projected for the future in Kabul (Casale et al., 2020), Indus main (Mishra et al., 2020) and Beas (Shirsat et al., 2021) subbasins. In contrast, the Q40 and Q30 thresholds appear sufficient to harness the increasing future discharge. While median RP sizes are increasing in the portfolios, using higher discharge thresholds is not recommended as high flow plants also show higher generation variability as also obsereved by Mishra et al. (2020) and Shirsat et al. (2021). In addition, larger plants come with larger financial, governance, operational and environmental sustainability challenges (WCD, 2000; Sovacool et al., 2011; Siciliano et al., 2018). In fact, the cost reductions observed in the future for RP projects may be reversed by cost overruns typical of large RPs (Ansar et al., 2014; Lord et al., 2020).
The spatial variation in climate change impact across and within the subbasins of the UIB will be best harnessed by a combination of plants of different configurations and sizes. It is alarming that the Indus main subbasin, where nearly all large plants visualized for the future lie (Figure 2) is also where Q30 is declining in multiple future scenarios (Figure 7). Many of these are planned to support peak production through large RP or large DP configurations. However, large plants may be better off in southeastern subbasins where higher increases in Q30 are projected in the future than for the Indus main subbasin. This example highlights the need to diversify from the current technocratic biases focusing on large projects on the Indus main subbasin (Akhter, 2015; Harlan and Hennig, 2022) when our analysis reveals many other viable locations for hydropower development that can benefit from climate change. The winners and losers that emerge from the northwest-to-southeast variation in climate change can be cast into a win-win situation everywhere by setting design discharges beyond the three thresholds and considering a variety of plant configurations. That high and low flows change differently across the subbasin also implies that low flow dominant areas are better suited for developing base-load plants while high flow dominant areas can be used for peak-load plants.
Given the positive future for hydropower in the UIB, it is also timely to establish more stringent policies for ensuring environmental conservation while promoting hydropower development. We show that maintaining protected areas and high thresholds for e-flows remains possible into the far-future alongside increase in sustainable potential, especially in the southeastern subbasins. Analysis of river fragmentation and changes to ecological indicators of flow alteration or richer dataset on biodiversity can be added to HyPE to further strengthen the representation of environment in hydropower planning (Annandale and Hagler Bailly, 2014; Grill et al., 2019). Feasibilty of environmentally friendly hydropower plant configurations should be explored further in the hotspots of climate change (Opperman et al., 2022). Moreover, as the cost of hydropower plants decreases in the future, it becomes more feasible to implement and enforce higher compensatory measures to address environmental damage, land use conflicts, and human resettlement challenges. With the promising increase in hydropower potential anticipated under climate change, there is ample room to address these externalities (WCD, 2000; Annandale and Hagler Bailly, 2014) comprehensively from the outset.
5.4 Implications for energy security
While hydropower supply potential is increasing in the UIB, there is a spatial mismatch in areas with increasing hydropower potential and increasing energy demand in the future under climate and socio-economic changes. In the northwestern subbasins, we observe a decline in historical energy availability while in the southeastern subbasins, except Beas, we observe an increase. Alarmingly, in Kabul subbasin, the energy availability drops below the minimum energy security threshold for energy sufficiency. While the UIB appears energy self-sufficient with enough sustainable potential available to fulfill energy security, within the UIB subbasins the availability and affordability of hydropower varies. Moreover, the spatial distribution of sustainable potential is more uneven than technical potential indicating that there is spatial difference on the likelihood of a subbasin to fulfill its demand sustainably. Hence, achieving energy security sustainably within the UIB may require cross-border energy trade across the riparian countries to minimize the impact of the northwest-to-southeast variation in future hydropower potential on energy. Although achieving cooperation among the riparian countries for cross-border energy trade is challenging under existing hydro-politics, it can yield mutual benefits when considering the shared use of energy and water to enhance energy, water, and food security throughout the entire Indus basin (Vinca et al., 2021; Smolenaars et al., 2023).
In addition, it is also pertinent to examine the upstream-downstream linkages created by hydropower available in the UIB to fulfill demands not only within the UIB but also downstream in the LIB. Developing the technical potential in the UIB to generate energy for the LIB will ensue environmental impacts and increase exposure to geo-hazard risks. Subbasins with low proportion of sustainable potential are thus also areas more susceptible to environmental degradation and conflicts arising from competing water and land use among various stakeholders. An important question thus raised is who is bearing the risk and who is reaping the benefits of future hydropower potential in the UIB (Di Baldassarre et al., 2019; Lord et al., 2020; Levenda et al., 2021). Under the existing uneven spatial distribution of development and political power between and within the riparian countries (Akhter, 2015), it is crucial to consider how the northwest-to-southeast pattern of hydropower potential under climate change may be utilized unjustly (Melsen et al., 2018). The high willingness to pay of urban energy demand centers in the LIB may result in the exploitation of cheaper technical rather than sustainable potential in UIB subbasins. In practice, existing transmission grids primarily facilitate the transfer of hydropower from the UIB to the LIB within the respective riparian countries and there is no hydropower trade between the UIB subbasins governed by different countries. Hence, the UIB and LIB shares of the respective riparians are more interconnected and will share resources than subbasins across countries. To minimize the unintended socio-political and environmental consequences of hydropower development, governance interventions are first necessary to encourage investments in sustainable hydropower considering the upstream-downstream linkages within each riparian country and then the northwest-to-southeastern pattern between countries. National water sharing accords could be expanded to ensure sustainable utilization and equitable sharing of water and hydropower potential within the upstream-downstream regions. Analysis of the political ecology of hydropower development in the transboundary UIB can help identify locally relevant interventions to promote sustainable and equitable hydropower development in the basin.
Furthermore, the extent to which energy security and self-sufficiency may be achieved through sustainable hydropower depends on the spatio-temporal changes in future energy demand and the availability of other energy sources. The energy security requirements considered here only account for a fraction of the of actual energy demand projected for the basin (Figure 11B). In 2020, the annual energy consumption in the riparian countries followed an increasing northwest-to-southeast pattern with Pakistan having lower demand than India at 0.5 and 0.93 MWh per capita per year respectively (IEA, 2023). If per capita demands in the southeastern subbasins also remain higher than in the northwestern subbasins in the future, our projections for hydropower availability may not be alarming. Temporally, in Pakistan energy demand currently peaks in the summer months of May-August which aligns with current peaking in discharge and subsequently hydropower generation (NTDC, 2019). As discharge peaks vary with climate change, it is important to assess whether energy demand patterns still remain in-phase with hydropower generation under the future climate. The difference in seasonality of energy demand and hydropower supply will also affect how hydropower potential can be utilized equitably and sustainably (Arias et al., 2020; Qin et al., 2020b). Currently, hydropower represents about 25 % of the national energy generation mix in Pakistan (NTDC, 2019, 2022). In Figure 11, the sustainable portfolio in the UIB can meet up to 36.4 % of the 2040 forecasted demands for Pakistan. If energy demand remains synchronized with discharge and fund allocation for renewable energy increases, RoR hydropower portfolios identified here in the UIB will be key for achieving energy self-sufficiency without storage hydropower plants.
To this end, our hydropower portfolios and cost curves can be used directly in national energy planning models to identify hydropower development pathways that balance the share of hydropower in the national energy mix to fulfill energy security. Trade-offs will also have to be made between environmental footprint of using domestic coal reserves or technical hydropower potential as socio-economic development increases energy demands above sustainable potential across the Indus basin. Alongside, energy system studies should also consider demand-side management scenarios to improve energy use efficiency simultaneously with expansion of supply options. This is even more imperative when considering hydropower development in the UIB within the context of the water-energy-food-environment nexus because water scarcity will increase in the future with measures to achieve water and food security (Smolenaars et al., 2023). National energy planning models thus needs to also assess where hydropower development fits in achieving water, energy and food security simultaneously in fulfilling the SDGs in the future (Schaefli, 2015; Zhang et al., 2018).
6 Conclusions
This study combined downscaled CMIP6 climate projections with hydropower modeling to assess the future potential of hydropower in the Indus basin and its ability to meet changing energy demands. We show that all four classes of hydropower potential (theoretical, technical, financial and sustainable) is projected to increase under the majority of climate change scenarios, with variations across the basin and subbasins in terms of magnitude and portfolio characteristics (plant sizes, configurations and costs). Historical theoretical potential of 1565 TWh yr−1 increases by 3.9–56 % while technical potential at 300 TWh yr−1 changes between -2.3–46.8 %, financial potential at 266 TWh yr−1 between -8.8–50.4 % and sustainable potential at 90 TWh yr−1 between -6.1–49.7 %. Only RCP 4.5 shows some decline. The monsoon-dominated discharge in the southeastern subbasins results in stronger increases in hydropower potential, larger plants that have lower costs and higher variability in the future than in the westerlies-dominated northwestern subbasins. Such spatial differences highlight the importance of a high-resolution localized assessment of hydropower potential. We also confirmed our hypothesis that using future hydro-climatology improves hydropower planning by designing plants that utilize the spatially varying impacts of climate change. Additionally, sustainable potential portfolios are more stable than technical portfolios under climate change with higher increases in performance and lower variations over time.
The sufficiency of the increasing hydropower potential depends on the future changes in energy demands. While the sustainable potential can contribute to energy security within the basin, meeting downstream energy needs will require development beyond sustainable potential, which comes at the risk of conflict with other water and land users, including the environment, and higher exposure to geo-hazard risks. The spatial mismatch between increase in potential and population growth further increases the disparity in energy self-sufficiency between the southeastern and the northwestern subbasins of the Indus basin. The Satluj subbasin shows a consistent increase in per capita potential while the Kabul subbasin shows a decline even in the wettest future. The spatial disparities in availability, affordability and sufficiency of hydropower potential add complexity to the upstream-downstream and transboundary resource sharing in the Indus basin. A socio-hydrological approach is necessary to ensure sustainable and equitable development and allocation of hydropower potential within and across the riparian countries. Our hydropower cost curves provide an initial step toward identifying the hydropower development pathways in the Indus basin, revealing optimal locations, size and configurations for plants. Ultimately, the realization of these hydropower portfolios within the overall energy supply mix will depend on riparian countries' aspirations for energy self-sufficiency, equitability, sustainability, carbon neutrality and energy demand management.
Data availability statement
Publicly available datasets were analyzed in this study. Ready to use input data, model setup and model outputs are available at:
- Model files: 10.5281/zenodo.10204322
- Preprocessed input data for model: 10.5281/zenodo.10234264
- Downloadable model outputs: 10.26066/rds.1973697
- Interactive model outputs: http://geoapps.icimod.org/IKPP/Hydropower
Author contributions
SD: Conceptualization, Data curation, Formal analysis, Investigation, Methodology, Software, Validation, Visualization, Writing—original draft, Writing—review & editing. AL: Conceptualization, Funding acquisition, Methodology, Project administration, Supervision, Validation, Writing—original draft, Writing—review & editing. WS: Conceptualization, Formal analysis, Methodology, Visualization, Writing—review & editing. SK: Software, Writing—review & editing. MJ: Conceptualization, Methodology, Writing—review & editing. HB: Conceptualization, Funding acquisition, Project administration, Writing—review & editing. FL: Conceptualization, Funding acquisition, Project administration, Writing—review & editing. AS: Conceptualization, Funding acquisition, Methodology, Project administration, Supervision, Validation, Writing—review & editing. WI: Conceptualization, Funding acquisition, Methodology, Project administration, Supervision, Validation, Writing—original draft, Writing—review & editing.
Funding
The author(s) declare financial support was received for the research, authorship, and/or publication of this article. This research conducted under the SustainIndus project has received funding from the Nederlandse Organisatie voor Wetenschappelijk Onderzoek (NWO) or the Dutch Research Council under the WOTRO Joint Sustainable Development Goals (SDG) research program (Grant W 07.30318.002). This work was also partially supported by Sustainable Development Investment Portfolio (SDIP), the Department of Foreign Affairs and Trade (DFAT), Government of Australia, the Swiss Agency for Development and Cooperation (SDC), and by core funds from ICIMOD contributed by the governments of Afghanistan, Australia, Austria, Bangladesh, Bhutan, China, India, Myanmar, Nepal, Norway, Pakistan, Switzerland and the United Kingdom.
Conflict of interest
The authors declare that the research was conducted in the absence of any commercial or financial relationships that could be construed as a potential conflict of interest.
The reviewer AO declared a past collaboration with the author SD to the handling editor.
Publisher's note
All claims expressed in this article are solely those of the authors and do not necessarily represent those of their affiliated organizations, or those of the publisher, the editors and the reviewers. Any product that may be evaluated in this article, or claim that may be made by its manufacturer, is not guaranteed or endorsed by the publisher.
Supplementary material
The Supplementary Material for this article can be found online at: https://www.frontiersin.org/articles/10.3389/frwa.2023.1256249/full#supplementary-material
References
Ahmad, Z., Hafeez, M., and Ahmad, I. (2012). Hydrology of mountainous areas in the upper Indus Basin, Northern Pakistan with the perspective of climate change. Environ. Monit. Assess. 184, 5255–5274. doi: 10.1007/s10661-011-2337-7
Akhter, M. (2015). Dams as a climate change adaptation strategy: geopolitical implications for Pakistan. Strateg. Anal. 39, 744–748. doi: 10.1080/09700161.2015.1090680
Ali, S. A., Aadhar, S., Shah, H. L., and Mishra, V. (2018). Projected increase in hydropower production in india under climate change. Sci. Rep. 8, 12450. doi: 10.1038/s41598-018-30489-4
Almeida, R. M., Fleischmann, A. S., Brêda, J. P., Cardoso, D. S., Angarita, H., Collischonn, W., et al. (2021). Climate change may impair electricity generation and economic viability of future Amazon hydropower. Glob. Environ. Chang. 71, 102383. doi: 10.1016/j.gloenvcha.2021.102383
Almeida, R. M., Schmitt, R. J., Castelletti, A., Flecker, A. S., Harou, J. J., Heilpern, S. A., et al. (2022). Strategic planning of hydropower development: balancing benefits and socioenvironmental costs. Curr. Opin. Environ. Sustain. 56, 101175. doi: 10.1016/j.cosust.2022.101175
Annandale and Hagler Bailly. (2014). Strategic Environmental Assessment for Hydropower in Azad Jammu and Kashmir. Pakistan, Islamabad: IUCN.
Ansar, A., Flyvbjerg, B., Budzier, A., and Lunn, D. (2014). Should we build more large dams? The actual costs of hydropower megaproject development. Energy Policy 69, 43–56. doi: 10.1016/j.enpol.2013.10.069
Arenson, L. U., Harrington, J. S., Koenig, C. E., and Wainstein, P. A. (2022). Mountain permafrost hydrology—a practical review following studies from the Andes. Geosci. 12, 48. doi: 10.3390/geosciences12020048
Arias, M. E., Farinosi, F., Lee, E., Livino, A., Briscoe, J., and Moorcroft, P. R. (2020). Impacts of climate change and deforestation on hydropower planning in the Brazilian Amazon. Nat. Sustain. 3, 430–436. doi: 10.1038/s41893-020-0492-y
Aronica, G. T., and Bonaccorso, B. (2013). Climate change effects on hydropower potential in the Alcantara River basin in Sicily (Italy). Earth Interact. 17, 19. doi: 10.1175/2012EI000508.1
Arto, I., Capellán-Pérez, I., Lago, R., Bueno, G., and Bermejo, R. (2016). The energy requirements of a developed world. Energy Sustain. Dev. 33, 1–13. doi: 10.1016/j.esd.2016.04.001
Bocchiola, D., Diolaiuti, G., Soncini, A., Mihalcea, C., D'Agata, C., Mayer, C., et al. (2011). Prediction of future hydrological regimes in poorly gauged high altitude basins: The case study of the upper Indus, Pakistan. Hydrol. Earth Syst. Sci. 15, 2059–2075. doi: 10.5194/hess-15-2059-2011
Carvallo, J. P., Ferall, I., Kammen, D. M., Hartmann, J., Sada, R., and Opperman, J. (2020). Energy Options Assessment. Kathmandu: Technical report, USAID Paani Program.
Casale, F., Bombelli, G. M., Monti, R., and Bocchiola, D. (2020). Hydropower potential in the Kabul River under climate change scenarios in the XXI century. Theor. Appl. Climatol. 139, 1415–1434. doi: 10.1007/s00704-019-03052-y
CEA (2018). National Electricity Plan - Generation. New Delhi: Technical report, Central Electricity Authority, Ministry of Power, Government of India.
Chapagain, D., Dhaubanjar, S., and Bharati, L. (2021). Unpacking future climate extremes and their sectoral implications in western Nepal. Clim. Change 168, 1–23. doi: 10.1007/s10584-021-03216-8
Cherry, J. E., Knapp, C., Trainor, S., Ray, A. J., Tedesche, M., and Walker, S. (2017). Planning for climate change impacts on hydropower in the Far North. Hydrol. Earth Syst. Sci 21:133–151. doi: 10.5194/hess-21-133-2017
Chilkoti, V., Bolisetti, T., and Balachandar, R. (2017). Climate change impact assessment on hydropower generation using multi-model climate ensemble. Renew. Energy 109, 510–517. doi: 10.1016/j.renene.2017.02.041
Chuphal, D. S., and Mishra, V. (2023). Increased hydropower but with an elevated risk of reservoir operations in India under the warming climate. iScience 26, 105986. doi: 10.1016/j.isci.2023.105986
Collier, E., and Immerzeel, W. W. (2015). High-resolution modeling of atmospheric dynamics in the Nepalese Himalaya. J. Geophys. Res. 120, 19. doi: 10.1002/2015JD023266
Crootof, A., Shrestha, R., Albrecht, T., Ptak, T., and Scott, C. A. (2021). Sacrificing the local to support the national: politics, sustainability, and governance in Nepal's hydropower paradox. Energy Res. Soc. Sci., 80:102206. doi: 10.1016/j.erss.2021.102206
Dahri, Z. H., Ludwig, F., Moors, E., Ahmad, S., Ahmad, B., Shoaib, M., et al. (2021). Spatio-temporal evaluation of gridded precipitation products for the high-altitude Indus basin. Int. J. Climatol. 41, 4283–4306. doi: 10.1002/joc.7073
de Queiroz, A. R., Marangon Lima, L. M., Marangon Lima, J. W., da Silva, B. C., and Scianni, L. A. (2016). Climate change impacts in the energy supply of the Brazilian hydro-dominant power system. Renew. Energy 99, 379–389. doi: 10.1016/j.renene.2016.07.022
Dhaubanjar, S., Lutz, A., Pradhananga, S., Smolenaars, W., Khanal, S., Biemans, H., et al. (2023). From theoretical to sustainable potential for run-of-river hydropower development in the Upper Indus River Basin. Appl. Energy. doi: 10.1016/j.apenergy.2023.12.2372
Dhaubanjar, S., Lutz, A. F., Gernaat, D. E., Nepal, S., Smolenaars, W., Pradhananga, S., et al. (2021). A systematic framework for the assessment of sustainable hydropower potential in a river basin—the case of the upper Indus. Sci. Total Environ. 786, 147142. doi: 10.1016/j.scitotenv.2021.147142
Di Baldassarre, G., Sivapalan, M., Rusca, M., Cudennec, C., Garcia, M., Kreibich, H., et al. (2019). Sociohydrology: Scientific Challenges in Addressing the Sustainable Development Goals. Water Resour. Res., 55:6327–6355. doi: 10.1029/2018WR023901
Eyring, V., Bony, S., Meehl, G. A., Senior, C. A., Stevens, B., Stouffer, R. J., et al. (2016). Overview of the Coupled Model Intercomparison Project Phase 6 (CMIP6) experimental design and organization. Geosci. Model Dev., 9:1937–1958. doi: 10.5194/gmd-9-1937-2016
FAO (2011). Indus River Basin. Rome, Italy: Food and Agriculture Organisation of the United Nations.
Farinotti, D., Round, V., Huss, M., Compagno, L., and Zekollari, H. (2019). Large hydropower and water-storage potential in future glacier-free basins. Nature 575, 341–344. doi: 10.1038/s41586-019-1740-z
Filion, Y. (2000). Climate Change: Implications for Canadian Water Resources and Hydropower Production. Can. Water Resour. J. 25, 255–269. doi: 10.4296/cwrj2503255
GADM v3.4. Available online at: https://gadm.org/. (accessed April 17, 2020).
Geheb, K., and Suhardiman, D. (2019). The political ecology of hydropower in the Mekong River Basin. Curr. Opin. Environ. Sustain. 37, 8–13. doi: 10.1016/j.cosust.2019.02.001
Gernaat, D. E., Bogaart, P. W., Vuuren, D. P., Biemans, H., and Niessink, R. (2017). High-resolution assessment of global technical and economic hydropower potential. Nat. Energy 2:821–828. doi: 10.1038/s41560-017-0006-y
Gernaat, D. E., de Boer, H. S., Daioglou, V., Yalew, S. G., Müller, C., and van Vuuren, D. P. (2021). Climate change impacts on renewable energy supply. Nat. Clim. Chang. 11, 1–7. doi: 10.1038/s41558-020-00949-9
Gernaat, D. E. H. J. (2019). The Role of Renewable Energy in Long-Term Energy and Climate Scenarios (PhD thesis). Utrecht: Utrecht University.
GoP (2015). Power Generation Policy 2015. Private Power and Infrastructure Board. Ministry of Water and Power. Government of Pakistan.
Grill, G., Lehner, B., Thieme, M., Geenen, B., Tickner, D., Antonelli, F., et al. (2019). Mapping the world's free-flowing rivers. Nature 569, 215–221. doi: 10.1038/s41586-019-1111-9
Gyanwali, K., Komiyama, R., and Fujii, Y. (2020). Representing hydropower in the dynamic power sector model and assessing clean energy deployment in the power generation mix of Nepal. Energy 202, 117795. doi: 10.1016/j.energy.2020.117795
Hamududu, B., and Killingtveit, A. (2012). Assessing climate change impacts on global hydropower. Energies 5, 305–322. doi: 10.3390/en5020305
Harlan, T., and Hennig, T. (2022). From mountains to megaregions: A powershed analysis of the Third Pole hydropower boom. Glob. Environ. Chang. 73, 102483. doi: 10.1016/j.gloenvcha.2022.102483
Hersbach, H., Bell, B., Berrisford, P., Hirahara, S., Horányi, A., Mu noz-Sabater, J., et al. (2020). The ERA5 global reanalysis. Q. J. R. Meteorol. Soc. 146, 1999–2049.
Hoes, O. A., Meijer, L. J., Van Der Ent, R. J., and Van De Giesen, N. C. (2017). Systematic high-resolution assessment of global hydropower potential. PLoS ONE 12, e0171844. doi: 10.1371/journal.pone.0171844
Ilyas, A., Parkinson, S., Vinca, A., Byers, E., Manzoor, T., Riahi, K., et al. (2022). Balancing smart irrigation and hydropower investments for sustainable water conservation in the Indus basin. Environ. Sci. Policy 135:147–161. doi: 10.1016/j.envsci.2022.04.012
Jeuland, M. (2010). Economic implications of climate change for infrastructure planning in transboundary water systems: an example from the Blue Nile. Water Resour. Res. 46, W11556. doi: 10.1029/2010WR009428
Ji, P., and Yuan, X. (2020). Underestimation of the warming trend over the tibetan plateau during 1998–2013 by global land data assimilation systems and atmospheric reanalyses. J. Meteorol. Res. 34, 1. doi: 10.1007/s13351-020-9100-3
Kao, S. C., Sale, M. J., Ashfaq, M., Uria Martinez, R., Kaiser, D. P., Wei, Y., et al. (2015). Projecting changes in annual hydropower generation using regional runoff data: an assessment of the United States federal hydropower plants. Energy 80, 239–250. doi: 10.1016/j.energy.2014.11.066
Khanal, S., Lutz, A. F., Kraaijenbrink, P. D., van den Hurk, B., Yao, T., and Immerzeel, W. W. (2021). Variable 21st century climate change response for rivers in high mountain asia at seasonal to decadal time scales. Water Resour. Res. 57, e2020WR029266. doi: 10.1029/2020WR029266
Khanal, S., Tiwari, S., Lutz, A. F., Hurk, B. V. D., and Immerzeel, W. W. (2023). Historical Climate Trends over High Mountain Asia Derived from ERA5 Reanalysis Data. J. Appl. Meteorol. Climatol. 62, 263–288. doi: 10.1175/JAMC-D-21-0045.1
Koch, F., Prasch, M., Bach, H., Mauser, W., Appel, F., and Weber, M. (2011). How will hydroelectric power generation develop under climate change scenarios? A case study in the upper danube basin. Energies 4, 1508–1541. doi: 10.3390/en4101508
Kumar, A., Schei, T., Ahenkorah, A., Caceres Rodriguez, R., Devernay, J.-M., Freitas, M., et al. (2011). “Hydropower,” in IPCC Renewable Energy Sources and Climate Change Mitigation chapter 5, eds. O. Edenhofer, R. Pichs-Madruga, Y. Sokona, K. Seyboth, P. Matschoss, S. Kadner, T. Zwickel, et al. Cambridge, New York: Cambridge University Press.
Labriet, M., Biberacher, M., Holden, P. B., Edwards, N. R., Kanudia, A., and Loulou, R. (2015). “Assessing climate impacts on the energy sector with TIAM-WORLD: focus on heating and cooling and hydropower potential,” in Informing Energy Clim. Policies Using Energy Syst. Model. Lect. Notes Energy, eds. G. Giannakidis, M. Labriet, B. Ó Gallachóir, and G. Tosato. Cham: Springer, 389–409.
Lehner, B., Czisch, G., and Vassolo, S. (2005). The impact of global change on the hydropower potential of Europe: a model-based analysis. Energy Policy 33, 839–855. doi: 10.1016/j.enpol.2003.10.018
Lehner, B., Liermann, C. R., Revenga, C., Vörömsmarty, C., Fekete, B. M., Crouzet, P., et al. (2011). High-resolution mapping of the world's reservoirs and dams for sustainable river-flow management. Front. Ecol. Environ. 9, 494–502. doi: 10.1890/100125
Lehner, B., Verdin, K., and Jarvis, A. (2008). New Global Hydrography Derived From Spaceborne Elevation Data. (Washington. DC: EOS).
Levenda, A. M., Behrsin, I., and Disano, F. (2021). Renewable energy for whom? A global systematic review of the environmental justice implications of renewable energy technologies. Energy Res. Soc. Sci. 71, 101837. doi: 10.1016/j.erss.2020.101837
Li, D., Lu, X., Walling, D. E., Zhang, T., Steiner, J. F., Wasson, R. J., et al. (2022). High mountain Asia hydropower systems threatened by climate-driven landscape instability. Nat. Geosci. 15, 520–530. doi: 10.1038/s41561-022-00953-y
Lord, A., Drew, G., and Gergan, M. D. (2020). Timescapes of Himalayan hydropower: Promises, project life cycles, and precarities. WIREs Water. 7, e1469. doi: 10.1002/wat2.1469
Lutz, A., Immerzeel, W., Kraaijenbrink, P., Shrestha, A., and Bierkens, M. (2016a). Climate change impacts on the upper indus hydrology: sources, shifts and extremes. PLoS ONE 11, e0165630. doi: 10.1371/journal.pone.0165630
Lutz, A., Immerzeel, W., Shrestha, A., and Bierkens, M. (2014). Consistent increase in High Asia's runoff due to increasing glacier melt and precipitation. Nat. Clim. Chang. 4, 587–592. doi: 10.1038/nclimate2237
Lutz, A. F., ter Maat, H. W., Biemans, H., Shrestha, A. B., Wester, P., and Immerzeel, W. W. (2016b). Selecting representative climate models for climate change impact studies: an advanced envelope-based selection approach. Int. J. Climatol. 36, 3988–4005. doi: 10.1002/joc.4608
Lutz, A. F., ter Maat, H. W., Wijngaard, R. R., Biemans, H., Syed, A., Shrestha, A. B., et al. (2019). South Asian river basins in a 1.5 °C warmer world. Reg. Environ. Chang. 19, 833–847, doi: 10.1007/s10113-018-1433-4
Madani, K., and Lund, J. R. (2010). Estimated impacts of climate warming on California's high-elevation hydropower. Clim. Change 102, 521–538. doi: 10.1007/s10584-009-9750-8
Marahatta, S., Bhattarai, U., Devkota, L. P., and Aryal, D. (2022). Unravelling the water-energy-economics-continuum of hydroelectricity in the face of climate change. Int. J. Energy Water Resour. 6, 323–335. doi: 10.1007/s42108-021-00174-w
Melsen, L. A., Vos, J., and Boelens, R. (2018). What is the role of the model in socio-hydrology? Discussion of “Prediction in a socio-hydrological world?*. Hydrol. Sci. J. 63, 1435–1443. doi: 10.1080/02626667.2018.1499025
Mishra, S. K., Veselka, T. D., Prusevich, A. A., Grogan, D. S., Lammers, R. B., Rounce, D. R., et al. (2020). differential impact of climate change on the hydropower economics of two river basins in high Mountain Asia. Front. Environ. Sci. 8, 26. doi: 10.3389/fenvs.2020.00026
Momblanch, A., Holman, I. P., and Jain, S. K. (2019). Current practice and recommendations for modelling global change impacts on water resource in the Himalayas. Water (Switzerland) 11, 1303. doi: 10.3390/w11061303
Nazeer, A., Maskey, S., Skaugen, T., and McClain, M. E. (2022). Changes in the hydro-climatic regime of the Hunza Basin in the Upper Indus under CMIP6 climate change projections. Sci. Rep. 12, 1–16. doi: 10.1038/s41598-022-25673-6
Nepal, S., and Shrestha, A. B. (2015). Impact of climate change on the hydrological regime of the Indus, Ganges and Brahmaputra river basins: a review of the literature. Int. J. Water Resour. Dev. 31, 201–218. doi: 10.1080/07900627.2015.1030494
Ng, J. Y., Turner, S. W., and Galelli, S. (2017). Influence of El Ni no Southern Oscillation on global hydropower production. Environ. Res. Lett. 12, 034010. doi: 10.1088/1748-9326/aa5ef8
Nie, Y., Pritchard, H. D., Liu, Q., Hennig, T., Wang, W., Wang, X., et al. (2021). Glacial change and hydrological implications in the Himalaya and Karakoram. Nat. Rev. Earth Environ. 2, 1–16. doi: 10.1038/s43017-020-00124-w
NTDC (2019). Indicative Generation Capacity Expansion (IGCEP) Plan 2018-40. Power System Planning, National Transmission and Distribution Company (NTDC), Government of Pakistan. Available online at: https://nepra.org.pk/Admission%20Notices/2019/09-September/IGCEP%20Plan%20(2018-40).pdf
NTDC (2022). Indicative Generation Capacity Expansion Plan (IGCEP) 2022-31. Power System Planning, National Transmission and Distribution Company (NTDC), Government of Pakistan. Available online at: https://nepra.org.pk/licensing/Licences/IGCEP/IGCEP%202022-31%20.pdf
Nüsser, M., and Baghel, R. (2017). The Emergence of Technological Hydroscapes in the Anthropocene: Socio-Hydrology and Development Paradigms of Large Dams. Cheltenham: Edward Elgar Publishing, 287-301.
Nüsser, M., Schmidt, S., and Dame, J. (2012). Irrigation and development in the Upper Indus Basin: characteristics and recent changes of a socio-hydrological system in Central Ladakh, India. Mt. Res. Dev. 32, 51–61. doi: 10.1659/MRD-JOURNAL-D-11-00091.1
Obahoundje, S., Diedhiou, A., Dubus, L., Adéchina Alamou, E., Amoussou, E., Akpoti, K., et al. (2022). Modeling climate change impact on inflow and hydropower generation of Nangbeto dam in West Africa using multi-model CORDEX ensemble and ensemble machine learning. Appl. Energy 325, 119795. doi: 10.1016/j.apenergy.2022.119795
Opperman, J. J., Camargo, R. R., Laporte-Bisquit, A., Zarfl, C., and Morgan, A. J. (2022). Using the WWF water risk filter to screen existing and projected hydropower projects for climate and biodiversity risks. Water (Switzerland) 14, 721. doi: 10.3390/w14050721
Orr, A., Ahmad, B., Alam, U., Appadurai, A. N., Bharucha, Z. P., Biemans, H., et al. (2022). Knowledge priorities on climate change and water in the upper indus basin: a horizon scanning exercise to identify the top 100 research questions in social and natural sciences. Earth's Futur. 10, e2021EF002619. doi: 10.1002/essoar.10510398.1
Paltán, H. A., Pant, R., Plummer Braeckman, J., and Dadson, S. J. (2021). Increased water risks to global hydropower in 1.5 °C and 2.0 °C Warmer Worlds. J. Hydrol. 599, 126503. doi: 10.1016/j.jhydrol.2021.126503
Parkinson, S. C., and Djilali, N. (2015). Robust response to hydro-climatic change in electricity generation planning. Clim. Change 130, 475–489. doi: 10.1007/s10584-015-1359-5
Patro, E. R., De Michele, C., and Avanzi, F. (2018). Future perspectives of run-of-the-river hydropower and the impact of glaciers' shrinkage: the case of Italian Alps. Appl. Energy 231, 699–713. doi: 10.1016/j.apenergy.2018.09.063
Pellicciotti, F., Buergi, C., Immerzeel, W. W., Konz, M., and Shrestha, A. B. (2012). Challenges and uncertainties in hydrological modeling of remote hindu KushKarakoramHimalayan (HKH) Basins: Suggestions for calibration strategies. Mt. Res. Dev. 32, 1. doi: 10.1659/MRD-JOURNAL-D-11-00092.1
Pereira-Cardenal, S. J., Madsen, H., Arnbjerg-Nielsen, K., Riegels, N., Jensen, R., Mo, B., et al. (2014). Assessing climate change impacts on the Iberian power system using a coupled water-power model. Clim. Change 126, 351–364. doi: 10.1007/s10584-014-1221-1
Qin, P., Xu, H., Liu, M., Du, L., Xiao, C., Liu, L., et al. (2020a). Climate change impacts on Three Gorges Reservoir impoundment and hydropower generation. J. Hydrol. 580, 123922. doi: 10.1016/j.jhydrol.2019.123922
Qin, P., Xu, H., Liu, M., Xiao, C., Forrest, K. E., Samuelsen, S., et al. (2020b). Assessing concurrent effects of climate change on hydropower supply, electricity demand, and greenhouse gas emissions in the Upper Yangtze River Basin of China. Appl. Energy 279, 115694. doi: 10.1016/j.apenergy.2020.115694
Ray, P. A., Bonzanigo, L., Wi, S., Yang, Y. C. E., Karki, P., García, L. E., et al. (2018). Multidimensional stress test for hydropower investments facing climate, geophysical and financial uncertainty. Glob. Environ. Chang. 48, 168–181. doi: 10.1596/29445
Rounce, D. R., Khurana, T., Short, M. B., Hock, R., Shean, D. E., and Brinkerhoff, D. J. (2020). Quantifying parameter uncertainty in a large-scale glacier evolution model using Bayesian inference: application to High Mountain Asia. J. Glaciol. 66, 256. doi: 10.1017/jog.2019.91
Schaefli, B. (2015). Projecting hydropower production under future climates: a guide for decision-makers and modelers to interpret and design climate change impact assessments. WIREs Water 2, 271–289. doi: 10.1002/WAT2.1083
Schaefli, B., Hingray, B., and Musy, A. (2007). Climate change and hydropower production in the Swiss Alps: quantification of potential impacts and related modelling uncertainties. Hydrol. Earth Syst. Sci. 11, 1191–1205. doi: 10.5194/hess-11-1191-2007
Schaefli, B., Manso, P., Fischer, M., Huss, M., and Farinotti, D. (2019). The role of glacier retreat for Swiss hydropower production. Renew. Energy 132:615–627. doi: 10.1016/j.renene.2018.07.104
Schwanghart, W., Worni, R., Huggel, C., Stoffel, M., and Korup, O. (2016). Uncertainty in the Himalayan energy-water nexus: estimating regional exposure to glacial lake outburst floods. Environ. Res. Lett. 11, 74005. doi: 10.1088/1748-9326/11/7/074005
Shirsat, T. S., Kulkarni, A. V., Momblanch, A., Randhawa, S. S., and Holman, I. P. (2021). Towards climate-adaptive development of small hydropower projects in Himalaya: a multi-model assessment in upper Beas basin. J. Hydrol. Reg. Stud., 34:100797. doi: 10.1016/j.ejrh.2021.100797
Siciliano, G., Urban, F., Tan-Mullins, M., and Mohan, G. (2018). Large dams, energy justice and the divergence between international, national and local developmental needs and priorities in the global South. Energy Res. Soc. Sci. 41, 199–209. doi: 10.1016/j.erss.2018.03.029
Sivapalan, M., Savenije, H. H., and Bl?schl, G. (2012). Socio-hydrology: a new science of people and water. Hydrol. Proc. 26, 1270–1276. local vs. doi: 10.1002/hyp.8426
Smolenaars, W. J., Jamil, M. K., Dhaubanjar, S., Lutz, A. F., Immerzeel, W., Ludwig, F., et al. (2023). Exploring the potential of agricultural system change as an integrated adaptation strategy for water and food security in the Indus basin. Environ. Dev. Sustain. 6, 1–36. doi: 10.1007/s10668-023-03245-6
Smolenaars, W. J., Lutz, A. F., Biemans, H., Dhaubanjar, S., Immerzeel, W. W., and Ludwig, F. (2021). From narratives to numbers: spatial downscaling and quantification of future water, food and energy security requirements in the Indus basin. Futures 133, 102831. doi: 10.1016/j.futures.2021.102831
Sovacool, B. K., Dhakal, S., Gippner, O., and Bambawale, M. J. (2011). Halting hydro: a review of the socio-technical barriers to hydroelectric power plants in Nepal. Energy 36, 3468–3476. doi: 10.1016/j.energy.2011.03.051
Spreng, D. (2005). Distribution of energy consumption and the 2000W/capita target. Energy Policy 33, 1905–1911. doi: 10.1016/j.enpol.2004.03.023
Stigter, E. E., Steiner, J. F., Koch, I., Saloranta, T. M., Kirkham, J. D., and Immerzeel, W. W. (2021). Energy and mass balance dynamics of the seasonal snowpack at two high-altitude sites in the Himalaya. Cold Reg. Sci. Technol. 183, 103233. doi: 10.1016/j.coldregions.2021.103233
Themeßl, M., Gobiet, A., and Leuprecht, A. (2011). Empirical-statistical downscaling and error correction of daily precipitation from regional climate models. Int. J. Climatol. 31, 1530–1544, doi: 10.1002/JOC.2168
Turner, S. W., Hejazi, M., Kim, S. H., Clarke, L., and Edmonds, J. (2017a). Climate impacts on hydropower and consequences for global electricity supply investment needs. Energy 141, 2081–2090. doi: 10.1016/j.energy.2017.11.089
Turner, S. W., Ng, J. Y., and Galelli, S. (2017b). Examining global electricity supply vulnerability to climate change using a high-fidelity hydropower dam model. Sci. Total Environ. 590–591, 663–675. doi: 10.1016/j.scitotenv.2017.03.022
Turner, S. W., and Voisin, N. (2022). Simulation of hydropower at subcontinental to global scales: a state-of-the-art review. Environ. Res. Lett. 17, 023002. doi: 10.1088/1748-9326/ac4e38
van Vliet, M. T., van Beek, L. P., Eisner, S., Flörke, M., Wada, Y., and Bierkens, M. F. (2016a). Multi-model assessment of global hydropower and cooling water discharge potential under climate change. Glob. Environ. Chang. 40, 156–170. doi: 10.1016/j.gloenvcha.2016.07.007
van Vliet, M. T., Wiberg, D., Leduc, S., and Riahi, K. (2016b). Power-generation system vulnerability and adaptation to changes in climate and water resources. Nat. Clim. Chang. 6, 375–380. doi: 10.1038/nclimate2903
Vicu na, S., Dracup, J. A., and Dale, L. (2011). Climate change impacts on two high-elevation hydropower systems in California. Clim. Change 109, 151–169. doi: 10.1007/s10584-011-0301-8
Vinca, A., Parkinson, S., Riahi, K., Byers, E., Siddiqi, A., Muhammad, A., et al. (2021). Transboundary cooperation a potential route to sustainable development in the Indus basin. Nat. Sustain. 4, 331–339. doi: 10.1038/s41893-020-00654-7
Viviroli, D., Archer, D. R., Buytaert, W., Fowler, H. J., Greenwood, G. B., Hamlet, A. F., et al. (2011). Climate change and mountain water resources: Overview and recommendations for research, management and policy. Hydrol. Earth Syst. Sci. 15, 471–504. doi: 10.5194/hess-15-471-2011
Wasti, A., Ray, P., Wi, S., Folch, C., Ubierna, M., and Karki, P. (2022). Climate change and the hydropower sector: A global review. WIREs: Clim. Change 13, e757. doi: 10.1002/wcc.757
WCD (2000). Dams and Development: A New Framework for Decision-Making. London: Technical report, World Commission on Dams.
Wester, P., Mishra, A., Mukherji, A., Shrestha, A. B., and Change, C. (2019). The Hindu Kush Himalaya Assessment. Cham, Switzerland: Springer International Publishing.
Wijngaard, R. R., Lutz, A. F., Nepal, S., Khanal, S., Pradhananga, S., Shrestha, A. B., et al. (2017). Future changes in hydro-climatic extremes in the Upper Indus, Ganges, and Brahmaputra River basins. PLoS ONE 12, 1–26. doi: 10.1371/journal.pone.0190224
Yousuf, I., Ghumman, A. R., and Hashmi, H. N. (2017). Optimally sizing small hydropower project under future projected flows. KSCE J. Civ. Eng. 21, 1964–1978. doi: 10.1007/s12205-016-1043-y
Zhang, X., Li, H. Y., Deng, Z. D., Ringler, C., Gao, Y., Hejazi, M. I., et al. (2018). Impacts of climate change, policy and Water-Energy-Food nexus on hydropower development. Renew. Energy 116, 827–834. doi: 10.1016/j.renene.2017.10.030
Keywords: hydropower development, future hydropower potential, climate change, energy security, SDG 7, energy justice, sustainable development, resource potential
Citation: Dhaubanjar S, Lutz AF, Smolenaars WJ, Khanal S, Jamil MK, Biemans H, Ludwig F, Shrestha AB and Immerzeel WW (2023) Quantification of run-of-river hydropower potential in the Upper Indus basin under climate change. Front. Water 5:1256249. doi: 10.3389/frwa.2023.1256249
Received: 17 July 2023; Accepted: 07 November 2023;
Published: 19 December 2023.
Edited by:
Marcus Nüsser, Heidelberg University, GermanyReviewed by:
Dinis Juizo, Eduardo Mondlane University, MozambiqueShakil A. Romshoo, University of Kashmir, India
Andrew Orr, British Antarctic Survey (BAS), United Kingdom
Copyright © 2023 Dhaubanjar, Lutz, Smolenaars, Khanal, Jamil, Biemans, Ludwig, Shrestha and Immerzeel. This is an open-access article distributed under the terms of the Creative Commons Attribution License (CC BY). The use, distribution or reproduction in other forums is permitted, provided the original author(s) and the copyright owner(s) are credited and that the original publication in this journal is cited, in accordance with accepted academic practice. No use, distribution or reproduction is permitted which does not comply with these terms.
*Correspondence: Sanita Dhaubanjar, sdhauban@gmail.com