Flexible control of pulse intensity and repetition rate for multiphoton photostimulation
 Laura Maddalena
 Mariska Ouwehand
  Elizabeth C. Carroll
- Department of Imaging Physics, Faculty of Applied Sciences, Delft University of Technology, Delft, Netherlands
In deep tissue imaging, pulsed near-infrared lasers commonly provide high peak powers needed for nonlinear absorption, but average power and linear absorption can be limiting factors for tissue damage through heat. We implemented intra-cavity dumping within a mode-locked Ti:Sapphire laser used for two-photon computer generated holography stimulation. This system enables photostimulation in which pulse energy, average power, and repetition rate can each be varied and harnessed as degrees of freedom. We demonstrate how this system provides a new dimension of temporal control in photostimulation experiments to alter the ratio of nonlinear to linear light-tissue interactions, namely by tuning the laser repetition rate between single-shot and ≈ 3 MHz. Repetition rates below 1 MHz, yielding pulse energies over 60 nJ, facilitated holographic projections with more regions of interest than the highest repetition rate of 3 MHz. Even lower repetition rates ( ≈ 10 kHz) diminished thermal load on the sample, as characterized by quantification of heat shock protein expression in zebrafish tissue.
1 Introduction
Optogenetics and photopharmacology are excellent tools to perturb and monitor cells in living animals to understand their specific function within complex neural circuits [1, 2]. Since their advent 30 years ago, many advancements on the sensor engineering and on the light-delivery methods have been made. Thanks to this progress it is currently possible to stimulate and monitor neuronal activity in living animals with single-cell precision and millisecond time resolution in three dimensions [3, 4]. Nonlinear photostimulation requires high peak power to elicit the activation of the optogenetic actuator. The number of photons absorbed per second is proportional to the two-photon (2P) absorption cross-section as well as the squared light intensity. The 2P absorption cross-section, measured in Goeppert-Mayer (GM) units, is typically many orders of magnitude smaller than one-photon (1P) cross-sections. For instance, Channelrhodopsin-2 has a relatively high 2P absorption cross-section of 260 GM at 920 nm [5] (1 GM = 10−50cm4 ⋅ s/photon), whereas typical 1P cross-sections range in the interval 10–15–10−17cm2 [6]. As a consequence, linear absorption of near-infrared (NIR) light by highly prevalent molecular species like water (1P cross-section of approximately 2.25 ⋅ 10−24 cm2 at 920 nm [7]) can be significant compared to the nonlinear absorption in photostimulation experiments.
Phototoxicity during multiphoton NIR excitation may result from two different scenarios occurring at different scales in biological tissues: local effects associated with nonlinear excitation and global effects induced by 1P absorption of NIR. Nonlinear effects are instantaneous and can be destructive due to multi-photon ionization, cell ablation, optical breakdown and even plasma formation [8]. Nonlinear absorption can also cause photochemical damage [9], such as DNA damage or formation of reactive oxygen species (ROS). Although wavelengths typically used for imaging and photostimulation lay in the so-called “optical window for tissues”, linear absorption by endogenous molecules such as water contribute to sample heating [9]. The global effects of thermal damage occur at a slower time scale. Even slight heating can cause an alteration of the sample physiology such as instability of synaptic responses [10] or modulation of the firing rate [11]. Ultimately if the temperature increase is on the order of 8°C, cell death due to protein denaturation is a possible consequence [12]. Picot and colleagues [13] studied extensively the temperature rise consequent to 2P optogenetics stimulation. The sample thermal load was both simulated in optically scattering samples and directly measured in living mouse exposed to different 2P photostimulation patterns. Thermal damages effects were also characterized in the context of multiphoton microscopy [14, 15].
This competing aspect of linear and nonlinear absorption is particularly important when parallel stimulation techniques (e.g., computer generated holography, CGH) are used. In parallel stimulation schemes the available power is divided among multiple target regions of interest (ROIs) [16], requiring high cross-section actuators and high laser peak powers. However, when these conditions are satisfied, the major limitation to the number of neurons that can be irradiated concurrently is light-induced tissue damage [17].
In this study, we investigate how short-pulse photostimulation parameters affect tissue damage in the context of 2P stimulation with NIR light shaped with computer generated holography (2P-CGH). This technique is typically applied for optogenetic manipulations in vivo to study neural circuits. Long-duration experiments and repeated irradiation of multiple ROIs with long exposures (milliseconds to seconds) [13] are required to probe neural activity over time. To investigate the light-tissue interaction as function of the pulsed light parameters such as repetition rate, average power and pulse energy, we used a Ti:Sapphire mode-locked laser equipped with an intra-cavity dumping system based on acousto-optical modulation of the intra-cavity gain. The cavity dumper technology allows the user to flexibly reduce the laser repetition rate while at the same time increasing the pulse energy. Other methods are available to reduce the laser repetition rate, such as increasing the cavity length, are not practical to change “on the fly”. Alternatively, a pulse picker [18] operating outside the cavity tends to decrease pulse energy through extra losses [19].
We evaluated the performance of the intra-cavity dumping laser shaped with CGH by measuring two-photon excited fluorescence (TPEF) in both synthetic samples and living zebrafish embryos. From literature [13, 18, 19] it is known that a reduced repetition rate decreases the thermal load generated by the pulses on the tissue. Hence, we hypothesized that lower repetition rates may mitigate the thermal damage induced by NIR light. This was verified by measuring the expression level of heat shock protein 70 (Hsp70), a histological marker of thermal damage, in the zebrafish embryos after laser irradiation at different repetition rates. We found that prolonged exposure to NIR light at a high laser repetition rate led to upregulation of Hsp70 expression, while this thermal damage was mitigated by a 300-fold lower repetition rate.
2 Materials and methods
2.1 2P-CGH module integrated with scanning light sheet microscope
The optical setup shown in Figure 1A combines the 2P-CGH module for 2P photostimulation with a digitally scanned light sheet microscope. The light sheet microscope uses a Bessel beam excitation profile. The 488 nm excitation laser (DPSS, OBIS-488-LS, Coherent) is shaped as a hollow cylinder by the combination of an axicon (A) and a plano-convex lens (L8). The collimated ring is then conjugated with two scanning galvanometer mirrors (G1, G2, ax1210-A, Thorlabs) at the rear aperture of the excitation objective (E0, 10X/NA 0.3 CFI Plan Fluorite, Nikon). Fluorescence is collected through the detection objective (DO, 20X/NA 1.0 XLUMPLFLN, Olympus) after it passes through a low-pass dichroic mirror (DM, FF01-720/SP-25, Semrock). Finally an image is formed by a tube lens (L5, f = 300 mm) and relayed onto the sCMOS camera (Zyla 4.2, Andor) via a 1:1 telescope (L6 and L7, focal 150 mm). An electrically-tunable lens (ETL, EL-16-40-TC-VIS-20D, Optotune), positioned in the common focus of the telescope, is synchronized to the motion of G2 to enable imaging at different depths in the sample. Brightfield (BF) images are acquired by transmission of a white light LED (BFL, LEDW25E, Thorlabs) placed opposite to the detection objective.
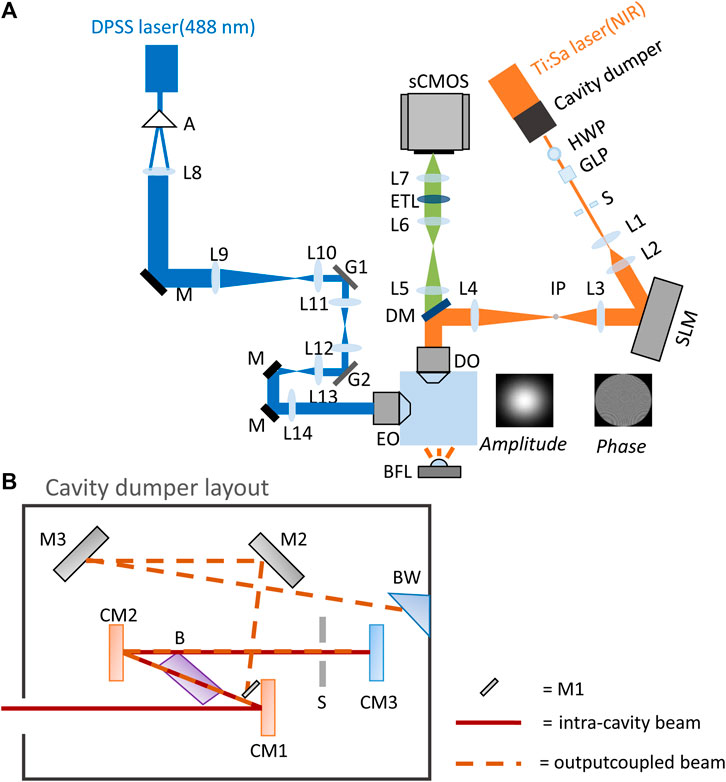
FIGURE 1. Optical setup. (A) Optical layout of the 2P-CGH module coupled to a light sheet microscope. Blue path: light sheet microscope; orange path: 2P-CGH module; green path: common fluorescence detection path. Not to scale. (B) Cavity dumping layout, not to scale. Red line: intra-cavity beam, dashed orange line: dumped beam. The intra-cavity beam is focused by the focusing mirror (CM1) into the Bragg cell (B) placed at Brewster’s angle. The RF pulse applied to the Bragg cell deflects part of the beam in the first order of diffraction (dashed orange line). Both undiffracted and diffracted beam are collimated again by the collimating mirror (CM2) and retroreflected by the end mirror (CM3), passing through the slit (S). Then, both beams pass the Bragg cell a second time. The undiffracted part of the beam is retroreflected into the Ti:Sapphire cavity while the diffracted portion is reflected by mirror M1 towards mirrors M2 and M3. Finally the selected pulse leaves the cavity through the Brewster window (BW).
The detection arm is shared between the microscope and the 2P-CGH photostimulation module. Here, a mode-locked Ti:Sapphire laser (Mira 900-F, Coherent) equipped with the intra-cavity dumping system (pulseSwitch, APE, Berlin) is pumped at 5 W with a continuous-wave laser (Verdi 10, Coherent). The output 800 nm light passes a combination of a half-wave plate (HWP, AHWP05M-980, Thorlabs) and a Glan-Laser calcite polarizer (GLP, GL5-B, Thorlabs) to control the average power, altered by changing the angle between the optical axis of the half-wave plate and polarizer. The beam, magnified by a telescope (lenses L1, f = 25.4 mm and L2, f = 150 mm) impinges on the chip of a liquid crystal on silicon spatial light modulator (SLM, P1920-600-1300-HDMI, pixel size: 9.2μm, Meadowlark Optics) located in a plane where the incident light is collimated. The SLM is illuminated obliquely with an angle of 4.6° to be able to separate the modulated beam from the incident one. The NIR illumination is temporally gated with a response of 1 ms by a mechanical shutter (S, LS2S2Z1, Uniblitz), installed at the focal point of lens L1. A second telescope (lenses L3, f = 250 mm and L4, f = 500 mm) ensures that the beam fills the back aperture of the DO. An inverse pinhole (IP, custom tungsten deposition, diameter 1.3 mm, on glass window of thickness 0.5 mm), placed in the focal plane of lens L3, blocks the zero-order diffraction spot.
2.2 Cavity dumping technology
As shown in Figure 1B, the intra-cavity beam enters a Bragg cell (B) driven with an acoustic signal, which causes a change in the refraction index of the crystal and hence diffraction of the incident light. This mechanism permits selection of specific pulses within the pulse train to be deflected as the output of the whole laser system. The acoustic wave is generated by an electrical radio-frequency (RF) signal applied through a transducer cemented at the base of the crystal. Compared to a standard Ti:Sapphire laser cavity, where the end mirror is an output coupler with roughly 20% transmission, here the end mirror is a high reflective mirror. This causes decreased losses and a consequent increase of intra-cavity energy that is dumped at specific times to form the output beam. The cavity dumping design here employed is double passed through the acousto-optic crystal and the output beam is the sum of the diffracted part interfering with the undiffracted one. By tuning the phase and the frequency of the RF signal we can get constructive interference and maximize the intensity of the output beam. This design allows to enhance the diffraction efficiency of the whole process as demonstrated in the following derivation of the dumped output beam.
The electrical field describing the intra-cavity optical beam is:
where ω is the laser carrier frequency and E0 is the time dependent envelope. After the first pass through the Bragg cell, the electric fields denoting the diffracted and undiffracted beams are given by:
Ed is the electric field describing the diffracted beam which has been shifted in frequency by the RF frequency Ω and it has an adjustable phase ϕ. Eu is the electric field associated with the undiffracted beam. In both equations η represents the efficiency of the diffraction process. After the second pass through the Bragg cell those beams interact once more with the acoustic wave, some of the diffracted beam will be undiffracted and part of the undiffracted beam will be diffracted. Hence the output dumped beam will be the sum of those contributions as follows:
The intensity of the output beam is given by:
The timing between the acoustic burst applied to the Bragg crystal and the intra-cavity optical pulse train traveling through the crystal is carefully tuned to maximize the energy of the dumped pulse. Specifically, the dumped intensity is highly sensitive to the phase ϕ of the RF signal.
2.3 Sample preparation
In this paper both synthetic and living samples were used. The synthetic sample was a diluted solution of fluorescein (F 100, Invitrogen) dissolved in demineralized water. The colour of the solution was vibrant dark yellow with an optical density of 0.056 in 0.8 mm path length measured through a spectrometer (μLITE, BioDrop).
Zebrafish embryos were obtained by inbreeding Tg(elavl3:GCaMP6f) adults [20]. Adult zebrafish were maintained under standard conditions in accordance with the EU directive 2014/63. Larvae were kept in embryo water (DI water with 60 μg/ml Instant Ocean salt and 0.0002% methylene blue) at 28°C until the experiment. The in vivo ablation experiments were carried out at 4 days past fertilization (dpf) while the in vivo laser irradiation experiments followed by western blot were conducted at 3 dpf. Before the in vivo ablation experiments embryos were anesthetized with 0.03% tricaine (E10521, Sigma-Aldrich) in embryo water and mounted in a fluorinated ethylene propylene (FEP, S2022-04, Bola) tube in 2% low-melting temperature agarose (A4018, Sigma-Aldrich) supplemented with 0.03% tricaine. The FEP tube has an internal diameter of 0.8 mm and an outer diameter of 1.6 mm and was attached to a needle (100 Sterican, 21G x 1.5”, Braun) and syringe (Omnifix F Solo 1 ml, Braun) to be held vertically in the objective chamber.
2.4 Intra-cavity dumping characterization
The intra-cavity dumping performance was tested by changing the repetition rate in the range between 3 MHz and 5 kHz and recording in parallel the average power and the voltage generated by the output pulse train on a photodiode (DET10A2, Thorlabs) with 1 ns rise time. The average power was measured with the power meter (Fieldmate, Coherent) after the polarizer. For low average power (range 0.5–30 mW) a semiconductor power sensor head (OP-2VIS, Coherent) was used while for higher average power (above 30 mW) we used a thermopile power sensor head (PM10, Coherent). From the measured average powers for each repetition rate the corresponding pulse energy Ep was calculated with the following formula:
The voltage measured by the photodiode gave an experimental indication of the pulse energy as a function of the repetition rate. The photodiode was placed on the exit window of the Glan-Laser calcite polarizer, so the measured voltage is a quantity proportional to the actual pulse energy.
To characterize the performance of the intra-cavity dumping system in synthetic samples, CGHs were projected into fluorescein solution in demineralized water at variable repetition rate. To guarantee a fixed number of laser pulses across the same CGH projected with different repetition rates the aperture of the shutter gating the NIR light was altered. TPEF images of the CGHs were acquired with the sCMOS camera by using the detection arm of the light sheet microscope. The camera exposure was synchronized with the shutter by using a DAQ card (National Instruments) to control both shutter and camera triggers. The camera trigger was activated by the DAQ card when an output wave form was fed to the shutter. The analysis on the TPEF images was performed on 16-bit raw images.
2.5 Photoablations
Single-cell ablation at variable repetition rates was performed on 4 dpf embryos. Baseline fluorescence time-lapse images of the brain were acquired with the light sheet microscope by using the 488 nm laser with 10 mW output power. The fluorescence signal was acquired by implementing confocal slit detection to suppress the signal generated by the side lobes of the Bessel beam. A slit was virtually generated using an active window on the camera chip rolled synchronously with the galvo mirror scanning the Bessel beam. The effective frame rate was 11 Hz. During the photostimulation experiment, a single-point CGH was targeted to a single neuron in the midbrain of each embryo. The targeted ROIs were manually selected on the baseline fluorescence images through a graphical user interface. The chosen ROIs were located near the center of the lateral FOV (within 70 μm of the center) and appeared as cells in focus, with sharp and bright edges, at the selected plane.
Repetition rates of 1 MHz and 10 kHz were selected to ensure a comparable pulse energy across stimulation conditions (see Figure 2A). To guarantee that the sample receives the same number of pulses at each repetition rate we altered the opening time of the mechanical shutter gating the NIR light. This time was respectively 5 ms and 500 ms for 1 MHz and 10 kHz repetition rate. To probe the effect of the photostimulation time-lapse images are acquired over a time period of 1 minute starting before the photostimulation event. To analyze GCaMP6f traces, the average fluorescence within ROIs was calculated as ΔF/F0, where F0 was the baseline signal prior to photostimulation. Pairwise comparison between the ΔF/F0 values at different time points was performed through the non-parametric Wilcoxon signed-rank test.
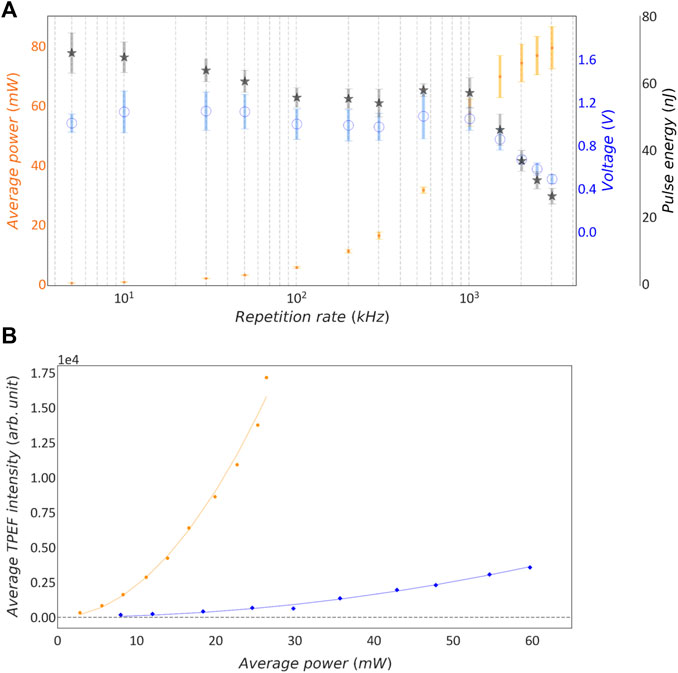
FIGURE 2. Characterization of intra-cavity dumping in synthetic sample. (A) Lin-log plot of measured average power, voltage and calculated pulse energy as function of the laser repetition rate. Orange dots: mean average power; blue circles: mean voltage; grey stars: calculated mean pulse energy. Error bars show the standard deviation; n = 13 measurements. (B) Average TPEF intensity as function of Pav. Blue rhombuses: 3 MHz repetition rate; orange dots: 500 kHz repetition rate; continuous lines: quadratic fit on the corresponding data points.
2.6 Protein isolation and western blot to detect heat shock protein 70
As a molecular marker for thermal damage, the amount of Hsp70 was measured by fluorescence western blot. Groups of 40 embryos of the same genotype at 72 h past fertilization (hpf) were irradiated for 3 h under unfocused NIR laser light at either 3 MHz or 10 kHz repetition rates. Control groups with same genotype and age were not irradiated, but kept at the same ambient temperature as irradiated siblings. A positive control was made by heat treating 72 hpf embryos, with the same genotype used for other groups, for 2 h in a mini-block heater (VWR) at 37°C.
All groups of embryos were snap frozen with liquid nitrogen immediately after treatment and stored at -80°C. For protein isolation, 20 embryos per group were homogenized in lysis buffer (Ripa buffer, 20-188, Sigma-Aldrich) with a protease inhibitor cocktail (cOmplete, Mini EDTA-free Protease Inhibitor Cocktail, 11836170001, Roche) and phosphatase inhibitor (Phosphatase Inhibitor Cocktail 2, P5726, Sigma-Aldrich). The homogenate was sonicated (3s pulses, 2x) with a probe sonicator (Q125A, QSonica) and then centrifuged (16500 rpm, 20 min). The supernatant was collected and the protein concentration determined via a bicinchoninic assay (Pierce BCA protein assay kit, 23225, ThermoFisher Scientific) using bovine serum albumin as reference.
Extracted protein was diluted (1:1) in 2x Laemmli sample buffer (161-0747, Bio-Rad) supplemented with 5% 2-mercaptoethanol (M6250, Sigma-Aldrich) was then denaturated at 95°C for 10 min. The denatured proteins were then separated by molecular weight through gel electrophoresis at 200 V for 45 min (Mini-PROTEAN Tetra cell system, 1658005; BioRad). Equal amounts of protein lysate (40 μg) were loaded onto 4–15% TGX stain-free precast gels (Mini-PROTEAN® TGX Stain-FreeTMProtein Gels, 4568083, BioRad) together with a reference ladder (Precision Plus Protein All Blue standards, 1610373, Bio-Rad). Afterwards the proteins were transferred from gel to Polyvinylidene fluoride (PVDF) membranes (Trans-Blot Turbo 0.2 μ m PVDF Transfer Packs, 1704156, BioRad) at 25 V and 1.3 A for 7 min via a transfer system (Trans-Blot Turbo Transfer System, 1704150, BioRad).
After transfer the membrane was imaged with a gel imaging system (Gel Doc XR+, 1708195, Bio Rad) to detect the protein loading in each lane and the efficiency of protein transfer from gel onto the PVDF membrane. The detected signal is fluorescence emitted by the proteins irradiated with UV light for 0.8 ms. The fluorescence signal comes from tryptophan residues covalently bound to the trihalo compound contained in the stain-free gel. After imaging, the membrane was blocked for unspecific binding in phosphate saline buffer (PBS) with 5% skimmed milk (70166, Sigma-Adrich) for 1 hour at room temperature (20°C) on a rocking table. The membrane was then incubated overnight at 4°C with an anti-Hsp70 antibody (1:1000, monoclonal anti-Hsp70 antibody, H5147, Sigma-Adrich) in the blocking buffer, was washed 3 × 15 min in PBS with 0.01% Tween (PBSTw, 11332465001, Sigma Aldrich) and incubated in a secondary antibody (1:1000, goat anti-mouse Alexa Fluor 647, A-21236, ThermoFischer) for 2 h at 20°C. Finally after washing steps (3 × 15 min in PBStw) the membrane was imaged with a laser scanning fluorescence gel imager (Typhoon RGB, Amersham) using a PMT voltage of 350 V and 647 nm laser excitation.
To quantify the amount of Hsp70, the average intensity of the band at 70 kDa was determined from the image after subtracting an average background measured on a region without any band. Each band was normalized by the total protein as quantified from the image of the stain-free blot. For multiple comparisons among the different experimental groups the non-parametric Kruskal Wallis test was used. Post-hoc pairwise comparisons used the Mann-Whitney test with Bonferroni correction.
3 Results
3.1 Performance of intra-cavity modulation
The performance of the intra-cavity dumping system in terms of average power, voltage and calculated pulse energy was monitored daily over several weeks, as described in Section 2.4. Figure 2A reports the average values of all those data acquired over time and the corresponding standard deviation. As expected, the average power decreases with lowering the repetition rate while the pulse energy increases. The data show that pulse energy reaches a plateau value when the repetition rate is lower than 1 MHz. Discrepancies between the pulse energy calculated from average power and relative pulse energy measured by photodiode can be attributed to noise in the power meter measurement at very low duty cycles.
To confirm the pulse energy measurements through a nonlinear optical process, we compared the TPEF signal generated in a synthetic fluorescent sample by the intra-cavity dumped laser at different repetition rates: 500 kHz and 3 MHz. We projected a single-spot CGH into the sample chamber filled with fluorescein solution, and acquired TPEF images. On these images we then measured the average TPEF signal as a function of the average power of the laser, tuned at the two different repetition rates. The spot was positioned roughly at the center of the FOV and an image of the TPEF fluorescence was acquired using the sCMOS camera synchronized with the mechanical shutter which gates the stimulation light as described in Section 2.4. The exposure time of the camera and the opening time of the shutter were set to different values for the two repetition rates investigated to ensure that the sample was irradiated with the same number of pulses across different repetition rates. Specifically we used an exposure time of 100 ms and 600 ms at repetition rates of 3 MHz and 500 kHz, respectively. However, the precision of the shutter, namely 1 ms, is lower than the time between consecutive pulses. Hence, the total number of incident pulses can vary by 0.1%. Having the integration time fixed to 600 and 100 ms, the error on the number of pulses is respectively 0.017% and 0.1%. Hence, the uncertainty is higher in the case of 3 MHz repetition rate.
From the set of images collected, the average fluorescence intensity was measured within a ROI of 10 × 10 pixels, centered around the pixel of maximum intensity. Figure 2B shows the average TPEF intensity as function of average power for 3 MHz and 500 kHz repetition rates. The two quadratic curves show different curvatures because the repetition rate is inversely proportional to the number of absorbed photons. In case of 2P excitation, the number of photon pairs absorbed per second is described by the following equation (19):
where Ep is the pulse energy, frep is the repetition rate of the laser, σ2P is the 2P cross-section, τ is the pulse duration, Pav is the average power, and A is the spot size of the beam at the focus. This equation can be extended to higher order nonlinear absorption processes [21]. The average measured TPEF is proportional to the number of the absorbed photons and, hence, assuming that 2P cross-section σ2P, pulse duration τ and beam focus size A are kept constant across the two series of measurement, the curvature (C) is inversely proportional to the repetition rate. The experimental data in Figure 2B was fitted with a quadratic function y = Cx2, yielding C values of 2.49 and 55.37 for 3 MHz and 500 kHz data sets, respectively. This means that a 500 kHz pulse train needs 4.70 times lower average power than a 3 MHz pulse train to generate the same fluorescence signal. This result confirms that at lower repetition rate we achieve the same magnitude TPEF signal with lower average power.
3.2 Multi-spot CGHs as function of the repetition rate
We next asked whether a lower repetition rate facilitated the multiplexing of points in the CGHs. In parallel photostimulation methods, such as CGH, the available peak power is divided among many focal points. Hence higher peak power should facilitate the multiplexing of the stimulation light.
To answer this question, we projected point-cloud CGHs with progressively increasing number of points into the sample chamber filled with fluorescein solution. The point-cloud holograms had 12, 24, 48 points, respectively. The laser was adjusted to two different repetition rates: 3 MHz and 10 kHz. For each CGH and each repetition rate a TPEF image was acquired with the sCMOS camera. As in the previous experiment, the camera exposure time was synchronized with the aperture of the mechanical shutter gating the excitation light. The shutter opening and camera exposure times at 3 MHz and 10 kHz were both adjusted to guarantee that each image had the same number of NIR pulses at each repetition rate (see Figure 4D).
Figure 3 shows TPEF images of the point-clouds CGHs acquired with different laser repetition rates. Qualitatively, we observe that the images acquired at 10 kHz provide better contrast. Contrast was quantified on the lines profiles averaged across all the individual points, shown by the plots on the right side of Figures 3A–C. These data points were fitted with a Lorentzian depicted as a continuous line and the standard error on the mean (s.e.m.) values are shown as the shadowed area.
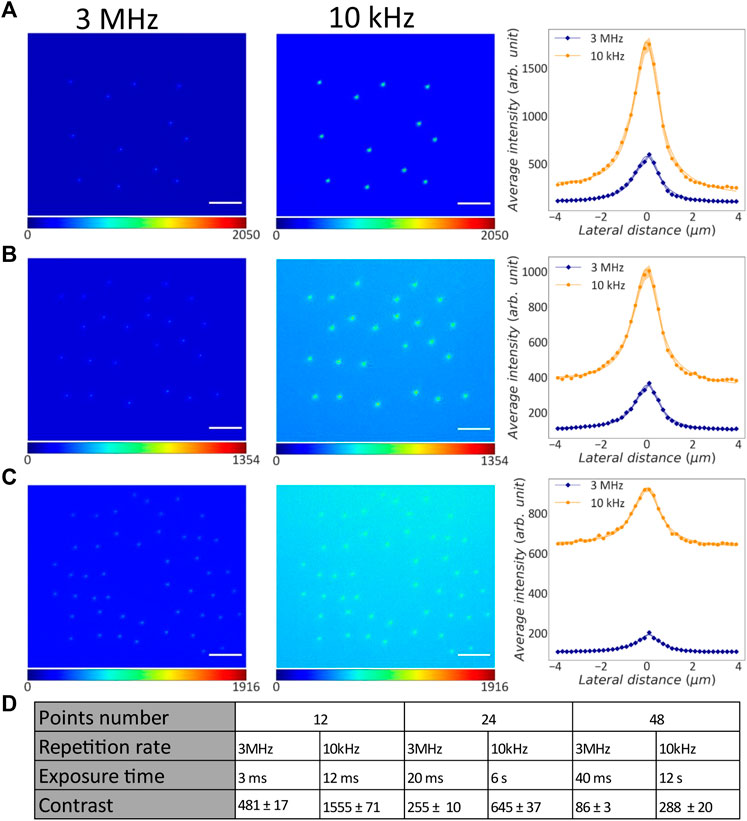
FIGURE 3. Comparison between point-cloud CGHs projected into liquid fluorescein with different repetition rates. (A) Left: TPEF image of 12-point CGH projected with 3 MHz repetition rate. Middle: TPEF image of the same CGH projected with 10 kHz repetition rate. Scale bar: 25 μm. Right: Average line profiles across the pixel of maximum intensity for all the points projected with 3 MHz (blue rhombuses) and 10 kHz (orange dots) repetition rate. Continuous lines: Lorentzian fit on the data points; shadow areas: s.e.m.; orange: 10 kHz; blue: 3 MHz. (B) Left: TPEF image of 24-point CGH projected with 3 MHz repetition rate. Middle: TPEF image of the same CGH projected with 10 kHz repetition rate. Right: Average line profiles across the pixel of maximum intensity for all the points projected with 3 MHz (blue rhombuses) and 10 kHz (orange dots) repetition rate. Continuous lines: Lorentzian fit on the data points; shadow areas: s.e.m.; orange: 10 kHz; blue: 3 MHz. (C) Left: TPEF image of 48-point CGH projected with 3 MHz repetition rate. This image was enhanced with a gamma factor of 1.2 for visualization. Middle: TPEF image of the same CGH projected with 10 kHz repetition rate. Right: Average line profiles across the pixel of maximum intensity for all the points projected with 3 MHz (blue rhombuses) and 10 kHz (orange dots) repetition rate. Continuous lines: Lorentzian fit on the data points; shadow areas: s.e.m.; orange: 10 kHz; blue: 3 MHz. (D) Table with experimental parameters used to acquire each grid image, contrast and corresponding s.e.m.
It is worth observing that the line profiles of points projected with lower repetition rate have an higher baseline TPEF level compared to their counterparts at higher repetition rate. This is due to the higher camera exposure time used for these acquisitions. In fact, an increase of the camera exposure time causes more background signal. Moreover, we observed variability on the background level across different patterns projected with same repetition rate as a consequence of different camera integration times used for the three patterns. Increasing the number of points in each CGH pattern we correspondingly increased the laser irradiation time, and consequently the camera exposure. The contrast for each image was evaluated as the difference between the baseline and the maximum TPEF intensity in the average line profile. On those values the error was estimated by propagating the uncertainty on the means.
As reported in Figure 3D, higher contrast TPEF was obtained for the CGHs projected at lower repetition rate compared to the case at higher repetition rate. In our system, the pulse energy associated with a 10 kHz repetition rate is 2.6 ± 0.4 times higher than its value at 3 MHz (see Figure 2A). The average improvement in contrast was 3.0 ± 0.4. Hence, the average improvement in contrast is comparable to the pulse energy improvement. These experimental results indicate that a lower repetition rate allows to stimulate more points simultaneously.
3.3 Performance in vivo
3.3.1 Single-cell ablation with variable repetition rate
After the characterization of the intra-cavity dumped Ti:Sapphire laser performance in the synthetic sample, we focused on understanding the effect of the variable repetition rate on photoablation in living zebrafish embryos. For such a purpose we targeted single-point CGHs to single neurons in 4 dpf embryos expressing GCaMP6f in the cytosol with either 1 MHz or 10 kHz laser repetition rate. Before each photoablation, a baseline fluorescence image of the midbrain of the samples was acquired with the light sheet microscope to select the ROI for photostimulation. ROIs were selected to be somata in the optic tectum, near the center of the field of view. Repetition rates 1 MHz and 10 kHz were selected to ensure a comparable pulse energy across photostimulation conditions (see Figure 2A). To guarantee that the sample receives the same number of pulses in each stimulation configuration we altered the opening time the mechanical shutter gating the NIR light. The effect of the these photostimulations was probed by the simultaneous acquisition of time-lapse images on the same plane where the stimulation CGH was targeted with the conditions described in Section 2.5.
The data sets showed that both photostimulation conditions caused ablation of the targeted cell. In fact, by measuring the fluorescence intensity at the stimulation location over time we registered an increase of the signal at specific time points post stimulation as depicted in Figure 4C. Although this result was consistent across all the data sets, the time course of the fluorescence signal at the stimulation location showed some variability across the different data sets due to the inherent diversity of the specific ROIs involved. Figure 4A shows two traces of the ΔF/F0 signal over time. The dashed blue trace is representative of the photostimulation at 1 MHz while the continuous orange trace refers to the 10 kHz case. In this specific case we observe that the generated fluorescence signal is comparable and in both cells the calcium response is durable over the recording time.
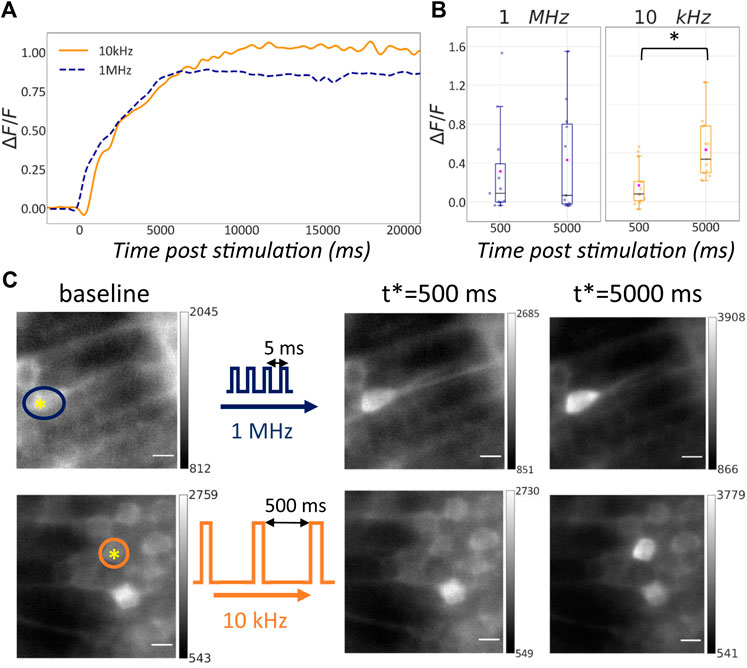
FIGURE 4. Effect of single-neuron ablation in living zebrafish embryos with variable repetition rate. (A) ΔF/F0 signal following photostimulation for two different repetition rates: 1 MHz (blue line), 10 kHz (orange line). (B) Box plots representing the ΔF/F0 signal at 500 ms and 5 s past stimulation for different repetition rates: 1 MHz (n = 11), 10 kHz (right, n = 13). Blue horizontal bars: median value; magenta rhombuses: mean values. Groups marked with star show statistical significance (Wilcoxon signed-ranked test, p = 0.007). (C) Light sheet images of recorded before and at 500 ms and 5 s past stimulation at different repetition rates: 1 MHz (top), 10 kHz (bottom). The yellow asterisk in the baseline images shows the location of the stimulation while the colored circles highlight the cell body to monitor over time. The data sets here reported are the same shown in (A). Scale bar is 5 μm.
Figure 4B captures the ΔF/F0 for the two stimulation conditions for all the data sets at specific time points: 500 ms and 5 s after the stimulation. The box plot highlights that at 10 kHz the median (horizontal blue bars) and the average values (magenta rhombuses) of TPEF signal are higher than their counterpart at 1 MHz. The ΔF/F0 signal at specific time points after the stimulation was compared among all the ablation experiments realized with the same laser repetition rate. The difference between the ΔF/F0 signals at the two different time points was not significant in the 1 MHz case, but was significant in the case of 10 kHz irradiation. This confirms that, whereas both conditions were capable of inducing single-cell ablation in living zebrafish embryos, the resulting dynamics of the fluorescence signal was different. More specifically simulations at 10 kHz repetition rate produced a statistically relevant alteration of the Ca2+ dynamics during the explored time window, namely 5 s after stimulation.
3.3.2 Thermal damage investigation under unfocused illumination with different repetition rate
To validate our hypothesis that a lower laser repetition rate makes the sample less vulnerable to thermal load and to the consequent damage, we assessed the expression level of Hsp70 as a function of laser repetition rate. Two groups of embryos were irradiated with unfocused NIR light at different repetition rate, while a third group was heated in a heat block for 2 h at 37°C.
We expected that any of these treatment would have increased the expression level of Hsp70 over the endogenous level. We used unfocused light where no nonlinear absorption was expected, leaving only the thermal effect of NIR absorption. As depicted in Figure 5A, an Eppendorf tube containing 72 hpf zebrafish embryos in 50 μL of embryo medium was placed at the output of the cavity-dumped laser for 3 h. The laser beam at this point of the optical path has a diameter of roughly 0.8 mm and it covered the tip of the Eppendorf containing the embryos. For each repetition rate condition we had different average powers, 70 ± 1 mW and 0.73 ± 0.01 mW and, consequently, power densities of 13.92
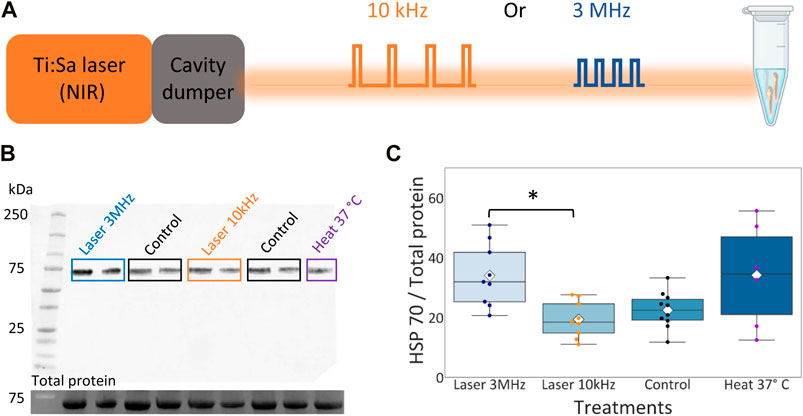
FIGURE 5. Hsp70 expression level in zebrafish embryos upon NIR illumination. (A) Layout of zebrafish embryos NIR radiation at different repetition rates. Eppendorf image created with BioRender.com. (B) Top: Representative western blot of whole protein extracted from 72 hpf zebrafish embryos probed with anti-Hsp70 antibody. Bottom: Corresponding stain-free western blot showing the total protein molecular weight. (C) Box plot for the quantification of the ratio between the expression level of Hsp70 and the total amount of protein. Rhombuses: average values; horizontal black lines: median values; scatter plot: data points in each group with different color code. Groups labeled with star symbols are significantly different (Kruskal–Wallis test, p = 0.02, post-hoc Mann-Whitney test with Bonferroni correction, p = 0.002).
Figure 5C shows a box plot of the ratio between the Hsp70 level and the total protein loaded for each group, the scatter plot shows the data points in each group with a different color code and the white rhombuses display the average ratio calculated in each group. Here we observe an higher average ratio for the group irradiated at 3 MHz (34.10 ± 9.85) compared to the control group (22.49 ± 5.80) and the group irradiated at 10 kHz (19.35 ± 5.71). The control group and the group irradiated at 10 kHz showed a lower average amount of Hsp70 compared to the heat-shocked group (34.17 ± 15.80). Embryos irradiated with 3 MHz light had significantly higher expression Hsp70 than embryos irradiated 10 kHz. Hence, we can conclude that the laser irradiation at 10 kHz repetition rate reduced the thermal load on the sample compared to the 3 MHz pulse train.
4 Discussion
Multiphoton stimulation in living tissues requires a thorough choice of the laser parameters such as average power, repetition rate and pulse energy to perform experiments without alteration of the sample physiology. Podorski and Ranganathan [14] investigated sample heating in the context of scanning TPEF imaging in awake mouse. They reported thermal damage following 20 minutes imaging with an average power of 250–300 mW at 920 nm. Histological markers of thermal damage were observable after 20 minutes of continuous imaging at an average power of 420 mW. They found experimentally that thermal damage was mitigated by imaging at a reduced duty ratio of illumination (for 1 h at 33% duty ratio at 400 mW).
Picot and colleagues [13] developed a model to simulate the heat diffusion in 3D in the context of 2P optogenetic stimulation with both extended CGH and scanning approaches. They provided a powerful simulation tool that given the stimulation parameters such as average laser power, irradiation wavelength, diffusion coefficient and density of the sample enables to predict beforehand the thermal heating induced in the sample. The results of this work suggest to use lower repetition rates (in the range 500 kHz–2 MHz) in parallel stimulation illumination schemes.
In this paper we implemented intra-cavity dumping to introduce an additional degree of freedom to control thermal damage effects during photostimulation of single cells or sub-cellular compartments in the brain of living zebrafish embryos. Intra-cavity dumping within mode-locked Ti:Sapphire lasers is an established technique to increase the pulse energy of the output laser beam at tunable repetition rates without changing the spectral characteristics of the light [22]. Here this technique enabled to tune the laser repetition rate (typically 76 MHz) in the interval between 5 kHz and 3 MHz achieving at the lower repetition rate an average pulse energy of 69 ± 6 nJ. Moreover, the laser source described can be tuned continuously in the range 720–920 nm, offering flexibility for photostimulation experiments that require less common wavelengths, like uncaging of MNI-glutamate (TPE typically uses 720–760 nm) [23, 24] or azobenzene-derived photoswitches (TPE around 850 nm) [25].
Pulse picking is an alternative approach to reduce the repetition rate of mode-locked lasers. This method is based either on acousto or electro-optical modulation of the laser beam. However, in contrast to the intra-cavity dumping design, the modulation device acts outside the cavity and does not increase pulse energy. Forli and colleagues [26] used pulse-picking to investigate the effect of the repetition rate when stimulating an actuator to induce action potentials. More specifically, they stimulated the somatically-target opsin stCoChR expressed in L2/3 pyramidal cells with holographic patterns delivered at 1 MHz and 50 kHz repetition rate via a fiber laser. They found out that action potentials are evoked with a similar probability when stimulating for 100 ms at 1 MHz (average power: 1 mW and pulse energy 1 nJ) and at 50 kHz (average power: 0.25 mW and pulse energy 5 nJ), hence the lower repetition rate permits to elicit action potentials using one-fourth of the average power.
The gain in terms of pulse energy achieved with intra-cavity dumping is particularly convenient for combination with holographic projections, where the available pulse energy is divided among multiple foci in the pattern. In fact, when the system was employed for point-cloud holographic projections we found that 10 kHz repetition rate eased the multiplexing of the holographic projections compared to the 3 MHz case. By comparing CGH projections with the same number of features at low and high repetition rate, respectively we observed that the TPEF contrast of the CGH projected at lower repetition rate was higher (see Figure 3).
The pulse energy could be further increased by operating the Ti:Sapphire cavity in the positive dispersion regime [27]. In this case, the mode-locked pulse is not transform-limited, but instead positively chirped. Similar to chirped pulse amplification in a regenerative amplifier, the stretching of a chirped pulse allows greater amplification of the pulse before reaching the damage threshold of the gain medium. As reported by Zhou and colleagues [27], operating the Ti:Sapphire oscillator in the positive dispersion mode combined with the intra-cavity dumping enables a single-stage laser system to obtain stable and reliable high peak energies on the order of 400 nJ at variable repetition rates. The same strategy can potentially be applied in the pulseSwitch-Mira laser system by increasing the insertion of the intracavity prism controlling group velocity dispersion. In this approach, extra-cavity pulse compression is needed to obtain transform-limited pulse duration. Higher peak intensities could be employed to elicit higher order nonlinear processes. For instance, three-photon excitation offers greater confinement of the excitation light, and when combined with longer wavelength light, it is particularly suited for imaging applications in deep tissue [28, 29].
Other laser technologies are also possible, depending on the desired wavelengths. In the Ti:Sapphire range (720–1080 nm), regenerative amplification is a well-known method to reach microjoule pulse energies at repetition rates in the interval 1–500 kHz. Optical parametric amplifiers are also common as a method to generate high energy pulses at longer wavelengths. Both of these methods utilize multiple stages of amplification, adding to the complexity of the laser system.
Irrespective of the light source technology, high energy pulses can produce various types of tissue damage. When a living sample is irradiated with high pulse energy a careful evaluation of the potential nonlinear damage at the geometrical focus in the sample should be performed [30, 31]. Hence, the choice of the laser parameters becomes a trade-off between thermal and nonlinear damage.
We tested the cavity-dumping system in the context of single-cell photoablation as example of powerful manipulation [32, 33]. The ablated cells were characterized by an increase in the fluorescence signal due to the disruption of the cell membrane and a consequent increase of calcium concentration detected by GCaMP6f. We observed that, although the pulses generated at 1 MHz and 10 kHz repetition rate had comparable pulse energy and were capable of inducing single-cell ablation, stimulation at 10 kHz repetition rate induced a relevant alteration of the fluorescence signal dynamics after the ablation event. This is likely due to subtle differences in the tissue damage mechanisms produced at high and low repetition rate. Finally, we investigated the thermal damage induced by NIR light irradiation by quantifying the expression level Hsp70 in living zebrafish. Hsp70 is expressed in zebrafish embryos during healthy development since it assists with folding of newly translated proteins and acts as a molecular chaperone by mediating the repair and degradation of denatured proteins [34]. In this endogenous form the protein is most commonly referred as heat shock cognate 70 and its expression level changes with the developmental stage of the embryo, reaching a peak at 84 hpf [35]. Hsp70 is upregulated under thermal stress conditions and it has the same functions as its non-induced form. As shown by Yeh and colleagues [36], exposing zebrafish embryos between 12 and 108 hpf to a temperature of 37°C for at least 30 min causes increased expression of Hsp70. For such a reason the expression of the Hsp70 is used in this paper as a cellular marker of thermal damage.
The quantification of the Hsp70 via western blot is susceptible to different sources of noise such as the age of the embryos, the laser power stability during the irradiation and the amount of total protein extracted from the embryos. In the experimental design we aimed at minimizing each of these sources of noise to obtain more robust results. The embryos used in the four different groups, here analyzed, were from different clutches and they were carefully age matched to probe the expression level of Hsp70 at the same developmental stage. All groups were kept at the same temperature (20°C) during the 3-h irradiation period because temperature is a key parameter in embryonic zebrafish development [37]. In fact, any temperature variation across the groups may cause a discrepancy in the development stage and hence affect the level of background Hsp70. Ultimately a variation of the non-induced Hsp70 level may impair the comparison between the protein level across the groups because it represents the baseline of the measurement of the induced-Hsp70. However, since at 72 hpf the level of non-induced Hsp70 is not negligible [36] performing the same experiment at an earlier developmental stage may highlight a more pronounced difference in the Hsp70 expression level in samples irradiated with different repetition rates.
Another source of noise is the stability of the average power delivered by the laser during the irradiation time. To take into account any variation in the average power we repeated the irradiation experiment twice and monitored the average power over time. The variability introduced by the efficiency of the protein extraction was mitigated by performing two different protein extractions for each group for each irradiation experiment. When we assessed the thermal damage on 72 hpf zebrafish irradiated for 3 h by unfocused light at 10 kHz and 3 MHz repetition rates with, respectively, a power densities of 0.015
Another strategy to minimize the temperature rise under multi-spot holographic irradiation is to implement the ultra-fast light targeting (FLiT) approach to shape the stimulation light [39]. This method relies on a galvanometric mirror that scans the beam across the SLM tiled with multiple holograms aligned along the vertical dimension. This stimulation design allows to stimulate multiple ROIs in a cyclic fashion with microseconds light exposures while reducing the average power of a factor equal to the square root of the total number of spots.
Besides the application for minimally invasive optogenetics experiments the 2P-CGH module equipped with intra-cavity dumping could be used at higher repetition rate to irradiate zebrafish embryos that express a desired gene under the heat shock protein 70 (hsp70) promoter. This promoter is a tool to drive a transient gene expression in a specific time window given by the increase of temperature which activates the promoter [40]. Transient expression under the hsp70 promoter was realized by exposing the whole embryo to 38°C temperature [40], via a temperature controlled needle [41] or via a dye-laser focused through a high NA objective of a microscope [42]. The system here presented offers the possibility to drive the hsp70-dependent expression at multiple locations simultaneously with single-cell precision.
5 Conclusion
Here we integrated an intra-cavity-dumped laser with variable repetition rate with a setup for all-optical studies in living animals to introduce a new dimension of control in photostimulation experiments. We tested the system in synthetic samples and we observed that a lower repetition rate eases the projection of multi-spots holographic patterns. Moreover we found that at lower repetition rate comparable TPEF signal can be elicited with lower average power. The same system was tested on living zebrafish embryos where a lower repetition rate allows to achieve similar performance in terms of single neurons ablation reducing drastically the average power. Finally, the investigation of thermal response upon low and higher repetition rate irradiation provided a significant difference in thermal stress. A low repetition rate (10 kHz) showed a lower expression level of the thermal damage molecular marker compared to an higher repetition rate (3 MHz). This study paves the way to the implementation of intra-cavity dumped lasers within optical modules for optogenetic simulations with minimally invasive thermal conditions. The same system operated with higher repetition rate and higher average power could be used for conditional gene expression under the hsp70 promoter with single-cell resolution. In conclusion a intra-cavity dumped laser integrated into an optical setup for all-optical studies in living animals allows to perform photostimulation experiments with progressively increasing thermal perturbation on the samples according to the specific application one wants to realize.
Data Availability Statement
The raw data supporting the conclusions of this article will be made available by the authors upon reasonable request.
Ethics Statement
Ethical review and approval was not required for the animal study because nonfeeding Danio rerio larvae are excepted from the Netherlands Animal Testing Act (Wod Article 1b.5).
Author contributions
LM contributed to conception and design of the study, performed all optical experiments, analyzed the data, and wrote the first draft of the manuscript. LM, MO, and HS performed biochemical assays and animal care. EC designed and supervised the study and revised the manuscript.
Funding
This work was funded by Delft University of Technology. LM acknowledges additional support from project OCENW. XS5.102 which was financed by the Dutch Research Council (NWO).
Acknowledgments
The authors wish to acknowledge Dr. Nicolò Ceffa for help designing the imaging optics. The Tg(elavl3:GCaMP6f) line was a kind gift from Prof. Herwig Baier. We thank the Department of Bionanoscience for use of equipment for western blot. We also thank Dr. Erin Faught for discussion of western blot results and Prof. Marcel Schaaf for trainings in his lab.
Conflict of interest
The authors declare that the research was conducted in the absence of any commercial or financial relationships that could be construed as a potential conflict of interest.
Publisher’s note
All claims expressed in this article are solely those of the authors and do not necessarily represent those of their affiliated organizations, or those of the publisher, the editors and the reviewers. Any product that may be evaluated in this article, or claim that may be made by its manufacturer, is not guaranteed or endorsed by the publisher.
References
1. Emiliani V, Cohen AE, Deisseroth K, Häusser M. All-optical interrogation of neural circuits. J Neurosci (2015) 35:13917–26. doi:10.1523/JNEUROSCI.2916-15.2015
2. Kramer RH, Mourot A, Adesnik H. Optogenetic pharmacology for control of native neuronal signaling proteins. Nat Neurosci (2013) 16:816–23. doi:10.1038/nn.3424
3. Dal Maschio M, Donovan JC, Helmbrecht TO, Baier H. Linking neurons to network function and behavior by two-photon holographic optogenetics and volumetric imaging. Neuron (2017) 94:774–89.e5. doi:10.1016/j.neuron.2017.04.034
4. Mardinly AR, Oldenburg IA, Pégard NC, Sridharan S, Lyall EH, Chesnov K, et al. Precise multimodal optical control of neural ensemble activity. Nat Neurosci (2018) 21:881–93. doi:10.1038/s41593-018-0139-8
5. Rickgauer JP, Tank DW. Two-photon excitation of channelrhodopsin-2 at saturation. Proc Natl Acad Sci U S A (2009) 106:15025–30. doi:10.1073/pnas.0907084106
6. Diaspro A, Robello M. Two-photon excitation of fluorescence for three-dimensional optical imaging of biological structures. J Photochem Photobiol B: Biol (2000) 55:1–8. doi:10.1016/s1011-1344(00)00028-2
7. Curcio JA, Petty CC. The near infrared absorption spectrum of liquid water. J Opt Soc Am (1951) 41:302–4. doi:10.1364/josa.41.000302
8. Rauzi M, Lenne PF. Cortical forces in cell shape changes and tissue morphogenesis. Curr Top Dev Biol (2011) 95:93–144. doi:10.1016/B978-0-12-385065-2.00004-9
9. KKönig . Multiphoton microscopy in life sciences. J Microsc (2000) 200:83–104. doi:10.1046/j.1365-2818.2000.00738.x
10. Andersen P, Moser EI. Brain temperature and hippocampal function. Hippocampus (1995) 5:491–8. doi:10.1002/hipo.450050602
11. Stujenske JM, Spellman T, Gordon JA. Modeling the spatiotemporal dynamics of light and heat propagation for InVivo optogenetics. Cel Rep (2015) 12:525–34. doi:10.1016/j.celrep.2015.06.036
12. Deng W, Goldys EM, Farnham MM, Pilowsky PM. Optogenetics, the intersection between physics and neuroscience: Light stimulation of neurons in physiological conditions. Am J Physiology-Regulatory Integr Comp Physiol (2014) 307:R1292–302. doi:10.1152/ajpregu.00072.2014
13. Picot A, Dominguez S, Liu C, Chen IW, Tanese D, Ronzitti E, et al. Temperature rise under two-photon optogenetic brain stimulation. Cel Rep (2018) 24:1243–53.e5. doi:10.1016/j.celrep.2018.06.119
14. Podgorski K, Ranganathan G. Brain heating induced by near-infrared lasers during multiphoton microscopy. J Neurophysiol (2016) 116:1012–23. doi:10.1152/jn.00275.2016
15. Wang T, Wu C, Ouzounov DG, Gu W, Xia F, Kim M, et al. Quantitative analysis of 1300-nm three-photon calcium imaging in the mouse brain. eLife (2020) 9:e53205. doi:10.7554/eLife.53205
16. Chaigneau E, Ronzitti E, Gajowa MA, Soler-Llavina GJ, Tanese D, Brureau AY, et al. Two-photon holographic stimulation of ReaChR. Front Cel Neurosci (2016) 10:234. doi:10.3389/fncel.2016.00234
17. Ronzitti E, Conti R, Zampini V, Tanese D, Foust AJ, Klapoetke N, et al. Submillisecond optogenetic control of neuronal firing with two-photon holographic photoactivation of chronos. J Neurosci (2017) 37:10679–89. doi:10.1523/JNEUROSCI.1246-17.2017
18. Masters BR, So PTC, Buehler C, Barry N, Sutin JD, Mantulin WW, et al. Mitigating thermal mechanical damage potential during two-photon dermal imaging. J Biomed Opt (2004) 9:1265–70. doi:10.1117/1.1806135
19. Antal PG, Szipocs R. Tunable, low-repetition-rate, cost-efficient femtosecond Ti:sapphire laser for nonlinear microscopy. Appl Phys B (2012) 107:17–22. doi:10.1007/s00340-011-4830-7
20. Chen TW, Wardill TJ, Sun Y, Pulver SR, Renninger SL, Baohan A, et al. Ultra-sensitive fluorescent proteins for imaging neuronal activity. Nature (2013) 499:295–300. doi:10.1038/nature12354
21. Cheng LC, Horton NG, Wang K, Chen SJ, Xu C. Measurements of multiphoton action cross sections for multiphoton microscopy. Biomed Opt Express (2014) 5:3427–33. doi:10.1364/boe.5.003427
22. Ramaswamy M, Ulman M, Paye J, Fujimoto JG. Cavity-dumped femtosecond Kerr-lens mode-locked Ti:Al_2O_3 laser. Opt Lett (1993) 18:1822–4. doi:10.1364/ol.18.001822
23. Ellis-Davies GCR. Two-photon uncaging of glutamate. Front Synaptic Neurosci (2019) 10:48. doi:10.3389/fnsyn.2018.00048
24. Nikolenko V, Watson BO, Araya R, Woodruff A, Peterka DS, Yuste R. SLM microscopy: Scanless two-photon imaging and photostimulation with spatial light modulators. Front Neural Circuits (2008) 2:5. doi:10.3389/neuro.04.005.2008
25. Carroll EC, Berlin S, Levitz J, Kienzler MA, Yuan Z, Madsen D, et al. Two-photon brightness of azobenzene photoswitches designed for glutamate receptor optogenetics. Proc Natl Acad Sci U S A (2015) 112:E776–85. doi:10.1073/pnas.1416942112
26. Forli A, Pisoni M, Printz Y, Yizhar O, Fellin T. Optogenetic strategies for high-efficiency all-optical interrogation using blue-light-sensitive opsins. eLife (2021) 10:e63359. doi:10.7554/eLife.63359
27. Zhou X, Kapteyn H, Murnane M. Positive-dispersion cavity-dumped Ti: Sapphire laser oscillator and its application to white light generation. Opt Express (2006) 14:9750–7. doi:10.1364/oe.14.009750
28. Horton NG, Wang K, Kobat D, Clark CG, Wise FW, Schaffer CB, et al. In vivo three-photon microscopy of subcortical structures within an intact mouse brain. Nat Photon (2013) 7:205–9. doi:10.1038/nphoton.2012.336
29. Wang T, Ouzounov DG, Wu C, Horton NG, Zhang B, Wu CH, et al. Three-photon imaging of mouse brain structure and function through the intact skull. Nat Methods (2018) 15:789–92. doi:10.1038/s41592-018-0115-y
30. Russell LE, Dalgleish HW, Nutbrown R, Gauld OM, Herrmann D, Fişek M, et al. All-optical interrogation of neural circuits in behaving mice. Nat Protoc (2022) 17:11579–620. doi:10.1038/s41596-022-00691-w
31. Ronzitti E, Emiliani V, Papagiakoumou E. Methods for three-dimensional all-optical manipulation of neural circuits. Front Cel Neurosci (2018) 12:469. doi:10.3389/fncel.2018.00469
32. de Medeiros G, Kromm D, Balazs B, Norlin N, Günther S, Izquierdo E, et al. Cell and tissue manipulation with ultrashort infrared laser pulses in light-sheet microscopy. Sci Rep (2020) 10:1942–12. doi:10.1038/s41598-019-54349-x
33. Peron S, Pancholi R, Voelcker B, Wittenbach JD, Ólafsdóttir HF, Freeman J, et al. Recurrent interactions in local cortical circuits. Nature (2020) 579:256–9. doi:10.1038/s41586-020-2062-x
34. Basu N, Todgham AE, Ackerman PA, Bibeau MR, Nakano K, Schulte PM, et al. Heat shock protein genes and their functional significance in fish. Gene (2002) 295:173–83. doi:10.1016/S0378-1119(02)00687-X
35. Hsu LY, Yeh FL, Cheng TY, Chang YH, Liu SM, Hsu T. A spontaneous high expression of heat shock cognate 70 (HSC 70) in zebrafish Danio rerio larvae arising from tissue-specific translation of preexisting mRNA. Fish Sci (2010) 76:857–64. doi:10.1007/s12562-010-0267-x
36. Yeh FL, Hsu T. Detection of a spontaneous high expression of heat shock protein 70 in developing zebrafish (danio rerio). Biosci Biotechnol Biochem (2000) 64:592–5. doi:10.1271/bbb.64.592
37. Kimmel CB, Ballard WW, Kimmel SR, Ullmann B, Schilling TF. Stages of embryonic development of the zebrafish. Dev Dyn (1995) 203:253–310. doi:10.1002/aja.1002030302
38. Zhang F, Vierock J, Yizhar O, Fenno LE, Tsunoda S, Kianianmomeni A, et al. The microbial opsin family of optogenetic tools. Cell (2011) 147:1446–57. doi:10.1016/j.cell.2011.12.004
39. Faini G, Molinier C, Telliez C, Tourain C, Forget BC, Ronzitti E, et al. Ultrafast light targeting for high-throughput precise control of neuronal networks. bioRxiv (2021). doi:10.1101/2021.06.14.448315
40. Shoji W, Sato-Maeda M. Application of heat shock promoter in transgenic zebrafish. Dev Growth Differ (2008) 50:401–6. doi:10.1111/j.1440-169X.2008.01038.x
41. Hardy ME, Ross LV, Chien CB. Focal gene misexpression in zebrafish embryos induced by local heat shock using a modified soldering iron. Dev Dyn (2007) 236:3071–6. doi:10.1002/dvdy.21318
Keywords: nonlinear optics, photostimulation, computer generated holography, laser cavity dumping, light-tissue interaction, optogenetics
Citation: Maddalena L, Ouwehand M, Safdar H and Carroll EC (2022) Flexible control of pulse intensity and repetition rate for multiphoton photostimulation. Front. Phys. 10:1005094. doi: 10.3389/fphy.2022.1005094
Received: 27 July 2022; Accepted: 26 August 2022;
Published: 05 October 2022.
Edited by:
Antonio Riveiro Rodriguez, University of Vigo, SpainCopyright © 2022 Maddalena, Ouwehand, Safdar and Carroll. This is an open-access article distributed under the terms of the Creative Commons Attribution License (CC BY). The use, distribution or reproduction in other forums is permitted, provided the original author(s) and the copyright owner(s) are credited and that the original publication in this journal is cited, in accordance with accepted academic practice. No use, distribution or reproduction is permitted which does not comply with these terms.
*Correspondence: Elizabeth C. Carroll, e.c.m.carroll@tudelft.nl