ERK phosphorylation disrupts the intramolecular interaction of capicua to promote cytoplasmic translocation of capicua and tumor growth
 Jongmin Park1
  Guk-Yeol Park1 Jongeun Lee1
  Joonyoung Park1 Soeun Kim1 Eunjeong Kim2
  Seung-Yeol Park1
  Jong Hyuk Yoon3
  Yoontae Lee1,4*
- 1Department of Life Sciences, Pohang University of Science and Technology, Pohang, Gyeongbuk, South Korea
- 2Department of Biology, College of Natural Sciences, Kyungpook National University, Daegu, South Korea
- 3Neurodegenerative Diseases Research Group, Korea Brain Research Institute, Daegu, South Korea
- 4Institute of Convergence Science, Yonsei University, Seoul, South Korea
Activation of receptor tyrosine kinase signaling inactivates capicua (CIC), a transcriptional repressor that functions as a tumor suppressor, via degradation and/or cytoplasmic translocation. Although CIC is known to be inactivated by phosphorylation, the mechanisms underlying the cytoplasmic translocation of CIC remain poorly understood. Therefore, we aimed to evaluate the roles of extracellular signal-regulated kinase (ERK), p90RSK, and c-SRC in the epidermal growth factor receptor (EGFR) activation-induced cytoplasmic translocation of CIC and further investigated the molecular basis for this process. We found that nuclear ERK induced the cytoplasmic translocation of CIC-S. We identified 12 serine and threonine (S/T) residues within CIC, including S173 and S301 residues that are phosphorylated by p90RSK, which contribute to the cytoplasmic translocation of CIC-S when phosphorylated. The amino-terminal (CIC-S-N) and carboxyl-terminal (CIC-S-C) regions of CIC-S were found to interact with each other to promote their nuclear localization. EGF treatment disrupted the interaction between CIC-S-N and CIC-S-C and induced their cytoplasmic translocation. Alanine substitution for the 12 S/T residues blocked the cytoplasmic translocation of CIC-S and consequently enhanced the tumor suppressor activity of CIC-S. Our study demonstrates that ERK-mediated disruption of intramolecular interaction of CIC is critical for the cytoplasmic translocation of CIC, and suggests that the nuclear retention of CIC may represent a strategy for cancer therapy.
Introduction
Capicua (CIC) is a transcriptional repressor evolutionarily conserved in several species ranging from Caenorhabditis elegans to humans (Jimenez et al., 2000). In mammals, CIC participates in the regulation of various developmental processes, including abdominal wall closure during embryogenesis, lung alveolarization, brain development, and lymphocyte development (Lee et al., 2011; Lu et al., 2017; Park et al., 2017; Simon-Carrasco et al., 2017; Tan et al., 2018; Ahmad et al., 2019; Kim et al., 2021; Hong et al., 2022). CIC additionally regulates the pathogenesis of various diseases, such as spinocerebellar ataxia type-1, autoimmune disease, and liver injury (Fryer et al., 2011; Park et al., 2017; Park et al., 2019; Park et al., 2020). Among these diseases, the role of CIC in cancer has been most extensively studied. Mutations and loss of CIC have been reported to promote the progression of various cancers via derepression of cancer-associated CIC target genes, including polyomavirus enhancer activator 3 (PEA3) group genes (ETS variant transcription factor 1 [ETV1], ETV4, and ETV5) (Kawamura-Saito et al., 2006; Choi et al., 2015; Okimoto et al., 2017; Kim et al., 2018; Bunda et al., 2019; Lee et al., 2020).
CIC is expressed via alternative promoters in two different isoforms, long isoform (CIC-L) and short isoform (CIC-S) (Fryer et al., 2011). CIC-L contains a unique amino (N)-terminal region. Both CIC-L and CIC-S have a high-mobility group (HMG) box and a C1 domain, by which they directly bind to specific octameric DNA sequences, T (G/C)AATG (A/G) (A/G), to repress target gene expression (Shin and Hong, 2014; Fores et al., 2017; Weissmann et al., 2018). Activation of the receptor tyrosine kinase (RTK) pathway inactivates CIC via degradation and/or cytoplasmic translocation in Drosophila and mammals (Jimenez et al., 2012). Deletion of the C2 motif, which is the mitogen-activated protein kinase (MAPK) docking site of CIC, inhibits RTK activation-induced cytoplasmic translocation and degradation of CIC in Drosophila (Astigarraga et al., 2007). Deletion of the extracellular signal-regulated kinase (ERK)-binding site similarly suppresses nuclear degradation of CIC induced by epidermal growth factor receptor (EGFR) activation in humans (Futran et al., 2015; Bunda et al., 2019). Consistent with this observation, the inhibition of MAPK kinase (MEK), an upstream kinase of ERK, increases CIC levels in human cells treated with EGF (Okimoto et al., 2017; Wang et al., 2017; Bunda et al., 2019). However, other studies have shown that EGF treatment does not induce CIC degradation in mammalian cells (Ren et al., 2020; Wong et al., 2020), suggesting that the RTK activation-induced CIC degradation may depend on experimental conditions. Inactivation of MEK and p90RSK, a downstream kinase of ERK, suppresses the cytoplasmic translocation of CIC in HEK293T cells upon EGF or fibroblast growth factor treatment (Ren et al., 2020). Specifically, p90RSK phosphorylates CIC at serine (S) 173 and 301 residues (in the case of human CIC-S) to induce 14-3-3-mediated nuclear export of CIC (Ren et al., 2020). Moreover, EGF-induced proto-oncogene tyrosine-protein kinase Src (c-SRC) activation induces cytoplasmic translocation of CIC via phosphorylation of tyrosine (Y) 1,455 residue (in the case of human CIC-S) (Bunda et al., 2020). Although a few amino acid residues of CIC and kinases responsible for the RTK activation-induced cytoplasmic translocation of CIC have been identified in mammals, the mechanism by which phosphorylated CIC is transported into the cytoplasm remains poorly understood. Therefore, we aimed to evaluate ERK, p90RSK, and c-SRC for their contribution to the EGFR activation-induced cytoplasmic translocation of CIC and further investigated the molecular basis for this process. Our study revealed that nuclear ERK mediated the cytoplasmic translocation of CIC-S by disrupting the intramolecular interaction of CIC-S and that nuclear retention of CIC suppressed CIC target gene expression and tumor growth.
Materials and methods
Cell culture
HEK293T and MHCC-97H cells were cultured in Dulbecco’s modified Eagle medium (DMEM) (LM001-05; Welgene, Gyeongsan, Republic of Korea) supplemented with 10% fetal bovine serum (FBS) (S001-07, Welgene) and 1% penicillin/streptomycin (15140122; Gibco, Waltham, MA, United States) at 37°C in a 5% CO2 incubator. For EGF and chemical treatment experiments, HEK293T cells were cultured in DMEM without FBS for 12 h. Cells were routinely screened and were found to be free of mycoplasma contamination.
EGF and chemical treatment
To induce RTK signaling, HEK293T cells were treated with 0.1 μg/ml of recombinant human EGF (AF-100-15A; Peprotech, Cranbury, NJ, United States) dissolved in phosphate-buffered saline (PBS) containing 0.2% bovine serum albumin. The conditions for the kinase inhibitor treatment were determined based on previous studies: SCH772984 (S7101, SelleckChem, Houston, TX, United States): 10 μM for 2 h (Martinez et al., 2021), DEL22379 (S7921, SelleckChem): 10 μM for 30 min (Herrero et al., 2015), LJH685 (S7870, SelleckChem): 10 μM for 3 h (Ren et al., 2020), and dasatinib (73082, STEMCELL Technologies, Vancouver, Canada): 200 nM for 1 h (Koreckij et al., 2009). To inhibit the proteasome complex, the cells were treated with 10 μM MG132 (C2211, Sigma–Aldrich, St. Louis, MO, United States) for 6 h.
Plasmid construction and site-directed mutagenesis
The coding sequence (CDS) of mouse Cic-S was amplified using Pfu-X DNA polymerase (SPX16; SolGent, Daejeon, Republic of Korea) and cloned into the p3XFLAG-CMV-10 vector (p3XFLAG-CMV-10-CIC-SWT; E7658, Sigma–Aldrich) or MIGR1-GFP vector (MIGR1-FLAG-CIC-SWT-GFP; 27490; Addgene, Watertown, MA, United States). pHAGE-FLAG-CIC-S was constructed as described previously (Choi et al., 2015). A series of C-terminally truncated CIC-S mutants (CIC-SΔ1389−end, CIC-SΔ1302−end, CIC-SΔ1184−end, CIC-SΔ910−end, and CIC-SΔ601−end) were cloned into the p3XFLAG-CMV-10 vector. The N-terminal region of CIC-S containing a FLAG tag at the N-terminus (FLAG-CIC-S-N, residues 1–700) and the C-terminal region of CIC-S containing an HA tag at the C-terminus (CIC-S-C-HA, residue 701 to the end) were cloned into an MIGR1-GFP vector.
p3XFLAG-CMV-10-CIC-SH1∼5A, p3XFLAG-CMV-10-CIC-SC1∼5A, p3XFLAG-CMV-10-CIC-SH12A, p3XFLAG-CMV-10-CIC-SH345A, and p3XFLAG-CMV-10-CIC-SY1451F were generated using the QuickChange II XL Site-Directed Mutagenesis kit (200521; Agilent Technologies, Santa Clara, CA, United States) according to the manufacturer’s protocol. The FLAG-CIC-SH1∼5A fragment (1–680 residues) digested using NotI and BstPI was sub-cloned into the p3XFLAG-CMV-10-CIC-SC1∼5A plasmid to construct the p3XFLAG-CMV-10-CIC-SCH1∼5A plasmid. FLAG-CIC-SCH1∼5A was also cloned into the MIGR1-GFP vector (MIGR1-FLAG-CIC-SCH1∼5A-GFP) using the BglII and HpaI restriction enzyme sites.
Kinase overexpression studies were performed using pKH3-human RSK1 (13841, Addgene), pcDNA3 c-SRC (42202, Addgene), pCMV-myc-ERK2-L4A-MER1-fusion (39197, Addgene), and pCMV-myc-ERK2-MER1-fusion (39194, Addgene) plasmids. The CDS of mouse Erk2 was amplified using Pfu-X DNA polymerase and cloned into the pCK-V5 vector (Han et al., 2004). Constitutively active mutations (ERK2 L73P/S151D) were introduced using the QuickChange II XL Site-Directed Mutagenesis kit according to the manufacturer’s protocol. The same amount of p3XFLAG-CMV-10, pCK-V5, and pKH3 (12555, Addgene) plasmids were used for negative control (NC) transfection. pEGFP-C1 (6084-1; TakaraBio, Kusatsu, Japan) plasmid was used as a control for the transfection efficiency. METAFECTENE PRO (T040; Biontex, Munich, Germany) was used for plasmid transfection. Primers used for cloning and mutagenesis are listed in Supplementary Table S1.
Generation of CIC-KO HEK293T cells using the CRISPR-Cas9 system
A CIC-targeting CRISPR-Cas9 plasmid was constructed as previously described (Ran et al., 2013). Briefly, a DNA fragment encoding the single guide RNA targeting exon 4 of CIC (sgCIC, 5′-CTCTACCGCCCGGAAAACGT-3′) was cloned into the pSpCas9(BB)-2A-GFP vector (48138, Addgene) using the BbsI restriction enzyme site. HEK293T cells were grown to 70% confluence and transfected with pSpCas9(BB)-2A-GFP-sgCIC using FuGENE HD (E2311; Promega, Madison, WI, United States) according to the manufacturer’s instructions. Green fluorescent protein positive (GFP+) cells were single cell-sorted into 96-well plates using a MoFlo-XDP cell sorter (Beckman Coulter, Brea, CA, United States). Established cell clones were assayed for CIC expression by western blotting to select CIC-KO HEK293T cell clones. Genomic DNA flanking exon 4 of CIC was amplified by polymerase chain reaction (PCR), and the PCR products were cloned into a T-blunt vector (SOT02-K020, SolGent). Subsequently, the deleted DNA sequences in exon 4 of CIC were identified via sequencing.
Virus production and transduction
To generate viruses expressing ERK-kinase translocation reporter (ERK-KTR), HEK293T cells were co-transfected with pLentiPGK Puro DEST ERK-KTRClover (90227, Addgene), pSPAX2 (12260, Addgene), and pDM2.G (12259, Addgene) using FuGENE HD. Viral supernatants were collected 48 h after transfection and concentrated using a Lenti-X Concentrator (631231, TakaraBio) according to the manufacturer’s protocol. The resuspended pellet was used to infect HEK293T cells, and 10 μg/ml puromycin (A1113803, Gibco) was added to select drug-resistant cells at 48 h post-infection.
To generate retroviruses expressing control, FLAG-CIC-SWT, or FLAG-CIC-SCH1∼5A, the HEK293T cells were co-transfected with gag/pol (14887, Addgene), pVSVg (8454, Addgene), pAdVAntage (E1711, Promega), and either MIGR1-FLAG-CIC-SWT-GFP, MIGR1-FLAG-CIC-SCH1∼5A-GFP, or MIGR1-GFP control retroviral vector using FuGENE HD. Viral supernatants were collected 48 h after transfection and used to infect the CIC-KO HEK293T cells. Subsequently, GFP+ cells were sorted using a MoFlo-XDP cell sorter.
For in vitro cell growth and in vivo tumor growth assays, lentiviruses expressing FLAG-CIC-SWT and FLAG-CIC-SCH1∼5A were generated via the same protocol using the pHAGE-FLAG-CIC-SWT and pHAGE-FLAG-CIC-SCH1∼5A plasmids. Viral supernatants were collected 48 h after transfection and used to infect MHCC-97H cells for three sequential days.
Western blot analysis
Western blot analysis was performed as previously described (Park et al., 2020). Total protein samples were prepared by lysis in radioimmunoprecipitation assay (RIPA) buffer [50 mM Tris-HCl pH 7.4, 150 mM NaCl, 1 mM phenylmethylsulfonyl fluoride, 1% NP-40, 0.5% sodium deoxycholate, 0.1% sodium dodecyl sulfate (SDS), 1× Complete Protease Inhibitor Cocktail (43229800; Roche, Basel, Switzerland), and 1× phosphatase inhibitor cocktail (4906837001, Roche)]. Nuclear and cytoplasmic protein samples were prepared using NE-PER Nuclear and Cytoplasmic Extraction Reagents (78833; Thermo Fisher Scientific, Waltham, MA, United States) according to the manufacturer’s protocol. Protein concentrations were measured using a bicinchoninic acid assay kit (23225, Thermo Fisher Scientific). Equal amounts of protein were prepared and boiled in sample buffer (250 mM Tris-HCl pH 6.8, 50% glycerol, 10% SDS, 5% β-mercaptoethanol, and 0.1% bromophenol blue) for 5 min. Protein samples were separated using 9% SDS-polyacrylamide gel electrophoresis and transferred onto nitrocellulose membranes (162-0115; BioRad, Hercules, CA, United States). Rabbit polyclonal anti-CIC antibodies were generated as previously described (Kim et al., 2015). The primary antibodies used were as follows: anti-FLAG (1:3000 dilution; F7425, Sigma–Aldrich), anti-lamin A/C (1:3000 dilution; 2032S, Cell Signaling Technology, Danvers, MA, United States), anti-α-tubulin (1:2000 dilution; sc-398103, Santa Cruz Biotechnology, Dallas, TX, United States), anti-ERK (1:3000 dilution; 9102S, Cell Signaling Technology), anti-P-ERK (1:1000 dilution; 4370S, Cell Signaling Technology), anti-glyceraldehyde 3-phosphate dehydrogenase (GAPDH; 1:2000 dilution; sc-32233, Santa Cruz Biotechnology), anti-HA (1:2000 dilution; 3724S, Cell Signaling Technology), anti-ETV4 (1:1000 dilution; 10684-1-AP, Proteintech, Rosemont, IL, United States), anti-ETV5 (1:1000 dilution; 13011-1-AP, Proteintech), anti-lamin B (1:1000 dilution; sc-374015, Santa Cruz Biotechnology), anti-β-actin (1:2000 dilution; sc-47778, Santa Cruz Biotechnology), anti-Myc (1:2000 dilution; 71D10, Cell Signaling Technology), anti-c-SRC (1:1000 dilution; 42202, Santa Cruz Biotechnology), and anti-GFP (1:2000 dilution; sc-8334, Santa Cruz Biotechnology). Proteins were visualized using Clarity Western ECL Substrate (170-5061, BioRad) or SuperSignal West Dura Substrate (34076, Thermo Fisher Scientific). Western blot images were obtained using Image Quant LAS 500 (GE Healthcare Life Sciences, Marlborough, MA, United States). The band intensity was quantified using ImageJ software (v. 1.46r; National Institutes of Health, Bethesda, MD, United States).
Immunocytochemistry
HEK293T_ERK-KTR cells (4 × 10⁴ cells/ml) were seeded onto 6-well plates containing circular cover glasses (Ф12 mm), and the following day, the cells were transfected with p3XFLAG-CMV-10-FLAG-CIC-SWT or p3XFLAG-CMV-10-FLAG-CIC-SCH1∼5A plasmid for 48 h. Cells were fixed with 4% paraformaldehyde (PFA; P2031, BIOSESANG, Seongnam, Republic of Korea) at room temperature (RT; 22°C–26°C) for 10 min and then incubated with cold methanol at −20°C for 10 min. Cells fixed on the cover glasses were blocked in PBS containing 10% FBS and 0.05% NaN3 for 1 h and then incubated with a monoclonal ANTI-FLAG M2 antibody (1:100 dilution; F1804, Sigma–Aldrich) in PBS containing 10% FBS, 0.05% NaN3, and 0.2% saponin at 4°C overnight. This was followed by incubation with secondary anti-mouse IgG Alexa Fluor 633 (1:500 dilution; A-21053, CiteAb, Bath, United Kingdom) in PBS containing 10% FBS, 0.05% NaN3, and 0.2% saponin at 4°C for 1 h. After staining with 4′,6-diamidino-2-phenylindole (DAPI; F6057, Sigma–Aldrich) for 5 min, the cover glass was washed with PBS containing 10% FBS and 0.05% NaN3 and mounted on the slide glass using a Fluoromount-G mounting solution (0100-01, SouthernBiotech, Birmingham, AL, United States). Images of the slides were obtained using an LSM 800 confocal microscope (Carl Zeiss, Oberkochen, Germany) with a 63× oil-immersion lens. Fluorescence intensity quantification was performed using the ImageJ software.
Proximity ligation assay
HEK293T cells (4 × 10⁴ cells/ml) were seeded onto 6-well plates containing circular cover glasses (Ф12 mm), and the following day, the cells were co-transfected with MIGR1-FLAG-CIC-S-N-GFP and MIGR1-CIC-S-C-HA-GFP plasmids using FuGENE HD for 48 h. Cells were fixed with 4% PFA at RT for 10 min and then permeabilized with 0.1% Triton X-100 (TRX777; BIOPURE, Dasan, Republic of Korea) at RT for 10 min. Proximity ligation assay was performed using the Duolink In Situ PLA Probe Anti-Rabbit PLUS (DUO92002, Sigma–Aldrich) according to the manufacturer’s protocol. The monoclonal ANTI-FLAG M2 antibody (1:200 dilution) and anti-HA antibody (1:200 dilution) were used as primary antibodies. Images of the slides were obtained using an LSM 800 confocal microscope with a 63× oil-immersion lens.
Quantitative real-time PCR (qRT-PCR)
Total RNA was extracted using TRIzol reagent (10296-010, Thermo Fisher Scientific), and reverse transcription was performed using the GoScript™ Reverse Transcription System (A5004, Promega) according to the manufacturer’s instructions. SYBR Green real-time PCR master mix (TOQPK-201; Toyobo, Osaka, Japan) was used for the qRT-PCR analysis. The expression of each target gene was analyzed using StepOnePlus™ Real-Time PCR System (Applied Biosystems, Waltham, MA, United States). Expression data were calculated using the 2−ΔΔCt method and presented as relative mRNA expression levels. Gene expression levels were normalized to those of GAPDH. The primers used for qRT-PCR analysis were as follows: ETV5 forward: 5′-CATCCTACATGAGAGGGGGTTA-3′ and reverse: 5′-AAGTATAATGGGGGATCTTTTTCA-3′; DUSP6 forward: 5′-GAACTGTGGTGTCTTGGTACATT-3′ and reverse: 5′-GTTCATCGACAGATTGAGCTTCT-3′; GAPDH forward: 5′-ACAACTTTGGTATCGTGGAAGG-3′ and reverse: 5′-GCCATCACGCCACAGTTTC-3′.
Co-immunoprecipitation
To investigate the interaction between the N-terminal and C-terminal regions of CIC-S, HEK293T cells were transfected with FLAG-CIC-S-N and CIC-S-C-HA expression plasmids. The cells were harvested, centrifuged at 500 × g for 5 min, and fixed with 1% PFA in PBS with shaking at 50 rpm at RT for 10 min. The fixation step was terminated by adding 1/20 volume of 2.5 M glycine. After an additional 5 min of incubation with shaking at 50 rpm at RT, fixed cells were collected by centrifugation at 500 g for 5 min and washed with PBS. The cell pellets were resuspended in 200 μl of IP buffer (20 mM Tris-HCl pH 8.0, 350 mM KCl, and 0.2 mM EDTA) for 12 cycles of sonication (cycle: 0.5 and amplitude: 50; UP 400 s, Hielscher, Teltow, Germany). After centrifugation at 17,000 × g for 15 min, the supernatants were collected and incubated with Protein G Agarose (16-266, Merck, Kenilworth, NJ, United States) for 1 h at 4°C with rotation at 12 rpm for pre-clearing. After centrifugation, the supernatants were incubated with ANTI-FLAG M2 affinity gel (A2220, Sigma–Aldrich) overnight at 4°C. Beads were collected by centrifugation and washed with IP buffer. To elute the immunoprecipitated proteins, the beads were boiled in the sample buffer for 10 min. Eluted proteins were subjected to western blot analysis.
DNA binding assay
HEK293T cells (4.4 × 10⁶ cells/6 ml) were seeded onto Ф100 mm dish, and the following day, the cells were transfected with p3XFLAG-CMV-10 or p3XFLAG-CMV-10-CIC-SWT expression plasmids. After approximately 72 h, cells were treated with either PBS or EGF for 5min, harvested, and centrifuged at 1300 × g for 5 min. The cell pellets were resuspended in 400 μl of 100 mM KCl IP buffer (20 mM Tris-HCl pH 8.0, 100 mM KCl, 1× Complete Protease Inhibitor Cocktail, and 1× phosphatase inhibitor cocktail) for 16 cycles of sonication (cycle: 0.5 and amplitude: 50). After centrifugation at 17,000 × g for 15 min, protein concentrations were measured using a bicinchoninic acid assay kit. The same amount of proteins was incubated with 4 × 10⁻¹ pmole of double stranded DNA (dsDNA) oligomer composed of six consecutive CIC binding motifs in 400 ul of 100 mM KCl IP buffer for 1 h at 37°C. Each sample was incubated with 10 μl of Protein G Agarose for 1 h at 4°C with rotation at 12 rpm for pre-clearing. After centrifugation at 1,000 × g for 2 min, the supernatants were incubated with 10 μl of ANTI-FLAG M2 affinity gel overnight at 4°C. Beads were collected by centrifugation and washed five times with 150 mM KCl IP buffer (20 mM Tris-HCl pH 8.0, 150 mM KCl, 0.2 mM EDTA) for 5 min at 4°C with rotation at 12 rpm. To elute DNA bound to FLAG-CIC-S, the beads were incubated with 100 ul of elution buffer (100 mM NaHCO3 and 0.5% SDS) twice for 30 min at RT with rotation at 12 rpm. Approximately 200 ul of the collected eluate was treated with Proteinase K (P1048, BIOSESANG) at 45°C for 1.5 h, and then subjected to DNA purification using Expin™ CleanUp SV (113-102, GeneAll, Seoul, Republic of Korea). Purified DNA was subjected to qPCR analysis. To calculate the amount of immunoprecipitated dsDNA oligomer, Ct values for different amount of dsDNA oligomers (10–2, 10–3, 10–4, 10–5, 10–6, and 10–7 pmole) were also determined by qPCR analysis. The sequences of dsDNA oligomer were as follows: upper strand; 5′-GACAACTTTGGTATCGTGGAAGGTGAATGAATGAATGGATGAATGAATGAATGGATGAATGAATGAATGGAAACTGTGGCGTGATGGCG-3′, and lower strand; 5′-CGCCATCACGCCACAGTTTCCATTCATTCATTCATCCATTCATTCATTCATCCATTCATTCATTCACCTTCCACGATACCAAAGTTGTC-3′. The primers used for qRT-PCR analysis were as follows: forward primer; 5′-AACTTTGGTATCGTGGAAGGTG-3′, and reverse primer; 5′-GCCATCACGCCACAGTTTC-3′.
Cell growth assay
Mock, FLAG-CIC-SWT-, and FLAG-CIC-SCH1∼5A-expressing MHCC-97H cells (2 × 10⁴ cells/500 μl) were seeded in 24-well plates. Cells were trypsinized and stained with Trypan Blue (T8154, Sigma–Aldrich), and the number of viable cells was counted using a hemacytometer every day for 4 days.
In vivo tumor growth assay
Five-week-old male BALB/c nude mice were purchased from Orient Bio (Seongnam, Republic of Korea). Mice were acclimatized for 1 week and then used for in vivo tumor growth assays. Mice were fed standard rodent chow and water ad libitum and maintained in a specific pathogen-free animal facility under a standard 12 h light/12 h dark cycle. All experimental procedures were performed in accordance with guidelines and regulations approved by the Institutional Animal Care and Use Committee of POSTECH (POSTECH-2021-0094).
Mock, FLAG-CIC-SWT-, and FLAG-CIC-SCH1∼5A-expressing MHCC-97H cells were trypsinized, collected, and suspended in DMEM and Matrigel (354234; BD Biosciences, Franklin Lakes, NJ, United States) (1:1 volume). The cells (5 × 10⁶ cells/100 μl) were injected subcutaneously into the posterior flank of six-week-old male BALB/c nude mice. Tumor size was measured every 3 days for 18 days. The tumor volume was calculated as 0.5 × (largest diameter) × (smallest diameter)2. Mice were euthanized on day 18, and the tumors were collected, photographed, and weighed.
Statistical analysis
All experiments were performed at least three times independently. Data are presented as mean ± standard error of the mean (SEM). Quantitative data were compared between groups using the Student’s t-test (two-tailed, two-sample unequal variance). Statistical significance was set at p < 0.05.
Results
Cytoplasmic translocation of CIC-S mediated by nuclear ERK
We evaluated the effect of EGF treatment on the stability and nucleocytoplasmic distribution of CIC in HEK293T cells. Total CIC levels were not dramatically altered until 6 h after EGF treatment (Supplementary Figure S1A). In contrast, nuclear CIC-S levels significantly decreased within 2 h of EGF treatment, accompanied by an increase in cytoplasmic CIC-S levels (Supplementary Figure S1B). Thereafter, the nuclear and cytoplasmic CIC-S levels recovered to pre-EGF treatment levels (Supplementary Figure S1B). CIC-L was predominantly present in the nucleus (Supplementary Figure S1B), which is consistent with previous findings (Chittaranjan et al., 2014; Wang et al., 2017). Notably, the cytoplasmic translocation of CIC-L upon EGF treatment was not observed (Supplementary Figure S1B). These results indicate that in our experimental conditions, EGF treatment mainly affected the nucleocytoplasmic distribution of CIC-S and not the stability of CIC in HEK293T cells.
Three different kinases have been reported to mediate the phosphorylation and cytoplasmic translocation of CIC-S induced by RTK activation: ERK (Futran et al., 2015; Wang et al., 2017), p90RSK (Dissanayake et al., 2011; Ren et al., 2020), and c-SRC (Bunda et al., 2020). We investigated the role of these three kinases in the cytoplasmic translocation of CIC-S by treating HEK293T cells with EGF and their respective kinase inhibitors. Among the kinase inhibitors tested, SCH772984 (ERK1 and ERK2 inhibitor) showed the strongest suppression of EGF treatment-induced cytoplasmic translocation of CIC-S (Figure 1A). LJH685 (p90RSK inhibitor) less efficiently inhibited the cytoplasmic translocation of CIC-S than did SCH772984, whereas dasatinib (c-SRC inhibitor) had a negligible effect (Figure 1A). Notably, DEL22379, an ERK dimerization inhibitor (Herrero et al., 2015), blocked the cytoplasmic translocation of CIC-S to a lower extent than that mediated by SCH772984 (Figure 1A). Total CIC levels were largely unaffected by treatment with the kinase inhibitors (Supplementary Figure S2A). We also examined the effect of kinase inhibitors on cytoplasmic translocation of exogenous FLAG-tagged wild-type mouse CIC-S (FLAG-CIC-SWT) in HEK293T cells. As observed for endogenous CIC-S, the kinase inhibitors exerted similar effects on the FLAG-CIC-SWT (Figure 1B; Supplementary Figure S2B). Treatment with MG132, a proteasome complex inhibitor, did not increase FLAG-CIC-SWT levels in both the nucleus and cytoplasm of EGF-treated HEK293T cells (Supplementary Figure S1C), which was consistent with the results of no significant decrease in CIC levels upon EGF treatment (Supplementary Figures S2A, B). This result ruled out the possibility of proteasomal degradation of CIC-S by EGF treatment-induced activation of nuclear ERK (Bunda et al., 2019) in our experimental setting.
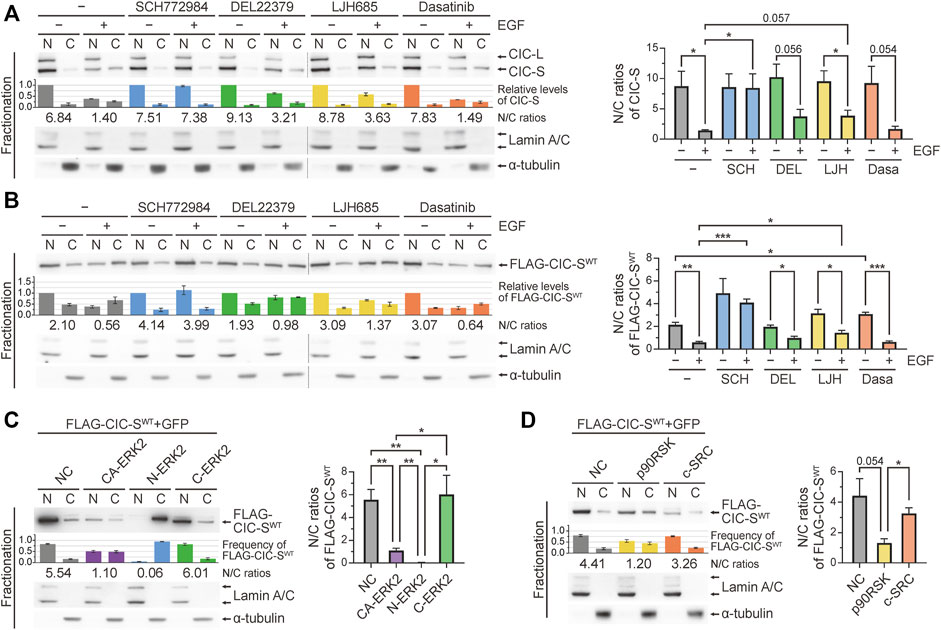
FIGURE 1. Cytoplasmic translocation of CIC-S mediated by ERK activation. (A) Western blotting was performed to determine the effect of kinase inhibitors on changes in the subcellular distribution of CIC in HEK293T cells upon EGF treatment for 30 min. The combination of separate blot images is indicated by dotted lines. The bar graph below the CIC blot image shows the relative levels of CIC-S that were not statistically analyzed. The numbers below the bar graph indicate the N/C ratios of CIC-S. The right panel is a bar graph of the N/C ratios of CIC-S with statistical analysis. Three independent experiments were performed. Error bars indicate SEM. *p < 0.05. SCH772984: ERK1/2 inhibitor, DEL22379: ERK dimerization inhibitor, LJH685: p90RSK inhibitor, and dasatinib: c-SRC inhibitor. (B) Western blotting was performed to determine the effect of kinase inhibitors on changes in the subcellular distribution of exogenous mouse CIC-S (FLAG-CIC-SWT) in HEK293T cells upon EGF treatment for 30 min. The combination of separate blot images is indicated by dotted lines. The bar graph below the FLAG-CIC-SWT blot image shows the relative levels of FLAG-CIC-SWT that were not statistically analyzed. The numbers below the bar graph indicate the N/C ratios of FLAG-CIC-SWT. The right panel is a bar graph of the N/C ratios of FLAG-CIC-SWT with statistical analysis. Three independent experiments were performed. Error bars indicate SEM. *p < 0.05, **p < 0.01, and ***p < 0.001. (C) Western blotting was performed to determine the effect of overexpression of constitutively active (CA-ERK2), nuclear (N-ERK2), and cytoplasmic (C-ERK2) ERK2 on the cytoplasmic translocation of FLAG-CIC-SWT in HEK293T cells. The bar graph below the FLAG-CIC-SWT blot image shows the frequency of FLAG-CIC-SWT in the nucleus and cytoplasm, which were not statistically analyzed. The numbers below the bar graph indicate the N/C ratios of FLAG-CIC-SWT. The right panel is a bar graph of the N/C ratios of FLAG-CIC-SWT with statistical analysis. Three independent experiments were performed. Error bars indicate SEM. *p < 0.05 and **p < 0.01. (D) Western blotting was performed to determine the effect of overexpression of p90RSK and c-SRC on the cytoplasmic translocation of FLAG-CIC-SWT in HEK293T cells. The bar graph below the FLAG-CIC-SWT blot image shows the frequency of FLAG-CIC-SWT in the nucleus and cytoplasm, which were not statistically analyzed. The numbers below the bar graph indicate the N/C ratios of FLAG-CIC-SWT. The right panel is a bar graph of the N/C ratios of FLAG-CIC-SWT with statistical analysis. Three independent experiments were performed. Error bars indicate SEM. *p < 0.05. N: nuclear fraction and C: cytoplasmic fraction. N/C: nuclear-to-cytoplasmic ratio.
Adenosine triphosphate-competitive inhibition of ERK1 and ERK2 by SCH772984 almost completely blocked the cytoplasmic translocation of CIC-S, whereas DEL22379-induced inhibition of ERK dimerization had only a marginal effect (Figures 1A, B). Since ERK dimers interact with and activate cognate cytoplasmic substrates (Casar et al., 2008), we hypothesized that nuclear ERK may be mainly involved in the cytoplasmic translocation of CIC-S. To test this hypothesis, we determined the amount of FLAG-CIC-SWT translocated into the cytoplasm upon overexpression of constitutively active forms of ERK2 (CA-ERK2), nuclear ERK2 (Myc-ERK2-MEK1-LA; N-ERK2), and cytoplasmic ERK2 (Myc-ERK2-MEK1; C-ERK2) (Robinson et al., 1998). CA-ERK2 overexpression induced the cytoplasmic translocation of FLAG-CIC-SWT (Figure 1C; Supplementary Figure S2C). Notably, this phenomenon was induced by the overexpression of N-ERK2 but not by the overexpression of C-ERK2 (Figure 1C; Supplementary Figure S2C), suggesting that nuclear ERK mediates cytoplasmic translocation of CIC-S. We also determined the effects of overexpression of p90RSK and c-SRC on the cytoplasmic translocation of FLAG-CIC-SWT. p90RSK overexpression had a stronger effect on the cytoplasmic translocation of FLAG-CIC-SWT than that mediated by c-SRC overexpression (Figure 1D; Supplementary Figure S2D), which was consistent with the results of the kinase inhibitor treatment experiments (Figures 1A,B). Collectively, our results demonstrate that nuclear ERK is a key kinase that mediates cytoplasmic translocation of CIC-S in mammals.
Identification of serine and threonine residues critical for the cytoplasmic translocation of CIC-S upon phosphorylation
p90RSK is a downstream kinase of ERK and induces 14-3-3-mediated cytoplasmic translocation of CIC via phosphorylation of the S173 and S301 residues of human CIC-S (Ren et al., 2020). We verified that alanine substitution of these two serine resides (FLAG-CIC-SH12A) significantly blocked the EGF treatment-induced cytoplasmic translocation of FLAG-CIC-S (Supplementary Figure S3A). ERK inhibition further inhibited the cytoplasmic translocation of FLAG-CIC-SH12A upon EGF treatment (Supplementary Figure S3B), which was consistent with the finding that ERK inhibition had a greater suppressive effect on this process than that of p90RSK (Figures 1A,B). Based on these results, we hypothesized that there are more ERK-mediated phosphorylation sites within CIC, which contribute to the EGF treatment-induced cytoplasmic translocation of CIC-S. EGF treatment induces phosphorylation of human CIC-S at 20 different serine and threonine (S/T) residues (Dissanayake et al., 2011). The corresponding S/T residues in mouse CIC-S are shown in Figure 2A. Notably, among the 20 S/T residues, 11 residues are located near the ERK-binding site of CIC-S (Figure 2A). Deletion of the C-terminal region of CIC-S from 1,302 to 1,397 amino acid residues markedly suppressed the EGF treatment-induced nuclear export of CIC-S (Supplementary Figure S3C), suggesting that seven S/T residues (C1–C5) within the deleted region may be critical for the EGF treatment-induced cytoplasmic translocation of CIC-S. Alanine substitution for the seven S/T residues (FLAG-CIC-SC1∼5A) markedly inhibited the cytoplasmic translocation of FLAG-CIC-S upon EGF treatment (Figure 2B). We also determined the role of the S/T residues near the HMG box (H1–H5) in the cytoplasmic translocation of CIC-S. Alanine substitution for T303, T305, and S431 residues (FLAG-CIC-SH345A) did not significantly inhibit the cytoplasmic translocation of FLAG-CIC-S upon EGF treatment (Supplementary Figure S3A). However, combined alanine substitution for the five S/T residues near the HMG box (FLAG-CIC-SH1∼5A) strongly inhibited the EGF treatment-induced cytoplasmic translocation of FLAG-CIC-S to a greater extent than that mediated by substitution for S173 and S301 (Figure 2B; Supplementary Figure S3A). Finally, we simultaneously substituted the seven and five S/T residues near the C1 domain and HMG-box, respectively, with alanine residues (FLAG-CIC-SCH1∼5A). This mutation most dramatically blocked the cytoplasmic translocation of FLAG-CIC-S upon EGF treatment (Figure 2B). Immunofluorescence staining verified that cytoplasmic translocation of FLAG-CIC-SCH1∼5A was not induced by EGF treatment (Figures 2C, D).
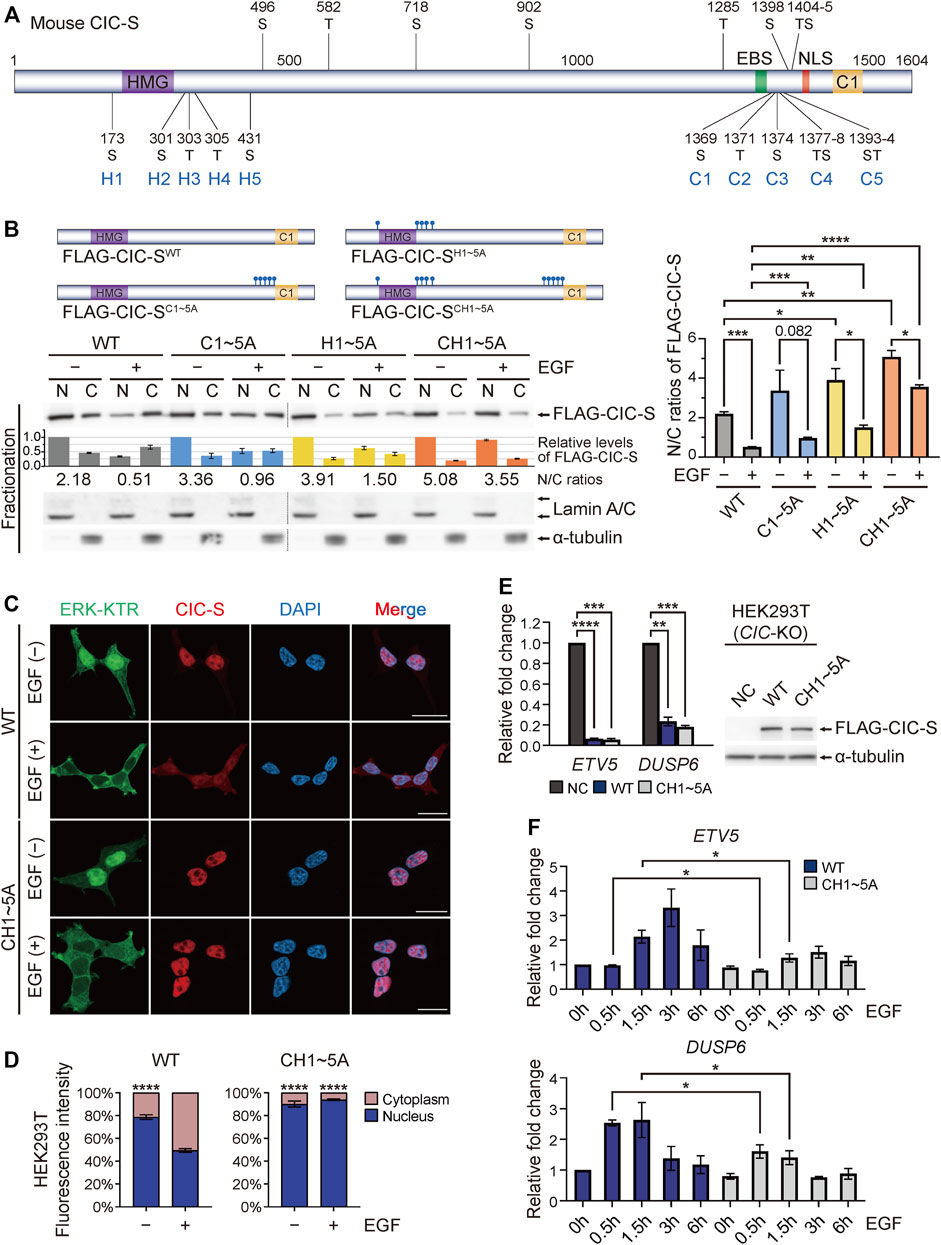
FIGURE 2. Identification of serine and threonine residues in CIC contributing to EGF treatment-induced cytoplasmic translocation of CIC-S. (A) Schematic of domains and potential EGF treatment-induced phosphorylation sites in mouse CIC-S. Serine (S) and threonine (T) residues substituted with alanine are denoted by C1 to C5 and H1 to H5. EBS: ERK-binding site. NLS: nuclear localization signal. (B) Western blotting was performed to examine changes in the subcellular distribution of FLAG-CIC-SWT, FLAG-CIC-SC1∼5A, FLAG-CIC-SH1∼5A, and FLAG-CIC-SCH1∼5A in HEK293T cells upon EGF treatment for 30 min. The upper panel shows the schematics of FLAG-CIC-SWT, FLAG-CIC-SC1∼5A, FLAG-CIC-SH1∼5A, and FLAG-CIC-SCH1∼5A. Combination of separate blot images is indicated by dotted lines. The bar graph below the FLAG-CIC-S blot image shows the relative levels of FLAG-CIC-S that were not statistically analyzed. The numbers below the bar graph indicate the N/C ratios of FLAG-CIC-S. The right panel is a bar graph of the N/C ratios of FLAG-CIC-S with statistical analysis. Three independent experiments were performed. Error bars indicate SEM. *p < 0.05, **p < 0.01, ***p < 0.001, and ****p < 0.0001. N: nuclear fraction and C: cytoplasmic fraction. N/C: nuclear-to-cytoplasmic ratio. (C) Immunofluorescence staining of FLAG-CIC-SWT and FLAG-CIC-SCH1∼5A in HEK293T cells stably expressing ERK-kinase translocation reporter (ERK-KTR). Cells were treated with EGF for 30 min. Green fluorescence indicates that ERK-KTR migrates to the cytoplasm when ERK is activated. All scale bars are 20 μm. (D) Quantitative analysis of the percentage of FLAG-CIC-S fluorescence intensity in the nucleus and cytoplasm of individual HEK293T cells with and without EGF treatment. More than 4 cells per group were analyzed. Error bars indicate SEM. ****p < 0.0001. (E) qRT-PCR analysis for the expression levels of ETV5 and DUSP6 in CIC-KO HEK293T cells stably expressing either FLAG-CIC-SWT or FLAG-CIC-SCH1∼5A. Western blot images show the levels of FLAG-CIC-SWT and FLAG-CIC-SCH1∼5A in the corresponding stable cell lines. Three independent experiments were performed. The bar graph presents data as the mean ± SEM values. **p < 0.01, ***p < 0.001, and ****p < 0.0001. (F) qRT-PCR analysis for time-dependent changes in the expression levels of ETV5 and DUSP6 in CIC-KO HEK293T cells stably expressing either FLAG-CIC-SWT or FLAG-CIC-SCH1∼5A after treatment with EGF. Three independent experiments were performed. The bar graph presents data as mean ± SEM values. *p < 0.05.
Since FLAG-CIC-SCH1∼5A contained point mutations at 12 amino acid residues, we examined whether FLAG-CIC-SCH1∼5A still retained its transcriptional repressor activity. To precisely monitor the transcriptional repressor activity of FLAG-CIC-S in cells, we generated CIC-knockout (KO) HEK293T cells using the clustered regularly interspaced short palindromic repeats (CRISPR)-Cas9 system (Supplementary Figure S4). Overexpression of FLAG-CIC-SWT and FLAG-CIC-SCH1∼5A dramatically suppressed the expression of CIC target genes, including ETV5 and dual specificity phosphatase 6 (DUSP6), in CIC-KO HEK293T cells with similar efficiency (Figure 2E). We also analyzed the time-dependent changes in ETV5 and DUSP6 expression levels after EGF treatment. After 30–90 min, the expression of ETV5 and DUSP6 was derepressed in FLAG-CIC-SWT-expressing CIC-KO HEK293T cells, whereas the suppression of ETV5 and DUSP6 expression was maintained in FLAG-CIC-SCH1∼5A-expressing CIC-KO HEK293T cells (Figure 2F). ETV5 and DUSP6 were downregulated again in FLAG-CIC-SWT-expressing CIC-KO HEK293T cells 6 h after EGF treatment (Figure 2F), which was consistent with the results of recovery of nuclear CIC-S levels 4–5 h after EGF treatment (Supplementary Figure S1B). Collectively, these data indicated that EGFR activation induces phosphorylation at S/T residues near the C1 domain and HMG box of CIC-S, leading to cytoplasmic translocation of CIC-S followed by derepression of CIC target gene expression.
EGF treatment disrupted the interaction between the N-terminal and C-terminal regions of CIC-S and promoted their cytoplasmic translocation
CIC can recognize specific octameric DNA sequences via intramolecular interactions between the HMG box and the C1 domain (Fores et al., 2017) (Figure 3A). CIC target genes are derepressed by RTK-ERK activation even before nuclear export of CIC in Drosophila (Lim et al., 2013; Keenan et al., 2020). Based on this knowledge, we hypothesized that EGF treatment will interfere with the intramolecular interaction of CIC, thus promoting dissociation from DNA and cytoplasmic translocation of CIC-S (Figure 3A). To test our hypothesis, we first examined whether EGF treatment decreases DNA binding affinity of CIC-S in vitro. HEK293T cells were transfected with plasmids expressing FLAG-CIC-SWT and treated with either PBS or EGF. Cell extract was incubated with dsDNA oligo composed of six CIC binding motifs, followed by immunoprecipitation of FLAG-CIC-SWT using FLAG antibody-conjugated beads. DNA bound to FLAG-CIC-SWT was analyzed by qPCR. The amount of DNA bound to FLAG-CIC-SWT was significantly reduced upon EGF treatment (Figure 3B), indicating that EGF treatment indeed decreased DNA binding activity of CIC-S.
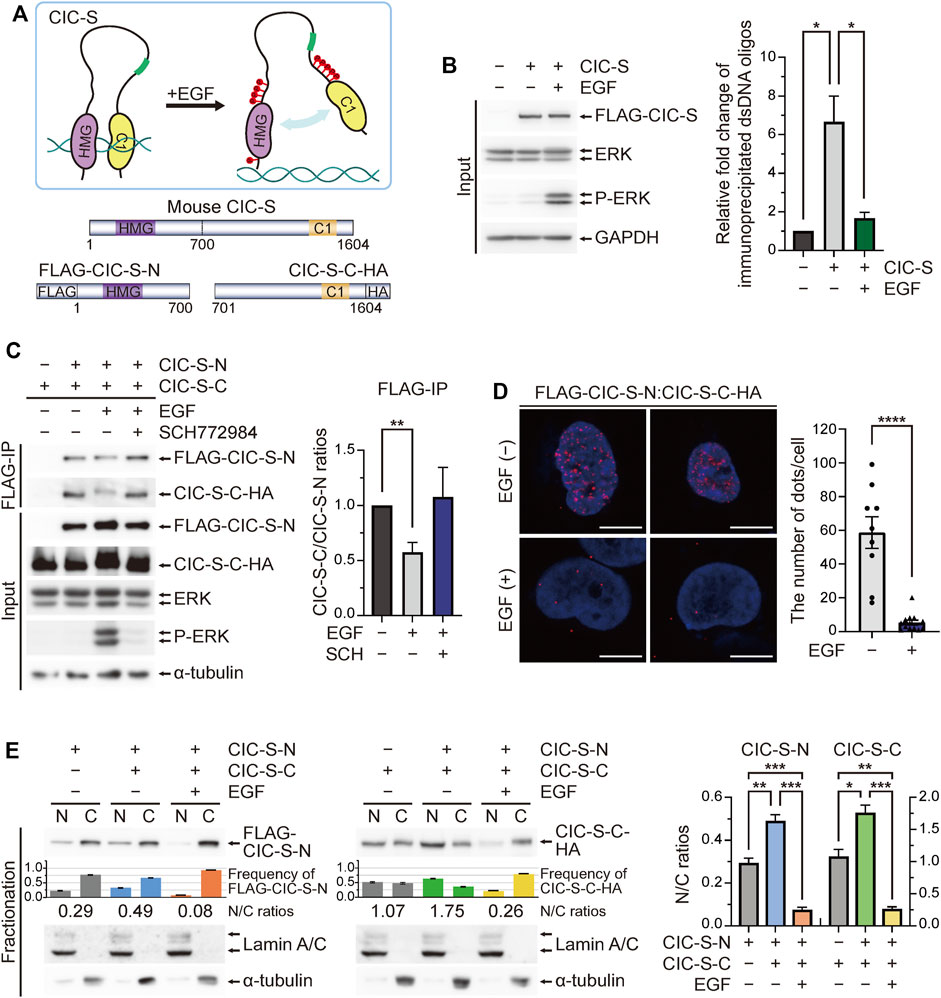
FIGURE 3. Interaction between the N-terminal and C-terminal regions of CIC for nuclear localization. (A) The upper panel shows a schematic model for the disruption of intramolecular interaction between the N-terminal and C-terminal regions of CIC upon phosphorylation. The lower panel shows schematics of FLAG-CIC-S-N and CIC-S-C-HA. (B) In vitro DNA binding assay. HEK293T cells transfected with control or FLAG-CIC-SWT-expressing plasmids were treated with either PBS or EGF for 5 min. Cell extract was incubated with double stranded DNA (dsDNA) oligo composed of six CIC binding motifs for 1 h, followed by immunoprecipitation of FLAG-CIC-SWT using FLAG antibody-conjugated beads. The amount of dsDNA bound to FLAG-CIC-SWT was analyzed by qPCR. The bar graph shows the relative levels of immunoprecipitated dsDNA oligos in each group. Three independent experiments were performed. Error bars indicate SEM. Western blot images for the levels of FLAG-CIC-SWT in HEK293T cells treated with either PBS or EGF are presented in the left panel. *p < 0.05. (C) Co-immunoprecipitation of FLAG-CIC-S-N and CIC-S-C-HA. HEK293T cells co-transfected with plasmids expressing FLAG-CIC-S-N and CIC-S-C-HA were treated with EGF and ERK inhibitor (SCH772984), followed by paraformaldehyde fixation and immunoprecipitation using an anti-FLAG antibody. The bar graph shows the ratio of immunoprecipitated CIC-S-C-HA/FLAG-CIC-S-N. Three independent experiments were performed. Error bars indicate SEM. **p < 0.01. (D) Proximity ligation assay for the interaction between FLAG-CIC-S-N and CIC-S-C-HA. HEK293T cells co-transfected with plasmids expressing FLAG-CIC-S-N and CIC-S-C-HA were treated with phosphate-buffered saline (PBS) or EGF for 5 min. The bar graph shows the average number of dots representing the interaction between FLAG-CIC-S-N and CIC-S-C-HA in each cell. More than nine cells per group were analyzed. All scale bars are 10 μm. Error bars indicate SEM. ****p < 0.0001. (E) Western blotting was performed to analyze the subcellular distribution of FLAG-CIC-S-N and CIC-S-C-HA in HEK293T cells when they were expressed simultaneously or separately. The co-transfected HEK293T cells were treated with PBS or EGF for 5 min. The bar graphs below the blot images show the frequency of FLAG-CIC-S-N and CIC-S-C-HA in the nucleus and cytoplasm. The numbers below the bar graph indicate the N/C ratios of FLAG-CIC-S-N and CIC-S-C-HA. The bar graphs of the N/C ratios of FLAG-CIC-S-N and CIC-S-C-HA with statistical analysis are presented in the right panel. Three independent experiments were performed. Error bars indicate SEM. *p < 0.05, **p < 0.01, and ***p < 0.001. N: nuclear fraction and C: cytoplasmic fraction. N/C: nuclear-to-cytoplasmic ratio.
Next, we constructed plasmids expressing either the N-terminal region (FLAG-CIC-S-N) or the carboxyl (C)-terminal region (CIC-S-C-HA) of CIC-S (Figure 3A) and co-transfected HEK293T cells with the plasmids followed by either cross-linking and immunoprecipitation assays using an anti-FLAG antibody or proximity ligation assays using anti-FLAG and anti-HA antibodies. FLAG-CIC-S-N and CIC-S-C-HA interacted with each other (Figures 3C, D). The interaction between FLAG-CIC-S-N and CIC-S-C-HA was predominantly found in the nucleus (Figure 3D). EGF treatment decreased the interaction between FLAG-CIC-S-N and CIC-S-C-HA (Figures 3C, D), supporting our hypothesis. Moreover, ERK inhibition restored the interaction between FLAG-CIC-S-N and CIC-S-C-HA in the presence of EGF (Figure 3C), demonstrating that EGF treatment-induced ERK activation disrupts the intramolecular interaction of CIC-S.
Finally, we analyzed the subcellular localization of FLAG-CIC-S-N and CIC-S-C-HA. When FLAG-CIC-S-N and CIC-S-C-HA were expressed simultaneously, the N/C ratio of FLAG-CIC-S-N and CIC-S-C-HA was higher than when they were expressed separately (Figure 3E), indicating the interaction between the N-terminal and C-terminal regions of CIC-S for facilitating nuclear localization. However, EGF treatment induced the cytoplasmic translocation of FLAG-CIC-S-N and CIC-S-C-HA even when they were co-expressed (Figure 3E). Collectively, our findings suggest that ERK activation disrupts the intramolecular interaction between the N-terminal and C-terminal regions of CIC-S, leading to dissociation from DNA and cytoplasmic translocation of CIC-S.
Inhibition of cytoplasmic translocation of CIC-S suppressed tumor growth
CIC functions as a tumor suppressor in various cancers, including hepatocellular carcinoma (HCC) (Kim et al., 2018; Lee, 2020). Although many studies have determined the effect of regulating CIC expression on cancer progression, the effect of modulating cytoplasmic translocation of CIC on tumor growth has never been investigated. To examine the effect of blocking the cytoplasmic translocation of CIC-S on cancer cell growth, we generated MHCC-97H HCC cell lines stably overexpressing either FLAG-CIC-SWT or FLAG-CIC-SCH1∼5A (Figure 4A). The overexpression of FLAG-CIC-SCH1∼5A strongly suppressed the expression of ETV4 and ETV5 proteins, which are direct CIC targets and well-known oncogenic transcription factors (Oh et al., 2012), to a greater extent than that mediated by FLAG-CIC-SWT in MHCC-97H cells (Figure 4A). Consistent with this result, cell proliferation was dramatically decreased by the overexpression of FLAG-CIC-SCH1∼5A to a greater extent than that observed upon FLAG-CIC-SWT overexpression in MHCC-97H cells (Figure 4B). We verified these results in vivo using xenograft mouse models. Normal and FLAG-CIC-SWT- or FLAG-CIC-SCH1∼5A-overexpressing MHCC-97H cells were subcutaneously injected into either posterior flank of the same nude mice, respectively, and the tumor volume was measured every 3 days. FLAG-CIC-SCH1∼5A-overexpressing MHCC-97H cells showed slower growth and formed a smaller tumor mass than those of FLAG-CIC-SWT-overexpressing MHCC-97H cells in vivo (Figures 4C, D). ETV4 expression was dramatically suppressed in tumors derived from FLAG-CIC-SCH1∼5A-overexpressing MHCC-97H cells to a greater extent than in those derived from FLAG-CIC-SWT-overexpressing MHCC-97H cells when compared to that in normal MHCC-97H-derived tumors (Supplementary Figure S5). These results indicate that nuclear retention of CIC inhibits tumor growth via suppression of CIC target genes involved in promoting cancer progression.
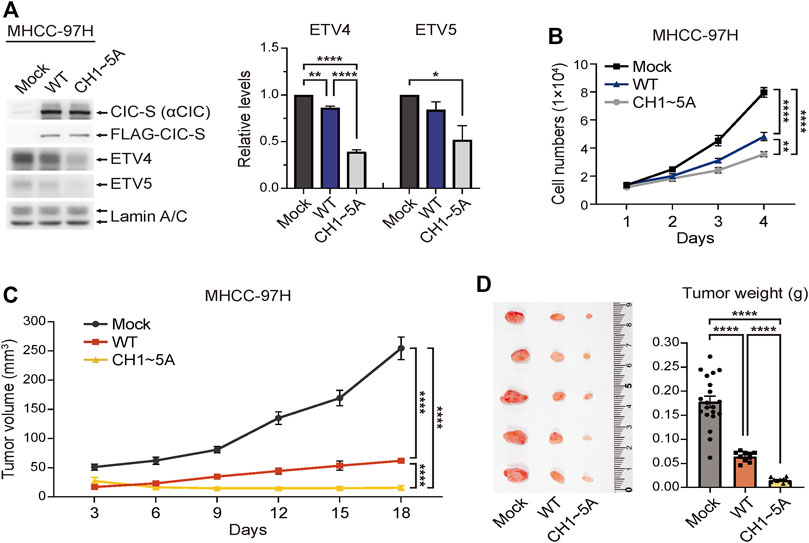
FIGURE 4. Enhanced tumor suppressor activity of FLAG-CIC-SCH1∼5A. (A) Western blotting was performed to determine the expression levels of FLAG-CIC-S, ETV4, and ETV5 in MHCC-97H cells stably expressing FLAG-CIC-SWT or FLAG-CIC-SCH1∼5A. The right panel is a bar graph for the relative level of ETV4 and ETV5. Three independent experiments were performed. Error bars indicate SEM. *p < 0.05, **p < 0.01, and ****p < 0.0001. (B) In vitro cell growth assay for mock, FLAG-CIC-SWT-, and FLAG-CIC-SCH1∼5A-expressing MHCC-97H cell lines. Cells were counted using a hemacytometer every 24 h for 4 days. Error bars represent SEM. n = 8 per group. **p < 0.01 and ****p < 0.0001. (C,D) In vivo tumor growth assay using xenograft mouse models. Tumor (C) growth curves and (D) weights of nude mice inoculated with mock, FLAG-CIC-SWT-, and FLAG-CIC-SCH1∼5A-expressing MHCC-97H cells. Tumor volumes were measured every 3 days for 18 days. On day 18, tumors were collected, photographed, and weighed. Error bars represent SEM. The bar graph presents data as mean ± SEM values. ****p < 0.0001.
Discussion
In this study, we showed that nuclear ERK plays a key role in the cytoplasmic translocation of CIC-S in mammals. It is believed that ERK-activated p90RSK phosphorylates CIC-S at the S173 and S301 residues to induce the 14-3-3-mediated inhibition of DNA binding and/or nuclear export of CIC-S (Dissanayake et al., 2011; Ren et al., 2020). Our study confirmed the importance of the S173 and S301 residues in the cytoplasmic translocation of CIC-S and further identified additional S/T residues near the C1 domain and HMG box of CIC-S that contribute to this process when phosphorylated by ERK activation. C1–C4 S/T residues near the C1 domain follow the ERK phosphorylation motif, which is S or T residue followed by a proline residue ((pS/T)P motif), whereas C5 and H5 S residues fit the p90RSK phosphorylation motif (RXXpS). The mutagenesis experiment clearly revealed that accumulation of alanine substitution of the S/T residues progressively inhibited the cytoplasmic translocation of CIC-S upon EGF treatment (Figure 2B; Supplementary Figure S3A). Moreover, EGF treatment disrupted the interaction between the N-terminal and C-terminal regions of CIC-S and promoted cytoplasmic translocation of CIC-S. These data suggest that phosphorylation of the S173 and S301 residues along with other S/T residues near the C1 domain and HMG box of CIC-S results in a conformational change in CIC-S, and consequently dissociates CIC from DNA and recruits protein factors required for nuclear export of CIC-S including 14-3-3 (Figure 5). Future studies should perform structural analysis of CIC-S according to phosphorylation status and identify the exportins and importins involved in nucleocytoplasmic transport of CIC-S to elucidate the regulation of CIC activity in mammals.
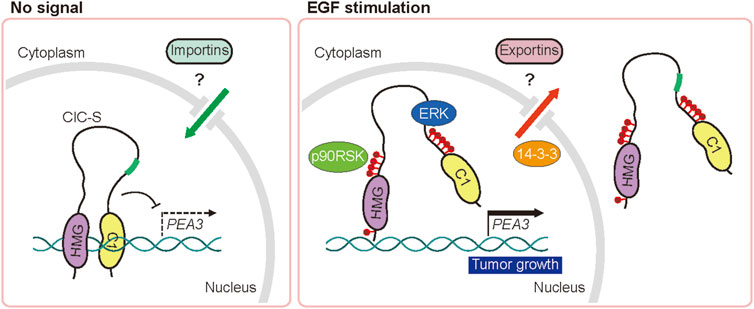
FIGURE 5. Schematic model of the regulation of nucleocytoplasmic transport of CIC by the EGFR signaling pathway. EGFR stimulation-activated ERK and p90RSK disrupt the intramolecular interaction of CIC via phosphorylation of serine and threonine residues (red circles), leading to dissociation from DNA and cytoplasmic translocation of CIC-S.
The present study could not verify the previous finding that c-SRC mediates the EGF treatment-induced cytoplasmic translocation of CIC-S via phosphorylation of Y1455 residue in human CIC-S (Bunda et al., 2020). c-SRC inhibitor treatment did not suppress the cytoplasmic translocation of CIC-S in HEK293T cells upon EGF treatment (Figures 1A,B). Moreover, EGF treatment still induced the cytoplasmic translocation of FLAG-CIC-S containing a phenylalanine substitution at Y1451 residue (FLAG-CIC-SY1451F), corresponding to Y1455 of human CIC-S, in our experimental setting (Supplementary Figure S6). However, in the absence of EGF, the N/C ratio of FLAG-CIC-SY1451F was slightly higher than that of FLAG-CIC-SWT (Supplementary Figure S6), and c-SRC overexpression decreased the N/C ratio of FLAG-CIC-SWT (Figure 1D), although those were not statistically significant. Therefore, c-SRC phosphorylation of the Y1451 residue may contribute to the cytoplasmic translocation of CIC-S independent of the EGFR signaling pathway.
Enhancing the activity of tumor suppressors can inhibit cancer progression (Xue et al., 2007). CIC activity can be regulated via proteasomal degradation and/or cytoplasmic translocation (Astigarraga et al., 2007; Ajuria et al., 2011; Okimoto et al., 2017; Lee, 2020). Our study demonstrated that blocking the cytoplasmic translocation of CIC-S potently suppressed tumor growth (Figures 4C, D). Notably, the expression level of FLAG-CIC-SCH1∼5A was higher than that of FLAG-CIC-SWT in MHCC-97H-derived tumors (Supplementary Figure S5), while their expression levels were similar between each MHCC-97H cell line used in the xenograft experiments (Figure 4A). These results suggest that inhibition of cytoplasmic translocation may increase the stability and transcriptional repressor activity of CIC-S during tumor formation. Since CIC functions as a tumor suppressor in various cancers, elucidating the regulatory mechanisms of nucleocytoplasmic transport of CIC will help develop therapeutic strategies applicable to various cancers.
Data availability statement
The original contributions presented in the study are included in the article/Supplementary Material, further inquiries can be directed to the corresponding author.
Ethics statement
The animal study was reviewed and approved by the Institutional Animal Care and Use Committee of POSTECH (POSTECH-2021-0094).
Author contributions
Conceptualization, JP, G-YP, and YL; methodology, JP, EK, S-YP, JY, and YL; formal analysis, JP; investigation, JP, G-YP, JL, and JP.; resources, SK; writing–original draft, JP and YL.; writing–review and editing, S-YP, JY, and YL; supervision, YL.; funding acquisition, YL.
Funding
This work was supported by the National Research Foundation (NRF) of Korea (NRF-2022M3E5F2018020, NRF-2021R1A2C3004006, NRF-2021R1A6A1A10042944, and NRF-2017R1A5A1015366), and Korea Basic Science Institute (National Research Facilities and Equipment Center) grant funded by the Ministry of Education (2021R1A6C101A390). JP was supported by the BK21 Program. JL was supported by Global PhD Fellowship (NRF-2018H1A2A1059794).
Acknowledgments
We thank the Lee lab members for helpful discussion and comments on this study.
Conflict of interest
The authors declare that the research was conducted in the absence of any commercial or financial relationships that could be construed as a potential conflict of interest.
Publisher’s note
All claims expressed in this article are solely those of the authors and do not necessarily represent those of their affiliated organizations, or those of the publisher, the editors and the reviewers. Any product that may be evaluated in this article, or claim that may be made by its manufacturer, is not guaranteed or endorsed by the publisher.
Supplementary material
The Supplementary Material for this article can be found online at: https://www.frontiersin.org/articles/10.3389/fmolb.2022.1030725/full#supplementary-material
References
Ahmad, S. T., Rogers, A. D., Chen, M. J., Dixit, R., Adnani, L., Frankiw, L. S., et al. (2019). Capicua regulates neural stem cell proliferation and lineage specification through control of Ets factors. Nat. Commun. 10, 2000. doi:10.1038/s41467-019-09949-6
Ajuria, L., Nieva, C., Winkler, C., Kuo, D., Samper, N., Andreu, M. J., et al. (2011). Capicua DNA-binding sites are general response elements for RTK signaling in Drosophila. Development 138, 915–924. doi:10.1242/dev.057729
Astigarraga, S., Grossman, R., Diaz-Delfin, J., Caelles, C., Paroush, Z., and Jimenez, G. (2007). A MAPK docking site is critical for downregulation of Capicua by Torso and EGFR RTK signaling. EMBO J. 26, 668–677. doi:10.1038/sj.emboj.7601532
Bunda, S., Heir, P., Li, A. S. C., Mamatjan, Y., Zadeh, G., and Aldape, K. (2020). c-Src phosphorylates and inhibits the function of the CIC tumor suppressor protein. Mol. Cancer Res. 18, 774–786. doi:10.1158/1541-7786.MCR-18-1370
Bunda, S., Heir, P., Metcalf, J., Li, A. S. C., Agnihotri, S., Pusch, S., et al. (2019). CIC protein instability contributes to tumorigenesis in glioblastoma. Nat. Commun. 10, 661. doi:10.1038/s41467-018-08087-9
Casar, B., Pinto, A., and Crespo, P. (2008). Essential role of ERK dimers in the activation of cytoplasmic but not nuclear substrates by ERK-scaffold complexes. Mol. Cell 31, 708–721. doi:10.1016/j.molcel.2008.07.024
Chittaranjan, S., Chan, S., Yang, C., Yang, K. C., Chen, V., Moradian, A., et al. (2014). Mutations in CIC and IDH1 cooperatively regulate 2-hydroxyglutarate levels and cell clonogenicity. Oncotarget 5, 7960–7979. doi:10.18632/oncotarget.2401
Choi, N., Park, J., Lee, J. S., Yoe, J., Park, G. Y., Kim, E., et al. (2015). miR-93/miR-106b/miR-375-CIC-CRABP1: a novel regulatory axis in prostate cancer progression. Oncotarget 6, 23533–23547. doi:10.18632/oncotarget.4372
Dissanayake, K., Toth, R., Blakey, J., Olsson, O., Campbell, D. G., Prescott, A. R., et al. (2011). ERK/p90(RSK)/14-3-3 signalling has an impact on expression of PEA3 Ets transcription factors via the transcriptional repressor capicua. Biochem. J. 433, 515–525. doi:10.1042/BJ20101562
Fores, M., Simon-Carrasco, L., Ajuria, L., Samper, N., Gonzalez-Crespo, S., Drosten, M., et al. (2017). A new mode of DNA binding distinguishes Capicua from other HMG-box factors and explains its mutation patterns in cancer. PLoS Genet. 13, e1006622. doi:10.1371/journal.pgen.1006622
Fryer, J. D., Yu, P., Kang, H., Mandel-Brehm, C., Carter, A. N., Crespo-Barreto, J., et al. (2011). Exercise and genetic rescue of SCA1 via the transcriptional repressor Capicua. Science 334, 690–693. doi:10.1126/science.1212673
Futran, A. S., Kyin, S., Shvartsman, S. Y., and Link, A. J. (2015). Mapping the binding interface of ERK and transcriptional repressor Capicua using photocrosslinking. Proc. Natl. Acad. Sci. U. S. A. 112, 8590–8595. doi:10.1073/pnas.1501373112
Han, J., Lee, Y., Yeom, K. H., Kim, Y. K., Jin, H., and Kim, V. N. (2004). The Drosha-DGCR8 complex in primary microRNA processing. Genes Dev. 18, 3016–3027. doi:10.1101/gad.1262504
Herrero, A., Pinto, A., Colon-Bolea, P., Casar, B., Jones, M., Agudo-Ibanez, L., et al. (2015). Small molecule inhibition of ERK dimerization prevents tumorigenesis by RAS-ERK pathway oncogenes. Cancer Cell 28, 170–182. doi:10.1016/j.ccell.2015.07.001
Hong, H., Lee, J., Park, G. Y., Kim, S., Park, J., Park, J. S., et al. (2022). Postnatal regulation of B-1a cell development and survival by the CIC-PER2-BHLHE41 axis. Cell Rep. 38, 110386. doi:10.1016/j.celrep.2022.110386
Jimenez, G., Guichet, A., Ephrussi, A., and Casanova, J. (2000). Relief of gene repression by torso RTK signaling: Role of capicua in Drosophila terminal and dorsoventral patterning. Genes Dev. 14, 224–231. doi:10.1101/gad.14.2.224
Jimenez, G., Shvartsman, S. Y., and Paroush, Z. (2012). The Capicua repressor-a general sensor of RTK signaling in development and disease. J. Cell Sci. 125, 1383–1391. doi:10.1242/jcs.092965
Kawamura-Saito, M., Yamazaki, Y., Kaneko, K., Kawaguchi, N., Kanda, H., Mukai, H., et al. (2006). Fusion between CIC and DUX4 up-regulates PEA3 family genes in Ewing-like sarcomas with t(4;19)(q35;q13) translocation. Hum. Mol. Genet. 15, 2125–2137. doi:10.1093/hmg/ddl136
Keenan, S. E., Blythe, S. A., Marmion, R. A., Djabrayan, N. J., Wieschaus, E. F., and Shvartsman, S. Y. (2020). Rapid dynamics of signal-dependent transcriptional repression by capicua. Dev. Cell 52, 794–801. doi:10.1016/j.devcel.2020.02.004
Kim, E., Kim, D., Lee, J. S., Yoe, J., Park, J., Kim, C. J., et al. (2018). Capicua suppresses hepatocellular carcinoma progression by controlling the ETV4-MMP1 axis. Hepatology 67, 2287–2301. doi:10.1002/hep.29738
Kim, E., Park, S., Choi, N., Lee, J., Yoe, J., Kim, S., et al. (2015). Deficiency of Capicua disrupts bile acid homeostasis. Sci. Rep. 5, 8272. doi:10.1038/srep08272
Kim, S., Park, G. Y., Park, J. S., Park, J., Hong, H., and Lee, Y. (2021). Regulation of positive and negative selection and TCR signaling during thymic T cell development by capicua. Elife 10, e71769. doi:10.7554/eLife.71769
Koreckij, T., Nguyen, H., Brown, L. G., Yu, E. Y., Vessella, R. L., and Corey, E. (2009). Dasatinib inhibits the growth of prostate cancer in bone and provides additional protection from osteolysis. Br. J. Cancer 101, 263–268. doi:10.1038/sj.bjc.6605178
Lee, J. S., Kim, E., Lee, J., Kim, D., Kim, H., Kim, C. J., et al. (2020). Capicua suppresses colorectal cancer progression via repression of ETV4 expression. Cancer Cell Int. 20, 42. doi:10.1186/s12935-020-1111-8
Lee, Y., Fryer, J. D., Kang, H., Crespo-Barreto, J., Bowman, A. B., Gao, Y., et al. (2011). ATXN1 protein family and CIC regulate extracellular matrix remodeling and lung alveolarization. Dev. Cell 21, 746–757. doi:10.1016/j.devcel.2011.08.017
Lee, Y. (2020). Regulation and function of capicua in mammals. Exp. Mol. Med. 52, 531–537. doi:10.1038/s12276-020-0411-3
Lim, B., Samper, N., Lu, H., Rushlow, C., Jimenez, G., and Shvartsman, S. Y. (2013). Kinetics of gene derepression by ERK signaling. Proc. Natl. Acad. Sci. U. S. A. 110, 10330–10335. doi:10.1073/pnas.1303635110
Lu, H. C., Tan, Q., Rousseaux, M. W., Wang, W., Kim, J. Y., Richman, R., et al. (2017). Disruption of the ATXN1-CIC complex causes a spectrum of neurobehavioral phenotypes in mice and humans. Nat. Genet. 49, 527–536. doi:10.1038/ng.3808
Martinez, R., 3R. D., Huang, W., Samadani, R., Mackowiak, B., Centola, G., Chen, L., et al. (2021). Mechanistic analysis of an extracellular signal-regulated kinase 2-interacting compound that inhibits mutant BRAF-expressing melanoma cells by inducing oxidative stress. J. Pharmacol. Exp. Ther. 376, 84–97. doi:10.1124/jpet.120.000266
Oh, S., Shin, S., and Janknecht, R. (2012). ETV1, 4 and 5: An oncogenic subfamily of ETS transcription factors. Biochim. Biophys. Acta 1826, 1–12. doi:10.1016/j.bbcan.2012.02.002
Okimoto, R. A., Breitenbuecher, F., Olivas, V. R., Wu, W., Gini, B., Hofree, M., et al. (2017). Inactivation of Capicua drives cancer metastasis. Nat. Genet. 49, 87–96. doi:10.1038/ng.3728
Park, G. Y., Lee, G. W., Kim, S., Hong, H., Park, J. S., Cho, J. H., et al. (2020). Deletion timing of cic alleles during hematopoiesis determines the degree of peripheral CD4(+) T cell activation and proliferation. Immune Netw. 20, e43. doi:10.4110/in.2020.20.e43
Park, S., Lee, S., Lee, C. G., Park, G. Y., Hong, H., Lee, J. S., et al. (2017). Capicua deficiency induces autoimmunity and promotes follicular helper T cell differentiation via derepression of ETV5. Nat. Commun. 8, 16037. doi:10.1038/ncomms16037
Park, S., Park, J., Kim, E., and Lee, Y. (2019). The capicua/ETS translocation variant 5 Axis regulates liver-resident memory CD8(+) T-cell development and the pathogenesis of liver injury. Hepatology 70, 358–371. doi:10.1002/hep.30594
Ran, F. A., Hsu, P. D., Wright, J., Agarwala, V., Scott, D. A., and Zhang, F. (2013). Genome engineering using the CRISPR-Cas9 system. Nat. Protoc. 8, 2281–2308. doi:10.1038/nprot.2013.143
Ren, Y., Ouyang, Z., Hou, Z., Yan, Y., Zhi, Z., Shi, M., et al. (2020). CIC is a mediator of the ERK1/2-DUSP6 negative feedback loop. iScience 23, 101635. doi:10.1016/j.isci.2020.101635
Robinson, M. J., Stippec, S. A., Goldsmith, E., White, M. A., and Cobb, M. H. (1998). A constitutively active and nuclear form of the MAP kinase ERK2 is sufficient for neurite outgrowth and cell transformation. Curr. Biol. 8, 1141–1150. doi:10.1016/s0960-9822(07)00485-x
Shin, D. H., and Hong, J. W. (2014). Capicua is involved in Dorsal-mediated repression of zerknullt expression in Drosophila embryo. BMB Rep. 47, 518–523. doi:10.5483/bmbrep.2014.47.9.122
Simon-Carrasco, L., Grana, O., Salmon, M., Jacob, H. K. C., Gutierrez, A., Jimenez, G., et al. (2017). Inactivation of Capicua in adult mice causes T-cell lymphoblastic lymphoma. Genes Dev. 31, 1456–1468. doi:10.1101/gad.300244.117
Tan, Q., Brunetti, L., Rousseaux, M. W. C., Lu, H. C., Wan, Y. W., Revelli, J. P., et al. (2018). Loss of Capicua alters early T cell development and predisposes mice to T cell lymphoblastic leukemia/lymphoma. Proc. Natl. Acad. Sci. U. S. A. 115, E1511–E1519. doi:10.1073/pnas.1716452115
Wang, B., Krall, E. B., Aguirre, A. J., Kim, M., Widlund, H. R., Doshi, M. B., et al. (2017). ATXN1L, CIC, and ETS transcription factors modulate sensitivity to MAPK pathway inhibition. Cell Rep. 18, 1543–1557. doi:10.1016/j.celrep.2017.01.031
Weissmann, S., Cloos, P. A., Sidoli, S., Jensen, O. N., Pollard, S., and Helin, K. (2018). The tumor suppressor CIC directly regulates MAPK pathway genes via histone deacetylation. Cancer Res. 78, 4114–4125. doi:10.1158/0008-5472.CAN-18-0342
Wong, D., Sogerer, L., Lee, S. S., Wong, V., Lum, A., Levine, A. B., et al. (2020). TRIM25 promotes Capicua degradation independently of ERK in the absence of ATXN1L. BMC Biol. 18, 154. doi:10.1186/s12915-020-00895-0
Keywords: CIC, ERK, receptor tyrosine kinase, cytoplasmic translocation, tumor suppressor
Citation: Park J, Park G-Y, Lee J, Park J, Kim S, Kim E, Park S-Y, Yoon JH and Lee Y (2022) ERK phosphorylation disrupts the intramolecular interaction of capicua to promote cytoplasmic translocation of capicua and tumor growth. Front. Mol. Biosci. 9:1030725. doi: 10.3389/fmolb.2022.1030725
Received: 29 August 2022; Accepted: 09 December 2022;
Published: 22 December 2022.
Edited by:
Maria Ruzzene, University of Padua, ItalyReviewed by:
Chao Zhang, University of Southern California, United StatesTing Lan, Xuzhou Medical University, China
Copyright © 2022 Park, Park, Lee, Park, Kim, Kim, Park, Yoon and Lee. This is an open-access article distributed under the terms of the Creative Commons Attribution License (CC BY). The use, distribution or reproduction in other forums is permitted, provided the original author(s) and the copyright owner(s) are credited and that the original publication in this journal is cited, in accordance with accepted academic practice. No use, distribution or reproduction is permitted which does not comply with these terms.
*Correspondence: Yoontae Lee, yoontael@postech.ac.kr