Wound healing and regeneration in the reef building coral Acropora millepora
 Jane Xu1,2
  Oliver Mead1,2†
  Aurelie Moya3† Cüneyt Caglar1,2
  David J. Miller3,4 Marcin Adamski1*
  Maja Adamska1,2*
- 1Research School of Biology, Australian National University, Canberra, ACT, Australia
- 2ARC Centre of Excellence for Coral Reef Studies, Australian National University, Canberra, ACT, Australia
- 3ARC Centre of Excellence for Coral Reef Studies, James Cook University, Townsville, QLD, Australia
- 4Comparative Genomics Centre and Department of Molecular and Cell Biology, James Cook University, Townsville, QLD, Australia
Branching scleractinian corals are niche-constructing organisms, providing continuously-growing, structural foundation for spectacularly biodiverse coral reef ecosystems. A large part of their success lies in the ability to quickly regenerate following mechanical damage. Even now, when the corals undergo great decline due to anthropogenic weather and storm extremes, it is surprising how little is known about molecular mechanisms governing regeneration in these iconic organisms. In this study, we used RNA-seq to identify genes involved in the regeneration of Acropora millepora, starting with the initial wound closure up to complete rebuilding of lost structures. Many of the differentially expressed genes we found in the wound healing steps are homologues of genes known to be involved in wound healing and regeneration of bilaterian and other cnidarian species, prominently including multiple components of FGF and Wnt signalling pathways. Comparison between genes involved in wound healing and continuous growth of the colony demonstrates both similarity and distinctiveness of the genetic programmes controlling these processes. A striking example is specific expression of c-Fos, a transcription factor with conserved role in early injury response, during the earliest stages of wound healing of A. millepora. By comparing results obtained in diverse experimental conditions including a closed-loop, recirculating aquarium and a flow-through system of marine station, we have demonstrated feasibility of using zooxanthellate scleractinian corals as experimental models in fundamental biology research, including studies of regeneration.
Introduction
The scleractinian coral holobionts (tight unions of animal hosts, their associated zooxanthellae and diverse prokaryotes) have been hugely successful in shallow tropical marine environments, creating complex habitats for multitude of other organisms. However, this success is recently under threat due to anthropogenic climate change, resulting not only in increased water temperatures causing coral bleaching-related mortality, but also physical destruction of the reefs by increased intensity of storms in addition to direct damage by dredging and boating (e.g., Bak, 1978; Saphier and Hoffmann, 2005; Hughes et al., 2017). Maintenance and recovery of coral reefs greatly depends on the ability of individual corals to quickly heal the injuries, covering the exposed skeleton and then rebuilding lost structures. Indeed, zooxanthellate scleractinian corals have a high regenerative capacity, likely related to their continuous growth. For many branching corals, fragmentation is an important method of asexual reproduction, allowing significant dispersion and rapid recovery after physical disturbance (reviewed by Highsmith, 1982).
Ability to regenerate from fragments appears to also be an important recovery strategy after bleaching. For example, Diaz-Pulido et al. (2009) observed a bleached reef with coral cover reduced by 70–80% and the exposed coral skeletons overgrown by algae. Surprisingly, within 6 months of the event the reef had recovered to pre-bleaching coverage, likely as an effect of rapid growth from small fragments of coral tissue surviving at the bases of the colonies. Due to this ability, re-populating reefs with fragment-grown coral specimens is often considered as a strategy for reef restoration in face of the climate change (reviewed by Schmidt-Roach et al., 2020).
While several studies have addressed ecological aspects of coral regeneration (e.g., Sabine et al., 2015), the molecular mechanisms of regeneration in reef-building corals remain understudied. This is in contrast to extensive studies in many non-skeleton building cnidarians, which because of tremendous regeneration potential in this phylum and the ease of cultivation of several species have historically served as model systems for regenerative biology (Holstein et al., 2003). This is particularly true for the freshwater polyp Hydra, which even has the capacity to form new individuals from small clumps of cells (reviewed by Vogg et al., 2019). Regeneration ability is more limited – although still remarkable – in the starlet sea anemone Nematostella vectensis, which can re-grow complete polyp from a small, aboral section of body (Bossert and Thomsen, 2017). Intriguingly, cellular processes and genes involved in regeneration of these two model species vary to a large extent. Hydra regeneration appears to rely mainly on morphallactic processes (where new structures are formed by rearrangement of existing cells), while in Nematostella epimorphosis (where new structures are formed by cell proliferation) plays a larger role (Passamaneck and Martindale, 2012; DuBuc et al., 2014; Warner et al., 2018). As in many (if not all) animal regeneration processes, the Wnt pathway plays a major role in regeneration of both models; while the involvement of the TGF-beta pathway has been documented only in Hydra (e.g., Hobmayer et al., 2000; Reinhardt et al., 2004; Amiel et al., 2015; Petersen et al., 2015; Schaffer et al., 2016). A recent, candidate-gene driven study in Tubastraea coccinea demonstrated upregulation of several Wnt and FGF genes during regeneration of this azooxanthellate scleractinian (Luz et al., 2021).
Studies of molecular mechanisms of regeneration in the reef forming corals are an important endeavour from both fundamental biology and potential conservation perspectives, but are surprisingly limited, possibly due to practical and technical difficulties. In this study, we have sought to identify genes involved in regeneration of Acropora millepora using both laboratory and field systems. Our results reveal strong similarities between transcriptional signatures of the early wound healing phases and the leading edges of colonies spreading on the substrate, consistent with re-deployment of molecular machinery involved in normal growth of the colonies during regeneration. They also demonstrate involvement of the Wnt and FGF, but not TGF-beta pathways in coral regeneration, consistent with what was observed in previously studied anthozoans. Importantly, our results demonstrate feasibility of studying molecular and cellular aspects of reef building coral regeneration in inland laboratory conditions.
Materials and methods
Specimen collection, maintenance and wounding experiments
Inland laboratory experiments: Two colonies of Acropora millepora were obtained from Canberra Marine, collected by Cairns Marine (Cairns, Queensland) and placed in a closed-loop marine aquarium system in the Research School of Earth Sciences, Australian National University (ANU), Canberra. The main tank in the system measured 1.4 × 2.0 × 0.4 m, and was housing the corals, and a variety of cohabiting marine organisms associated with ‘live rock’ (natural aragonite framework serving as a habitat to a broad range or marine organisms in marine aquarium systems). The water movement was forced by circulation pumps (wave makers), and through a 1.2 × 0.6 × 0.6 m sump containing a protein skimmer, and physical and biological filters. Natural sea water in the tank was maintained at 27°C, 8.1–8.4 pH, ~35 mg/ml salinity, 440 mg/L calcium carbonate, 0.23–0.5 mg/L phosphate. The day/night cycling (12/12) used white and blue LED lights to illuminate the tank. The temperature fluctuated daily by approximately ±1°C (with day and night temperatures). Corals were fed 1/8th of a teaspoon of marine plankton (Reef Roids, PolypLab, United States) suspended in 50 ml of aquarium water twice a week. Approximately 2 ml suspension was target fed to each coral fragment with 20 ml plastic syringe (HSW Soft-Ject™, Germany) after wave makers were turned off. To obtain fragments for experiments, the two coral colonies were cut into fragments 4–8 cm in height, each containing two to three branches. They were cut using a diamond saw for the first colony and with a Dremel® 2001 with a 1–1/2″ EZ Lock Diamond Cut Wheel (Dremel®, Mexico) for the second colony. These were glued to plugs with Reef Glue™ (Seachem®, United States). Fragments were left to recover for a minimum of a week before starting experiments. To create a lesion, one polyp and corallite were cut out from each branch using carbon steel Surgical Scalpel Blade No.15A (Swann-Morton®, England).
Marine station experiments: In April 2019, colonies of Acropora millepora were collected from locations near Orpheus Island, Australia (GBRMPA permit G17/39991.1). These colonies were transferred to flow-through unfiltered seawater tanks with oxygen stones and left to recover for 2 weeks before experiments were carried out.
In contrast to experiments carried in Canberra, the Orpheus Island colonies were not fragmented. Instead, to create lesions, one polyp and corallite per branch were cut out using carbon steel Surgical Scalpel Blade No.15A (Swann-Morton®, England).
Sampling
Tissues removed during initial wounding manipulation were discarded. To collect samples for RNA-Seq analysis, the area around the lesion, healed coenosarc or regenerating polyps, as well as matching controls were cut out following the timeline established during pilot observations (see Figure 1 in the Results section). To obtain enough tissue for extraction, three samples of the same regeneration stage and the same colony were pooled in 2 ml microcentrifuge tubes containing two 3 mm tungsten carbide beads (to aid subsequent sample disruption, Qiagen cat#69997) and snap frozen in liquid nitrogen.
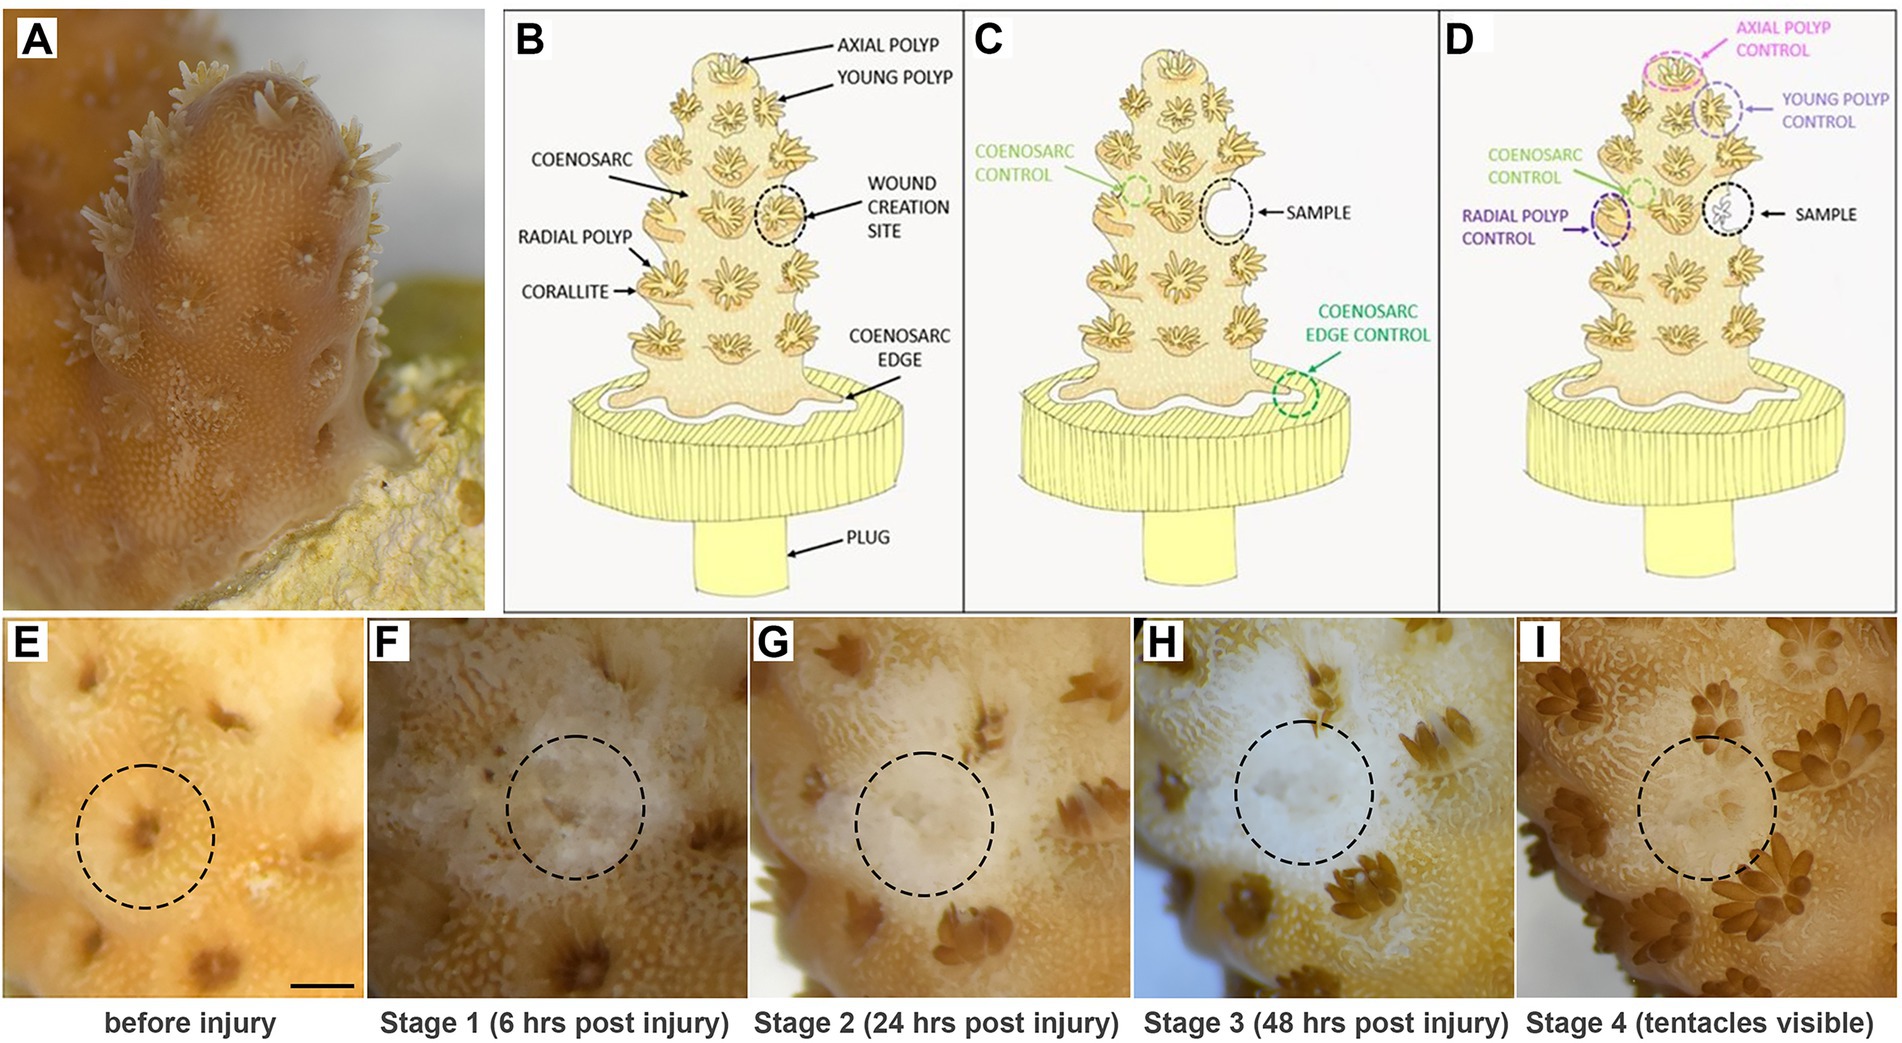
Figure 1. Experimental system. (A,B) Small branch of Acropora millepora glued to a plug, with features used for sampling indicated in the diagram. (C,D) Sampling strategy for regeneration stages before (C) and after (D) polyp formation. (E,F) Example images of a single polyp tracked before (E) and after (F) injury and until tentacles of the regenerated polyp became visible (G–I). Scale bar represents 1 mm.
RNA extraction and quality analysis
Samples were ground in the TissueLyser LT (Qiagen®, Netherlands) at 50 Hz with a TissueLyser adapter cooled to −20°C. The extraction was performed using TRIzol™ Reagent according to manufacturer’s manual with the following changes: Samples in TRIzol™ and chloroform were transferred to a new 1.5 ml microcentrifuge tube which contained 100 μl autoclaved vacuum grease (Dow Corning®, United States). The RNA Nano Chip on Agilent Bioanalyzer® 2100 was used for RNA quality and quantification analyses.
cDNA library preparation
cDNA libraries were prepared following the TruSeq RNA Library Kit v2 manual (Illumina). Approximately 76–266 ng of total RNA per sample was used to prepare libraries, with the lower bound of this range determined by the amount of RNA available after quality and quantification analyses were carried in the initial experiments (see Supplementary Table 1). After library preparation, a SPRIselect (Beckmann Coulter) size selection was done according to the user guide on Both Side Size Selection with a few changes: Agencourt AMPure XP Beads (Beckman Coulter) with ratios 0.5× and 1.2× were used. Libraries were analysed on Aglient 2100 Bioanalyzer and pooled to obtain equal molarity. Samples were then sent to the Biomolecular Resource Facility (ANU) for single end 75 bp sequencing on high output flowcells using the NextSeq500 Illumina platform. Raw Illumina RNA-Seq reads generated in this study have been deposited in ENA Short Read Archive under study PRJEB55598 (samples ERS12852684–ERS12852781, runs ERR10123024–ERR10123121).
Differential gene expression analysis
Read mapping
RSEM v1.3.3 (Li and Dewey, 2011) with the Bowtie 2 v2.5.0 short-read aligner (Langmead and Salzberg, 2012) were used to map the RNA-Seq reads to the A. millepora protein-coding gene models (Ying et al., 2019, see Supplementary material 1 for the sequences of gene models used in this manuscript). The ‘expected counts’ from RSEM were used to perform the detection and analysis of the differentially expressed genes, focusing on protein coding genes.
Identification and visualisation of differentially expressed genes
The analysis was performed in R v4.2.2 with the edgeR v3.40.0 (Chen et al., 2016), and the Limma v3.54.0 (Ritchie et al., 2015) packages following the protocol from Law et al. (2016). The experimental incomplete block design was implemented with the type of the sample (the stages 1, 2, 3, 4 and Coenosarc) set as fixed effect directly in the model matrix, and the blocking factor (combined the replica and the colony) set as pairing-block with the duplicateCorrelation() function in Limma. The significance level for the detection of differentially expressed genes was set at 0.05 (the BH adjusted p-value was used), and the minimum log2 fold change was 1/−1 (details in the R code provided in the supplementary file amil_dge.R).
Transcript annotation
Translated A. millepora gene models were annotated with the gene name of their top blast-p hit among previously functionally annotated A. digitifera gene models (Shinzato et al., 2011). To increase specificity of the FGF and Wnt ligands annotation, the A. millepora sequences annotated as such were used to recover further A. digitifera and N. vectensis proteins based on their sequence similarity (with blast-p). The H. sapiens Wnt or FGF ligands recovered from UniProt were then added to the cnidarian sequences, and two sets of multiple sequence alignments were created in ClustalX 2.1 (Larkin et al., 2007). The alignments were then manually edited to remove divergent segments. Maximum Likelihood phylogenetic trees were computed in RAxML 8.2.11 using the PROTGAMMAAUTO model (allowing RAxML to choose the best available model; the LG model was chosen for both Wnt and FGF ligand alignments), and fast bootstrap of 100. The consensus tree annotated with the bootstrap values was displayed in Mega7 (Kumar et al., 2016).
Gene ontology enrichment
GO terms were linked to the gene models with InterProScan (Quevillon et al., 2005), and the enrichment analysis was performed with TopGO v2.50.0 (Alexa et al., 2006) using the ‘weight01’ algorithm with the Fisher statistic and applying the 0.05 p-value significance cut off (details in the R code provided in the supplementary file amil_topgo.R).
Clustering of gene expression profiles
Gene expression profiles were clustered with Clust 1.18.0. Clust was run on generated with edgeR normalized log-cpm values using default arguments except the tightness parameter-t set to 0.5 and with automatic choice for the normalisation method (z-score quantile normalisation was chosen, code 101 4; Abu-Jamous and Kelly, 2018).
Results
Staging of wound healing and polyp regeneration
Intact, healthy Acropora millepora fragments have brown colouration (due to presence of zooxanthellae) and clearly identifiable polyps: one large and symmetrical axial polyp at the tip of each branch, a few small (recently developed) radial polyps near the tip, and fully developed radial polyps uniformly distributed along the branches (Figures 1A,B). Polyp tentacles can either be extended or retracted, depending on time of the day or recent disturbance (Figures 1A–E). In fragments experimentally attached to plugs, the coenosarc forms a ‘skirt’ at the attachment area; the coenosarc edge grows to spread on the plug surface (Figure 1A,B). In long-term culture, polyps can also form on the coenosarc covering the plug, but never directly on the edge (not shown).
To choose potentially informative time points and appropriate controls for gene expression analysis during regeneration, we initially carried out low-magnification microscopic observations of experimentally wounded fragments. One radial polyp and its corallite, sited approximately 3–5 polyps down from the tip of the branch, were removed using a scalpel blade to create the lesion (Figures 1A,B). Immediately after wounding, and without any apparent changes within the first hours, the exposed calcium carbonate skeleton was clearly visible at the wounding site (Figure 1F). We informally referred to this stage as ‘rough’ reflecting its appearance and refer to this stage as Stage 1 of regeneration. By 24 h post-injury, the wound surface appeared smooth, with coenosarc apparently healed over the debris (Figure 1G); we refer to this as Stage 2. At Stage 3 (48 h), there was no obvious morphological change from Stage 2, with translucent (zooxanthellae-poor) tissue covering the wound (Figure 1H). The first morphological change – formation of tentacles of the regenerating polyp – could be observed between 3 and 10 days post-wounding (Figure 1I).
It is important to note that the initial translucent nature of regenerating coral tissue was problematic when determining the presence of tentacles, so that tentacles could only be identified when zooxanthellae became abundant enough in the tentacles to make them clearly visible. Therefore, the actual tentacle formation may have occurred earlier than noticed in some samples. While the first three regeneration stages are defined by time (6, 24, 48 h respectively), we only used polyps with visible tentacles to represent Stage 4 in our analysis. In some analyses we have additionally separated Stage 4 samples into an earlier stage, with only tentacles visible (4a) and a later one with completely regenerated polyps (4b).
Given potentially different cell types (and/or proportions of the same cell types) constituting the polyps and coenosarc, as well as the expected differences in gene expression between actively growing and non-growing tissues, we have taken different types of control samples to identify genes specifically changing expression during regeneration (see Supplementary Table 1 for details of the samples used). Therefore, for stages 1–3 (before regenerating polyp became visible), coenosarc samples from the areas between polyps (we call these samples ‘coenosarc’ for simplicity throughout the manuscript) and the actively growing coenosarc from the edge of the fragment (‘coenosarc edge’) were taken as controls (Figure 1C). For stage 4 (when regenerating polyp’s tentacles were apparent) the following samples were taken as controls: an intact radial polyp from the same level as the regenerating polyp, a young polyp of similar size to the regenerating polyp, the axial polyp and coenosarc from between intact polyps (Figure 1D).
Gene expression changes during wound healing and polyp regeneration
We carried out wounding experiments on fragments derived from two colonies in a closed aquarium system in Canberra and two colonies in an open (flow-through) system on Orpheus Island (see section Material and Methods for detailed description of the two systems). Because of small sizes of the polyps and thus low tissue volumes surrounding the lesion, three tissue fragments from the same colony (and usually, the same branch) were pooled for each sample. Given that each of the colonies used was individually collected from the wild, we consider samples derived from different colonies to be biological replicates, in contrast to samples derived from different fragments of the same colony which we consider to be technical replicates. While we initially aimed to generate both technical and biological replicates for each regeneration stage and its matching controls, the need to pool samples resulted in a lower number of replicates. Overall, we generated at least two technical replicates for each sample type for colony one, and at least three biological replicates for each sample type (Supplementary Table 1 and Supplementary Figure 1).
As the first step to assess quality of the experiment we visualised the overall gene profiles as multi-dimensional scaling (MDS) plots. In the first and second dimension the samples clustered by colony of origin rather than sample type (Figure 2). In particular, the two Canberra samples formed two independent clusters, while the Orpheus colonies clustered together, perhaps reflecting closer genetic similarity (or even identity) of the Orpheus colonies. Intriguingly, regeneration stage 1 and coenosarc edge samples appeared to segregate from the remaining samples of colony 1 (for which we generated highest number of samples).
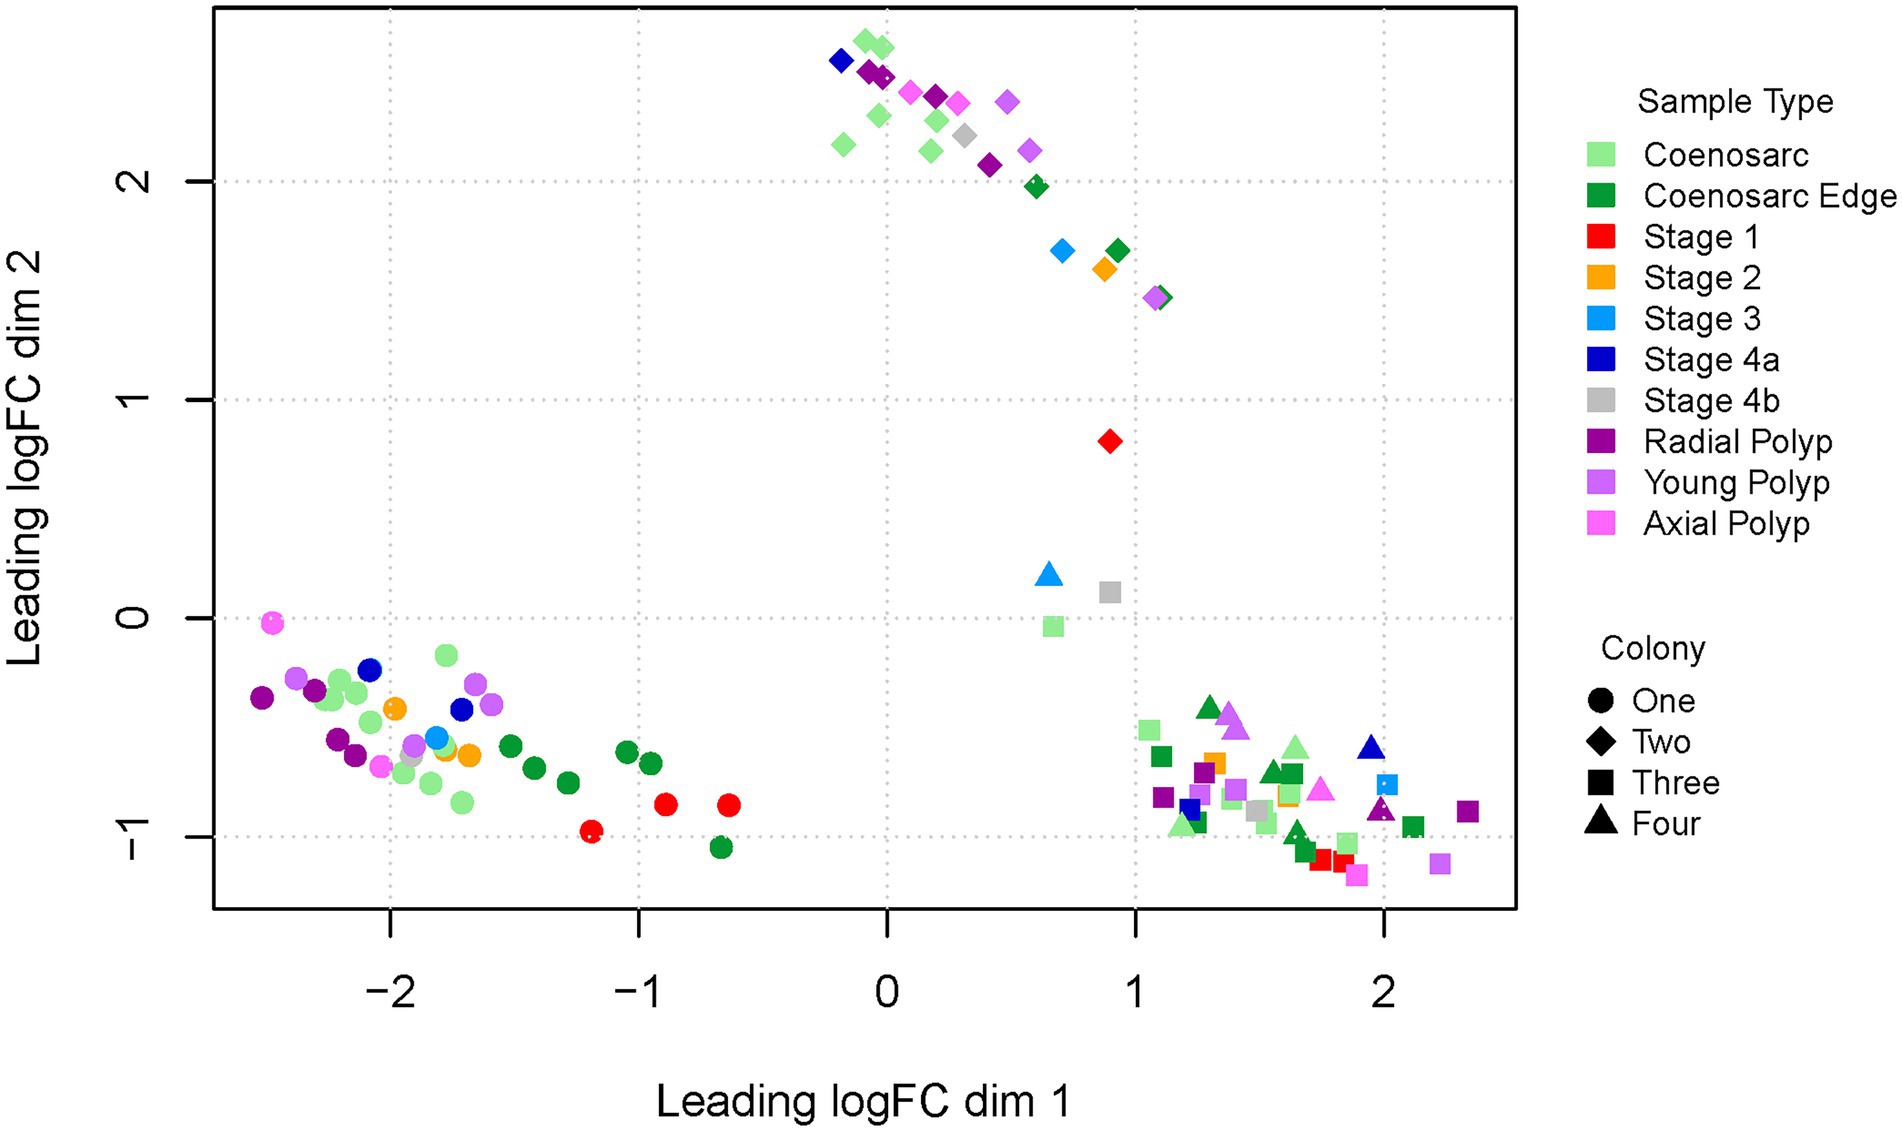
Figure 2. Multi-dimensional scaling plot (dimensions 1 and 2) of RNA-Seq samples representing regeneration of A. millepora. Colony one and two were housed in a closed system in Canberra, colony three and four were from open system in Orpheus Island.
We have next generated an MDS plot for dimensions three and four to see whether in these dimensions sample-type expression signatures would drive clustering (Figure 3). Strikingly, regeneration Stage 1 and coenosarc edge samples appear to segregate from the remaining samples in dimension 4, indicating that these samples are distinct from the remaining ones, and perhaps similar to each other. The remaining samples are intermingled with each other, indicating lack of strong gene expression signatures distinguishing the sample types, although Stage 2 samples are all relatively close to Stage 1 and coenosarc edge samples.
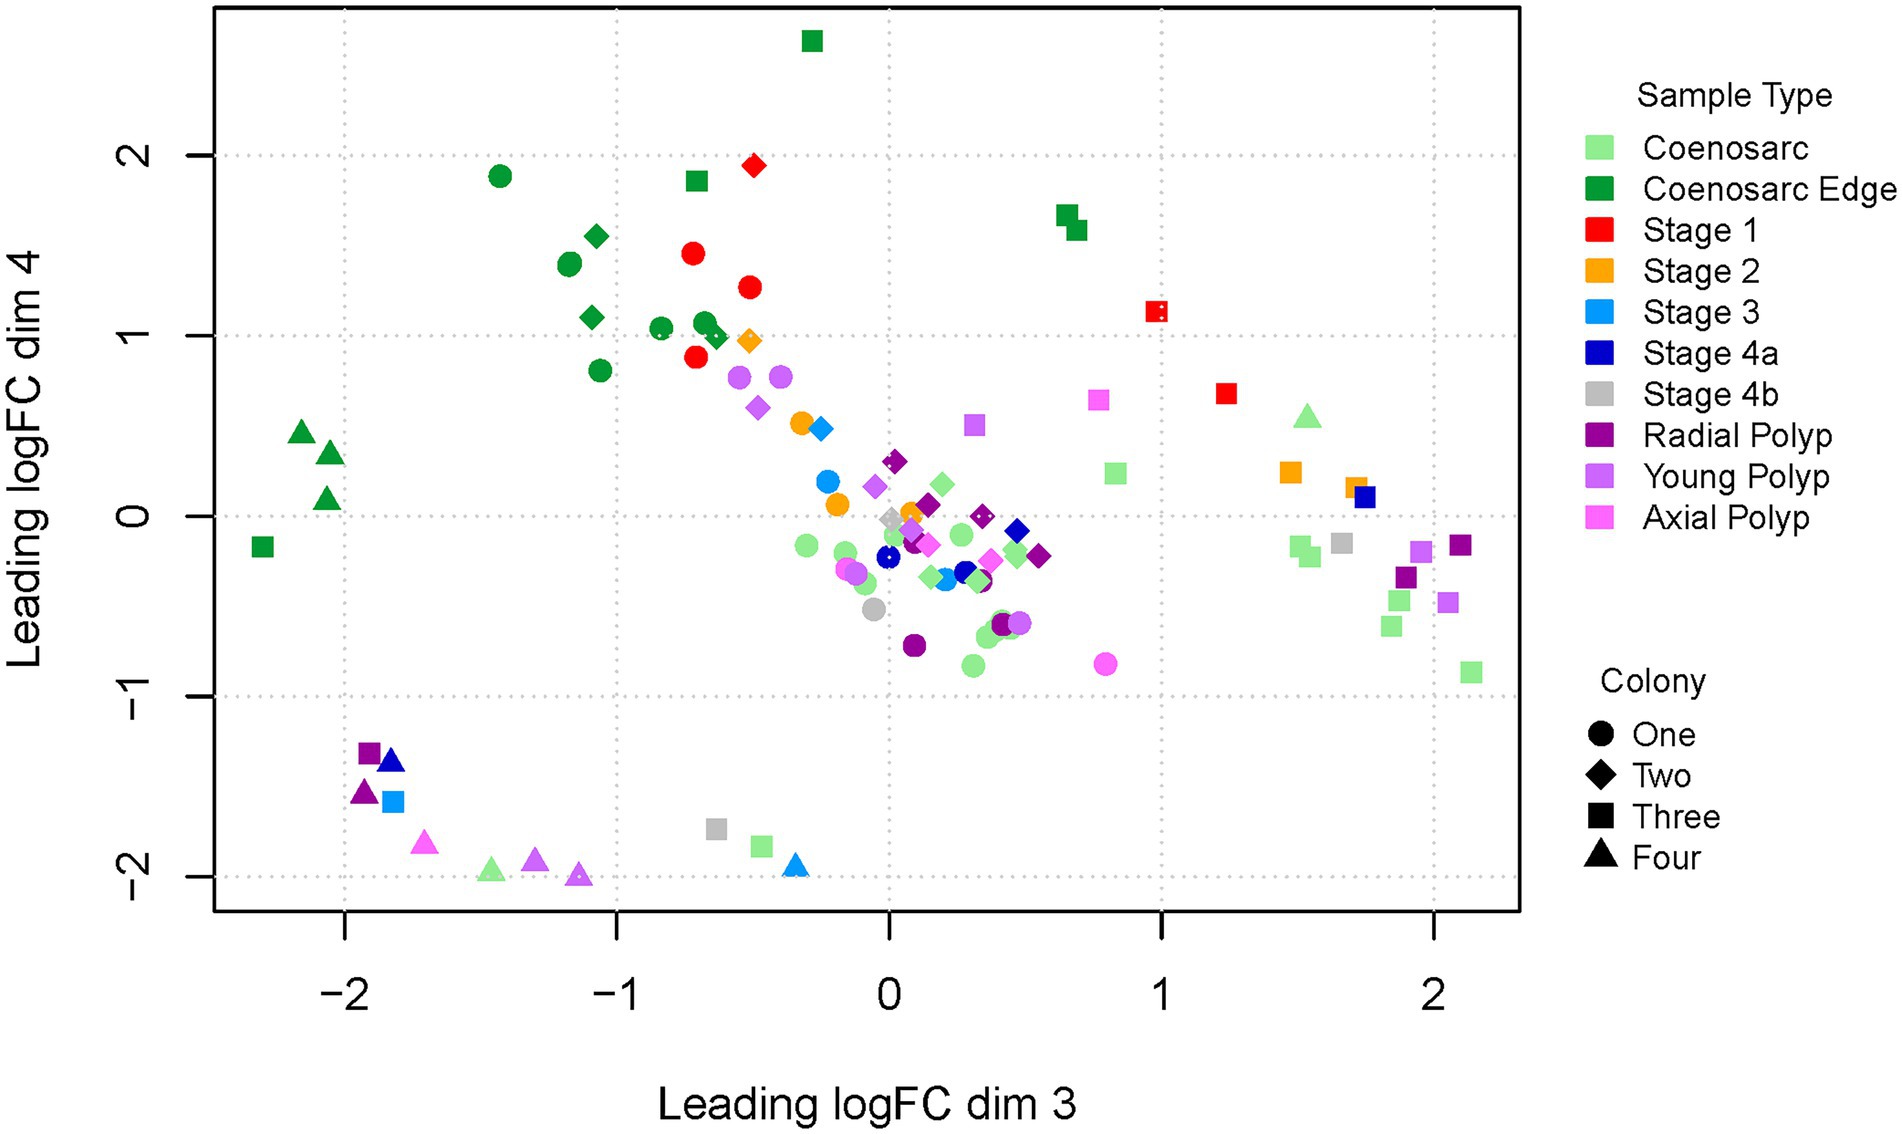
Figure 3. Multi-dimensional scaling plot (dimensions 3 and 4) of RNA-Seq samples representing regeneration of A. millepora. Colony one and two were housed in a closed system in Canberra, colony three and four were from open system in Orpheus Island. Note intermingled regeneration stage 1 and coenosarc edge samples segregating from other samples in dimension 4.
To find out whether inter-colony differences are obscuring gene expression changes driven by response to wounding, we have also generated MDS plots for colony one and two separately, as well as Canberra and Orpheus Island colonies. In all of these plots, segregation or of Stage 1 and coenosarc edge samples from other sample types was apparent in the 1st and/or 2nd dimension separately (Supplementary Figure 1), and no further separation was detected in other dimensions (not shown). This result suggests that the earliest wound healing (Stage 1) and actively growing (coeanosarc edge) samples are the only sample types which are significantly distinct from other samples at the level of transcriptome.
Cluster analysis of gene expression profiles during regeneration
To gain insight into the molecular events during wound healing and polyp regeneration, we carried out cluster analysis of gene expression profiles, followed by Gene Ontology (GO) enrichment analysis. Aiming to generate a simple representation of a polyp regeneration time course, we excluded the coenosarc edge and axial polyp samples from this analysis. The time course starts with coenosarc samples, includes all the regeneration stages and culminates with the radial polyp samples. In line with the MDS visualisation which indicated that only the coenosarc edge and regeneration stage 1 samples are distinct from others, only two cluster profiles were identified, each showing dramatic gene expression change in the earliest stage of regeneration, and otherwise stable expression across all other samples (Figure 4). The first profile, C0, includes 2,818 genes which are strongly downregulated by 6 h post injury (regeneration stage 1) and return to the previous level of expression by 24–48 h post injury (regeneration stage 2–3). Gene Ontology (GO) terms enriched in this cluster include signal transduction and exocytosis as well as terms connected with DNA repair and replication. These may be processes involved in the homeostasis/maintenance of cells which are downregulated during wound healing. The second cluster, C1, is composed of 2050 genes strongly upregulated 6 h after injury (stage 1) and returning to previous expression levels by 24–48 h post injury (stage 2–3). Enriched GO terms associated with this profile indicate increased ribosome biogenesis, splicing, translation and protein folding, as well as proteolysis and cytoskeleton reorganisation occurring soon after injury (Figure 4).
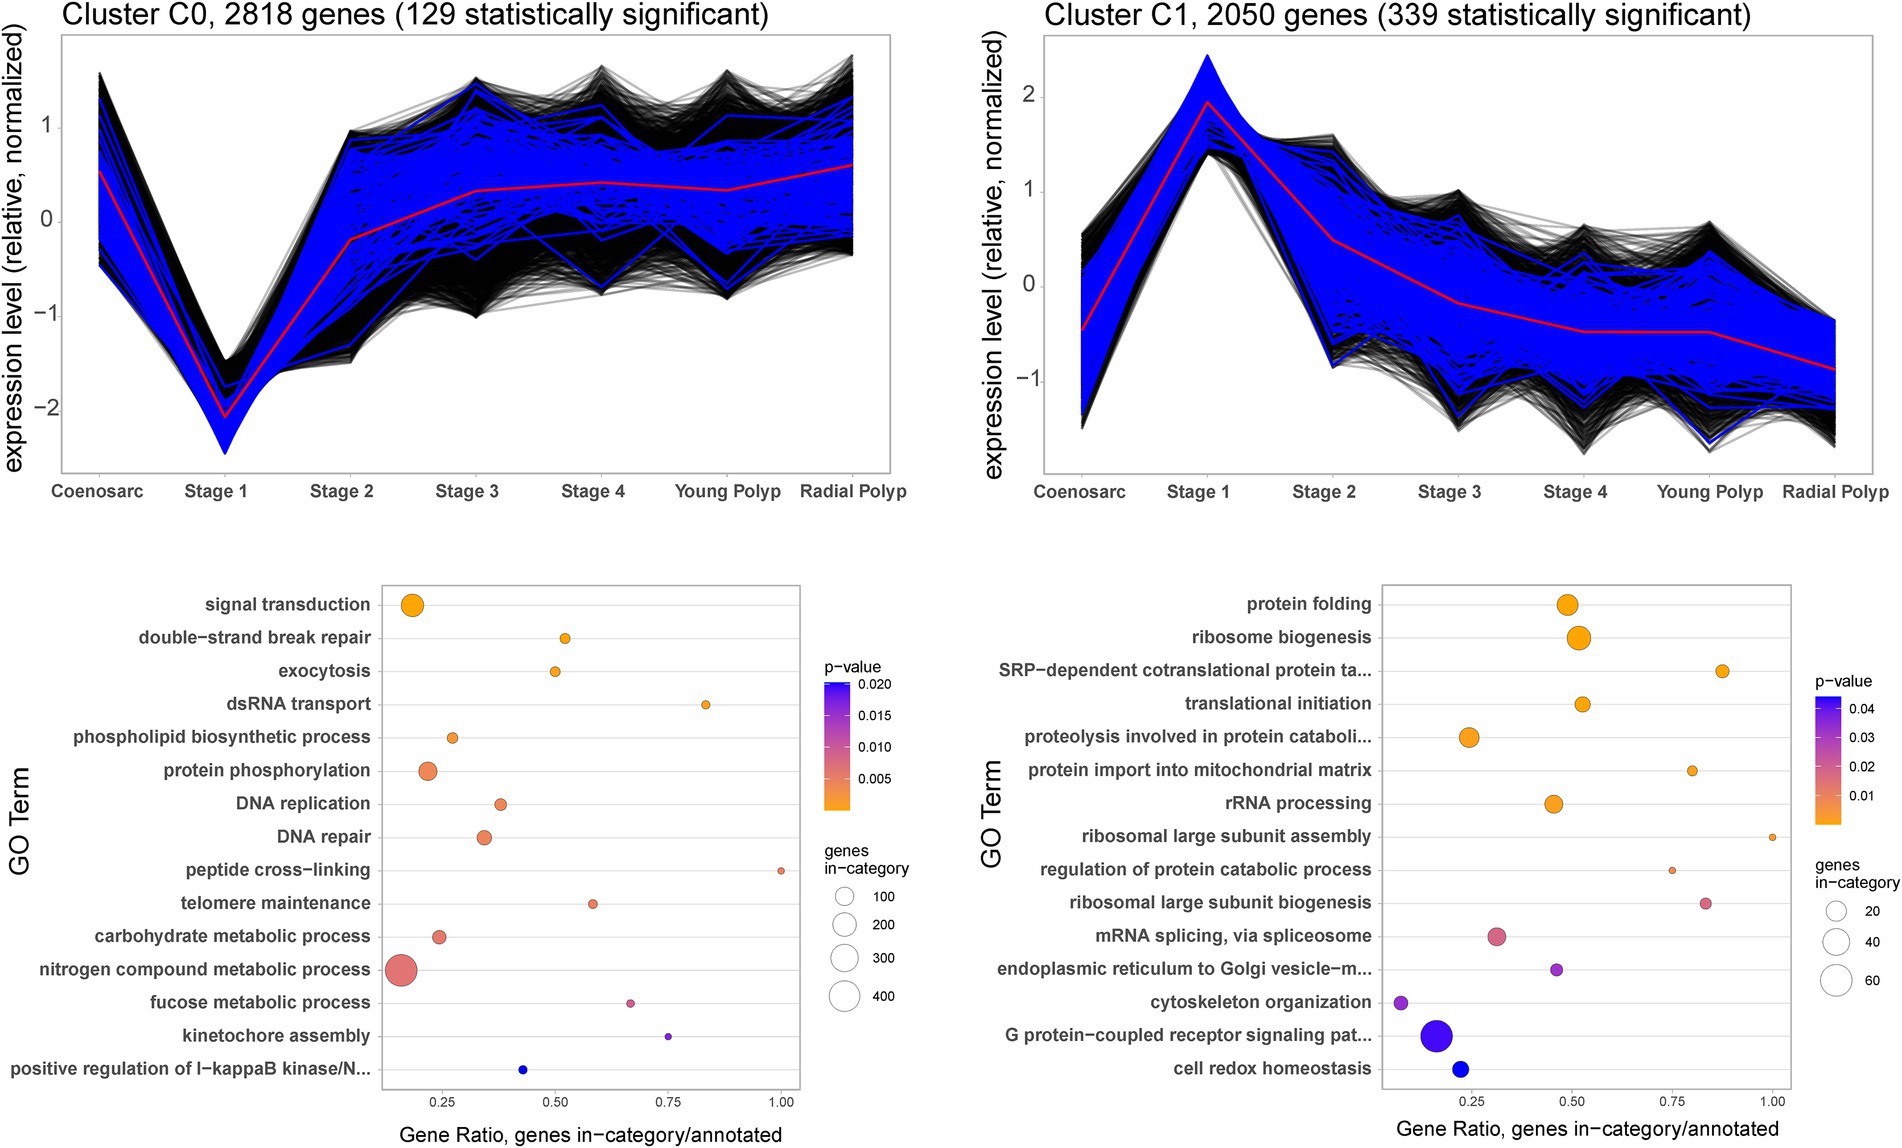
Figure 4. Gene expression clusters (top) and Biological Processes identified as Gene Ontology terms associated with them (bottom) during A. millepora wound healing and polyp regeneration. The black and blue lines show expression profiles of individual genes included in the cluster. The genes with expression statistically significantly different in Stage 1 (adj. value of p ≤0.05) – lower for C0 and higher for C1 – are shown in blue, and those with not-significantly different expression in black. The red lines represent mean expression profile calculated from all the genes included in the cluster.
Differentially expressed genes
We next carried out direct pairwise gene expression level comparisons between regenerating samples and their matching controls (that is, Stage 1, Stage 2 and Stage 3 vs. coenosarc; Stage 4 vs. young and radial polyps) as well as between morphologically distinct parts of the colony (coenosarc edge and polyps vs. coenosarc, axial polyp vs. radial polyp). In line with both MDS plot visualisations and the cluster analysis described above, we have found hundreds of statistically significant differentially expressed genes between Stage 1 and coenosarc edge when compared to coenosarc, with less than 20 genes differentially expressed at each of the remaining stages of regeneration (Supplementary Table 2).
Given that regeneration Stage 1 and coenosarc edge samples appeared similar to each other in the MDS plot visualisation (Figure 3), we checked whether any of the identified differentially expressed genes are common between these samples. Indeed, 105 genes were found on both the Stage 1 vs. coenosarc (out of total 658) and coenosarc edge vs. coenosarc (out of total 404; Supplementary Table 2) gene lists. It is worth to note that as we only compare lists of genes with statistically significant difference in expression, it is possible that the non-overlapping genes share the same expression trends without reaching the significance threshold.
To gain insight into biological processes occurring during the earliest stage of regeneration, we carried Gene Ontology (GO) enrichments analysis. Genes upregulated during regeneration Stage 1 appear strongly associated with regulation of transcription, signal transduction and development in general. Moreover, the identified terms include three specific signalling systems, well known to be involved in wound healing and regeneration across the animal kingdom: the Wnt (e.g., Kawakami et al., 2006) and FGF signalling pathways (e.g., Maddaluno et al., 2017) and the JNK cascade (e.g., Rämet et al., 2002; Figure 5).
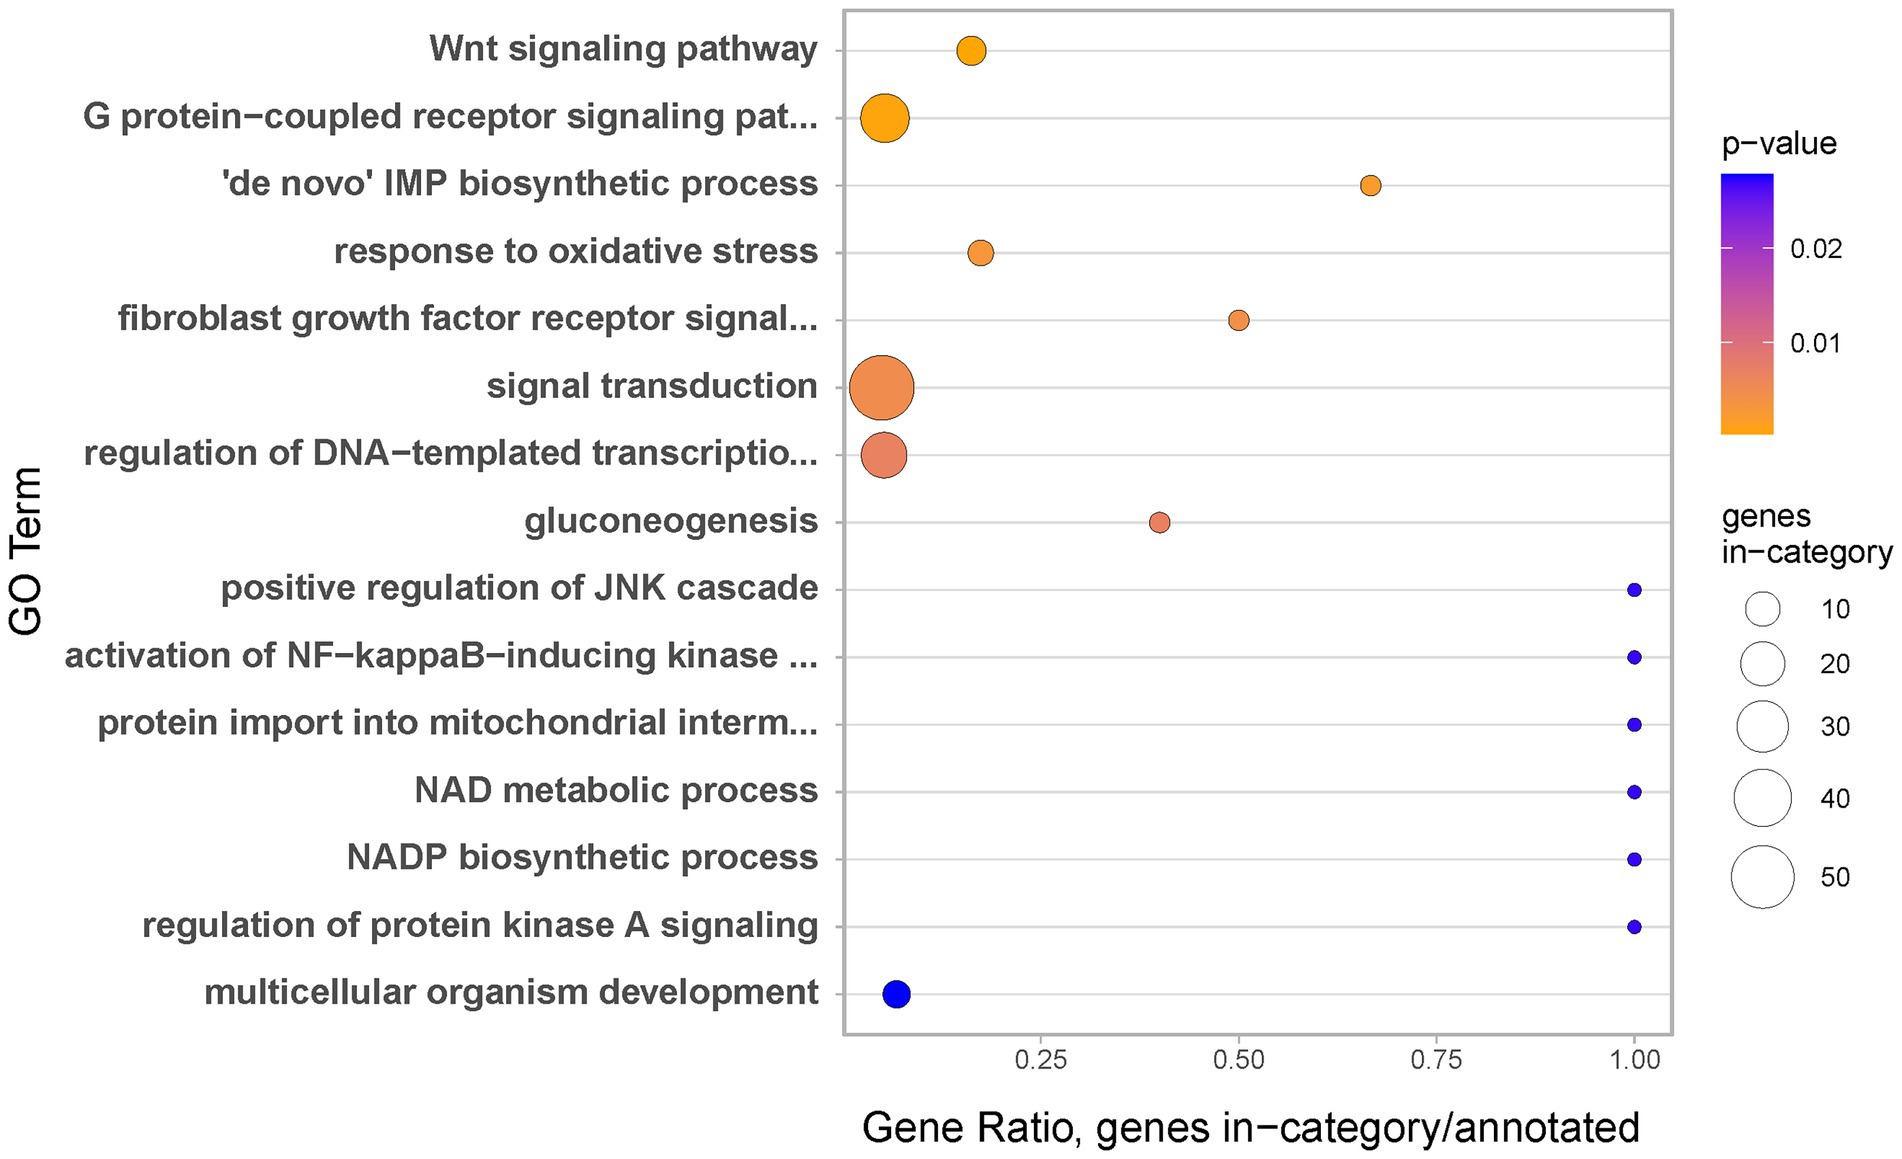
Figure 5. Biological Processes identified as gene ontology enriched terms in genes significantly upregulated at regeneration Stage 1 as compared to coenosarc.
We have next selected 39 Stage 1 upregulated genes which had meaningful annotations based on BLAST hit (including transcription factors, components of signalling pathways and genes implicated in coral skeleton formation, see Supplementary Table 2) to visualise their expression profiles across all samples.
In line with the enriched GO terms, these include four FGF ligands, one FGF antagonist (sprouty), one Wnt ligand and one Wnt pathway component (wntless), galaxin (component of the organic matrix of coral skeleton, e.g., Reyes-Bermudez et al., 2009), ADAMTS metalloproteases, belonging to a group of proteases found to be involved in ECM remodelling across phyla (e.g., Kuno and Matsushima, 1998) and previously shown to be involved in cnidarian regeneration (Schaffer et al., 2016; Stewart et al., 2017), and several transcription factors including c-Fos, known to be regulated by the JNK cascade and involved in injury response (e.g., Rämet et al., 2002). A heatmap representation of their expression demonstrates that in majority of cases the peak of expression coincides with the stage 1 of regeneration, although many are also upregulated in the coenosarc edge (Figure 6). Similar to the profiles identified by gene expression clustering analysis, while dramatically decreased as compared to Stage 1, expression of many of these genes is still elevated at Stage 2 or even 3.
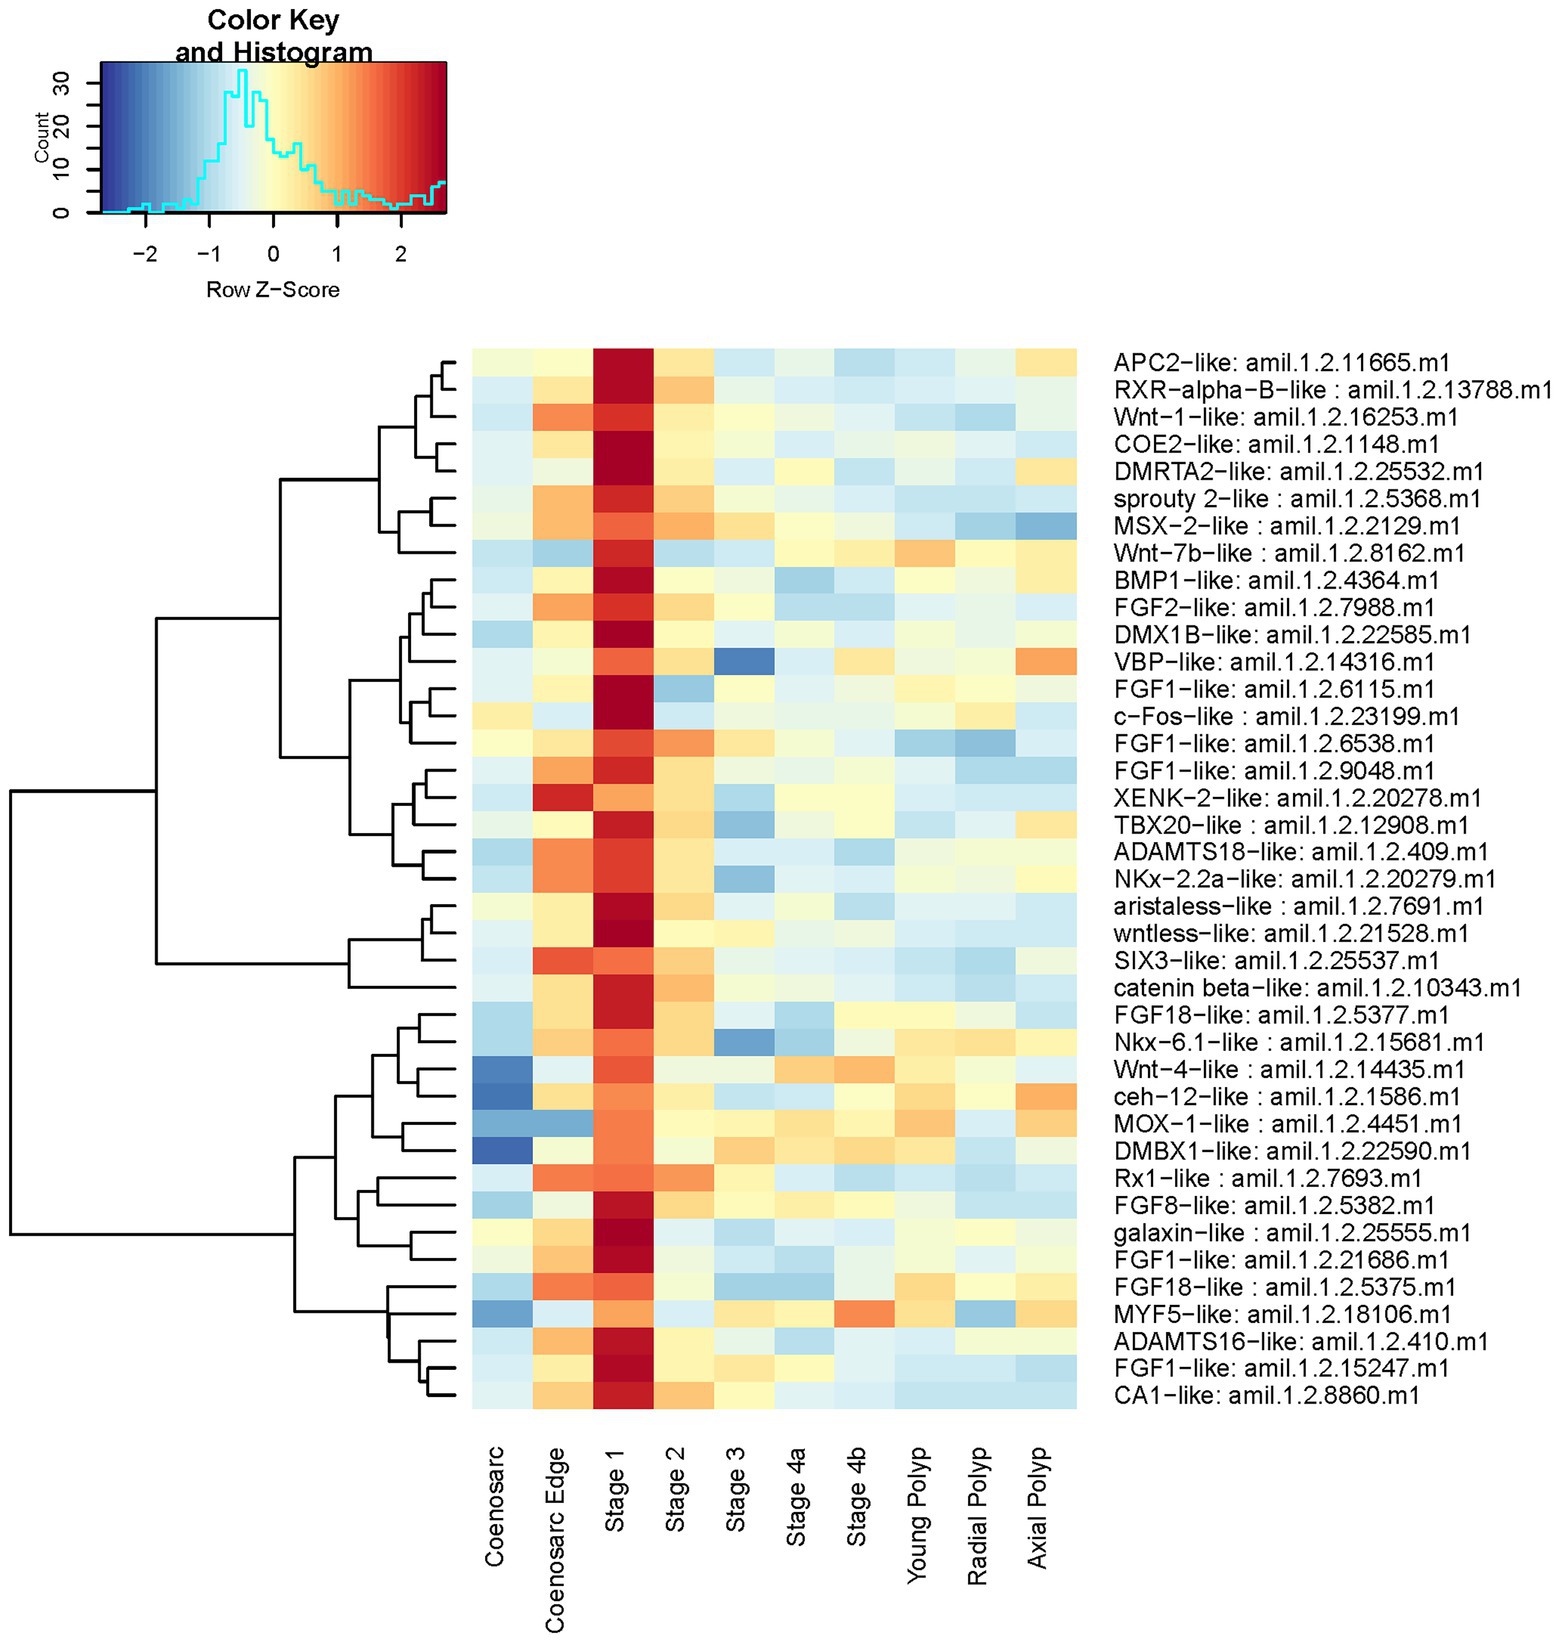
Figure 6. Expression heatmap of selected genes among those highly upregulated at regeneration Stage 1. Samples were pooled according to regeneration stage and colony part. Colour denotes an increase (red) or decrease (blue) in expression based on the z-score. The Histogram shows the distribution of the z-scores on the heatmap.
As could be expected from the partly overlapping lists of genes differentially expressed in regeneration stage 1 and the coenosarc edge (both compared to coenosarc), GO enrichment analysis of the coenosarc edge regulated genes revealed both similar and strikingly contrasting terms. As in the case of regeneration, genes upregulated in the coenosarc edge were linked with regulation of transcription and cell signalling, likely reflecting the active growth at the edge (Figure 7). However, while for the coenosarc edge the top biological process indicated by GO enrichment analysis is calcium ion transmembrane transport (possibly linked with active formation of calcium-based skeleton of the coral), this term did not appear enriched during regeneration. This result is in line with the notion that transcriptional response to injury does not simply redeploy genes involved in growth.
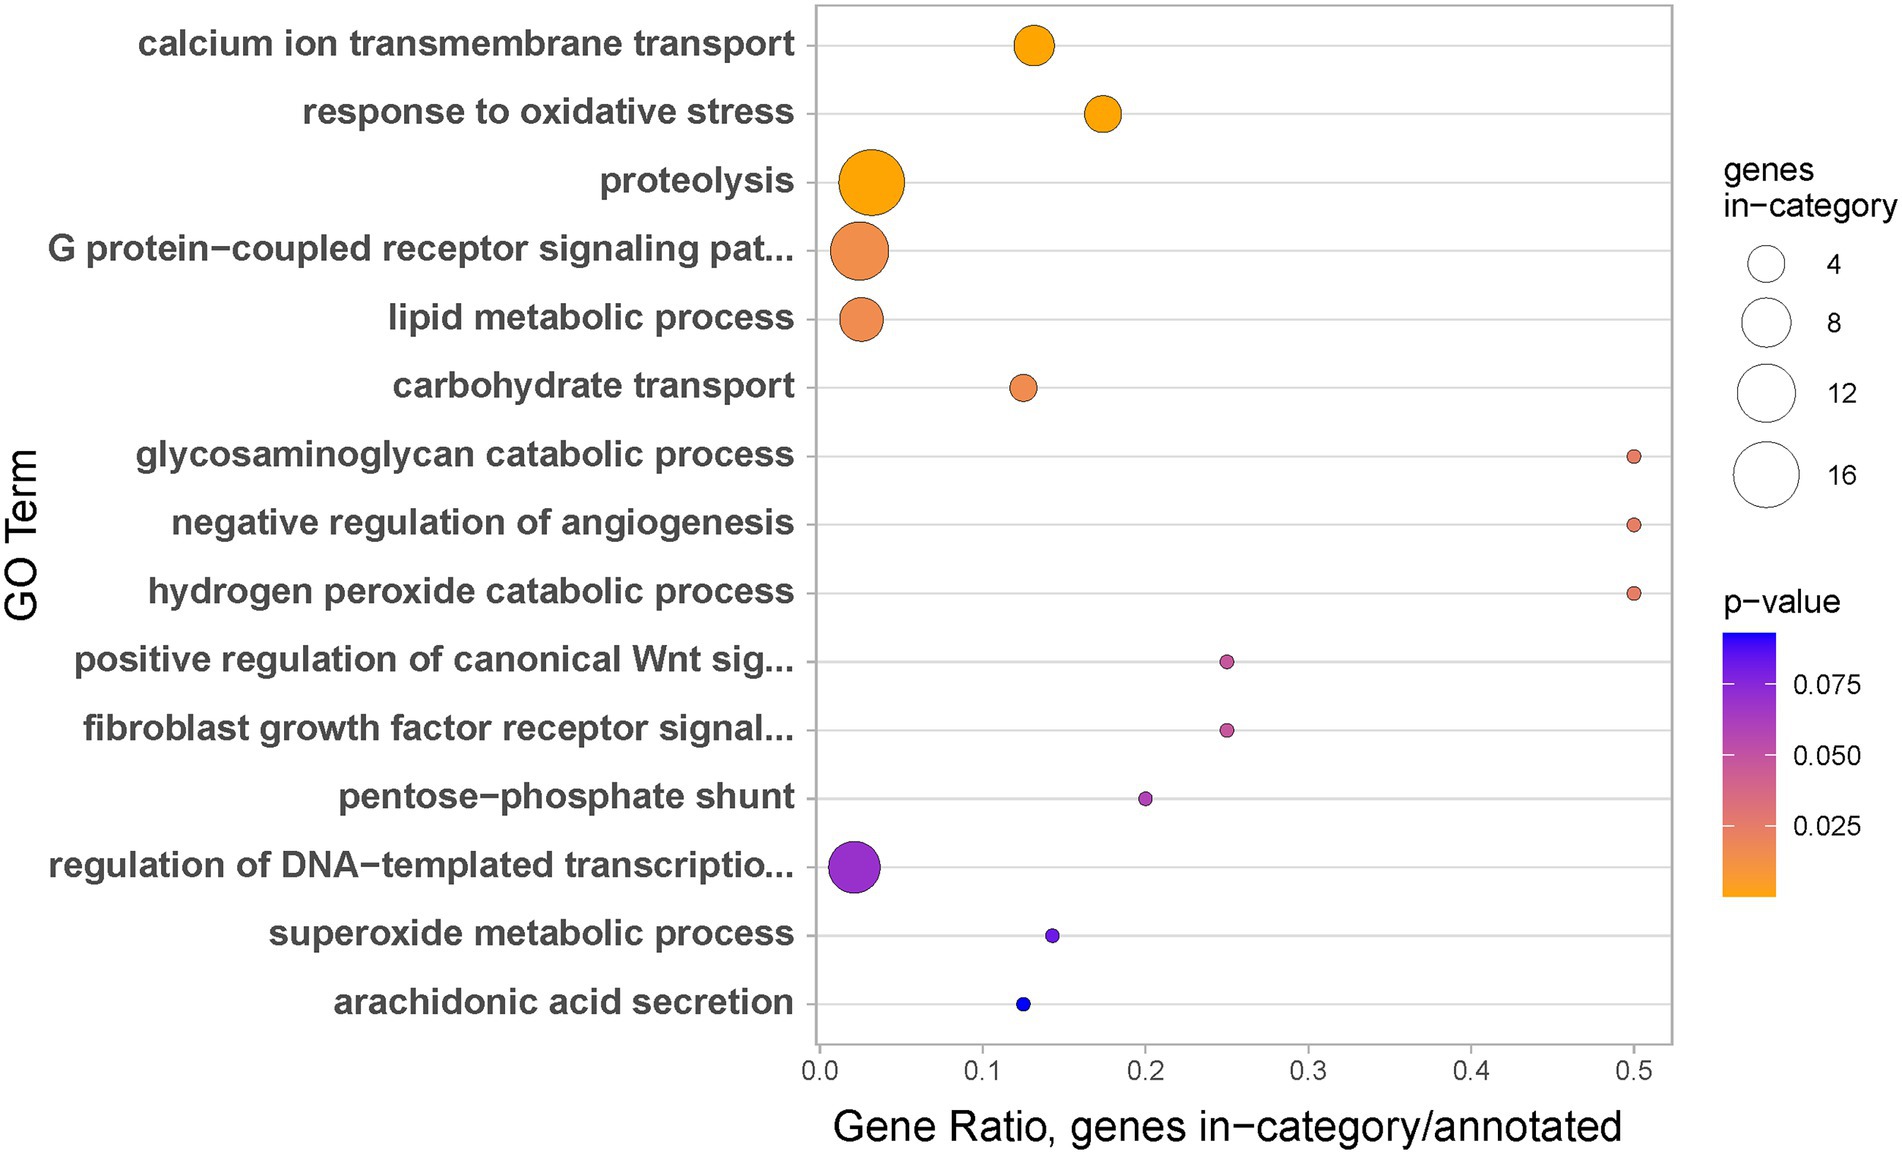
Figure 7. Biological processes identified as gene ontology enriched terms in significantly upregulated genes in coenosarc edge samples in comparison to coenosarc.
The stringent analysis (limited to genes with statistically significant two-fold expression change) revealed multiple genes which are likely to be regulating the earliest stages of regeneration in scleractinian corals. However, we are aware that the small sample size and batch (colony) effects might be precluding detection of many other genes involved in the process if their expression or level of change are lower and/or more variable. We wondered whether including all samples in the analysis increases our power of detection of differentially expressed genes, or whether, conversely, the potential differences between the experimental conditions (and/or colony differences) are obscuring the expression changes in response to the injury. We have therefore generated and compare lists of DEGs obtained using only samples from the closed (colony 1 and 2) and open (colony 3 and 4) experimental systems (Supplementary Figure 2). The analyses using only subsets of data resulted in lower numbers of differentially expressed genes detected, especially when using only colonies 3 and 4 for which the lowest number of replicates was obtained. Importantly, over 68% of DEGs identified in the condition-limited analyses was also identified when using the entire dataset (Supplementary Figure 2), demonstrating that increasing number of replicates, even if these are biologically distinct and cultivated in different systems, increases the detection power of our analysis.
Notably, even the analyses limited to low numbers of replicates pointed to importance of FGF and Wnt pathways in the earliest step of A. millepora regeneration. Therefore, we decided to visualise expression of core components of these two signalling pathways across A. millepora regeneration timeline and in different parts of the colony. Based on A. millepora transcriptome annotation, we identified 16 ligands (Supplementary Figure 3), three receptors and two antagonists of the FGF pathway.
As can be seen on the expression heatmap, all 21 genes show dynamic expression across the regeneration and/or morphologically distinctive parts of the colony (Figure 8).
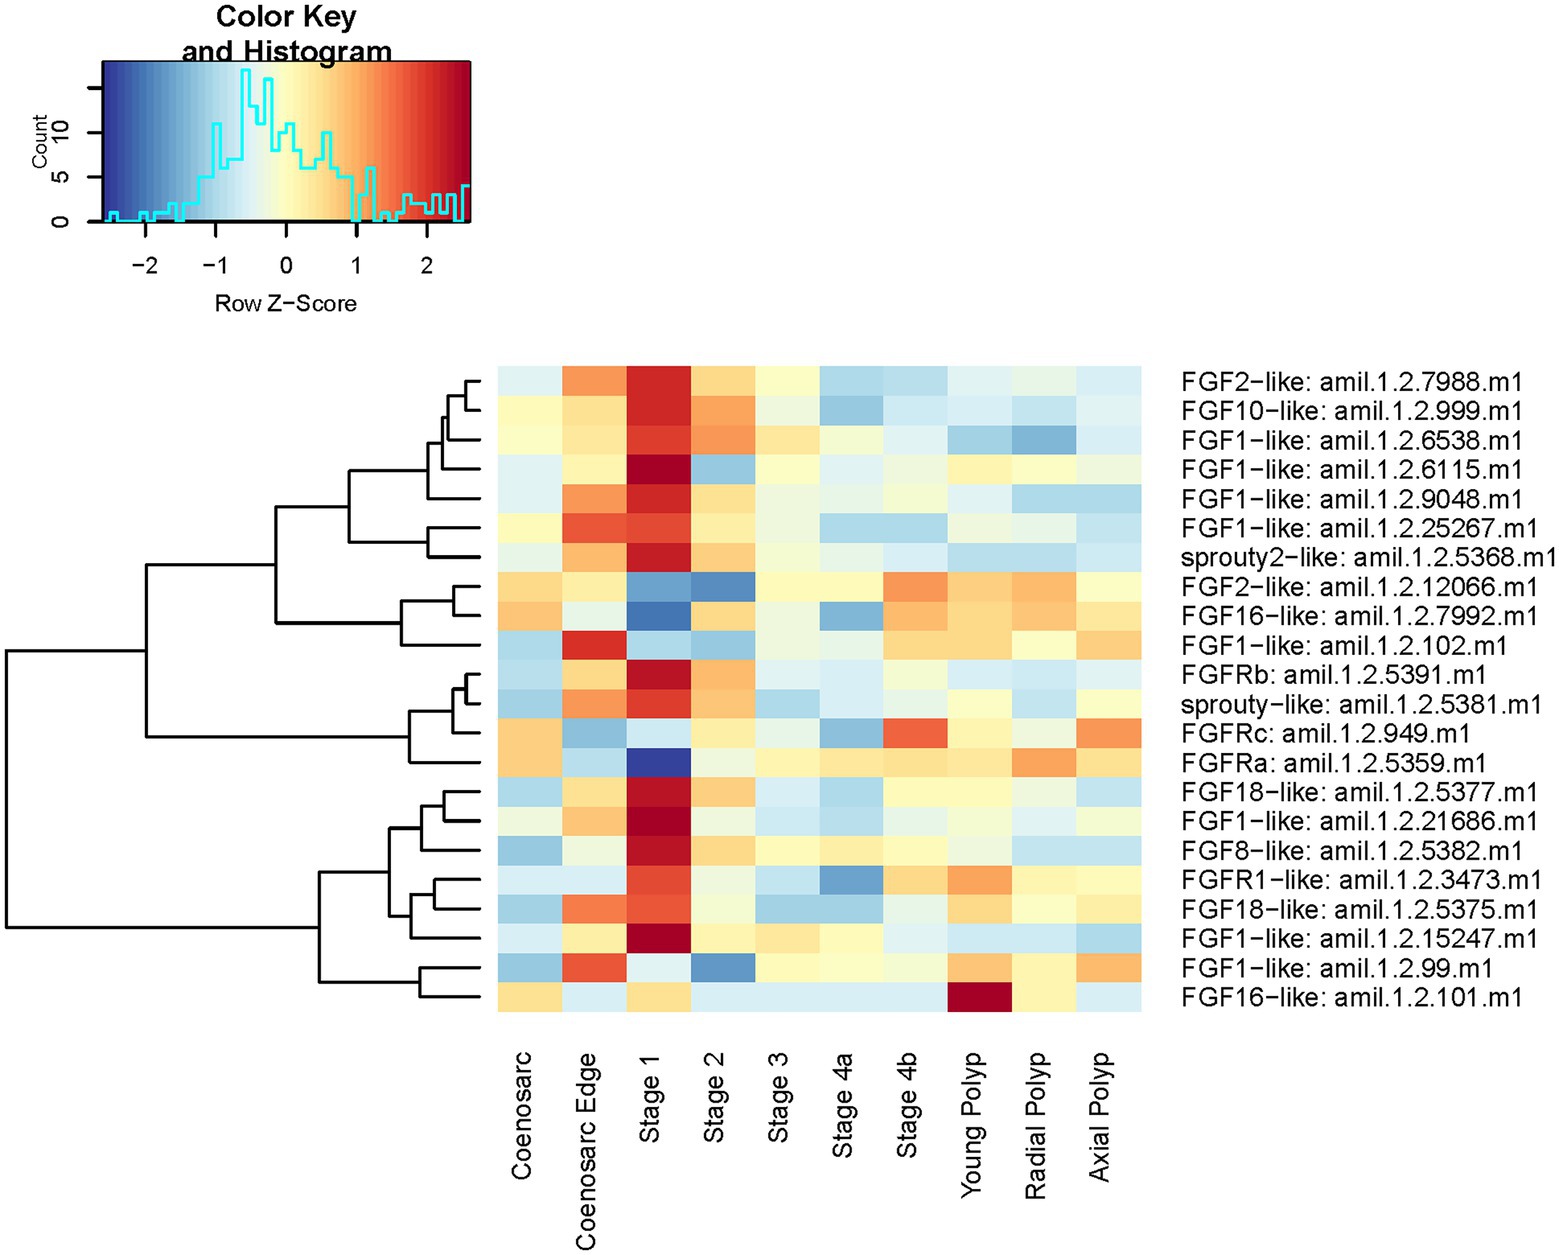
Figure 8. Expression heatmap of core components of the A. millepora FGF pathway. Samples are pooled according to regeneration stage and morphologically distinct colony part. Colour denotes an increase (red) or decrease (blue) in expression based on the z-score. The Histogram shows the distribution of the z-scores on the heatmap.
In line with the previous analyses, stage 1 of regeneration and coenosarc edge have strongest expression of FGF pathway components overall, with 16 of the components displaying peak of their expression in one (or both) of these two stages. Notably, expression of only one (FGFRb in Figure 8) of the identified three FGF receptors follows this trend, with two remaining ones conspicuously downregulated in early stages of regeneration and coenosarc edge (Figure 8). The peak of expression of both of the sprouty antagonists during early regeneration stages and in the coenosarc edge is consistent with peak of the FGF signalling activity in these stages, as in other experimental systems expression of sprouty has been documented to be positively regulated by the pathway activity (e.g., Minowada et al., 1999). Intriguingly, neither of the sprouties, but several of the FGF ligands and the two FGF receptors not upregulated during regeneration show differential expression between the three different polyp types we included in the analysis (young, radial and axial). This result must be interpreted with caution given our stringent analysis failed to identify significant expression differences between polyp types, and we have not seen these samples segregating in MDS plots.
Next, we visualised expression of all Wnt ligands (Supplementary Figure 4), along with Wntless (protein involved in Wnt secretion), beta-catenin and APC which we already found to be upregulated in regeneration stage 1 (Supplementary Table 2, Figure 6). In addition to the anticipated peak in stage 1 of regeneration (6 Wnt ligands, one of which was identified in the differential gene expression analysis), 4 Wnts have highest expression at Stage 3, the stage after wound healing is complete and just before polyp tentacles emerge, perhaps indicating a role in patterning (Figure 9). Interestingly, of the three Wnt transcripts upregulated at the coenosarc edge, two are also upregulated at the earliest stage of regeneration, but expression of Wnt10a-like appears downregulated. Given the critical role of Wntless in Wnt secretion (Bänziger et al., 2006), it is important to note that while its expression clearly peaks at the earliest stage of regeneration, it is also elevated at the coenosarc edge and throughout Stages 2 and 3 of regeneration, consistent with involvement of the Wnt pathway in growth, wound healing and regeneration (Figure 9).
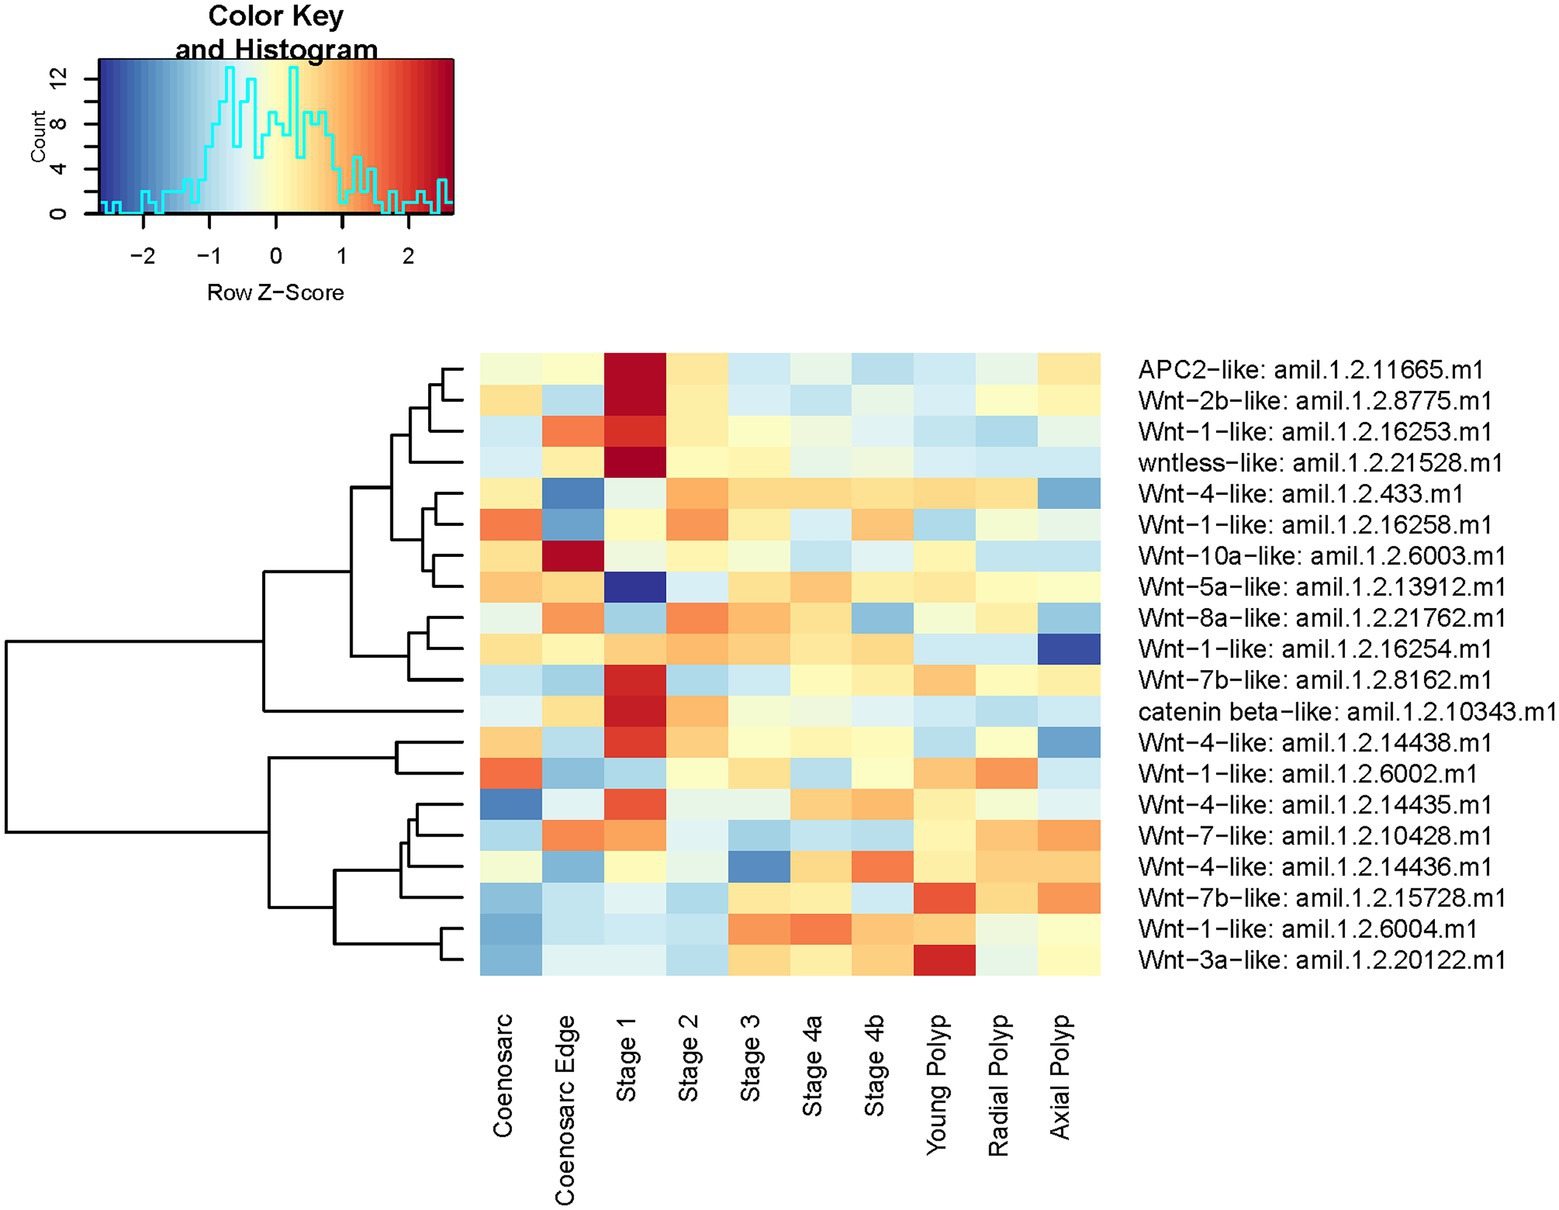
Figure 9. Expression heatmap of A. millepora Wnt genes and core components of the Wnt pathway. Samples are pooled according to regeneration stage and morphologically distinct colony part. Colour denotes an increase (red) or decrease (blue) in expression based on the z-score. The Histogram shows the distribution of the z-scores on the heatmap.
We have next sought to identify genes involved in polyp morphogenesis and those responsible for morphological differences between radial and axial polyps. No genes were found as statistically significantly differentially expressed in the following comparisons: axial vs. radial polyps, axial polyp vs. coenosarc, stage 4 (when tentacles are first visible) vs. any polyps. Only 16 genes were found to be differentially expressed between stage 4 and coenosarc and 43 genes between young polyp and coenosarc (Supplementary Table 2). There is a strong overlap between these two lists, with nine genes upregulated in both types of samples, including one encoding neuropeptide RF-amide, which was also identified as the only gene with significantly different expression between the radial polyp and coenosarc (Supplementary Table 2). This is a notable finding, as RF-amide, as well as LW-amide upregulated in young polyps, are neuropeptides previously shown to be specifically expressed in the nervous system of A. millepora, concentrated around the oral region and in the tentacles (Attenborough et al., 2019). Genes encoding receptors for peptide hormones and neurotransmitters were also found to be upregulated in the young polyps, perhaps also associated with the nervous system, as were multiple transcription factors. As visible on heatmap representation of their expression (Figure 10), majority of these genes are also expressed higher than in coenosarc in regenerating and mature polyps, even though this upregulation is not statistically significant or high enough to be detected by our stringent analysis.
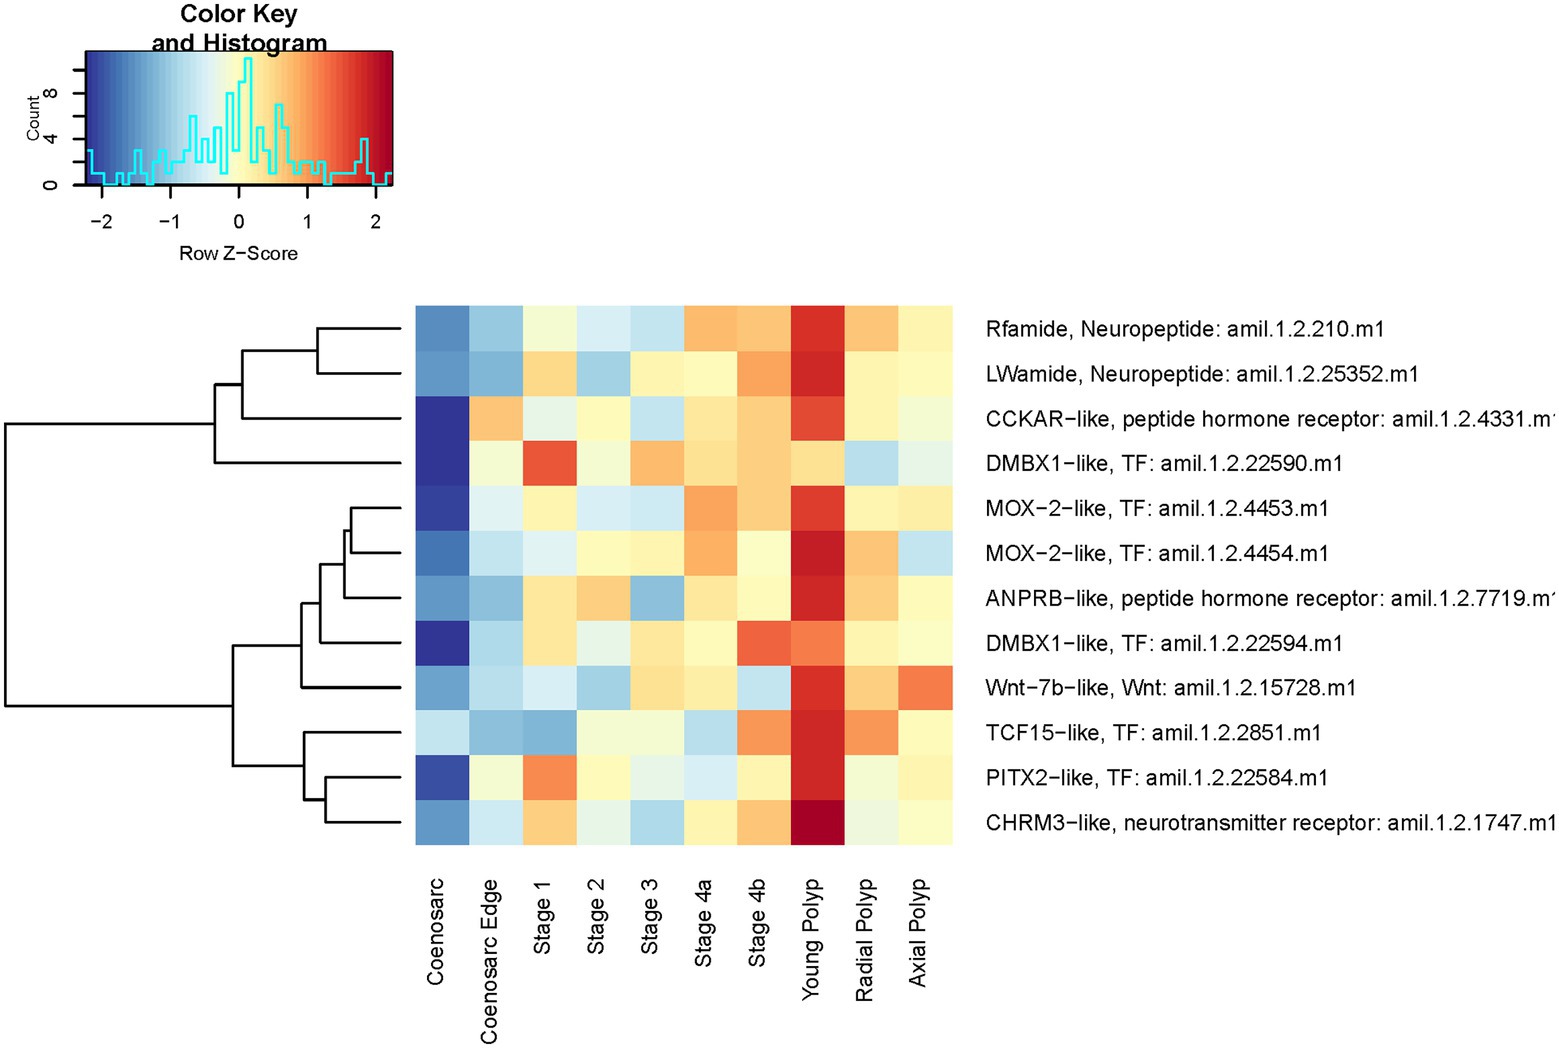
Figure 10. Expression heatmap of selected genes identified as upregulated in recently formed (young) polyps of A. millepora. Samples are pooled according to regeneration stage and morphologically distinct colony part. Colour denotes an increase (red) or decrease (blue) in expression based on the z-score. The Histogram shows the distribution of the z-scores on the heatmap.
Discussion
Regeneration of scleractinian corals is important from ecological and environmental perspectives, especially given the increased intensity and frequency of reef framework damaging events. It is also fundamentally interesting from a developmental and regenerative biology perspectives, given the interlinked abilities of continuous growth and regeneration which are characteristic for this lineage. Here, by discovering genes involved in regeneration and comparing them to those involved in growth processes, we aimed to get insight into the molecular background of regeneration in A. millepora.
The first (and sometimes the only) step of regeneration is wound healing. In all animals capable of wound healing, it is a relatively fast process of tissue repairing/remodelling after injury, aimed at preventing infection and further loss of exposed tissues. In model system cnidarians, such as the starlet sea anemone Nematostella vectensis, wound healing and the subsequent regeneration have been shown to involve immune response, apoptosis and cell proliferation, as previously documented across diverse bilaterian species (e.g., DuBuc et al., 2014). For cnidarians with a calcium carbonate skeleton such as scleractinian corals, trauma-induced exposure of skeleton causes additional vulnerability to aragonite dissolving in the surrounding sea water (Frear and Johnston, 1929). Thus, to prevent loss of the skeleton as well as reduce the risk of infection, the damaged coenosarc must quickly extend over the entire wound surface. Importantly, one of key elements of normal coral growth is the extension of coenosarc around the edge of the substrate attachment zone. This growth is observed in young colonies derived from metamorphosed larvae, as well as fragments of established colonies. The fast growth rate of the coenosarc edge gives corals the ability to grow over substrates and extend their habitat (Forsman et al., 2015).
Here we asked whether wound healing in A. millepora utilises the same gene toolkit which is used during coenosarc edge growth, or whether an independent network of wound-healing specific genes is deployed upon injury. The issue of distinctiveness of regeneration vs. normal development/growth programmes continues to be a fascinating challenge for over a century (posed by Morgan, 1901; reviewed by Vervoort, 2011, recently addressed, among others, by Soubigou et al., 2020; Johnston et al., 2021; Sinigaglia et al., 2022).
As could be expected if a similar set of genes was used during both processes, the multi-dimensional scaling (MDS) plot showed that coenosarc edge (continues growth) and earliest wound healing stages are more similar to each other then they are to the remaining samples (Figure 3). Moreover, consistent with their previously described roles in other experimental systems, including cnidarians, (e.g., DuBuc et al., 2014; Stewart et al., 2017), components of both Wnt and FGF pathways are strongly upregulated at both the coenosarc edge and at regeneration stage 1 (Figures 8, 9, Supplementary Table 2).
We have hypothesised that because A. millepora specimens continuously grow in favourable conditions, redeployment of the ‘growth genes’ is a likely scenario, perhaps supplemented by additional genes involved in clearing and remodelling of the damaged tissues upon injury. Surprisingly, only 16% of genes we found to be regulated as response to injury were also found to be differentially expressed between the actively growing coenosarc edge vs. more ‘static’ (not expanding) coenosarc between mature radial polyps. Conversely, 26% of genes differentially expressed between the coenosarc edge and the between-polyps coenosarc were also detected as involved in the wound healing.
It is formally possible that these apparent differences are not due to real differences in gene expression, but our ability to identify differentially expressed genes with sufficient statistical significance. However, a candidate-centred approach, where we visualised expression of Wnt and FGF pathway components as well as particularly interesting genes identified as upregulated at the earliest stage of regeneration suggests otherwise (Figures 6, 8, 9). In fact, while some FGF ligands, transcription factors (e.g., NK2) and the metalloprotease ADAMTS18-like are upregulated in both the coenosarc edge and the earliest stages of regeneration, it is clear that regulation of other genes is independent in these two processes. Therefore, we conclude that while similarities in regulatory gene usage exists between growth and regeneration, these processes are clearly distinct.
One of the most striking examples of genes used uniquely during the earliest stages of regeneration is transcription factor c-Fos (Supplementary Table 2 and Figure 6). c-Fos has been implicated in injury and stress response in multiple model systems, including N. vectensis (Kovács, 2008; DuBuc et al., 2014). In addition to direct identification of c-Fos as specifically upregulated during the earliest stages of regeneration, we have also found JNK cascade as implicated in this process through Gene Ontology (GO) enrichment analysis (Figure 5). This is meaningful, as the JNK cascade is known to regulate c-Fos across bilaterians (e.g., Rämet et al., 2002). While involvement of c-Fos in cnidarian wound healing is not a new finding, we believe that our ability to discover this in an unbiased (not candidate-driven) analysis in a reef building coral demonstrates that A. millepora is a valid model for regenerative biology research even in land-locked laboratories such as ours. Moreover, results obtained in laboratory conditions could be combined with those from a more natural, flow-through marine station system, underscoring experimental reproducibility across different genetics and experimental conditions. We hope that A. millepora and other scleractinian corals will provide useful models to address further questions in developmental and regenerative biology, such as genetic (and/or epigenetic) mechanisms governing identity of colony units (e.g., axial vs. radial polyps), interactions between diverse members of the coral holobiont in the changing environmental conditions and roles of specific cell types in growth and regeneration.
Data availability statement
Raw Illumina RNA-Seq reads generated in this study have been deposited in ENA Short Read Archive under study PRJEB55598 (samples ERS12852684–ERS12852781, runs ERR10123024–ERR10123121).
Author contributions
MAdamska, JX, OM, MAdamski, and DM: project design. JX: laboratory experiments. JX and AM: field work. JX, MAdamska, MAdamski, OM, and CC: data analysis and interpretation. JX, MAdamska, MAdamski, CC, and OM: manuscript writing. All authors contributed to the article and approved the submitted version.
Funding
The work was supported by the ARC through Centre of Excellence for Coral Reef Studies CE140100020.
Acknowledgments
We appreciate support of S. Eggins, M. Ellwood, and O. Branson who shared with us their saltwater aquarium system at the Research School of Earth Sciences, ANU, as well as the excellent support of the technical staff of Orpheus Island Research Station. We thank members of J.X. Honours committee: E. Ball, A. Fahrer and G. van Dooren for stimulating discussions throughout the duration of the project and Hua Ying for sharing A. millepora gene models prior to publication. Sequencing of all samples have been carried at Biomolecular Research Facility, ANU, which is a service node of Bioplatforms Australia. The project has been funded by ARC through Centre of Excellence for Coral Reef Studies CE140100020.
Conflict of interest
The authors declare that the research was conducted in the absence of any commercial or financial relationships that could be construed as a potential conflict of interest.
Publisher’s note
All claims expressed in this article are solely those of the authors and do not necessarily represent those of their affiliated organizations, or those of the publisher, the editors and the reviewers. Any product that may be evaluated in this article, or claim that may be made by its manufacturer, is not guaranteed or endorsed by the publisher.
Supplementary material
The Supplementary material for this article can be found online at: https://www.frontiersin.org/articles/10.3389/fevo.2022.979278/full#supplementary-material
References
Abu-Jamous, B., and Kelly, S. (2018). Clust: automatic extraction of optimal co-expressed gene clusters from gene expression data. Genome Biol. 19:172. doi: 10.1186/s13059-018-1536-8
Alexa, A., Rahnenführer, J., and Lengauer, T. (2006). Improved scoring of functional groups from gene expression data by decorrelating GO graph structure. Bioinformatics 22, 1600–1607. doi: 10.1093/bioinformatics/btl140
Amiel, A. R., Johnston, H. T., Nedoncelle, K., Warner, J. F., Ferreira, S., and Röttinger, E. (2015). Characterization of morphological and cellular events underlying oral regeneration in the sea anemone, nematostella vectensis. Int. J. Mol. Sci. 16, 28449–28471. doi: 10.3390/ijms161226100
Attenborough, R. M. F., Hayward, D. C., Wiedemann, U., Forêt, S., Miller, D. J., and Ball, E. E. (2019). Expression of the neuropeptides RFamide and LWamide during development of the coral Acropora millepora in relation to settlement and metamorphosis. Dev. Biol. 446, 56–67. doi: 10.1016/j.ydbio.2018.11.022
Bak, R. P. M. (1978). Lethal and sublethal effects of dredging on reef corals. Mar. Pollut. Bull. 9, 14–16. doi: 10.1016/0025-326X(78)90275-8
Bänziger, C., Soldini, D., Schütt, C., Zipperlen, P., Hausmann, G., and Basler, K. (2006). Wntless, a conserved membrane protein dedicated to the secretion of Wnt proteins from signaling cells. Cells 125, 509–522. doi: 10.1016/j.cell.2006.02.049
Bossert, P., and Thomsen, G. H. (2017). Inducing complete polyp regeneration from the Aboral Physa of the Starlet Sea anemone Nematostella vectensis. J. Vis. Exp. 2017:54626. doi: 10.3791/54626
Chen, Y., Lun, A. T. L., and Smyth, G. K. (2016). From reads to genes to pathways: differential expression analysis of RNA-Seq experiments using Rsubread and the edgeR quasi-likelihood pipeline. F1000Res. 5:1438. doi: 10.12688/f1000research.8987.2
Diaz-Pulido, G., McCook, L. J., Dove, S., Berkelmans, R., Roff, G., Kline, D. I., et al. (2009). Doom and boom on a resilient reef: climate change, algal overgrowth and coral recovery. PLoS One 4:e5239. doi: 10.1371/journal.pone.0005239
DuBuc, T. Q., Traylor-Knowles, N., and Martindale, M. Q. (2014). Initiating a regenerative response; cellular and molecular features of wound healing in the cnidarian Nematostella vectensis. BMC Biol. 12:24. doi: 10.1186/1741-7007-12-24
Forsman, Z. H., Page, C. A., Toonen, R. J., and Vaughan, D. (2015). Growing coral larger and faster: micro-colony-fusion as a strategy for accelerating coral cover. PeerJ 3:e1313. doi: 10.7717/peerj.1313
Frear, G. L., and Johnston, J. (1929). The solubility of calcium carbonate (calcite) in certain aqueous solutions at 25°. J. Am. Chem. Soc. 51, 2082–2093. doi: 10.1021/ja01382a014
Highsmith, R. C. (1982). Reproduction by fragmentation in corals. Mar. Ecol. Prog. Ser. 7, 207–226. doi: 10.3354/meps007207
Hobmayer, B., Rentzsch, F., Kuhn, K., Happel, C. M., von Laue, C. C., Snyder, P., et al. (2000). WNT signalling molecules act in axis formation in the diploblastic metazoan Hydra. Nature 407, 186–189. doi: 10.1038/35025063
Holstein, T. W., Hobmayer, E., and Technau, U. (2003). Cnidarians: an evolutionarily conserved model system for regeneration? Dev. Dyn. 226, 257–267. doi: 10.1002/dvdy.10227
Hughes, T., Barnes, M., Bellwood, D., Cinner, J. E., Cumming, G. S., JBC, J., et al. (2017). Coral reefs in the Anthropocene. Nature 546, 82–90. doi: 10.1038/nature22901
Johnston, H., Warner, J. F., Amiel, A. R., Nedoncelle, K., Carvalho, J. E., and Röttinger, E. (2021). Whole body regeneration deploys a rewired embryonic gene regulatory network logic bioRxiv 658930. doi: 10.1101/658930. [PREPRINT]
Kawakami, Y., Esteban, C. R., Raya, M., Kawakami, H., Martí, M., Dubova, I., et al. (2006). Wnt/β-catenin signaling regulates vertebrate limb regeneration. Genes Dev. 20, 3232–3237. doi: 10.1101/gad.1475106
Kovács, K. J. (2008). Measurement of immediate-early gene activation-c-fos and beyond. J. Neuroendocrinol. 20, 665–672. doi: 10.1111/j.1365-2826.2008.01734.x
Kumar, S., Stecher, G., and Tamura, K. (2016). MEGA7: molecular evolutionary genetics analysis version 7.0 for bigger datasets. Mol. Biol. Evol. 33, 1870–1874. doi: 10.1093/molbev/msw054
Kuno, K., and Matsushima, K. (1998). ADAMTS-1 protein anchors at the extracellular matrix through the thrombospondin type I motifs and its spacing region. J. Biol. Chem. 273, 13912–13917. doi: 10.1074/jbc.273.22.13912
Langmead, B., and Salzberg, S. L. (2012). Fast gapped-read alignment with bowtie 2. Nat. Methods 9, 357–359. doi: 10.1038/nmeth.1923
Larkin, M. A., Blackshields, G., Brown, N. P., Chenna, R., McGettigan, P. A., McWilliam, H., et al. (2007). Clustal W and Clustal X version 2.0. Bioinformatics 23, 2947–2948. doi: 10.1093/bioinformatics/btm404
Law, C. W., Alhamdoosh, M., Su, S., Dong, X., Tian, L., Smyth, G. K., et al. (2016). RNA-seq analysis is easy as 1-2-3 with limma, Glimma and edgeR. F1000 Fac. Rev. 5:141. doi: 10.12688/f1000research.9005.1
Li, B., and Dewey, C. N. (2011). RSEM: accurate transcript quantification from RNA-Seq data with or without a reference genome. BMC Bioinformatics 12:323. doi: 10.1186/1471-2105-12-323
Luz, B. L. P., Miller, D. J., and Kitahara, M. V. (2021). High regenerative capacity is a general feature within colonial dendrophylliid corals (Anthozoa, Scleractinia). J. Exp. Zool. B. Mol. Dev. Evol. 336, 281–292. doi: 10.1002/jez.b.23021
Maddaluno, L., Urwyler, C., and Werner, S. (2017). Fibroblast growth factors: key players in regeneration and tissue repair. Development 144, 4047–4060. doi: 10.1242/dev.152587
Minowada, G., Jarvis, L. A., Chi, C. L., Neubüser, A., Sun, X., Hacohen, N., et al. (1999). Vertebrate Sprouty genes are induced by FGF signaling and can cause chondrodysplasia when overexpressed. Development 126, 4465–4475. doi: 10.1242/dev.126.20.4465
Passamaneck, Y. J., and Martindale, M. Q. (2012). Cell proliferation is necessary for the regeneration of oral structures in the anthozoan cnidarian Nematostella vectensis. BMC Dev. Biol. 12:34. doi: 10.1186/1471-213X-12-34
Petersen, H. O., Höger, S. K., Looso, M., Lengfeld, T., Kuhn, A., Warnken, A., et al. (2015). A comprehensive transcriptomic and proteomic analysis of hydra head regeneration. Mol. Biol. Evol. 32, 1928–1947. doi: 10.1093/molbev/msv079
Quevillon, E., Silventoinen, V., Pillai, S., Harte, N., Mulder, N., Apweiler, R., et al. (2005). InterProScan: protein domains identifier. Nucleic Acids Res. 33, W116–W120. doi: 10.1093/nar/gki442
Rämet, M., Lanot, R., Zachary, D., and Manfruelli, P. (2002). JNK signaling pathway is required for efficient wound healing in Drosophila. Dev. Biol. 241, 145–156. doi: 10.1006/dbio.2001.0502
Reinhardt, B., Broun, M., Blitz, I. L., and Bode, H. R. (2004). HyBMP5-8b, a BMP5-8 orthologue, acts during axial patterning and tentacle formation in hydra. Dev. Biol. 267, 43–59. doi: 10.1016/j.ydbio.2003.10.031
Reyes-Bermudez, A., Lin, Z., Hayward, D. C., Miller, D. J., and Ball, E. E. (2009). Differential expression of three galaxin-related genes during settlement and metamorphosis in the scleractinian coral Acropora millepora. BMC Evol. Biol. 9:178. doi: 10.1186/1471-2148-9-178
Ritchie, M. E., Phipson, B., Wu, D., Hu, Y., Law, C. W., Shi, W., et al. (2015). Limma powers differential expression analyses for RNA-sequencing and microarray studies. Nucleic Acids Res. 43:e47. doi: 10.1093/nar/gkv007
Sabine, A. M., Smith, T. B., Williams, D. E., and Brandt, M. E. (2015). Environmental conditions influence tissue regeneration rates in scleractinian corals. Mar. Pollut. Bull. 95, 253–264. doi: 10.1016/j.marpolbul.2015.04.006
Saphier, A. D., and Hoffmann, T. C. (2005). Forecasting models to quantify three anthropogenic stresses on coral reefs from marine recreation: anchor damage, diver contact and copper emission from antifouling paint. Mar. Pollut. Bull. 51, 590–598. doi: 10.1016/j.marpolbul.2005.02.033
Schaffer, A. A., Bazarsky, M., Levy, K., Chalifa-Caspi, V., and Gat, U. (2016). A transcriptional time-course analysis of oral vs. aboral whole-body regeneration in the sea anemone Nematostella vectensis. BMC Genomics 17:718. doi: 10.1186/s12864-016-3027-1
Schmidt-Roach, S., Duarte, C. M., Hauser, C. A. E., and Aranda, M. (2020). Beyond reef restoration: next-generation techniques for coral gardening, landscaping, and outreach. Front. Mar. Sci. 7:672. doi: 10.3389/fmars.2020.00672
Shinzato, C., Shoguchi, E., Kawashima, T., Hamada, M., Hisata, K., Tanaka, M., et al. (2011). Using the Acropora digitifera genome to understand coral responses to environmental change. Nature 476, 320–323. doi: 10.1038/nature10249
Sinigaglia, C., Almazán, A., Lebel, M., Sémon, M., Gillet, B., Hughes, S., et al. (2022). Distinct gene expression dynamics in developing and regenerating crustacean limbs. Proc. Natl. Acad. Sci. U. S. A. 119:e2119297119. doi: 10.1073/pnas.2119297119
Soubigou, A., Ross, E. G., Touhami, Y., Chrismas, N., and Modepalli, V. (2020). Regeneration in the sponge Sycon ciliatum partly mimics postlarval development. Development 147:dev193714. doi: 10.1242/dev.193714
Stewart, Z. K., Pavasovic, A., Hock, D. H., and Prentis, P. J. (2017). Transcriptomic investigation of wound healing and regeneration in the cnidarian Calliactis polypus. Sci. Rep. 7:41458. doi: 10.1038/srep41458
Vervoort, M. (2011). Regeneration and development in animals. Biol. Theory 6, 25–35. doi: 10.1007/s13752-011-0005-3
Vogg, M. C., Galliot, B., and Tsiairis, C. D. (2019). Model systems for regeneration: Hydra. Development 146. doi: 10.1242/dev.177212
Warner, J. F., Guerlais, V., Amiel, A. R., Johnston, H., Nedoncelle, K., and Röttinger, E. (2018). NvERTx: a gene expression database to compare embryogenesis and regeneration in the sea anemone Nematostella vectensis. Development 145:dev162867. doi: 10.1242/dev.162867
Keywords: coral, regeneration, wound healing, FGF signalling pathway, Wnt signalling pathway, Fos
Citation: Xu J, Mead O, Moya A, Caglar C, Miller DJ, Adamski M and Adamska M (2023) Wound healing and regeneration in the reef building coral Acropora millepora. Front. Ecol. Evol. 10:979278. doi: 10.3389/fevo.2022.979278
Edited by:
Igor Schneider, Federal University of Pará, BrazilReviewed by:
Chiara Sinigaglia, UMR7232 Biologie Intégrative des Organismes Marins (BIOM), FranceLucas Leclere, UMR7009 Laboratoire de Biologie du Développement de Villefranche sur Mer, France
Copyright © 2023 Xu, Mead, Moya, Caglar, Miller, Adamski and Adamska. This is an open-access article distributed under the terms of the Creative Commons Attribution License (CC BY). The use, distribution or reproduction in other forums is permitted, provided the original author(s) and the copyright owner(s) are credited and that the original publication in this journal is cited, in accordance with accepted academic practice. No use, distribution or reproduction is permitted which does not comply with these terms.
*Correspondence: Marcin Adamski, ✉ marcin.adamski@anu.edu.au; Maja Adamska, ✉ maja.adamska@anu.edu.au
†Present addresses: Oliver Mead, CSIRO, Land and Water, Canberra, ACT, Australia
Aurelie Moya, Limnological Institute, University of Konstanz, Konstanz, Germany