Vulnerability and risk assessment mapping of Bhitarkanika national park, Odisha, India using machine-based embedded decision support system
 Shantakar Mohanty
 Sk. Mustak
 Dharmaveer Singh
 Thanh Van Hoang3
 - 1Department of Geography, Central University of Punjab, Bathinda, Punjab, India
- 2Symbiosis Institute of Geo-informatics, Symbiosis International University, Pune, Maharashtra
- 3College of Construction and Development, Feng Chia University, Taichung, Taiwan
- 4Department of Geography, Midnapore College (Autonomous), Midnapore, West Bengal
- 5Ph.D program of Infrastructure Planning and Engineering, College of Construction and Development, Feng Chia University, Taichung, Taiwan
The vulnerability and flood risk assessment of Bhitarkanika National Park in Odisha, India, was conducted using a data-driven approach and a machine-based embedded decision support system. The park, located in the estuaries of the Brahmani, Baitarani, Dharma, and Mahanadi river systems, is home to India’s second-largest mangrove environment and the world’s most active and diverse saline wetland. To evaluate its vulnerability and risk, various threats were considered, with a focus on floods. Satellite imageries, such as Landsat 8 OLI, SRTM digital elevation model, open street map, Google pro image, reference map, field survey, and other ancillary data, were utilized to develop vulnerability and risk indicators. These indicators were then reclassified into ‘Cost’ and ‘Benefit’ categories for better understanding. The factors were standardized using the max-min standardization method before being fed into the vulnerability and risk model. Initially, an analytical hierarchy approach was used to develop the model, which was later compared with machine learning algorithms (e.g., SVM) and uncertainty analysis indices (e.g., overall accuracy, kappa, map quality, etc.). The results showed that the SVM-RBF machine learning algorithm outperformed the traditional geostatistical model (AHP), with an overall accuracy of 99.54% for flood risk mapping compared to AHP’s 91.12%. The final output reveals that a large area of Bhitarkanika National park falls under high flood risk zone. The Eastern coastal regions of Govindapur, Kanhupur, Chinchri, Gobardhanpur and Barunei fall under high risk zone of tidal floods, The Northern and western regions of Ramachandrapur, Jaganathpur, Kamalpur, Subarnapur, Paramanandapur, etc., Fall under high risk region of riverine floods. The study also revealed that the areas covered with mangroves have a higher elevation and hence are repellent to any kind of flood. In the event of a flood high priority conservation measures should be taken along all high flood risk areas. This study is helpful for decision-making and carrying out programs for the conservation of natural resources and flood management in the national park and reserve forest for ecological sustainability to support sustainable development goals (e.g., SDGs-14, 15).
1 Introduction
In countries with subtropical climates like India, flash floods are a common occurrence, especially during the monsoon season. This particular sort of flood happens quickly, setting it apart from other natural disasters that result in significant economic loss and human casualties (Ruidas et al., 2022). National Parks play a vital role in conserving the world’s biodiversity, food security, and human health (Fernández and Lutz, 2010; Li et al., 2012; Heidari, 2014; Wang et al., 2019). The values of National Parks range from protecting natural habitats and associated flora and fauna to maintaining the environmental stability of its surrounding regions (Taylor et al., 2011; Dawod et al., 2012; Schumann et al., 2018; Yadollahie, 2019; Ullah and Zhang, 2020). The vulnerability assessment has been one of the most discussed topics in recent eras for the physical, biological, and social systems(Ouma and Tateishi, 2014; Pourali et al., 2016; Bandi et al., 2019; Langlentombi and Kumar, 2021). The vulnerability of a system can be defined as the susceptibility to disturbances determined by exposure to perturbations, sensitivity to concerns, and the capacity to adapt (Nelson et al., 2010). Bhitarkanika National Park is a Ramsar site with India’s second-largest mangrove forest. It is known for its mangroves, migratory birds, turtles, estuarine crocodiles, and innumerable creeks and is one of Odisha’s best biodiversity hotspots. This unique habitat consists of 62 mangrove species, 28 species of mammals, 280 species of birds, and 47 species of amphibians and reptiles. It also includes the largest population of saltwater crocodiles in India(Khan et al., 2020).
Excess water allocation for industries has become a significant cause of concern for Bhitarkanika national park. This extra allocation reduces freshwater discharge to the sea (Hallegatte et al., 2013). The lack of normal freshwater flow in the area has led to increased saline ingression upstream, negatively impacting the local flora, fauna, and the livelihoods of fishermen and farmers who depend on the Brahmani river. Additionally, the region faces recurring challenges such as floods, forest fires, and overfishing. Overfishing, in particular, creates a food shortage for estuarine crocodiles and other species in the area. The reduction in water discharge also has a direct impact on the mangroves, which in turn affects the Gahirmatha marine sanctuary within the national park. The increased water salinity may prompt saltwater crocodiles to migrate from the core sanctuary area to upstream regions, leading to conflicts between humans and animals and causing disruptions for local residents.
According to the Census data, in 1991, there were 311 villages with a population of 118,951 inhabitants in the area. However, by 2011, the number of villages had increased to 312, with a population of 145,320. The total area covered by these villages was 672 square kilometers, resulting in a population density of 216 people per square kilometre. This level of population density is relatively high for a National Park. The flood hazards not only impact the ecosystem and natural landscape of the area but also have adverse effects on human settlements and their occupations (Dewan et al., 2007; Hallegatte et al., 2013; Stefanidis and Stathis, 2013; Rahmati et al., 2016; Farhadi and Najafzadeh, 2021; Parsian et al., 2021; SAMI et al., 2021). The delicate ecosystem is under extreme pressure because of the population increase.
Bhitarkanika National Park is situated between the Brahmani and Baitarani rivers, which experience annual flooding due to heavy rainfall in the area and the discharge of floodwater from the Rengali Dam. Being located on the east coast of Odisha, the park is highly susceptible to cyclones, which result in storm surges and subsequent flooding of the shorelines. During Cyclone Yaas in 2021, coastal fishing villages in BNP were severely affected by tidal floods caused by storm surges, resulting in significant damage to houses. The majority of the population in the area relies on fishing, agriculture, and apiculture for their livelihoods. Fishing communities have settled near riverbanks and congregated in fishing villages along the coast, putting themselves at immediate risk during flooding events.
It is not only the human population that is affected by these calamities; the wildlife in the area is also impacted. The estuaries in the main mangrove area of BNP are home to approximately 1,700 estuarine crocodiles. During floods, their feeding grounds become submerged, leading them to migrate outside the estuaries and into river channels that pass through nearby villages. This migration poses a significant risk to both the crocodiles and the villagers.
Given the exponential increase in the number of flash flood events, identifying flood-prone areas has become a top priority. Mapping flash flood susceptibility can help mitigate the worst impacts of such risk phenomena. Therefore, there is an urgent need to develop accurate models for predicting flood susceptibility, which can aid in the creation of more effective flood management measures (Ruidas et al., 2022).
The main objective of this study is to compare traditional decision support models like AHP with machine learning algorithms for flood vulnerability and risk assessment in the Bhitarkanika National park. This study studied data-driven approaches (e.g., Sentinel 2A Multispectral, SRTM digital elevation model, open street map, Google Pro image, reference map, field survey, and other ancillary data and machine-based data approaches. The study is divided into seven sections, e.g., introduction, study area, datasets and software, methods, results and discussion, conclusion and recommendation, and references.
2 Selection of the study area
The Bhitarkanika National Park is situated between 86°46′to 87°01′East longitude and 20° 30′to 20° 48′North latitude in Brahmani and Baitarani deltaic region of the district of Kendrapara, Odisha, in the east coast of India (Figure 1). This area has been declared a proposed sanctuary since 1975 because of its ecological, faunal, floral, geomorphologic and biological association and importance. On its eastern side lies the Bay of Bengal; to its north is the river Dhamara; to its west is the land mass of Kendrapada District and to its south lies the Mahanadi river.
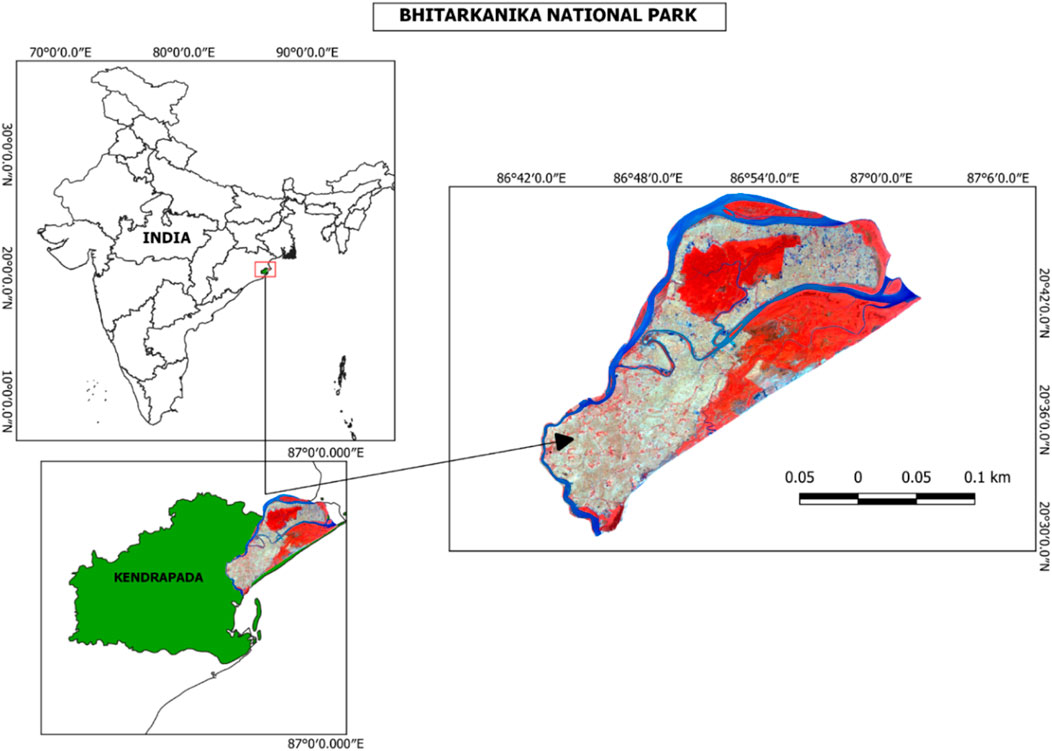
FIGURE 1. Study area map.
The rich alluvial deposits and gently sloping topography of Bhitarkanika support rich flora and fauna and are well known for their ecological and biological diversity. Mangroves cover a core area of 145 sq. km. This core area was declared a National Park in 1998 (Kumar et al., 2015). In 2002, Bhitarkanika was designated as a “Ramsar site,” recognizing its status as a Wetland of International Importance due to its abundant biodiversity and ecological significance. The park can be accessed via two entry points: Rajnagar and Chandbali. Rajnagar is approximately 130 km away from the state capital, Bhubaneswar, while Chandbali is about 150 km away. Bhubaneswar is well-connected by rail and air to other cities in India, making it convenient for visitors to reach Bhitarkanika National Park.
3 Methodology
3.1 Datasets and software
In this study, Landsat TM5 and Landsat8 OLI satellite data were obtained from Google Earth Engine using JavaScript codes. The Shuttle Radar Topography Mission (SRTM) Void filled Digital Elevation Model was obtained from the USGS Earth Explorer portal (Table 1). Digital Elevation Model (DEM) is the digital representation of the land surface elevation and hydro-geomorphic parameters with respect to any reference datum widely used in flood disaster and risk modeling (Li et al., 2012; Stefanidis and Stathis, 2013; Balasubramanian, 2017; Ullah and Zhang, 2020). The SRTM DEM of the year 2000 was used for generating various flood vulnerability and risk indicators like elevation, slope, and water depth, etc., and further processing these to form the vulnerability and risk map (Ouma and Tateishi, 2014; Pourali et al., 2016; Rahmati et al., 2016; Schumann et al., 2018; Bandi et al., 2019; Zhang et al., 2019). In addition, google earth image, open street map, and field survey (2022) were used to assess the models accurately.
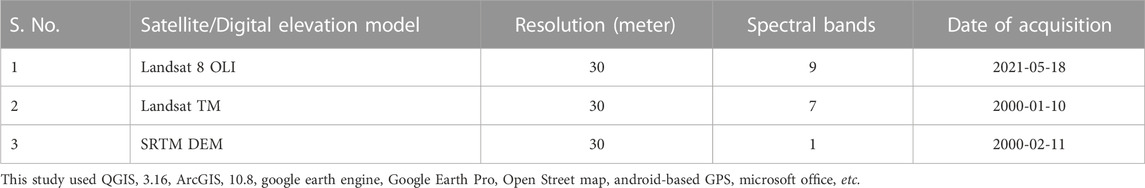
TABLE 1. Datasets used.
3.2 Methods
The following methods were employed to achieve the main objective of this study (Figure 2). The main objective of this study is to compare traditional decision support models like AHP with the machine learning algorithm for flood vulnerability and risk assessment in the Bhitarkanika National Park (BNP). The methods are explained below as follows.
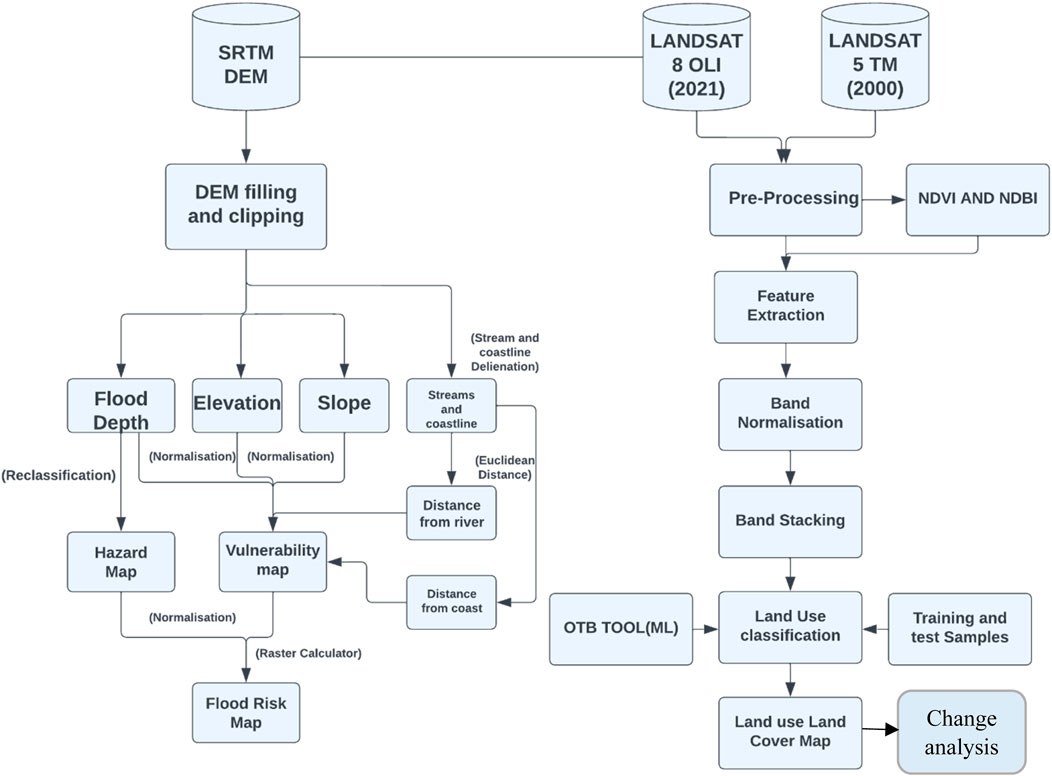
FIGURE 2. Methodology flowchart.
3.2.1 Background of machine learning algorithms
Machine Learning Algorithms like SVM, RF, Decision Tree, etc., have turned out to be efficient methods for research in today’s date due to their impeccable accuracy and reliability. Support Vector Machine (SVM) is a type of supervised machine learning that can effectively identify intricate patterns in noisy and complex datasets, and due to their simplicity and adaptability, they can achieve balanced predictive accuracy even in situations where there are limited samples (Hongmao, 2016). Random Forests (RF) improve prediction accuracy and efficiency by randomly selecting features for each decision split, reducing correlation between trees, and increasing the diversity of the model(Breiman, 2001). Decision Tree (DT) is an inductive algorithm used for classification and prediction, where classification rules are represented as decision trees derived from a set of disorderly and irregular instances, and the tree is constructed in a top-down recursive manner by comparing attributes between internal nodes and making decisions based on different attributes, ultimately leading to a conclusion at the leaf nodes (Dai et al., 2016). The significant advancements in machine learning and artificial intelligence, including logistic regression, decision trees, artificial neural networks, random forests, and support vector machines, have gained immense importance due to their ability to handle large datasets and deliver high levels of accuracy (Ruidas et al., 2021).
Several researchers have used ML algorithms to create remarkable research projects in variety of sectors such as (Ruidas et al., 2022) in Hydrogeochemical Evaluation of Groundwater Aquifers (Ruidas et al., 2022), in water resources vulnerability assessment (Ruidas et al., 2022), in flood-susceptibility assessment (Ruidas et al., 2021), in Characterization of groundwater potential zones (Jaydhar et al., 2022), in Hydrogeochemical evaluation and health risk from arsenic and fluoride, etc.
The use of ML algorithms in disaster prediction, Vulnerability and risk assessment, mitigation has become a sought-after procedure in the current scenario and this research has used the same to generate comprehensive risk and vulnerability zones of the fragile Bhitarkanika National Park region. Pham et al. (2019) in their research used hybrid machine learning models, including bagging (BA), random subspace (RS), and rotation forest (RF), with alternating decision tree (ADTree) as base classifier for the spatial prediction of Landslides (Parvin et al., 2022). in their study used 3 ML models, namely, Bayesian logistic regression (BLR), the artificial neural networks (ANN), and the deep learning neural networks (DLNNs) for flood vulnerability assessment in a densely urbanized city. Opella and Hernandez (2019) in their study generated flood susceptibility and probability map using SVM and obtained a robust flood map that clearly outperforms the traditional methods. Xiong et al. (2019) in their study adopted SVM model for flash flood vulnerability assessment and mapping in China.This study uses the SVM-RBF model to generate a robust vulnerability and risk Map of the Bhitarkanika National Park region taking in view previous studies, which have used the same model for its impeccable accuracy. The map generated using SVM-RBF exhibits an accuracy of 99.54% with a complementing Kappa Index of 99.18% compared to the 91.12% accuracy using traditional AHP, thus solidifying the SVM-RBF model as a formidable classification ML classification.
3.2.2 Pre-processing
Pre-processing of data, such as satellite imagery and digital elevation models (DEM), is crucial for the processing, analysis, and modeling in this study. In order to map the land use and land cover (LULC) of Bhitarkanika National Park, satellite imagery underwent pre-processing steps including band stacking, clipping, mosaicking, and normalization using the min-max scaler. These pre-processing tasks were performed using QGIS. Similarly, the SRTM DEM was pre-processed using both ArcGIS and QGIS. The DEM was initially clipped to the study area by applying a mask. Auto co-registration and filling techniques were then employed using the hydrology toolbox in ArcGIS and QGIS to ensure alignment with the LULC data and to address sinkholes, which are often not captured by satellites. The DEM was further reclassified to generate an elevation map, and the slope was calculated using the Arc Toolbox.
These pre-processing steps were undertaken to ensure the data was appropriately prepared for subsequent analysis and modeling in the study.
3.2.3 Land use/land cover classification
Land use and land cover change have become central to current strategies for managing natural resources and monitoring environmental changes(Kaul and Sopan, 2012). The standard land use and land cover (LULC) classes (Table 2) were selected based on the literature review and local LULC classification scheme. Based on the previous literature it was observed that uniform LULC classification scheme is missing in disaster study (Hao et al., 2022). Landsat 8 Operational Land Imager (OLI) and Landsat 5 Thematic Mapper (TM) images of 2021 and 2000, respectively, with cloud cover of less than 2%, were obtained from the google earth engine using JavaScript codes. Further processing was done in QGIS, including feature extraction(e.g., NDVI, NDBI, etc.), classification, post-processing, accuracy assessment, and change analysis.
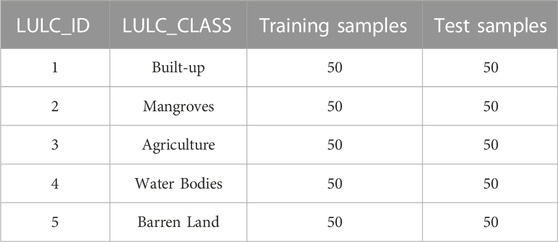
TABLE 2. Training and test samples.
The Normalized difference Vegetation Index (NDVI) is widely used in classifying land use/cover which was calculated using following formula (Ruidas et al., 2021):
The value of the NDVI varies in between +1 and −1. NDVI is equal to +1 shows healthy vegetation while −1 shows waterbodies. In addition, Normalized Difference Built-up Index provide vivid information of the built-up which was calculated using following formula (He et al., 2010).
Higher the value of NDVI shows more the built-up information which lower values shows vegetation and other land use classes.
Table 2 shows the training and test samples used for the training and validation of the classification model.
There are various types of classifiers in machine learning (ML). This study uses the SVM classifier with Radial Basis Function (SVM-RBF) via the OTB toolbox to generate LULC maps and the flood risk map (Deroliya et al., 2022). This is because machine learning algorithms outperform any complex decision-making compared to other traditional algorithms(Farhadi and Najafzadeh, 2021; Deroliya et al., 2022). This study selected SVM-RBF because this algorithm is robust for complex problems compared to the other machine learning algorithms such as Random Forest, Decision Tree, etc (Ruidas et al., 2021; Ruidas et al., 2022). Two LULC maps (e.g., 2021 and 2000) were generated using the image classifier function in the OTB tool. The accuracy assessment of all the maps generated using ML was done by computing their confusion matrix using the OTB tool. Change detection analysis, one of the import approaches, is incorporated with the flood risk analysis (Gharagozlou et al., 2011; Lawal et al., 2014) carried out between the 2000 and 2021 LULC maps using the post-processing algorithm and Raster Unique Values Report function in QGIS.
3.2.4 Flood depth calculation
When floods hit inhabited areas, significant losses are usually registered in terms of both impacts on people (i.e., fatalities and injuries) and economic impacts on urban areas, commercial and productive sites, infrastructures, and agriculture. To properly assess these, several parameters are needed, among which flood depth is one of the most important as it governs the models used to compute damages in economic terms(Cian et al., 2018). In this study, the Raster calculator was used in ArcGIS to analyze flood/water depth manually. The inundation depth is estimated to be 2.5 m through multiple literature reviews and field surveys. Based on the last 20 years’ flood inundation information, the binary mask was created as one and none flooded area as zero.
The result gave the elevation values of DEM for areas, which are flooded, and zeros for non-flooded areas. Consequently, the highest elevation value represents the water table.
The resultant raster thus obtained represents the Water/Flood depth of the study area.
3.2.5 Euclidean distance from the coast and river
The shortest straight-line distance connects all sites or the Euclidean distance (Zhang, 2019). Geoprocessing analysis is performed to fill sinks (pits) and to generate data on flow direction, flow accumulation, catchments, streams, stream segments, and watersheds. These data are then used to develop a vector representation of catchments and drainage lines from selected points that can then be used in network analysis (Soni, 2012). To calculate the Euclidean distance from the river, the process begins with stream delineation using the hydrology toolbox in ArcGIS. This involves using the fill tool followed by the flow direction tool, which determines the downslope direction of each cell and helps identify the flow paths of the streams. The flow accumulation tool is then applied to estimate cumulative flow, representing the total weight of cells flowing into each downslope cell. By setting a threshold value, the number of streams included in the final layer can be controlled. Lower threshold values result in more streams, while higher values reduce the number of streams.
Once the streams are delineated, the Euclidean distance tool is used to calculate the distance from the stream. Similarly, the coastline of BNP is manually digitized, and the Euclidean distance tool is applied to determine the distance from the coast. These steps enable the calculation of the Euclidean distance from both the river and the coastline, providing valuable information for further analysis and modeling in the study.
3.2.6 Flood hazard mapping
The goal of flood hazard assessment is to understand the probability that a flood of a particular intensity will occur over an extended period of time. Hazard assessment aims to estimate this probability over periods of years to decades to support risk management activities(Wright, 2015). Intensity is typically defined as the sum of flood depth and horizontal flood extent. However, depending on the circumstance, other intensity parameters like flow velocity and flood duration may also be significant (Stefanidis and Stathis, 2013; Farhadi and Najafzadeh, 2021; Deroliya et al., 2022). Hydrological models like water depth and other factors like frequency and area of Impact were used to estimate the flood hazard.
Where, HS = Hazard Score FS = Frequency Score AIS = Area of Impact Score IS = Intensity Score
3.2.7 Vulnerability mapping
Aside from flood danger, another critical factor in flood risk is flood vulnerability. Understanding a system’s vulnerability will help you predict how floods may damage it. Examples of potential systems include physical structures like homes or bridges that might sustain damage or destruction, a company or service whose supply chain might be disrupted, or a community that might experience fatalities, property losses, and detrimental health effects following a flood(Wright, 2015). Various indicators are used to estimate the vulnerability of BNP. The indicators used are elevation, slope, water depth, distance from the coast, and distance from the river (Stefanidis and Stathis, 2013; Farhadi and Najafzadeh, 2021). The indicators have been reclassified into ‘Cost’ and ‘Benefit’ to better understand the assessment (Table 3).

TABLE 3. Indicators.
Further, all the cost and benefits indicators are normalised, and the AHP model was applied to achieve flood vulnerability of BNP using formula 6-7 in the raster calculator tool in ArcGIS.
1. Normalisation
The practice of making specific data that are separated by time periods identical, such as atmospheric correction or pixel resampling, so that an acceptable change may be observed without being impacted by other factors is referred to as normalisation.
Cost indicator:
Benefit Indicator:
2. Analytic Hierarchy Process- Weight Overlay Analysis
Analytic Hierarchy Process (AHP) is a robust multi-criteria decision-making (MCDM) was used to achieve the weight of the factors for the overall decision-making (Ouma and Tateishi, 2014; Rahmati et al., 2016; Kumar et al., 2021; Parsian et al., 2021). This model is widely used in raster-based GIS overlay analysis in several applications such as land suitability analysis, flood risk and vulnerability analysis, zoning, and site suitability analysis (Mustak et al., 2018). In AHP, the following sub-processes were employed to derive the weight of the indicators (Stefanidis and Stathis, 2013), e.g., 1) selection of indicators and arrange in the square-matrix, 2) indicators were compared, and relative importance given based on the Saaty’s nine-point scale of absolute number, 3) normalized weight of the individual indicator was derived using the geometric mean method (Table 4). The weighted overlay analysis is one of the most used methods to address multi-criteria issues like site selection, land suitability analysis, and assessing model appropriateness (Kumar et al., 2021).
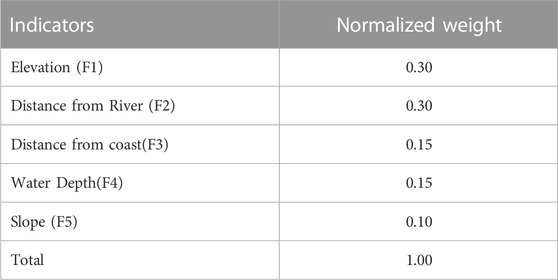
TABLE 4. Normalised weight.
The sum of the normalized weight is 1. After the calculation of weights, raster calculator was used to derive the final vulnerability index VI), which varies from 0 to 1 using the following Formula 6. The VI, equal to 0, shows low vulnerability, while 1 shows high vulnerability.
The final output raster is symbolised using the quartile method, and the resultant raster is the vulnerability map.
3.2.8 Flood risk mapping
The most common approach to define flood risk is that it is the product of hazard, i.e., the physical and statistical aspects of the actual flooding (e.g., the return period of the flood, extent, and depth of inundation, and flow velocity), and the vulnerability, i.e., the exposure of people and assets to floods and the susceptibility of the elements at risk to suffer from flood damage(Serda et al., 2002). After calculating the Flood Hazard and flood vulnerability, it becomes relatively simpler to calculate the Flood Risk.
The hazard and vulnerability maps produced before are normalised first and then multiplied using the raster calculator tool. The resultant raster gives us the flood risk map of BNP, which is further classified into High, Medium, and low based on the corresponding intensity value.
4 Results and discussions
4.1 Land use land cover
The below figures show the Land Use Land Cover of BNP in 2000 and 2021, respectively. A stark difference can be seen in the LULC maps of 2000 and 2021. The difference is explained in detail in Figure 3 and Table 5.
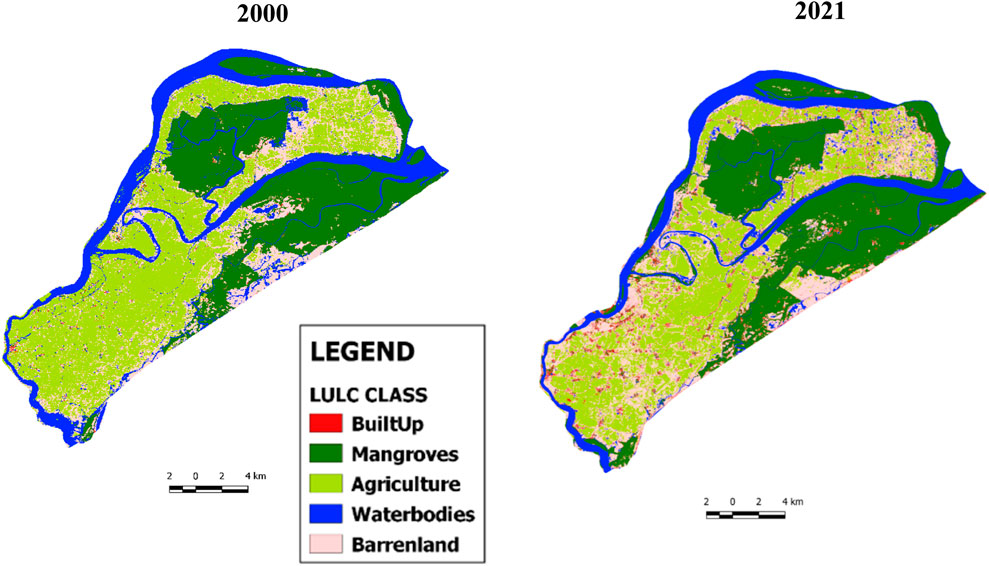
FIGURE 3. LULC maps, 2000 and 2021.
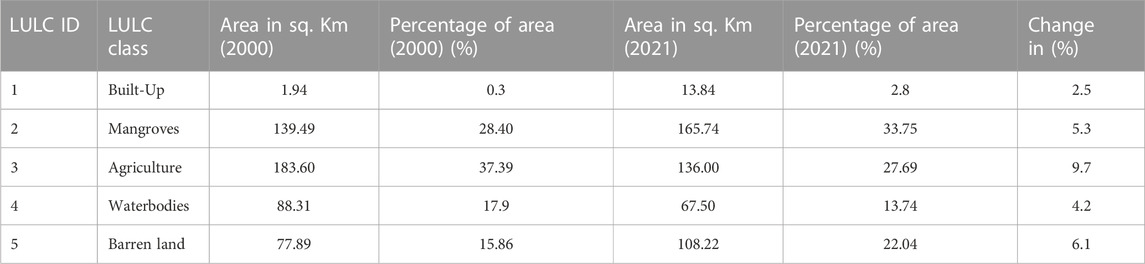
TABLE 5. LULC statistics.
Over the years, significant changes have been observed in the areal extent of various classes. The built-up area has experienced exponential growth, expanding from 1.94 Sq. km in 2000 to nearly 14 Sq. km in 2021. This alarming trend highlights the encroachment of human settlements and related activities into this biosphere reserve. The increase in built-up areas not only signifies a rise in population but also amplifies the vulnerability to floods by intensifying the hazard factor. However, it is worth noting that the area covered by mangroves has seen a positive development, expanding by 26.25 Sq. km. This growth can be attributed to the conservation efforts of the Government of Odisha, as well as the active involvement of local forest dwellers and naturalists.
The area under agriculture has significantly decreased due to salinity ingress, leading to an increase in barren land. This decline in agricultural activities is a result of the rapid growth of aquaculture activities in BNP and salinity ingress. The number of aquaculture ponds in BNP has been increasing at an alarming rate. The maps above illustrate the significant expansion of aquaculture ponds in just 20 years, primarily concentrated in the north-eastern areas of the national park. Interestingly, as the number of artificial aquaculture ponds has risen, the area covered by water bodies has decreased by approximately 20 sq. km. This reduction is attributed to the drying up of estuaries on the eastern coast near the Gahirmatha Marine Sanctuary, which can be attributed to anthropogenic activities and climate change.
4.2 Cost indicators
4.2.1 Flood/water depth
As observed from the resultant map, a substantial area of BNP has a water depth of 0 m constituting to 383.92 sq. km and 78% of the total area (Figure 4). This area represents minimal flood hazard. An area of 47 sq. km or 9.5% of the total area has a water depth of 1 m representing low flood hazard. A water depth of 1.5 m is observed across 5.18 sq. km or 1.05% of the area representing a medium flood hazard. The Brahmani and Dharma river systems, as well as the areas of Ramchandrapur, Jagannathpur, Padmanavpur, Narayanpur, Saradaprasad, Paramanandpur, and Mohanpur, exhibit a water depth of more than 2.5 m covering an area of 55.14 sq. km or 11.23% of the total area (Table 6). These areas are most prone to flooding and have a high flood hazard.
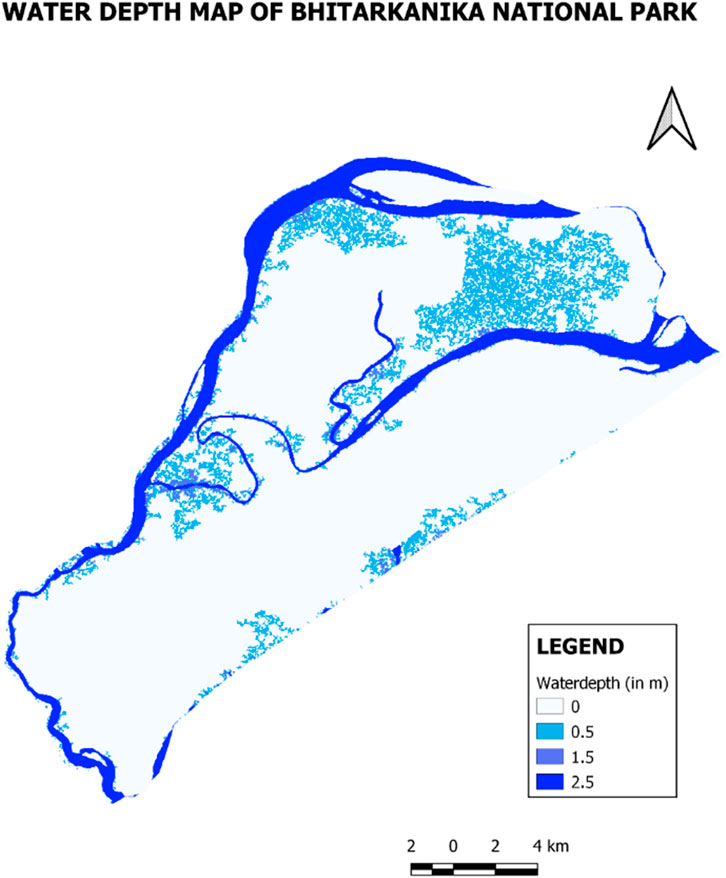
FIGURE 4. Water/flood depth map.
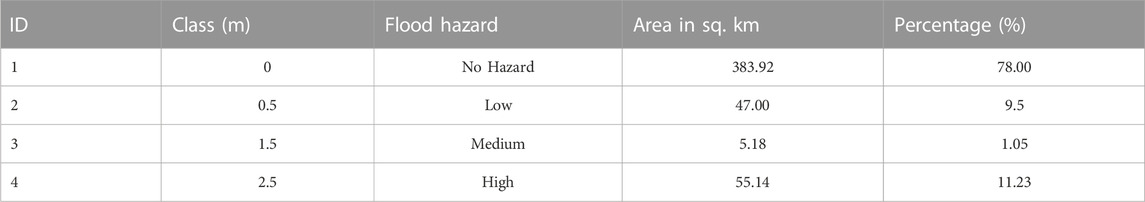
TABLE 6. Water depth statistics.
4.3 Benefit indicators
4.3.1 Elevation
BNP has a maximum elevation of 23 m. The lower the elevation higher is the risk of getting affected by flood and vice versa. As observed in the elevation map, all the areas under mangrove vegetation have a medium to high elevation, which makes these areas resilient to flooding (Figure 5; Table 7). The areas surrounding the mangroves and the riverbanks subsequently have lower elevations. The areas near the coast also have a lower elevation, excluding those covered by mangroves.
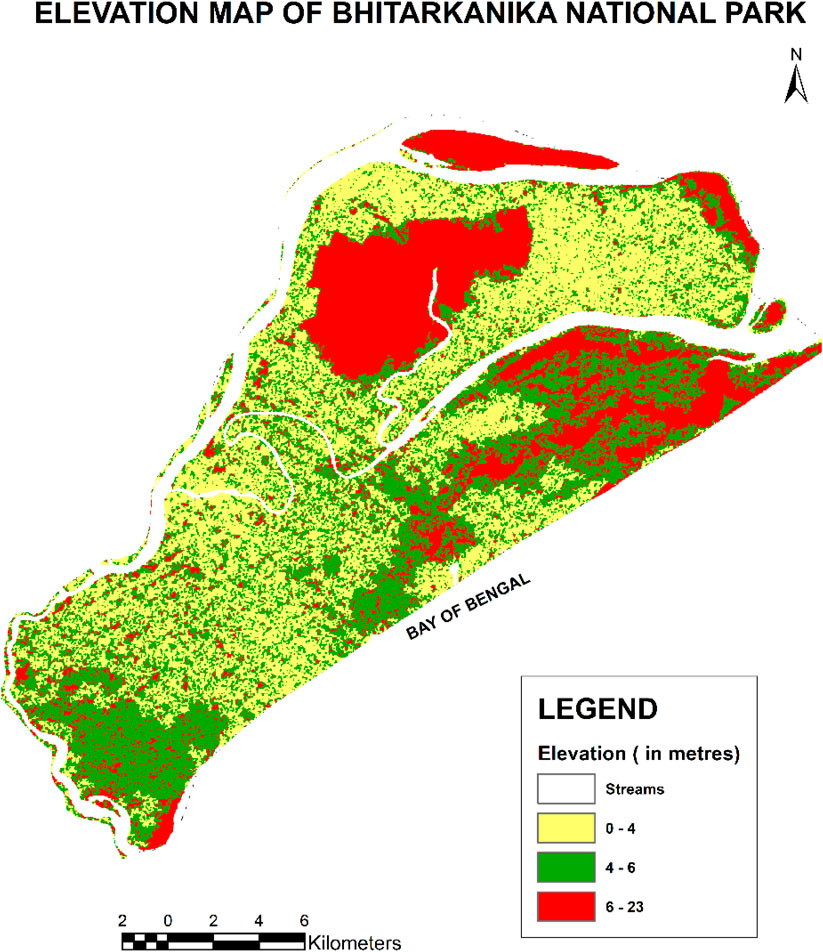
FIGURE 5. Elevation Map.
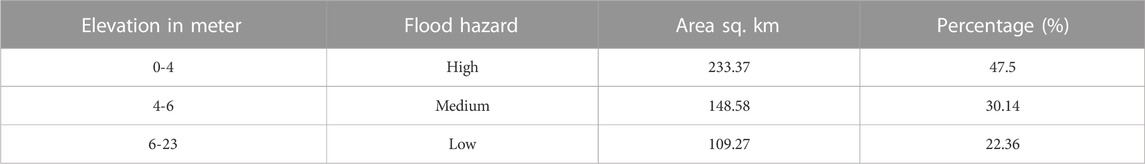
TABLE 7. Elevation statistics.
4.3.2 Slope
The slope is the most crucial aspect of hydrology since it directly affects surface runoff and floods. Since low-elevation locations often have a gentle or low-level slope (0-1.39 m), they are more susceptible to flooding and waterlogging because steep slopes generate more incredible velocity than flat or gentle slopes and may dispose of runoff more quickly. Runoff from a level or gently sloping land is collected and released gradually. In contrast to high-gradient slopes, low-gradient slopes at lower reaches are more susceptible to flooding (Ramesh and Iqbal, 2022).
The BNP area has varied slope values and is unevenly distributed (Figure 6; Table 8). A large area of the national park appears to have low-medium slope values (1.39-2.09°). High slope values (2.09-19.72 m) appear to be scarce and scattered.
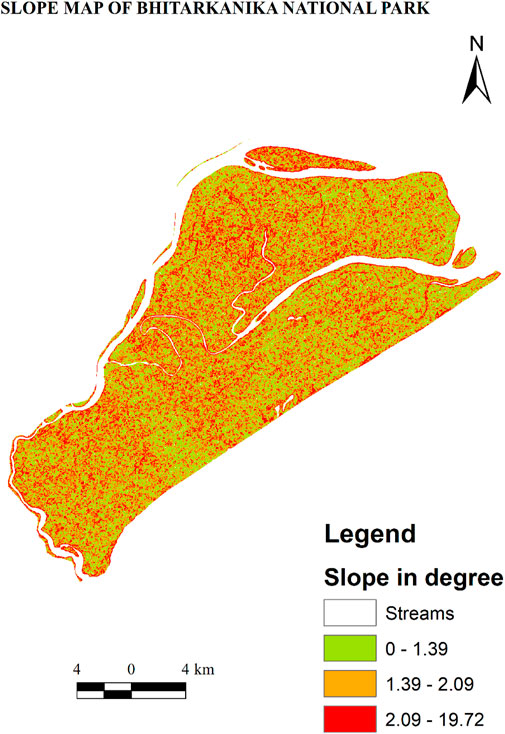
FIGURE 6. Slope Map.
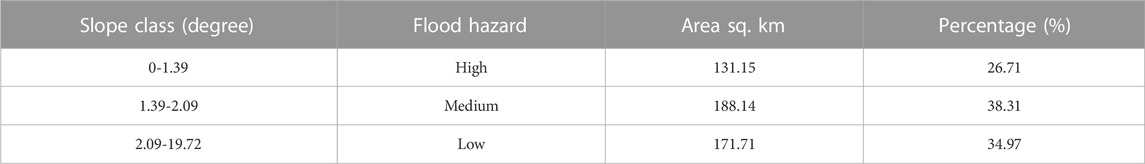
TABLE 8. Slope statistics.
4.3.3 Distance from the river
The result was obtained using the Euclidean distance tool in ArcGIS. The BNP area is bordered by three rivers: Brahmani, Baitarani, and Dharma. The Dharma River is formed at the confluence of the Brahmani and Baitarani Rivers. The Brahmani River covers a significant portion of the riverine area within BNP. It both surrounds and cuts through the national park, eventually flowing into the Bay of Bengal. As a result, many areas in BNP are located near the riverbanks and are susceptible to flooding. The geography of BNP is characterized by its surrounded by rivers and the ocean on all sides.
.The map produced is classified into three classes: High Proximity (<956.4 m), Medium Proximity (956.40-2646.30 m), and Low Proximity (>2646.30 m) (Figure 7; Table 9). The map displays the surrounding areas of Praharajpur, Gobardhanpur, Raj Nagar, Ramchandrapur, Govindpur, Subarnapur, as well as the central villages of Balabhdrapur, Purushottampur, Gupti, Padmanavpur, Jaganaathpur, and others. These areas are situated along the riverbanks of the Brahmani and Dharma rivers, making them highly proximate to these water bodies.
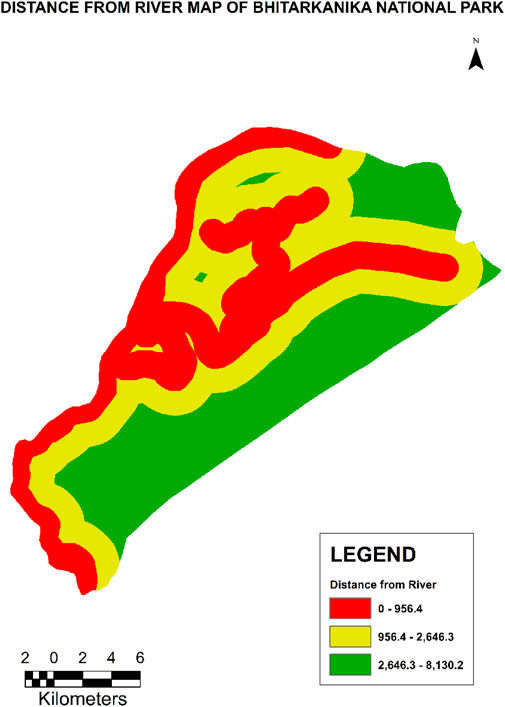
FIGURE 7. Distance from river.
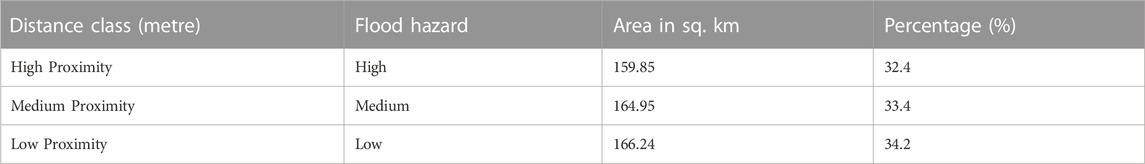
TABLE 9. Distance from the river statistics.
4.3.4 Distance from the coast
The Bay of Bengal lines the whole eastern area of BNP. This Proximity to the sea makes the coastal areas of BNP extremely vulnerable to tidal floods, especially during storm surges and tsunamis. Added to that, the Bay of Bengal is very prone to cyclones. The Gahirmatha Marine Sanctuary is shielded from such degradation due to the presence of mangroves. The map produced is classified into three classes: High Proximity (<4418.60 m), Medium Proximity(4418.60-8764.90 m), and Low Proximity (>8764.90 m). The coastal areas of Paramanandapur, Karanjia, Kanhupur, Gupti, Barunei, Satabhaya, Pentha, Jamboo, Batighar, Suniti, Kansarbadadandua, Ramanagar, and Baulakani all fall under the high proximity class and are highly vulnerable to tidal floods (Figure 8; Table 10).
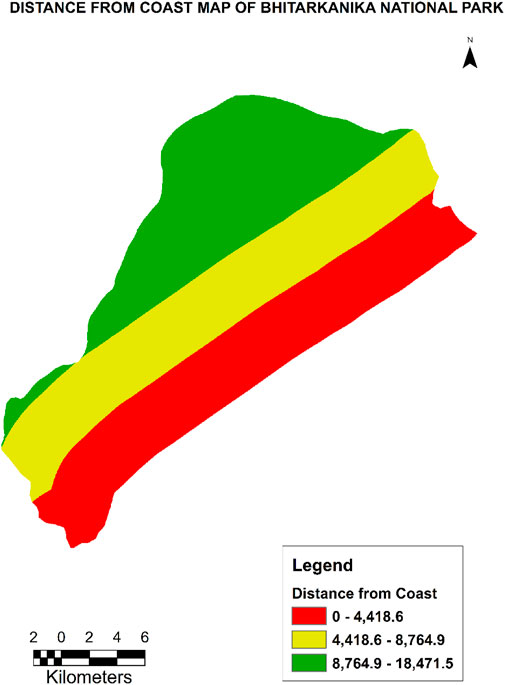
FIGURE 8. Distance from coast.
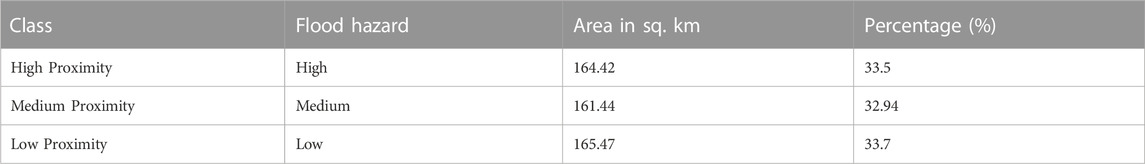
TABLE 10. Distance from the coast statistics.
4.4 Flood hazard
This map indicates all areas with a high flood hazard and those with a low flood hazard. The higher the flood hazard greater the probability of flood and vice versa. This map is classified into five classes—Streams, High, Medium, Low, and no hazard. As can be seen from the resulting image, an area of 55.18 sq. km (11.23% of the total area) is covered by the Brahmani and Dharma river systems, as well as the localities of Ramchandrapur, Jagannathpur, Padmanavpur, Narayanpur, Saradaprasad, Paramanandpur, and Mohanpur, these regions have a high flood hazard hence are the most flood-prone regions (Figure 9; Table 11). An area of 4.11 sq. km or 0.8% of the total area falls under the medium hazard region and exhibits a moderate threat of floods. Low flood hazard areas include the localities of Sailendra Nagar, Baghamari, Birabhanjapur, Govindapur, Kanhupur, etc., covering an area of 34.08 sq. km and 6.9% of the total area. A sizeable portion of the BNP is 383.39 Sq. km or 78% of the entire area has no flood hazard.
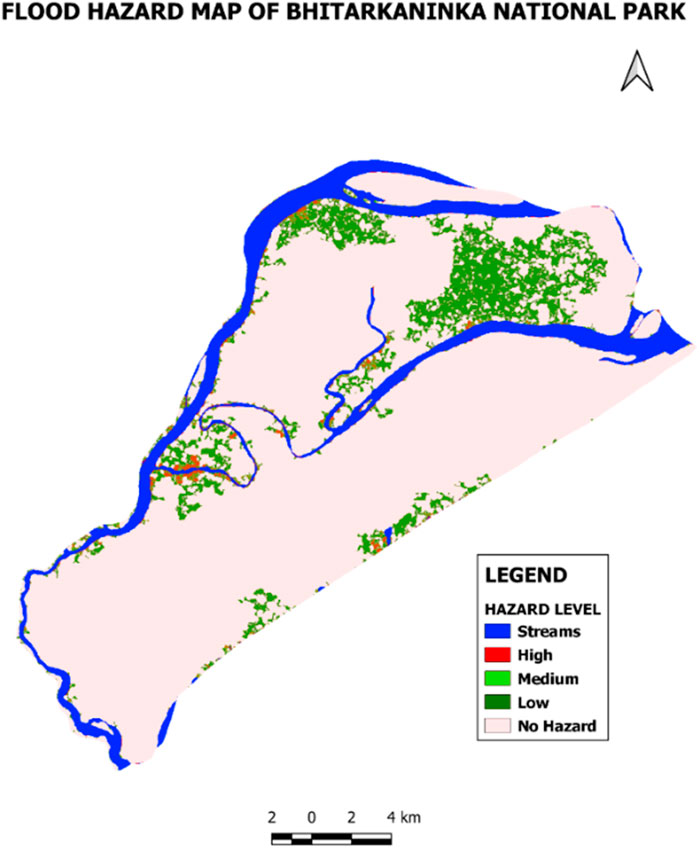
FIGURE 9. Flood hazard map.
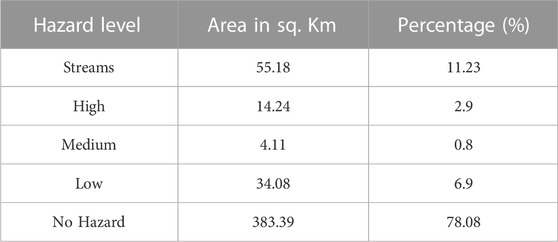
TABLE 11. Flood hazard statistics.
4.5 Flood vulnerability
The above map represents the area of BNP classified in terms of vulnerability to flooding. It is classified into four classes: waterbodies, high, medium, and low, represented by blue, Red, Yellow, and Green, respectively. As the map indicates, a substantial part of BNP is under a high vulnerability zone. The eastern coast along the Bay of Bengal and the northern and eastern regions of BNP is the most vulnerable zones of BNP.
The High vulnerability areas include the villages of Karanjia, Praharajpur, Pentha Beach, Jaudia Teisi Mauza, Nuagan, Paramanandapur, Kanhupur, Satavaya, Bagapatia, Balunga Patia, Gupti, Rajrajeshwaripur, Jagannathpur, Padmanavpur, Balarampur, Junus Nagar, Sila pokhari, Purusottampur, Narayanapur, Sir Rajendrapur, Banipal, Pravati, Ahirajpur, Sailendra Sarai and Trilochanpur (Figure 10; Table 12). This zone covers an area of 118.68 Sq. Km and 24.28% of the total area. The medium vulnerability zone covers an area of 165.94 Sq. km and 33.9% of the entire area. This zone includes villages like Subarnpur, Birabhanjapur, Badapal, Bimisnagar, Chakradharpur, Balarampur, etc. The low vulnerability region covers an area of 137.43 Sq. Km and 28.12% of the total area and mainly includes the mangrove forests of BNP.
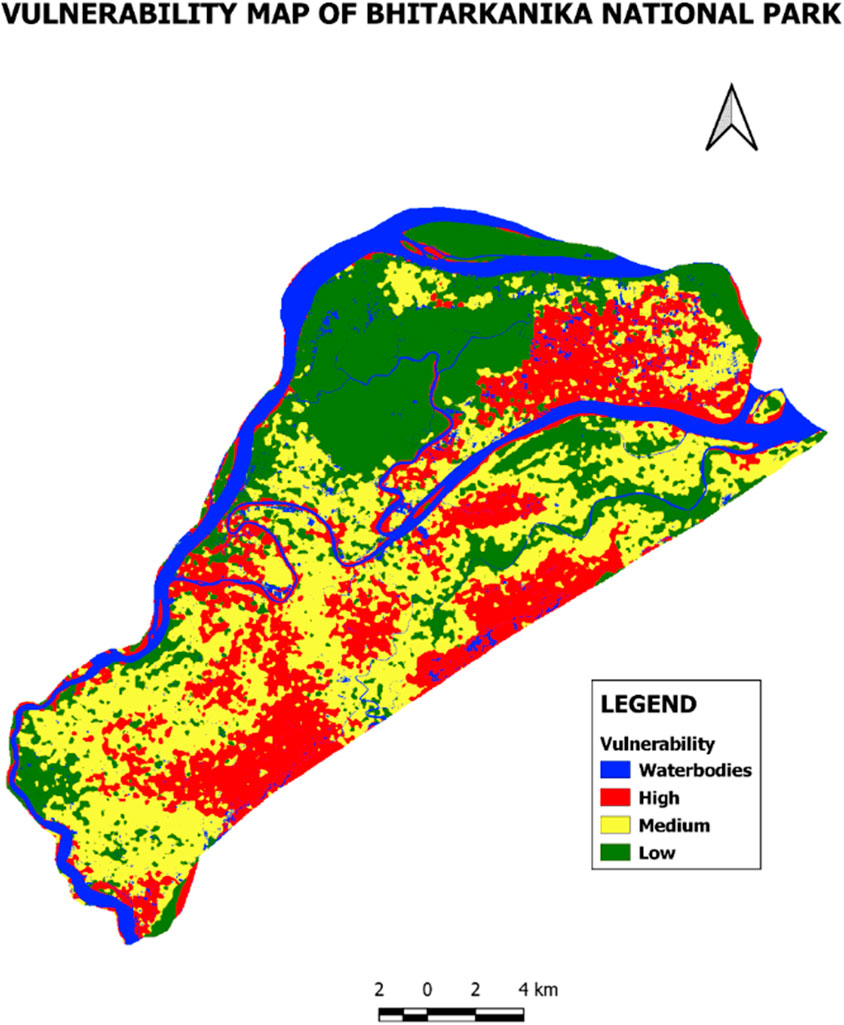
FIGURE 10. Vulnerability map using AHP-weight overlay analysis.
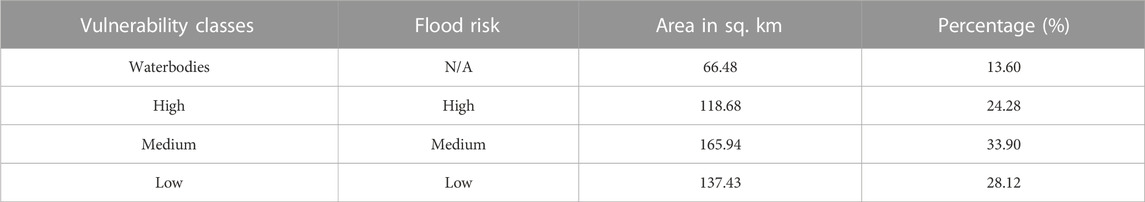
TABLE 12. Vulnerability statistics.
4.6 Flood risk
The study findings reveal that a significant portion of the BNP area falls within a high flood-risk zone. The map provided in Figure 13 classifies the area into four categories: Waterbodies, High, Medium, and Low, represented by the colours Blue, Red, Yellow, and Green, respectively. The Bhitarkanika National Park region has a low elevation and a gentle slope, with the Brahmani River and the Bay of Bengal surrounding it on all sides. This geographical configuration puts BNP at a heightened risk of floods and coastal areas being submerged due to future sea-level rise. The study indicates that the eastern regions of BNP, particularly those near the riverbanks or the coast, are classified as high flood-risk zones. The coastal villages of Govindapur, Kanhupur, Mohanpur, Paramanandapur, Satavaya, Bankua, Nuagan, Baghadiya, Jaudiya, Joginatha, and Sailendra Sarai are located within these high-risk regions, susceptible to tidal floods and sea-level rise. This is further proven in other studies that coastal region of BNP are projected to be submerged due to sea-level rise by the year 2050 (Mishra et al., 2021).
These villages, such as Saradaprasad, Trilochanpur, Kamalpur, Badhadia, Subarnpur, Sailendra Nagar, Talchua, Sourendrapur, Baghamari, Narayanpur, Sir Rajendrapur, Pravati, Gopaljew Patana, Ajagar Patia, Purusottampur, Junus Nagar, Panchu Palli, Ramachandrapur, Ghadiamal, Padmanavpur, Jagannathpur, Balarampur, Jharpada, Rajagarh, parts of Rajnagar, Praharajpur, and Kadalichua, are all located along the banks of the Brahmani and Dharma Rivers. These villages are situated within the high-risk zone for riverine floods. Additionally, villages like Balarampur, Gajrajpur, Mahinsasur, Gobindapur, Amanapari, Bhitargarh, Sribantapur, Tikayat Nagar, Rabindrapur, and others fall within the medium flood risk zone. This zone covers an area of 171.51 sq. km, accounting for 35.10% of the total area. These areas have a moderate risk of flooding, but they also have the potential to transition into high-risk zones in the coming years.
The mangrove forests in BNP, located primarily along the estuaries, have the highest elevation. These areas experience daily fluctuations in water levels during high and low tides, making them naturally resistant to floods. Instead, these mangrove areas serve as a protective barrier, shielding the nearby regions from storms and floods. As a result, the majority of the low flood risk zone comprises mangrove forests along BNP and Gahirmatha WLS. Other villages in the area, such as Barunei, Kantia Khai, Rajendranarayanpur, Krishnanagar, Kanaknagar, Baghua, Dighi, Madhupur, and others, also fall within this low-risk zone and are not immediately susceptible to floods. This low-risk zone covers an area of 132.39 Sq. km and constitute 27.09% of the total area (Figure 11; Table 13).
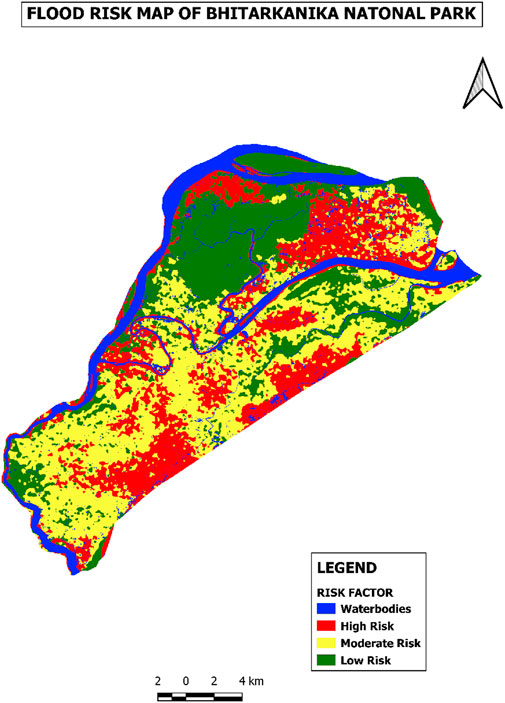
FIGURE 11. Flood risk map using AHP-weight overlay analysis.
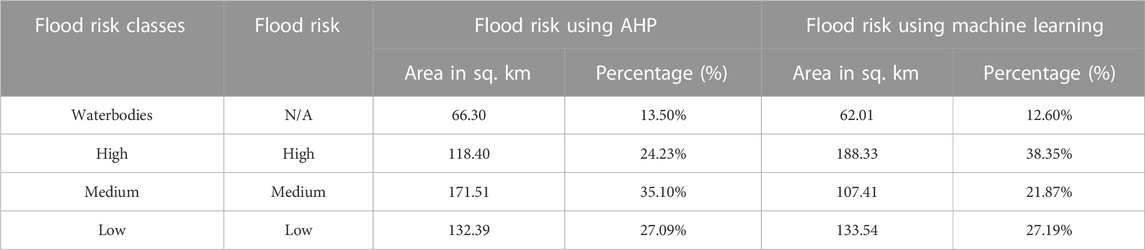
TABLE 13. Flood risk statistics.
4.7 Flood risk mapping using machine learning
Figure 12 has been generated using machine learning algorithms (SVM-RBF). This output provides better results than the results obtained using conventional methods. The risk zones created using this method are more distinctive and easier to interpret. The flood risk map developed by machine learning algorithms provides accurate in terms of overall accuracy and kappa value (Table 14). In addition, the machine learning-based flood risk map shows better visual quality regarding zoning, smoothness and aerial extent as compared to conventional methods (Figure 11; Figure 12; Figure 13; Table 13).
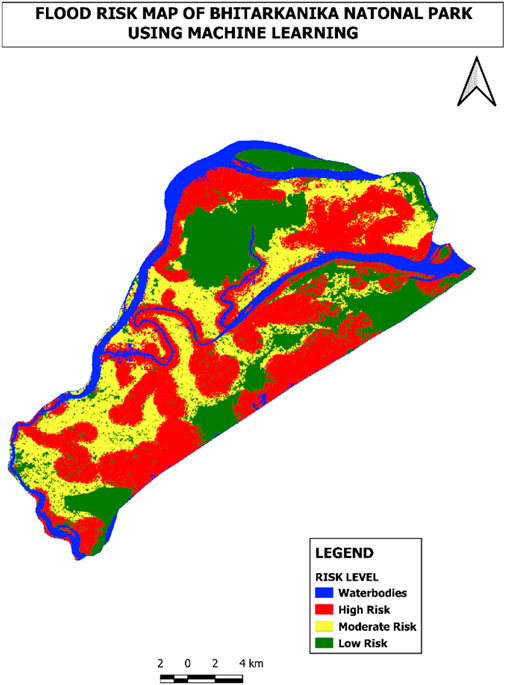
FIGURE 12. Risk map using machine learning.
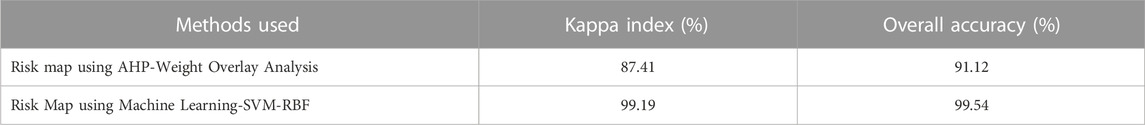
TABLE 14. Flood risk comparison.
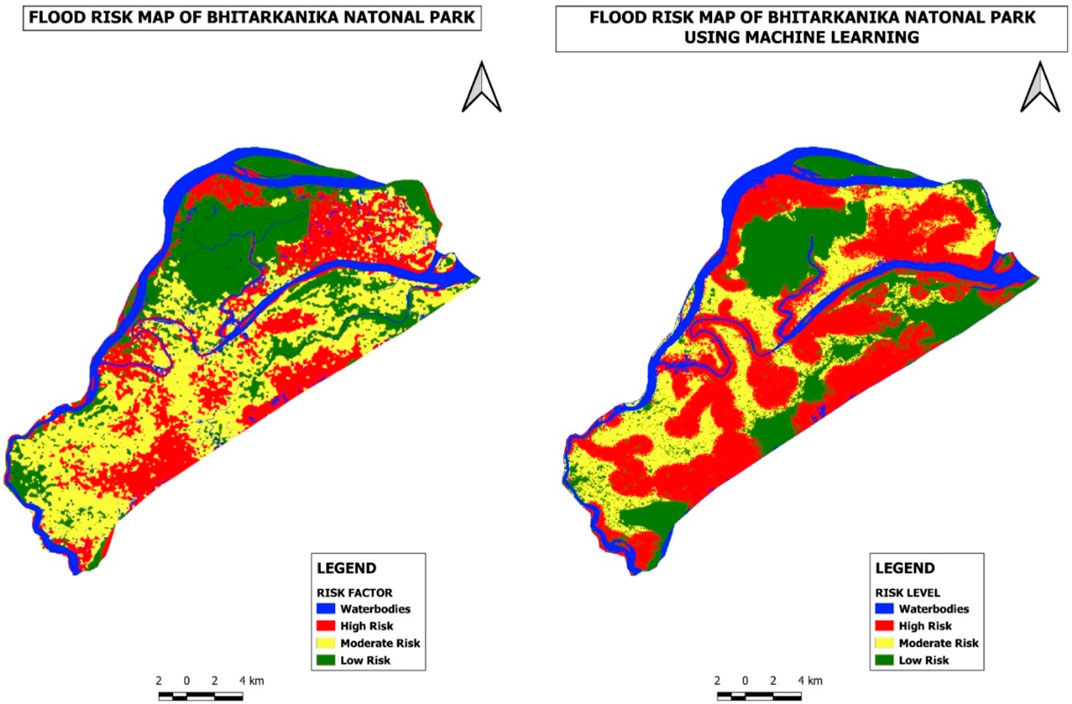
FIGURE 13. Comparison between the traditional method and machine learning algorithm.
The below figure shows a side-by-side comparison of both maps.
In today’s time machine-learning algorithms due to their association with Artificial Intelligence (AI) are widely used for vulnerability mapping as seen in a number of studies(Avand et al., 2021; Liu et al., 2021; Ghosh et al., 2022). The result of the present study shows that machine-learning algorithms outperform Weight Overlay Analysis methods based on the map’s precision, kappa index, and overall quality. This is clearly showcased in the accuracy assessment conducted using the OTB tool. It has been proved repeatedly in other studies too that SVM is the most reliable ML algorithm for flood zonation(Wu et al., 2019; Xiong et al., 2019).
5 Mitigation strategies and conclusion
5.1 Mitigation for human settlement
Given the significant economic investment needed for flood mitigation measures globally, as well as the unique nature of floods requiring targeted strategies, it is crucial to pay considerable attention to the performance of these strategies and their optimal design under diverse and complex environmental conditions. This emphasis on performance evaluation and optimal design is of utmost importance to ensure effective and efficient flood mitigation efforts (Binns, 2020). It is fundamental to determine which measures are the most effective in optimising the response to floods in local communities(Genovese and Thaler, 2020).
This study provides a comprehensive understanding of the vulnerable and risk-prone regions within Bhitarkanika National Park (BNP). It reveals that a significant portion of BNP is classified as a high flood risk zone, necessitating immediate actions and mitigation measures. Coastal villages such as Govindapur, Kanhupur, Mohanpur, Paramanandapur, Satavaya, Bankua, Nuagan, Baghadiya, Jaudiya, Joginatha, Sailendra Sarai, Purusottampur, Junus Nagar, Panchu Palli, Ramachandrapur, Ghadiamal, Padmanavpur, Jagannathpur, Balarampur, Jharpada, Rajagarh, and Raj Nagar are located in high-risk areas prone to tidal and riverine floods. These areas have high population densities and require the establishment of proper flood and storm centres. It is essential to educate the residents about first aid and provide them with training in disaster resilience. Additionally, these villages should have well-connected road networks to nearby regional centres to ensure the timely arrival of emergency supplies during floods. Considering the potential submergence of coastal fishing villages due to rising sea levels in the coming decades, proper resettlement planning must be carried out in advance. Adequate relief and compensation should be provided to the residents of these fishing villages and nearby agricultural villages in the event of flood damage.
5.2 Conservation of ecology
The mangrove forest area in Bhitarkanika National Park has been steadily increasing thanks to the effective mitigation measures implemented by the Odisha Forest Department. Despite challenges such as illegal apiculture activities leading to forest fires, the mangrove area has expanded from 139.49 sq. km in 2000 to nearly 166 sq. km in 2021. The forest department has been successful in addressing threats such as overfishing, poaching, and shifting cultivation, thereby stabilizing the mangrove ecosystem. On the other hand, the area under agriculture has experienced a significant decrease due to the expansion of aquaculture activities and salinity ingress in agricultural areas. Aquaculture has seen exponential growth in the past 2 decades due to its profitability. Numerous aquaculture ponds are being established along the national park area, posing a potential threat in the future. Salinity ingress from nearby estuaries is also a major factor contributing to the decline in agricultural activities as it negatively affects soil fertility.
The saltwater crocodile population in the BNP area is thriving, which is a positive sign for the biosphere reserve. However, this has also resulted in an increase in human-animal conflicts. During floods, crocodiles often venture out of the main estuary area and into nearby rivers, posing a risk to local villagers. It is crucial to implement measures to mitigate these conflicts and ensure the safety of both humans and crocodiles. Additionally, the study highlights the need to declare the Gahirmatha WLS area as a no-fishing zone with strict enforcement to protect the turtles. This will help preserve the biodiversity and maintain the ecological balance in the region. Furthermore, the study demonstrates that machine learning techniques outperform Weight Overlay Analysis techniques in terms of accuracy. The Weight Overlay Analysis map achieved an accuracy of 91.12%, while the machine learning map achieved an accuracy of 99.54%. This indicates that the machine learning approach provides a clearer and more accurate representation of the flood risk zones in BNP.
The Bhitarkanika National Park area experiences annual floods, yet there has been a lack of comprehensive studies that intricately delineate the flood risk zones in this ecologically important region. This study fills that gap by clearly identifying the flood-prone areas within the fragile BNP region and proposing potential mitigation measures aligned with the Sustainable Development Goals (SDGs). Implementing proper mitigation strategies in the high-risk zones identified in the study can help minimize damage to both human lives and wildlife. The National Disaster Management Authority (NDMA) and the Government of Odisha can utilize this study to make Bhitarkanika National Park more resilient to flood-related damages and to promote harmonious coexistence between humans and animals. Additionally, the study demonstrates that the SVM-RBF algorithm is a superior method for flood risk zoning, surpassing the traditional AHP method. This finding encourages the widespread adoption of the SVM-RBF algorithm in future studies, further enhancing flood risk assessment and management efforts.
Data availability statement
The original contributions presented in the study are included in the article/supplementary material, further inquiries can be directed to the corresponding author.
Author contributions
SM: drafting, processing, analysis of land use/cover mapping and change analysis, vulnerability, hazards, and risk mapping. SkM: Assisted in remote sensing data processing, GIS, and machine learning application. DS: assisted in developing different indicators for flood vulnerability and risk assessment. TV: editing, rewriting and reviewing of the article. MM: Assisted in conceptualizing research article. C-TW: editing and rewriting of the article. All authors contributed to the article and approved the submitted version.
Conflict of interest
The authors declare that the research was conducted in the absence of any commercial or financial relationships that could be construed as a potential conflict of interest.
Publisher’s note
All claims expressed in this article are solely those of the authors and do not necessarily represent those of their affiliated organizations, or those of the publisher, the editors and the reviewers. Any product that may be evaluated in this article, or claim that may be made by its manufacturer, is not guaranteed or endorsed by the publisher.
References
Avand, M., Moradi, H., and lasboyee, M. R. (2021). Spatial modeling of flood probability using geo-environmental variables and machine learning models, case study: Tajan watershed, Iran. Adv. Space Res. 67 (10), 3169–3186. doi:10.1016/J.ASR.2021.02.011
Bandi, A. S., Meshapam, S., and Deva, P. (2019). A geospatial approach to flash flood hazard mapping in the city of Warangal, Telangana, India. Environ. Socio-Economic Stud. 7 (3), 1–13. doi:10.2478/ENVIRON-2019-0013
Binns, A. D. (2020). Flood mitigation measures in an era of evolving flood risk. J. Flood Risk Manag. 13, e12659. doi:10.1111/jfr3.12659
Cian, F., Marconcini, M., Ceccato, P., and Giupponi, C. (2018). Flood depth estimation by means of high-resolution SAR images and lidar data. Nat. Hazards Earth Syst. Sci. 18 (11), 3063–3084. doi:10.5194/nhess-18-3063-2018
Dai, Q.-Y., Zhang, C.-P., and Wu, H. (2016). Research of decision tree classification algorithm in data mining. Int. J. Database Theory Appl. 9 (5), 1–8. doi:10.14257/ijdta.2016.9.5.01
Dawod, G. M., Mirza, M. N., and Al-Ghamdi, K. A. (2012). GIS-based estimation of flood hazard impacts on road network in Makkah city, Saudi Arabia. Environ. Earth Sci. 67 (8), 2205–2215. doi:10.1007/S12665-012-1660-9
Deroliya, P., Ghosh, M., Mohanty, M. P., Ghosh, S., Rao, K. H. V. D., and Karmakar, S. (2022). A novel flood risk mapping approach with machine learning considering geomorphic and socio-economic vulnerability dimensions. Sci. Total Environ. 851, 158002. doi:10.1016/J.SCITOTENV.2022.158002
Dewan, A. M., Islam, M. M., Kumamoto, T., and Nishigaki, M. (2007). Evaluating flood hazard for land-use planning in greater Dhaka of Bangladesh using remote sensing and GIS techniques. Water Resour. Manag. 21 (9), 1601–1612. doi:10.1007/S11269-006-9116-1
Farhadi, H., and Najafzadeh, M. (2021). Flood risk mapping by remote sensing data and random forest technique. Water 13 (21), 3115. doi:10.3390/W13213115
Fernández, D. S., and Lutz, M. A. (2010). Urban flood hazard zoning in Tucumán Province, Argentina, using GIS and multicriteria decision analysis. Eng. Geol. 111 (1–4), 90–98. doi:10.1016/J.ENGGEO.2009.12.006
Genovese, E., and Thaler, T. (2020). The benefits of flood mitigation strategies: effectiveness of integrated protection measures. AIMS Geosci. 6 (4), 459–472. doi:10.3934/geosci.2020025
Gharagozlou, A., Nazari, H., and Seddighi, M. (2011). Spatial analysis for flood control by using environmental modeling. J. Geogr. Inf. Syst. 03 (04), 367–372. doi:10.4236/JGIS.2011.34035
Ghosh, S., Saha, S., and Bera, B. (2022). Flood susceptibility zonation using advanced ensemble machine learning models within Himalayan foreland basin. Nat. Hazards Res. 2 (4), 363–374. doi:10.1016/J.NHRES.2022.06.003
Hallegatte, S., Green, C., Nicholls, R. J., and Corfee-Morlot, J. (2013). Future flood losses in major coastal cities. Nat. Clim. Change 3 (9), 802–806. doi:10.1038/NCLIMATE1979
Hao, L., van Westen, C., Rajaneesh, A., Sajinkumar, K. S., Martha, T. R., and Jaiswal, P. (2022). Evaluating the relation between land use changes and the 2018 landslide disaster in Kerala, India. Catena 216, 106363. doi:10.1016/j.catena.2022.106363
He, C., Shi, P., Xie, D., and Zhao, Y. (2010). Improving the normalized difference built-up index to map urban built-up areas using a semiautomatic segmentation approach. Remote Sens. Lett. 4, 213–221. doi:10.1080/01431161.2010.481681
Heidari, A. (2014). Flood vulnerability of the Karun River System and short-term mitigation measures. J. Flood Risk Manag. 7 (1), 65–80. doi:10.1111/JFR3.12032
Hongmao, S. (2016). Quantitative structure–activity relationships. A Pract. Guide Ration. Drug Des. 2016, 163–192. doi:10.1016/B978-0-08-100098-4.00005-3
Jaydhar, A. K., Chandra Pal, S., Saha, A., Islam, A. R. M. T., and Ruidas, D. (2022). Hydrogeochemical evaluation and corresponding health risk from elevated arsenic and fluoride contamination in recurrent coastal multi-aquifers of eastern India. J. Clean. Prod. 369, 133150. doi:10.1016/J.JCLEPRO.2022.133150
Kaul, H. A., and Sopan, I. (2012). Land use land cover classification and change detection using high resolution temporal satellite data. J. Environ. 01, 146–152.
Khan, W., Hore, U., Mukherjee, S., and Mallapur, G. (2020). Human-crocodile conflict and attitude of local communities toward crocodile conservation in Bhitarkanika Wildlife Sanctuary, Odisha, India. Mar. Policy 121, 104135. doi:10.1016/J.MARPOL.2020.104135
Kumar, A., Lakshmanan, G., Selvam, V., Ramasubramanian, R., and Kar, C. (2015). Developing a spectral library of mangrove species of Indian East Coast using field spectroscopy. Geocarto Int. 2015. doi:10.1080/10106049.2014.985743
Kumar, M., Kalra, N., Singh, H., Sharma, S., Singh Rawat, P., Kumar Singh, R., et al. (2021). Indicator-based vulnerability assessment of forest ecosystem in the Indian Western Himalayas: An analytical hierarchy process integrated approach. Ecol. Indic. 125, 107568. doi:10.1016/J.ECOLIND.2021.107568
Langlentombi, L. C., and Kumar, M. (2021). Inherent vulnerability of forests: A case study from Jharkhand in India. J. Trop. For. Sci. 33 (4), 455–460. doi:10.26525/jtfs2021.33.4.455
Lawal, D. U., Matori, A. N., Yusuf, K. W., Hashim, A. M., and Balogun, A. L. (2014). Analysis of the flood extent extraction model and the natural flood influencing factors: A GIS-based and remote sensing analysis. IOP Conf. Ser. Earth Environ. Sci. 18 (1), 012059. doi:10.1088/1755-1315/18/1/012059
Li, K., Wu, S., Dai, E., and Xu, Z. (2012). Flood loss analysis and quantitative risk assessment in China. Nat. Hazards 63 (2), 737–760. doi:10.1007/S11069-012-0180-Y
Liu, Y., Lu, X., Yao, Y., Wang, N., Guo, Y., Ji, C., et al. (2021). Mapping the risk zoning of storm flood disaster based on heterogeneous data and a machine learning algorithm in Xinjiang, China. J. Flood Risk Manag. 14 (1), e12671. doi:10.1111/JFR3.12671
Mishra, S. P., Kumar Barik, K., and Patnaik, S. K. (2021). The vulnerability and management to the blue carbon ecosystem: Coastal Odisha. Int. j. lakes rivers 14 (1), 43–70.
Mustak, S., Baghmar, N. K., Srivastava, P. K., Singh, S. K., and Binolakar, R. (2018). Delineation and classification of rural–urban fringe using geospatial technique and onboard DMSP–Operational Linescan System. Geocarto Int. 33 (4), 375–396. doi:10.1080/10106049.2016.1265594
Nelson, R., Kokic, P., Crimp, S., Martin, P., Meinke, H., Howden, S. M., et al. (2010). The vulnerability of Australian rural communities to climate variability and change: Part II—integrating impacts with adaptive capacity. Environ. Sci. Policy 13 (1), 18–27. doi:10.1016/J.ENVSCI.2009.09.007
Opella, J. M. A., and Hernandez, A. A. (2019). “Developing a flood risk assessment using support vector machine and convolutional neural network: A conceptual framework,” in Proceedings - 2019 IEEE 15th International Colloquium on Signal Processing and Its Applications, Penang, Malaysia, 8-9 March 2019, 260. doi:10.1109/CSPA.2019.8695980
Ouma, Y. O., and Tateishi, R. (2014). Urban flood vulnerability and risk mapping using integrated multi-parametric AHP and GIS: Methodological overview and case study assessment. WaterSwitzerl. 6 (6), 1515–1545. doi:10.3390/W6061515
Parsian, S., Amani, M., Moghimi, A., Ghorbanian, A., and Mahdavi, S. (2021). Flood hazard mapping using fuzzy logic, analytical hierarchy process, and multi-source geospatial datasets. Remote Sens. 13 (23), 4761. doi:10.3390/RS13234761
Parvin, F., Ali, S. A., Calka, B., Bielecka, E., Linh, N. T. T., and Pham, Q. B. (2022). Urban flood vulnerability assessment in a densely urbanized city using multi-factor analysis and machine learning algorithms. Theor. Appl. Climatol. 149 (1–2), 639–659. doi:10.1007/S00704-022-04068-7
Pham, B. T., Shirzadi, A., Shahabi, H., Omidvar, E., Singh, S. K., Sahana, M., et al. (2019). Landslide susceptibility assessment by novel hybrid machine learning algorithms. Sustain. Switz. 11 (16), 4386. doi:10.3390/su11164386
Pourali, S. H., Arrowsmith, C., Chrisman, N., Matkan, A. A., and Mitchell, D. (2016). Topography wetness index application in flood-risk-based land use planning. Appl. Spatial Analysis Policy 9 (1), 39–54. doi:10.1007/S12061-014-9130-2
Rahmati, O., Zeinivand, H., and Besharat, M. (2016). Flood hazard zoning in Yasooj region, Iran, using GIS and multi-criteria decision analysis. Geomatics, Nat. Hazards Risk 7 (3), 1000–1017. doi:10.1080/19475705.2015.1045043
Ramesh, V., and Iqbal, S. S. (2022). Urban flood susceptibility zonation mapping using evidential belief function, frequency ratio and fuzzy gamma operator models in GIS: a case study of greater Mumbai, Maharashtra, India. Geocarto Int. 37 (2), 581–606. doi:10.1080/10106049.2020.1730448
Ruidas, D., Chakrabortty, R., Islam, A. R. Md. T., Saha, A., and Pal, S. C. (2022a). A novel hybrid of meta-optimization approach for flash flood-susceptibility assessment in a monsoon-dominated watershed, Eastern India. Environ. Earth Sci. 81 (5), 145. doi:10.1007/s12665-022-10269-0
Ruidas, D., Pal, S. C., Islam, A. R. M. T., and Saha, A. (2021). Characterization of groundwater potential zones in water-scarce hardrock regions using data driven model. Environ. Earth Sci. 80 (24), 809–818. doi:10.1007/s12665-021-10116-8
Ruidas, D., Pal, S. C., Towfiqul Islam, A. R. M., and Saha, A. (2022b). Hydrogeochemical evaluation of groundwater aquifers and associated health hazard risk mapping using ensemble data driven model in a water scares plateau region of eastern India. Expo. Health 15 (1), 113–131. doi:10.1007/S12403-022-00480-6
Ruidas, D., Saha, A., Islam, A. R. Md. T., Costache, R.-D., and Pal, S. (2022c). Development of geo-environmental factors controlled flash flood hazard map for emergency relief operation in complex hydro-geomorphic environment of tropical river, India. Environ. Sci. Pollut. Res. 2022. doi:10.1007/s11356-022-23441-7
Sami, G., Abdelwahhab, F., Yahyaoui, H., and Abdelghani, F. (2021). Flood hazard in the city of chemora (Algeria). Analele Univ. Din. Oradea, Ser. Geogr. 31 (1), 22–27. doi:10.30892/AUOG.311103-835
Schumann, G. J. P., Brakenridge, G. R., Kettner, A. J., Kashif, R., and Niebuhr, E. (2018). Assisting flood disaster response with earth observation data and products: A critical assessment. Remote Sens. 10 (8), 1230. doi:10.3390/RS10081230
Serda, M., Becker, F. G., Cleary, M., Team, R. M., Holtermann, H., The, D., et al. (2002). Risk, performance and uncertainty in flood and coastal defence - a review. Uniw. Śląski 7 (1), 343–354.
Soni, B. (2012). Exercise 4-watershed and stream network delineation from DEMs prepared by ayse kilic and. In CIVE 835-GIS in water resources fall. Available at: http://maps.waterdata.usgs.gov/mapper/index.html.
Stefanidis, S., and Stathis, D. (2013). Assessment of flood hazard based on natural and anthropogenic factors using analytic hierarchy process (AHP). Nat. Hazards 68 (2), 569–585. doi:10.1007/S11069-013-0639-5
Taylor, J., Lai, K., Davies, M., Clifton, D., Ridley, I., and Biddulph, P. (2011). Flood management: Prediction of microbial contamination in large-scale floods in urban environments. Environ. Int. 37 (5), 1019–1029. doi:10.1016/J.ENVINT.2011.03.015
Ullah, K., and Zhang, J. (2020). GIS-based flood hazard mapping using relative frequency ratio method: A case study of panjkora river basin, eastern hindu kush, Pakistan. PLoS ONE 15 (3), e0229153. doi:10.1371/JOURNAL.PONE.0229153
Wang, Y., Hong, H., Chen, W., Li, S., Panahi, M., Khosravi, K., et al. (2019). Flood susceptibility mapping in Dingnan County (China) using adaptive neuro-fuzzy inference system with biogeography based optimization and imperialistic competitive algorithm. J. Environ. Manag. 247, 712–729. doi:10.1016/J.JENVMAN.2019.06.102
Wright, D. B. (2015). Methods in flood hazard and risk assessment. Available at: https://openknowledge.worldbank.org/handle/10986/22982.
Wu, J., Liu, H., Wei, G., Song, T., Zhang, C., and Zhou, H. (2019). Flash flood forecasting using support vector regression model in a small mountainous catchment. WaterSwitzerl. 11 (7), 1327. doi:10.3390/w11071327
Xiong, J., Li, J., Cheng, W., Wang, N., and Guo, L. (2019). A GIS-based support vector machine model for flash flood vulnerability assessment and mapping in China. ISPRS Int. J. Geo-Information 8 (7), 297. doi:10.3390/ijgi8070297
Yadollahie, M. (2019). The flood in Iran: A consequence of the global warming? Int. J. Occup. Environ. Med. 10 (2), 54–56. doi:10.15171/IJOEM.2019.1681
Zhang, K., Gann, D., Ross, M., Robertson, Q., Sarmiento, J., Santana, S., et al. (2019). Accuracy assessment of ASTER, SRTM, ALOS, and TDX DEMs for Hispaniola and implications for mapping vulnerability to coastal flooding. Remote Sens. Environ. 225, 290–306. doi:10.1016/j.rse.2019.02.028
Keywords: vulnerability, flood risk, national park, mangrove, decision-support system, machine learning
Citation: Mohanty S, Mustak S, Singh D, Van Hoang T, Mondal M and Wang C-T (2023) Vulnerability and risk assessment mapping of Bhitarkanika national park, Odisha, India using machine-based embedded decision support system. Front. Environ. Sci. 11:1176547. doi: 10.3389/fenvs.2023.1176547
Received: 28 February 2023; Accepted: 01 September 2023;
Published: 28 September 2023.
Edited by:
Suresh Kumar, Indian Institute of Remote Sensing, IndiaReviewed by:
Subodh Chandra Pal, University of Burdwan, IndiaUday Chatterjee, Bhatter College, Dantan, India
Copyright © 2023 Mohanty, Mustak, Singh, Van Hoang, Mondal and Wang. This is an open-access article distributed under the terms of the Creative Commons Attribution License (CC BY). The use, distribution or reproduction in other forums is permitted, provided the original author(s) and the copyright owner(s) are credited and that the original publication in this journal is cited, in accordance with accepted academic practice. No use, distribution or reproduction is permitted which does not comply with these terms.
*Correspondence: Sk. Mustak, mustak.sk5@gmail.com