Distributed clean energy opportunities for US oil refinery operations
 Kathleen Krah1 Sean Ericson1 Xiangkun Li1 Opeoluwa Wonuola Olawale2 Ricardo Castillo1
  Emily Newes1,3*
  Jill Engel-Cox1,3
- 1National Renewable Energy Laboratory (NREL), Golden, CO, United States
- 2Advanced Energy Systems Department, Colorado School of Mines, Golden, CO, United States
- 3Joint Institute for Strategic Energy Analysis (JISEA), Golden, CO, United States
The oil and gas industry is increasingly seeking operational improvements to reduce costs and emissions while improving resilience. This study describes techno-economic analysis of opportunities for distributed energy resources that could be integrated to support oil and gas companies’ economic, environmental, and energy resiliency goals. Specifically, the analysis evaluates solar photovoltaics, wind turbines, battery energy storage, landfill gas, biomass, municipal solid waste-to-energy, solar steam for process heat, combined heat and power, and electrolyzers for hydrogen production at two hypothetical refineries, one located in Louisiana and the other in southern California. These technologies could reduce the sites’ consumption of grid electricity and/or natural gas and thus can help reduce emissions. This study employs the ReOPT tool and System Advisor Model to evaluate the techno-economic potential for clean energy technologies to support refineries in achieving energy goals, including energy cost savings, resiliency, and emissions reductions. Results indicate that the associated costs of emissions reductions via several distributed clean energy technologies are competitive with other emissions reduction strategies such as energy efficiency, reducing flaring, direct carbon capture and sequestration, and markets under certain conditions. There are also cost beneficial opportunities for the use of renewable energy for refining, especially for resilience, depending on local conditions such as resources and utility costs.
1 Introduction
Global demand for energy and petroleum products continues to increase as fossil fuels are projected to continue to play a role in the global energy economy in the near-term decades (EIA, 2020). However, the environmental impacts of burning fossil fuels are becoming increasingly apparent. Significant reductions in emissions are required to limit anticipated global temperature increases (IPCC, 2018), and the industry is seeking ways to mitigate operational emissions.
Most petroleum-related greenhouse gas (GHG) emissions come from the final consumption of oil and gas products (EPA, 2018). However, the production, transportation, and refining of oil and gas also contribute significantly to global emissions, estimated at 15% of energy-related (IEA, 2020) and 9% of global (Gargett et al., 2019) GHG emissions. Thus, many companies in the oil and gas sector are setting goals to reduce their carbon footprints and investigating pathways to achieve these goals at least cost.
In addition to individual companies committing to renewable energy and emissions reduction investments and targets (Zhong and Bazilian, 2018; Besta, 2019; Shojaeddini et al., 2019; Roy, 2020) and addressing their role in the clean energy transition (Eni, 2018; Mit Energy Initiative, 2018) in annual reports, industry initiatives are developing to collectively lead this energy transition as well. For example, the Oil and Gas Climate Initiative is a group of oil and gas industry leaders accounting for almost 30% of global operated oil and gas production who explicitly support the Paris Agreement and its aims and are actively investing in low carbon solutions (OGCI, 2020). The Oil and Gas Methane Partnership, led by the United Nations Environment Program, the European Commission, and the Environmental Defense Fund, currently has 62 participating companies voluntarily aiming to track and reduce methane emissions (Seo and Bienkowski, 2020).
Various measures can help reduce emissions in oil and gas company operations, including energy efficiency measures, renewable energy generation, reducing flaring, carbon offsets, and carbon capture and sequestration. This article focuses on opportunities for integration of distributed energy resources (DERs) into petroleum refinery operations. Specifically, it evaluates how and where commercially-available distributed renewable electricity generation and storage technologies, including solar photovoltaics (PV), wind turbines, battery storage, landfill gas (LFG), biomass, municipal solid waste (MSW)-to-energy, solar steam for process heat, combined heat and power (CHP), and electrolyzers for hydrogen production, can reduce electric grid and natural gas consumption and associated costs and emissions at hypothetical case study refinery sites. Additionally, resilience to electric grid outages, such as those caused by natural disasters, extreme weather events, and cyberattacks, is becoming increasingly valued by industry; the role of DERs in supporting operational resiliency is also explored in this article.
In the literature, various articles and reports describe current and planned clean energy projects or examine specific case studies evaluating the benefits of integrating specific technologies at specific oil and gas sites. Many describe strategies and investments of various major oil and gas companies in the energy transition, including significant investment in renewable energy companies and technologies (Zhong and Bazilian, 2018; Besta, 2019; Shojaeddini et al., 2019; Roy, 2020). Several case studies indicate opportunity for offshore wind energy to help power offshore oil and gas platforms, either exporting excess generation to the onshore electric grid (He et al., 2013) or operating in parallel with gas turbines (Korpas et al., 2012). Kialashaki et al. (2016) describe a technical assessment of a “solar jack,” a solar PV-powered pump with variable speed drive for extraction at three case study oil wells in the United States. Xin et al. (2012) describe geothermal electric generation co-produced at an oilfield in China. Krah et al. (2020) describe a techno-economic analysis of solar PV, wind turbines, and battery storage to support cost savings, resilience, and emissions reductions at case study natural gas wells in the Marcellus Shale.
Additionally, several large-scale analyses evaluate where different clean energy generation technologies could be integrated into oil and gas operations. Ericson et al. (2019) describe current trends, opportunities, and challenges for integrating renewables into upstream, midstream, and downstream oil and gas operations. Absi Halabi et al. (2015) review efforts to utilize solar PV and solar thermal into oil and gas operations. Wang et al. (2017) screen nations for opportunities for solar PV and solar thermal for upstream and downstream operations by overlaying geospatial data about solar resource and upstream and downstream energy intensity. Elson et al. (2015) identify the petroleum refining industry as the largest source of waste heat and describe opportunities for waste heat to power in this industry along with several other high-potential industries. Kurup and Turchi (2015) identify petroleum and coal products manufacturing as the second highest industry in the United States, after chemical manufacturing, for natural gas consumption for direct process heating and boiler use and evaluate opportunities for concentrating solar power for direct heat in industrial applications in California. Forbes-Cable (2019) describes the opportunity for renewables to power offshore oil and gas platforms in some markets, including a case study in the North Sea.
To our knowledge, there are three other studies that look at renewable energy integration in refinery operations, and they are specific case studies of refineries in the Middle East. Alnifro et al. (2017) describe the opportunity for solar PV, concentrating solar power, and wind energy to cost effectively support refinery operations to reduce operational emissions. Norouzi et al. (2020) consider solar PV, CSP, and wind for refinery electricity demand. They are all determined to be economically feasible with a payback period of six to 10 years. Taqvi et al. (2021) use a MILP model seeking to minimize cost and emissions. Considering PV, CSP, wind, and energy storage, their results show that coupling wind with CSP would result in the largest carbon emissions reductions, which are then further reduced when including energy storage.
Most of this existing literature falls into one of two categories: either the study focuses on a case study of a specific technology at a specific site, or the study discusses high-level opportunities without considering site-specific factors driving technology feasibility or cost-effectiveness. Site-specific and technology-specific analyses are useful to evaluate the technical and/or economic feasibility of a specific technology at a specific site and allow for detailed technical and/or economic modeling, but do not necessarily yield broadly applicable results about that technology’s cost effectiveness at other sites, do not facilitate comparison across a portfolio of sites to identify sites with the best potential for cost savings or emissions reductions opportunities, and do not compare the costs and benefits of different technologies or discuss multi-energy integration to help prioritize the technology(ies) most appropriate for a particular site. On the other end of the spectrum, existing high-level screenings evaluating opportunities across different locations generally do not involve detailed technical, economic, and/or timeseries modeling and generally focus on one or two specific technologies. Existing high-level screenings evaluating opportunities across different processes within a given type of site (e.g., refinery) generally do not consider site specific or locational variations, such as renewable resources or energy prices.
Thus, this study seeks to bridge between high-level and site-specific analyses to present a methodology that facilitates portfolio-wide site screenings for nine different DERs while delving into the site-specific factors that drive resulting techno-economic feasibility. The methodology utilizes a now-open-source, timeseries model and mixed integer linear program (MILP) optimization to identify DER technology types and system sizes to maximize cost savings and to cost-optimally achieve various emission reductions targets. This software, called REopt®, and methodology, presented in this paper, could be used by oil and gas organizations, along with those in other energy-intensive industries, to screen a portfolio of sites and range of technologies for lowest-hanging fruit, while yielding detailed, site-specific results. Additionally, the analysis utilizes entirely publicly available data enabling this type of analysis without requiring proprietary data (though the methodology could be repeated with proprietary data to further enhance the site-specific accuracy of results). The analysis focuses on results for two specific case study sites in the United States (US) selected to highlight the locational drivers of project economics, such as energy costs, electric grid emissions rates, and renewable resources, and the importance in considering these factors.
This paper is organized as follows. We detail the models used, data sources, and scenarios explored in Section 2. Results from model runs are discussed in Section 3, including two different case studies: one where electric load is considered and another where thermal load is considered. Main factors explored include cost-optimal siting, resilience, emissions reductions, and cost of carbon. Finally, Section 4 offers conclusions and recommendations.
2 Materials and methods
This analysis evaluates distributed clean energy technologies at a hypothetical case study refinery in Gulf Coast Louisiana (LA) and in southern California (CA). These case study locations were selected based on a national screening of average industrial electricity costs and considering common refinery locations, local renewable resources, and regional grid emission rates, in order to highlight the impact of locational factors on project economics. Blended average industrial electricity rate data for regions across the US were compiled from forms EIA-861 (schedules 4A and 4D) and EIA-861S (EIA, 2019a) and mapped to shapefiles from the Homeland Infrastructure Foundation (HIFLD, 2019), with results summarized in Figure 1. Additionally, data about US refinery locations and capacities (EIA, 2019b) were used to manually select these two case study locations in areas with significant refinery capacity. Thus, the two case study sites “bookend” some of the highest and lowest industrial electricity costs in areas of the US with significant refinery capacity, and also have quite different electric grid emission rates and renewable energy resources.
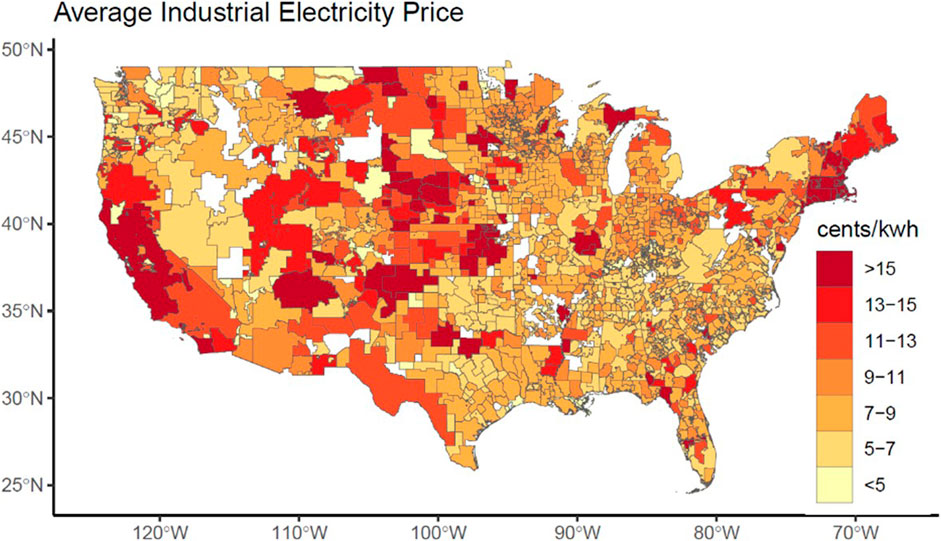
FIGURE 1. Industrial electricity prices in the United States.
NREL’s REopt tool (Cutler et al., 2017) and System Advisor Model (SAM) (NREL, 2020c) were used to evaluate the techno-economic potential for these clean energy technologies to support oil and gas operations in achieving energy goals including energy cost savings, resiliency, and emissions reductions. REopt was used to evaluate all technologies except solar thermal, which was modeled in SAM because REopt does not currently offer a solar steam model.
REopt is a techno-economic time series optimization model to support integrated distributed energy systems planning decisions. Formulated as a MILP, REopt identifies the cost-optimal mix of candidate technologies, their respective sizes, and dispatch strategy to minimize the present value of the lifecycle cost (LCC) of energy over the analysis period, including capital costs, operating expenses and utility purchases, and incentives and depreciation. Results also indicate the net present value (NPV) of each DER scenario. This value is calculated as the difference in LCC between the base case, where all electricity is provided by the grid and all heating by natural gas boiler, and the DER case, to give the lifecycle cost savings facilitated by the DERs. See Figure 2 characterizing the REopt model’s inputs and outputs. REopt has been used for the past 15 years to explore potential site-specific renewable energy deployment in the areas of microgrids and resilience, energy storage, electric vehicles, and the energy/water nexus, as examples (NREL, 2023). Detailed information on model logic and related equations can be found in the REopt documentation (Cutler et al., 2017).
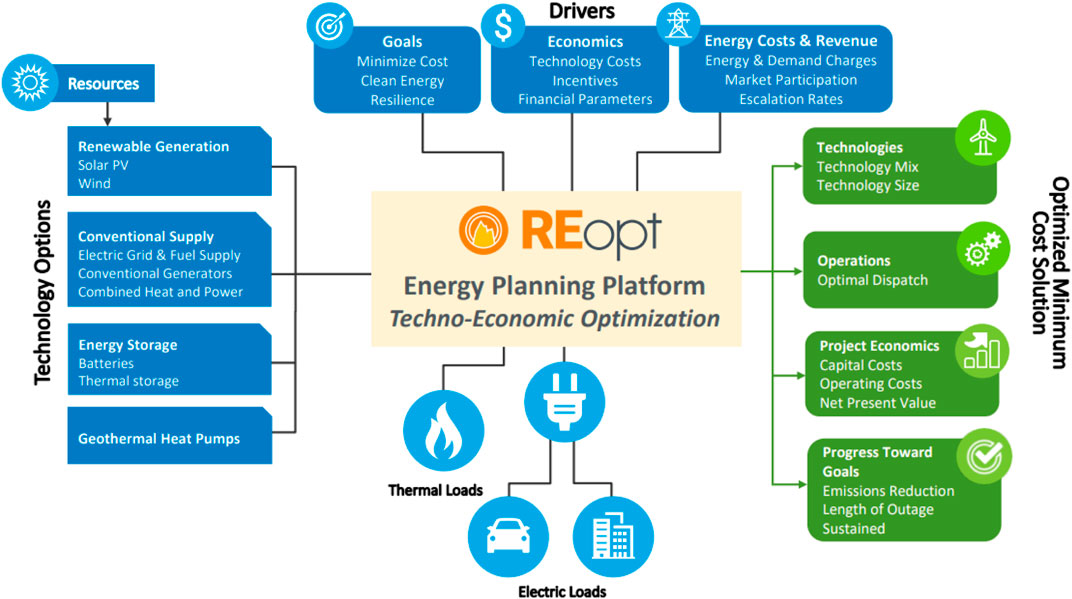
FIGURE 2. Schematic of REopt model inputs and outputs.
Modeled scenarios were developed around three priorities: energy cost savings, resilience, and emissions reductions:
• Energy cost savings: First, REopt was allowed to cost-optimally size each technology to minimize the LCC of energy. Solar PV, onshore wind turbines, and battery energy storage, evaluated to reduce electric grid purchases, were co-optimized to evaluate potential multi-energy integration, particularly given the temporal aspect of solar and wind resources. LFG, biomass, MSW, and solar steam for process heat were evaluated independently for their ability to reduce natural gas consumption for heat, though these technologies could also be considered for power generation and/or combined heat and power. These technologies were evaluated individually due to their reliance on availability of feedstock and non-temporal nature (solar steam excepted) but could be implemented in parallel with each other and/or the multi-energy electric systems comprised of the solar PV, wind, and battery storage systems evaluated separately. CHP was also evaluated individually for its ability to generate both heat and electricity. Finally, hydrogen generation by electrolyzer was evaluated as an option to electrify a process that typically relies on natural gas, with this increased electric load able to be served by the electric grid and by a multi-energy integrated solar PV, wind, and/or battery storage system.
• Resilience: Next, the ability of solar PV, wind turbines, and battery energy storage to collaboratively support the site in sustaining operations through an electric utility outage were evaluated against conventional backup electric generation options (diesel generators) for resiliency. Both resilience against short-duration (1–2 h outages) and longer-duration (24 h) outages were evaluated.
• Emissions reductions: Finally, various renewable energy targets were modeled, and the cost of achieving them with each set of candidate technologies was quantified, to identify the cost per ton of carbon dioxide equivalent (CO2e) for each technology and goal. Although most US states do not currently have a carbon market in place, the cost of carbon emissions reductions estimates can be used to inform organizational decisions around environmental impacts of operational emissions. In some cases, industry is setting their own internal cost of carbon and these values could be used to inform corporate decision-making independent of government policy. Emissions considered in this analysis fall into the categories of Scope 1 emissions—emissions produced from sources owned or controlled by the company—and Scope 2 emissions, emissions created by another entity producing energy that feeds into the company’s operations (such as the electric utility). Scope 3 emissions—emissions that can be directly tied to the company’s value chain (including customers’ consumption of fuels)—were not the focus for this analysis (EPA, 2015). This report focuses on the opportunities for DERs to support oil and gas operations; other measures that were not included, such as energy efficiency, reducing flaring, and carbon capture and sequestration (CCS), could also support efforts to reduce Scope 1 and 2 emissions.
Table 1 summarizes the scenarios evaluated.
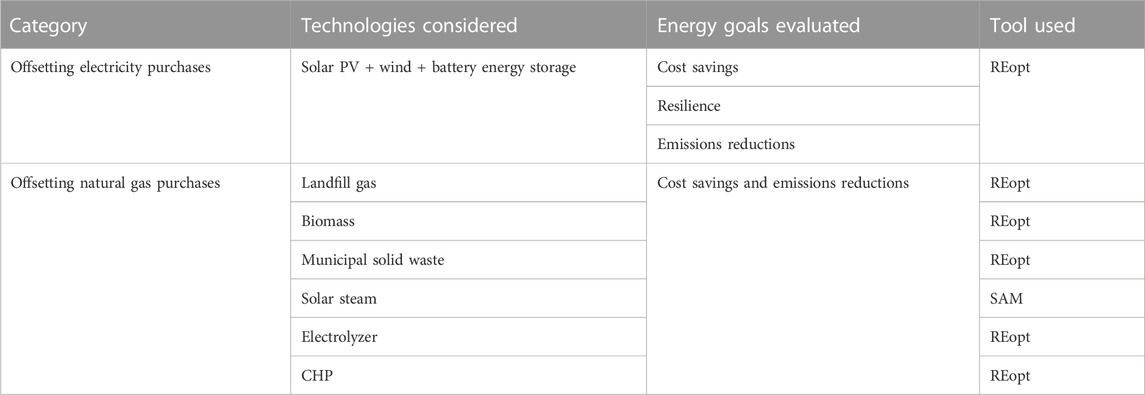
TABLE 1. Scenarios explored in this analysis.
The analysis uses only publicly available information in order to illuminate that although publicly available data does have gaps, useful insights can still be gained without using proprietary information. Such analysis can be used to help prioritize sites and technologies that appear to offer high potential for cost effective emissions reductions pathways.
However, this use of publicly available data also presents some inherent limitations. Analysis of more detailed actual site operational data may improve accuracy of results. Results should not be taken to be suggestive of the economics of these clean energy technologies at all refineries and well fields; technical and economic feasibility of clean energy technologies at a particular site should be assessed before making investment or implementation decisions. The analysis considers loads, resource, and generation at hourly intervals and does not capture intra-hourly variability. Furthermore, the analysis assumes all electric loads are billed at a single metering point. Land and roof area available for onsite energy generation and/or storage were assumed to be unlimited but may actually be limited, which would impact the feasibility of the solutions suggested in this analysis. Emissions modeling uses current average annual grid emissions rates, but future greening of grid generation could reduce the relative value that onsite renewables provide in the way of emissions reductions in the future, hence emissions reductions results being presented with a focus on near-term “Year One” emissions reductions relative to the base case scenario.
The electrical and steam consumption load for the case study refinery was approximated by overlaying refinery-specific process and output data from the US Energy Information Administration (EIA) Annual Refinery Capacity Report (EIA, 2019b) with process energy intensity data from the US Environmental Protection Agency’s (EPA) “Energy Efficiency Improvement and Cost Saving Opportunities for Petroleum Refineries” (Worrell et al., 2015). Because capacity utilization at oil refineries is largely independent of time of day or cost of energy, refinery electrical and steam loads, listed in Table 2, are assumed constant throughout all hours of the year. Although this case study is based on a refinery-specific product mix, the general premise of sizeable, relatively flat electrical and natural gas demand applies to most refineries regardless of the exact product mix. Annual CO2e emissions attributed to the electric and steam load are also noted in Table 2. Electric emissions were calculated from Emissions and Generation Resource Integrated Database (eGRID) regional grid emissions rates (EPA, 2020), which differ between the two case study locations. Steam emissions were calculated based on the modeled load profile, assuming steam is supplied by existing natural gas boilers with an efficiency of 77% in the base case and using the natural gas CO2 emissions factor from the EPA (EPA, 2021).
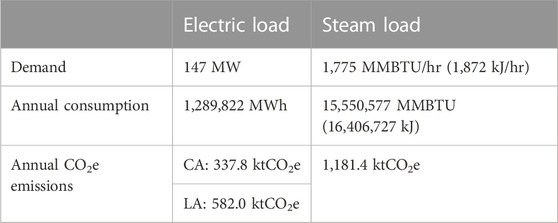
TABLE 2. Case study electric and steam consumption and emissions.
In the base case scenario, all electricity and natural gas is purchased from the respective utilities. The Louisiana refinery’s assumed electric rate, summarized in the Supplementary Material, has a low energy charge of $0.029/kWh and a tiered demand charge of $13.48/kW for demand up to 22 MW and $11.89/kW for demand exceeding 22 MW. Natural gas here is assumed to cost $2.763/MMBTU (EIA, 2020). The California refinery has a higher cost of electricity, summarized in the Supplementary Material, with a time-of-use (TOU) component to both the energy and demand charges: energy charges in the range of $0.05–0.13/kWh, a monthly TOU demand charge of up to $18.11/kW, and a monthly demand charge of $10.65/kW. Natural gas is also more expensive than in Louisiana, assumed to cost $4.519/MMBTU (EIA, 2020).
In addition to differences in local utility rates and electric grid emissions factors, the two sites have different renewable energy resources. The Louisiana site is assumed to have a solar capacity factor of 16.7% and a wind capacity factor of 19.3%, while the California site is assumed to have a solar capacity factor 19.3% and a wind capacity factor of 5.0%. These capacity factors are based on Typical Meteorological Year (TMY3) weather data from the National Solar Radiation Database (NSRDB) (Sengupta et al., 2018) for PV and the AWS Truepower database (Truepower, 2019) for wind. Note that wind resource and turbine performance are highly sensitive to topography and can vary significantly within a small area. The specific locations of the case study sites were selected based on actual refinery locations in order to evaluate opportunities for onsite technologies, which resulted in significantly lower wind capacity factors that would be commercially viable; thus, offsite clean energy generation options, sited to maximize renewable resources, could also be considered.
The analysis evaluates how these nine DERs—solar PV, wind, battery storage, LFG, biomass, MSW-to-energy, solar steam for process heat, CHP, and electrolyzers can support these loads in conjunction with the utility purchases assumed as the base case, considering these locational differences. See individual technology sections and Supplementary Material for additional techno-economic modeling assumptions.
3 Results
Results are broken out by which load (electric or thermal) the technology primarily serves. Section 3.1 describes how electricity generation technologies—solar PV, wind, and battery energy storage, which were co-optimized due to the temporal nature of solar and wind resource—can support cost savings, resilience, and emissions reduction targets. Section 3.2 steps through each technology that could offset natural gas consumption—LFG, biomass, MSW, solar steam for process heat, and electrolyzer for hydrogen generation—along with CHP, which can more efficiently utilize natural gas to generate both heat and electricity and describes each technology’s cost effectiveness in supporting various emissions reduction targets.
3.1 Case study refinery results—electricity-only generation
3.1.1 PV/wind/battery: cost-optimal sizing
Table 3 compares the LCC of electricity for the refinery in the base case (no onsite DERs) and in the cost-optimal case recommended by REopt. Due to the low cost of industrial rate grid electricity in Louisiana, no solar PV, wind turbines, or battery energy storage was recommended by REopt on a cost basis at the Louisiana refinery. However, the higher cost of grid electricity in California, combined with a stronger solar resource, make solar PV and battery cost-effective at the case study refinery in California. Results suggest that 570 MW-DC of solar PV plus ∼1,300 MWh, 170 MW (∼7.5 h duration) of battery storage could provide ∼$700M in lifecycle cost savings, a reduction of ∼24% relative to purchasing all electricity from the grid. In this case, the high PV capacity factor in California and high cost of electricity are driving results, with PV being largely oversized despite not receiving net metering compensation at this high capacity. The large battery inverter/rectifier is being sized even larger than the load in order to capture excess solar. Though the model could have selected to build wind, it did not appear cost effective to do so relative to the savings possible from solar PV plus storage. However, wind resource and performance are highly sensitive to topography, and given the low wind resource at this case study location (5.0% capacity factor) relative to wind resource in other southern California locations (capacity factors exceeding 50% within 50 miles of the case study site), offsite wind could also be considered and may become cost effective.
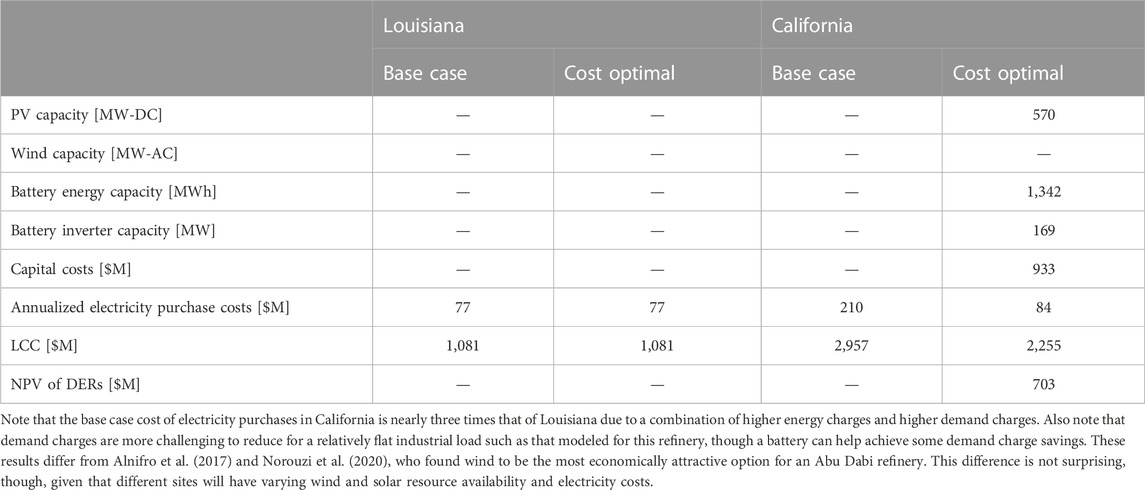
TABLE 3. Results: electricity—cost-optimal sizing.
3.1.2 PV/wind/battery: resilience
The economics of resiliency provided by renewables and battery storage were compared to that provided by a diesel backup generator for the refinery case study. The model requires that either the backup diesel generator or a renewable energy plus battery energy storage system can sustain the site’s full electric load for the entire modeled outage; in practice a hybrid system could also be considered. Tables 4, 5 show the identified sizing and economics of these two options at the Louisiana refinery and California refinery respectively, considering a longer “major” outage event and a shorter “minor” outage event. Two-hour outages were assumed typical for “minor” outages in both locations; “major” outages were assumed to last approximately 1 day in California and 2 days in Louisiana. The modeled outages are considered representative of average outage durations in the region (EIA, 2019a). To be conservative, modeled outages were assumed to occur at night during a period of no solar resource to increase the probability that the recommended system would be able to survive outages of similar length regardless of their timing. A negative NPV indicates some “cost of resilience” relative to the base case LCC presented in Table 2, which would not survive the modeled grid outages.
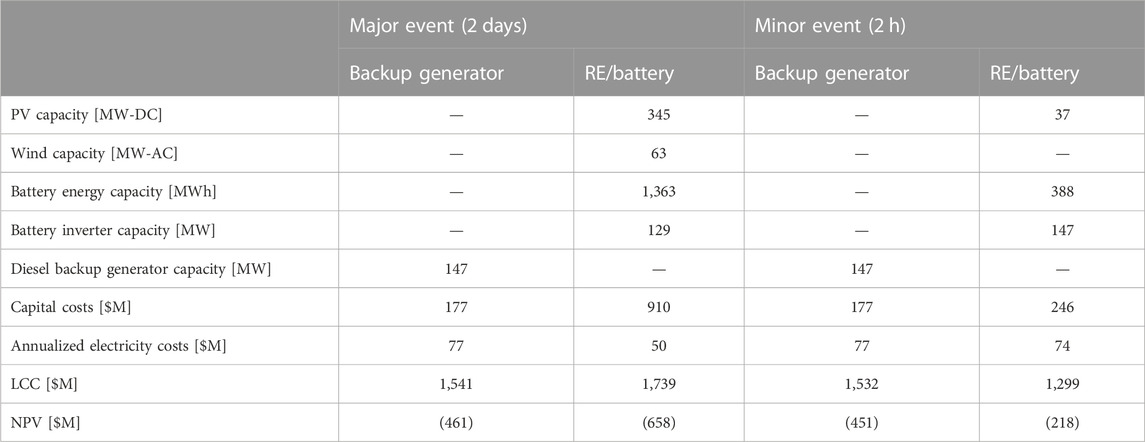
TABLE 4. Results: resiliency to electric grid outages—Louisiana.
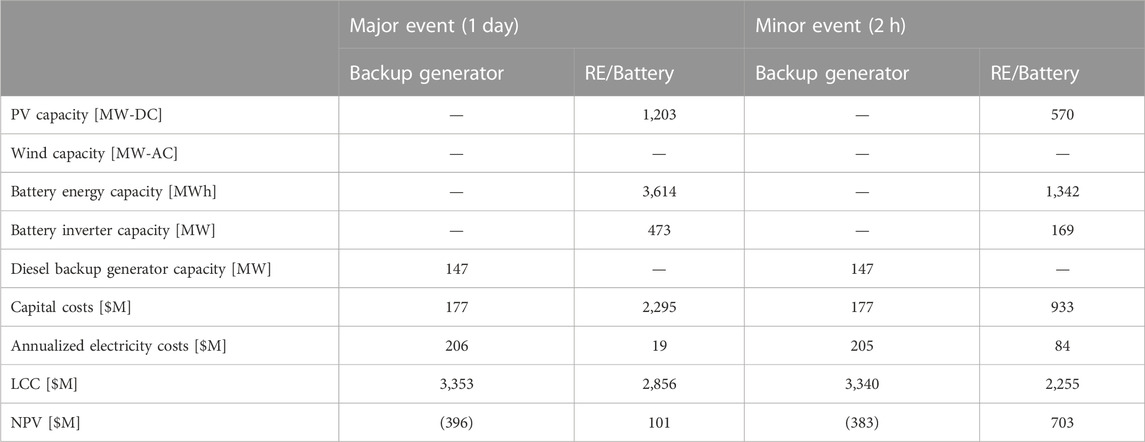
TABLE 5. Results: resiliency to electric grid outages—California.
At the Louisiana refinery, PV and battery storage could provide resilience at lower lifecycle cost than diesel backup for short-term grid outages because of their ability to also provide some electricity cost savings during normal grid-connected operations. The “cost of resilience,” shown in the results tables as a negative NPV, for the minor event is $218M with PV and battery storage compared to $451M with diesel backup. However, longer duration outages would require wind and much more PV and battery capacity to survive an extended outage. Thus, diesel backup appears more cost effective for longer duration events, with a cost of resilience of $461M compared to $659M for the PV, wind battery storage system. Additionally, the system sized for this scenario includes a battery inverter capacity of 129 MW because the modeled outage period evaluated had enough consistent wind blowing through the night to supplement the battery and cover the full 147 MW load; in practice the battery inverter would likely be sized to be able to cover the full load, further increasing costs.
At the California refinery, however, solar PV and battery appears to be a more cost-effective option than diesel for both short-duration and longer duration backup power due to the higher cost of electricity and fuel, and the cost savings they could provide year-round during normal grid-connected operations. In fact, the lifecycle cost savings provided throughout the year exceed the capital costs of the PV and battery storage, yielding a positive NPV for both outage scenarios. In the “major event” outage scenario, the battery inverter of 473 MW is much larger than the load in order to maximize use of the large PV system to reduce grid electricity purchases.
3.1.3 PV/wind/battery: emissions reductions
Next, the cost of Scope 2 emissions reductions associated with electric grid purchases was evaluated for various annual emissions reductions scenarios (20%, 40%, 60%, 80%, and 100%) at the two case study refineries. These emissions reduction percentages are relative to total Scope 2 emissions associated with electric grid purchases in the base case scenario. Note emissions accounting is based on the GHG Protocol Corporate Standard (Bhatia and Ranganathan, 2004), which allows companies to claim GHG emissions reductions for reducing their Scope 2 emissions but categorizes any excess renewable energy that is exported to the grid as “additional information” rather than counting as Scope 2 emissions reductions or Scope 1 emissions offsets.
In Louisiana, summarized in Table 6, solar PV appears to be the most cost-effective option for achieving emissions reduction targets of up to 20%. Additional PV, wind and battery are recommended to most cost effectively achieve emissions reductions of 40% or more. Although these higher penetrations of renewable electricity do not appear cost effective without placing some value on emissions reductions, the value of emissions reductions required to make the system cost effective, listed in the results table as “cost of emissions reductions,” is within the range of some existing carbon markets, up through 80% emissions reductions. For example, California’s Low Carbon Fuel Standard (LCFS) market has averaged ∼$200/tCO2 for 2019–2020 (California Air esources Board, 2019); although the LCFS market does not directly apply in Louisiana, it may be indicative of additional future markets. Bridging the gap from 80% to 100% emissions reductions becomes much more expensive as grid emissions essentially need to be reduced to zero by covering the entire electric load with onsite renewable generation. In Louisiana, a very large battery is being recommended to meet this goal.
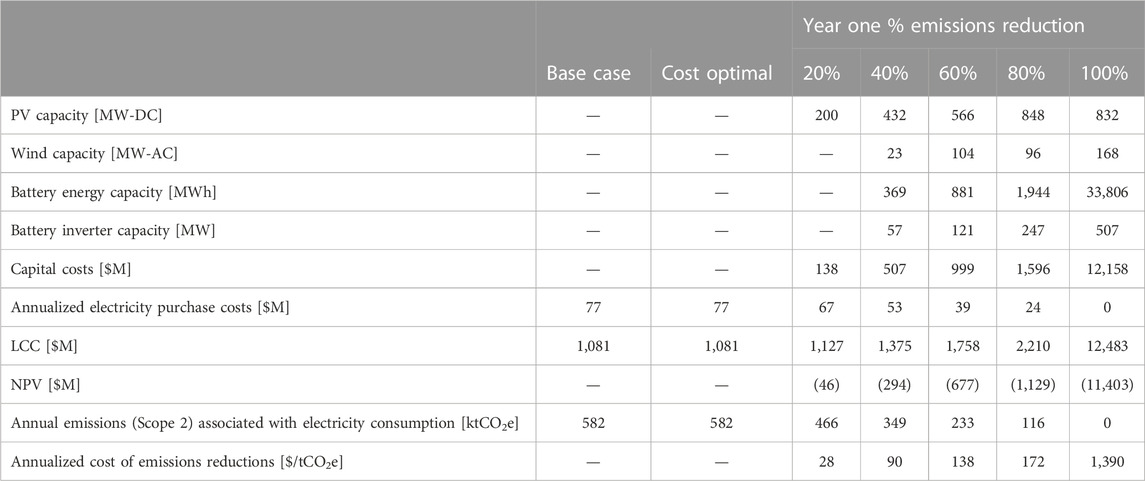
TABLE 6. Louisiana results: electricity—emissions reductions.
In California, summarized in Table 7, solar PV and battery storage are most cost effective at reducing emissions associated with electricity consumption. Due to high solar resource and lower wind resource combined with relative capital costs, wind is not being recommended at the California refinery even in the 100% renewable scenario. In line with the cost effectiveness of large solar PV and battery identified in Section 3.1.1, results suggest the opportunity to cost effectively reduce emissions by up to and potentially over 80% from the base case emissions even without considering a cost of carbon, as indicated by the negative cost of emissions reductions. For example, an 80% emissions reduction (again noting that this is relative to total scope 2 emissions associated with electric grid purchases) would provide $653M in NPV relative to the base case scenario of no onsite renewable energy. This is only $50M, or approximately 7%, lower NPV than that of the cost-optimal system without considering an emissions reduction target, $703M. As in Louisiana, bridging the gap from 80% to 100% emissions reductions is still quite expensive in California, albeit less so than Louisiana. For the California case study, likely driven by the slightly higher capacity factor of PV in this location, PV is being oversized and curtailed more so than the battery storage system.
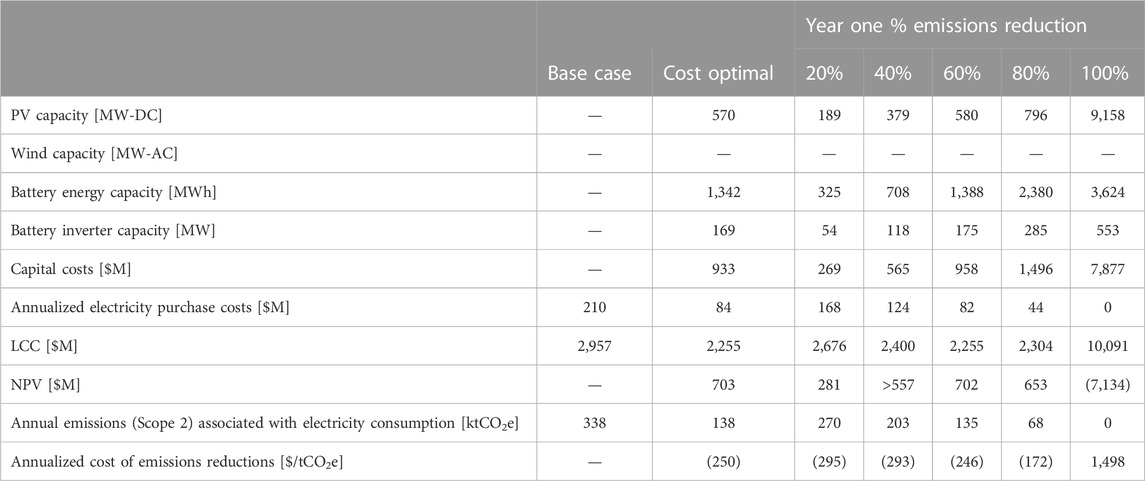
TABLE 7. California results: electricity—emissions reductions.
3.2 Case study refinery results—steam generation
Next, clean energy technologies for steam generation were evaluated for the two case study refinery locations. Technologies considered in this analysis include LFG (direct use), MSW (incineration), biomass, CHP, solar steam, and an electrolyzer for hydrogen production. These technologies were evaluated individually for their cost-effectiveness and ability to help reduce emissions, including Scope 1 emissions associated with natural gas consumption and Scope 2 emissions associated with grid electricity purchases.
Due to their categorization as renewable fuels, emissions associated with the combustion of LFG, MSW, and biomass are not counted towards the case study sites’ emissions in this analysis. Similarly, solar steam is considered free of Scope 1 and 2 emissions. CHP does incur emissions, but its generation can offset electric grid emissions as well. The electrolyzer can offset natural gas consumption but does require electricity, assumed to be provided by the electric grid and/or solar PV, wind, and/or battery energy storage in this analysis.
Tables 8, 9 summarize numerical results for these technologies, with additional discussion of economics, opportunities, and challenges for each technology’s application at a refinery included in the ensuing sections.
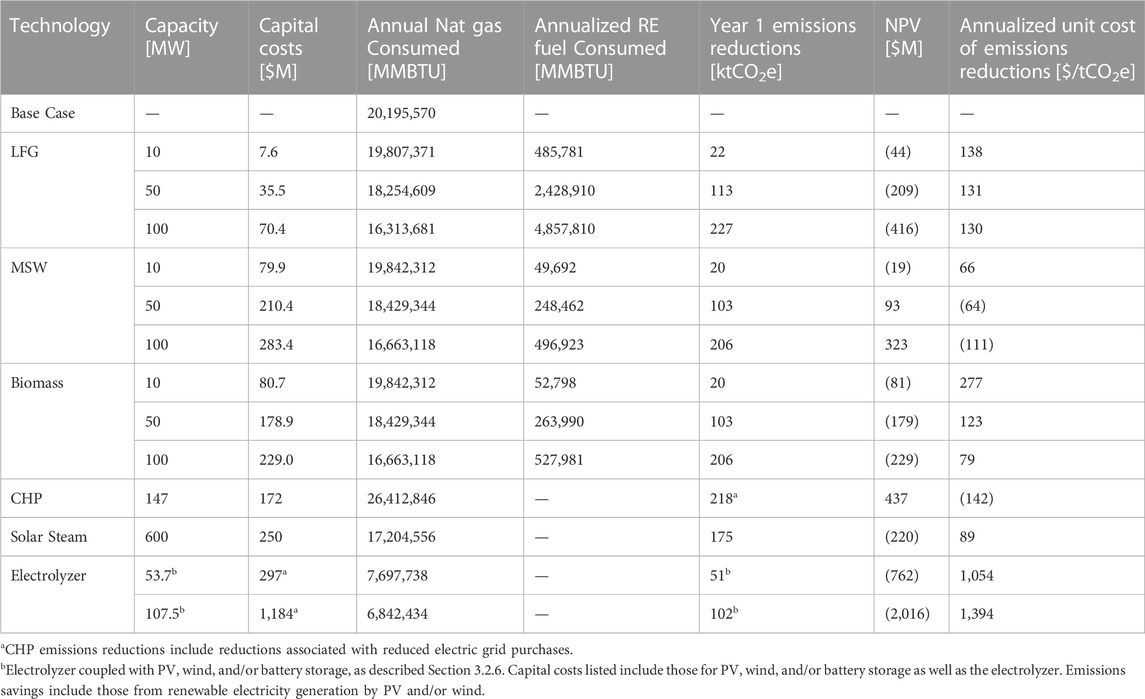
TABLE 8. Louisiana results: steam generation.
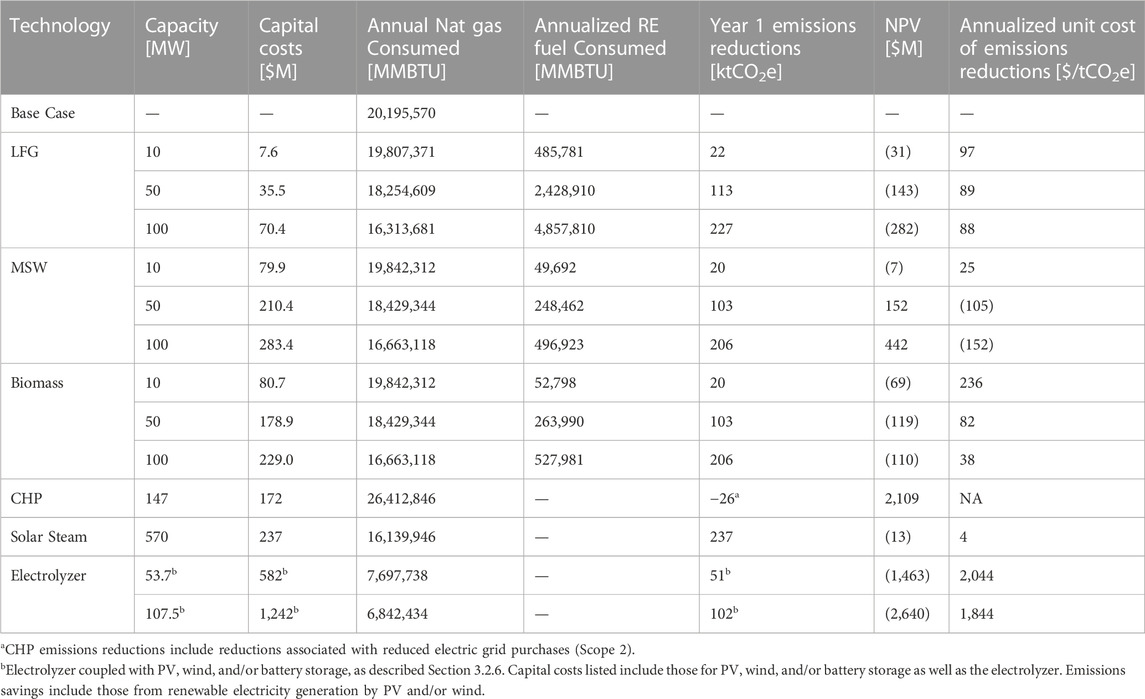
TABLE 9. California results: steam generation.
3.2.1 Landfill gas
Per the EPA, MSW landfills are the third largest human-generated source of methane emissions in the United States. LFG energy projects capture ∼60%–90% of the methane emitted from the landfill. Capturing the gas released from landfills is considered zero-emission in this analysis because it is creating a use for gas that would be emitted otherwise (EPA, 2016a). This gas can then be used to offset natural gas consumption for steam generation at refineries.
This study evaluated the ability of direct use of LFG to replace natural gas for steam generation. LFG does not appear to be a cost-effective option at either case study refinery location without placing some cost on carbon. Several landfill gas capacities—10 MW, 50 MW, and 100 MW—were evaluated, as summarized in Tables 7, 8, to better understand the economics of such projects. Note that most existing LFG projects are at the lower end of this size range, with many smaller than 10 MW (EPA, 2016b). In Louisiana, a cost of carbon in the range of ∼$130–140/tCO2e would be required to make LFG cost-effective. In California, this range decreases to ∼$90–100/tCO2e, due to the higher cost of natural gas. Both of these costs of carbon are less than California’s LCFS market which has averaged ∼$200/tCO2 for 2019–2020 (California Air Resources Board, 2019).
The option of introducing cogeneration of steam and electricity with LFG may provide additional value and improve the economics of LFG projects at a refinery. Note that one of the main challenges of introducing LFG projects is proximity to a landfill and the ability to pipe the landfill gas to the refinery itself. Due to piping requirements, landfill gas projects typically only work when the site where the landfill gas is converted to energy is within 10-15 miles of the landfill (EPA, 2012). For additional information about existing LFG projects, see the EPA’s Landfill Methane Outreach Program (LMOP) database (EPA, 2017).
3.2.2 Municipal solid waste
Direct use of MSW by incineration (mass burn) provides another option for clean thermal energy generation that avoids the landfill altogether. With this option, the site is paid to accept the MSW in what is known as a tipping fee; this analysis assumes the site is compensated with a tipping fee $44/ton (Cutler et al., 2017), though tipping fees vary across the United States (EREF, 2019). However, the main challenge with MSW-to-energy plants is procuring a contract for the feedstock waste. Additionally, capital costs for an MSW-to-energy conversion system are significantly higher than for LFG.
At both case study refineries, as summarized in Tables 7, 8, an MSW-to-energy system with capacity somewhere between 10 MW and 50 MW allows for economic breakeven, where capital costs are recovered by energy cost savings, even without placing a cost on carbon. Systems that are 50 MW and larger appear to provide a positive net present value. Even if a site has difficulty procuring a contract for sufficient MSW to power one of these larger MSW-to-energy plants, the cost of carbon required to make a smaller system cost effective is relatively low, at $66/tCO2e for a 10 MW system in Louisiana and $25/tCO2e for a 10 MW system in California.
3.2.3 Biomass
Woody biomass—such as forest residue, primary mill residue, and secondary mill residue—provides another clean energy alternative to natural gas consumption. The capital costs are on the same order of magnitude as MSW but have more opportunity for economies of scale. However, feedstock must be purchased rather than receiving a tipping fee as with MSW.
At the case study refineries evaluated, biomass does not appear to be cost effective without considering some cost of carbon. At the Louisiana case study refinery, a small (∼10 MW) biomass conversion system appears to be an expensive option, requiring a cost of carbon over $270/tCO2e. However, as the system size scales, the economics improve, with a 100 MW system only requiring a cost of carbon of ∼$80/tCO2e. At the California case study refinery, the cost of carbon required to make biomass a cost-effective option is lower; ∼$80/tCO2e for a 10 MW system and $25/tCO2e for a 100 MW system.
3.2.4 Combined heat and power
CHP cogeneration is a technology that concurrently produces power and thermal energy and is already being implemented in refineries. As a distributed generation resource, it can be sited near the point of consumption, allowing the heat that is normally lost during power generation to be recovered for local thermal energy needs. It is able to offset both grid-purchased electricity and fuel burned in an on-site boiler. CHP systems typically operate at 65%–85% efficiency overall and can take a variety of fuel sources, both fossil and renewable-based (DOE, 2017). It is a mature technology that has been widely deployed for industrial and large-scale commercial applications (DOE, 2020a; 2020b).
In this analysis, we modeled CHP as a gas turbine with a heat recovery system that generates saturated steam at pressures of 150 psig. Because the modeled refinery thermal load is 3.5 times greater than the electrical load and assuming that excess electricity exceeding the site’s annual electric load could not be sold back to the grid, the unit was sized to meet the full electrical demand. A CHP system of this size is able to supply a constant 32% of the refinery’s steam requirement during every hour of operation. It is assumed that the CHP system uses natural gas as fuel, and that the rest of the steam load will continue to be met by the existing on-site boilers.
CHP is cost effective at both locations, reducing total life-cycle costs by 19% and 44% in Louisiana and California respectively. Because the CHP system is sized to supply the full electrical load, all grid purchased electricity is replaced by on-site generation. Despite natural gas prices being higher in California than Louisiana, a larger life-cycle cost reduction is still seen in California as on-site natural gas generation is comparatively much cheaper than the local grid electricity. Furthermore, the size of the CHP unit necessary to meet large refinery loads allows the system to take advantage of the economies of scale and lower upfront capital costs.
Because the CHP system is primarily offsetting grid-purchased electricity with on-site natural gas generation, its impact on emissions is heavily dependent on the generation mix of the local electric grid. Due to the high emissions factor of the electric grid in Louisiana, CHP is able to reduce total site emissions by over 12%. This results in an annualized cost of emissions reduction of -$142/tCO2e, meaning the refinery saves money per ton of CO2e emissions avoided up to 218,000 tons. This is lower than the cost of emissions reduction through the installation of PV, wind, and battery energy storage at the Louisiana site to offset emissions from electricity consumption alone.
However, due to a higher renewable energy penetration, the emissions factor of the electric grid in California is nearly half of the emissions factor of the Louisiana grid. Switching to on-site natural gas generation results in higher emissions than purchasing directly from the grid in California. The cost to achieving the life-cycle savings at the California refinery site is a 1.7% increase in annual CO2e emissions, which may have other cost implications depending on future carbon market structures.
3.2.5 Solar steam
Another method for offsetting natural gas-generated steam at refineries is through the use of solar thermal technologies. Historically, solar thermal projects for industrial heat applications have not seen widespread deployment due to the relatively low competing natural gas prices. However, with falling solar field costs over the last decade, solar thermal energy is being considered for heat applications across various large-scale industries (Kurup and Turchi, 2015). A typical system comprises a collector field that harnesses solar radiation to heat a heat transfer fluid. The fluid is then circulated through a heat exchanger to supply an industrial process, for example, as hot water or steam. The system may be paired with thermal energy storage so that heat generated throughout the day can be used during nighttime hours.
Because most refinery processes do not have a direct use for heat and thermal energy is primarily needed in the form of steam, we modeled a solar thermal system that generates steam directly to feed into the main pipeline of the refinery without an intermediary heat transfer system. This solar thermal process is modeled using SAM’s Industrial Process Heat Linear Direct Steam module (NREL, 2020d). This model assumes a solar field of linear collectors is used to heat water to generate steam for direct thermal applications. However, because steam cannot be stored directly unlike heat, this system is only available during solar generation hours. Storage sizing was not considered in this analysis because systems large enough to take advantage of thermal storage would have extremely large space availability requirements. Mathematical equations for how the solar field of parabolic linear Fresnel concentrating collectors are modeled in this analysis to generate solar steam can be found in SAM documentation (NREL, 2020a).
Solar thermal was determined to not be cost-effective from a purely economic perspective at both modeled locations. To determine the impact on emissions, systems were sized so that the peak solar steam output over the year did not oversupply the site’s constant steam demand. A system of this size could meet 15%–20% of the annual steam load of the refinery depending on the solar resource profile at the modeled location. This is the maximum amount of steam generation the solar thermal system is able to offset without thermal energy storage. Additionally, the system was designed to output saturated steam at a pressure of 290 psig.
Due to lower natural gas prices and a poorer solar resource profile, solar steam is more expensive to integrate in Louisiana, increasing the refinery’s total life-cycle cost over a 25-year analysis period by nearly 10%. The maximum emissions reduction potential for a system in Louisiana without thermal energy storage is 15%, resulting in an annualized cost of emissions reduction of $89/tCO2e. This is comparable to the cost of emissions reduction using PV, wind, and battery energy storage at the 40% annual emissions reduction level for electricity without emissions reduction credit for renewable export.
Due to a higher solar capacity factor in southern California, a smaller solar steam system was sized to meet the same thermal demand, and the system is able to achieve a higher reduction in CO2 emissions of 20% compared to the Louisiana refinery. Impacts on life-cycle costs are much smaller, with a 0.3% increase over a 25-year analysis period, and the cost of emissions reduction is cheaper at $4/tCO2e. While this is more expensive than offsetting emissions from electricity use with PV, wind, and battery storage systems in California, because those systems are cost effective to install to offset high electricity prices without emissions considerations, it is still under California’s carbon market prices.
In addition to economics and emissions reductions targets, siting considerations should be taken into account as solar thermal technologies require the availability of land collocated with steam consumption.
3.2.6 Electrolyzer for hydrogen production
Hydrogen is an important intermediate product at refineries, required as input for many processes. It is typically generated through the steam reforming process using natural gas, where energy is required in the form of fuel to heat the reformer, steam for the reaction processes, and electricity for the compression (Worrell et al., 2015). In this analysis, we modeled the emissions reduction potential of replacing the steam reforming process with hydrogen generation from renewable resources using an electrolyzer.
Electrolyzers employ an electric current to split water molecules into hydrogen and oxygen. They perform a stable electrochemical reaction without additional inputs, and the process can be made emissions-free depending on the source of electricity. Electrolyzers are still considered an emerging technology that are not widely deployed for industrial applications due to their high energy intensity and large capital costs.
In the modeled refinery load, hydrogen production occurs at a rate of 9,843 kg/h, and accounts for 2.2% of the total hourly electric load and 24.2% of the hourly fuel consumption (see Supplementary Material for a detailed breakdown of the load profile). The modeled electrolyzer requires 54.6 kWh of electricity to generate each kilogram of hydrogen (see Supplementary Material for additional electrolyzer technology assumptions). Due to the high hourly hydrogen demand, fully supplying the hydrogen load with an electrolyzer would add 537 MW of electrical load, more than quadrupling the current electrical demand of the refinery.
Furthermore, if this electricity is purchased directly from the grid, in either the Louisiana or California locations, total site emissions would increase significantly due to the high energy intensity of the process and grid emissions factors. The new electrical load must be supplied from renewable sources in order for the electrolyzer to offset emissions. However, attempting to offset the full electrolyzer energy demand with only renewable energy would potentially be infeasible due to land availability constraints. Tables 7, 8 show the cost and emissions impacts of offsetting 10%–20% of the refinery’s hydrogen production with an electrolyzer. Each 10% increment corresponds to approximately 50 tCO2e emissions reduced.
The results show that large renewable energy systems are required to offset a relatively low percentage of CO2 emissions from hydrogen production due to the high energy intensity of the electrolyzer. System sizes grow quickly with the percentage of emissions reduced. At approximately $1,000–2,000/tCO2e, the cost of offsetting CO2 emissions with an electrolyzer is significantly higher than most emissions reduction scenarios using other technologies. However, this technology could become more economically viable over time as grid electricity gets greener and electrolyzers become more efficient, less expensive, and more commercialized.
3.3 Synthesis of case study results
Table 10 summarizes the cost effectiveness of the technologies evaluated or cost of carbon required to make a technology cost-effective. A cost of $0/tCO2e indicates that the technology is cost-effective and can provide cost savings at the site, without requiring any external value to be placed on emissions reductions. Because this report evaluates a range of scenarios, the “Low” and “High” indicators suggest the lowest and highest cost of carbon identified as necessary to make a technology cost-effective. For example, for the electrical technologies evaluated for cost effectiveness and to achieve 20%, 40%, 60%, 80%, and 100% emissions reduction, the lower end is the most cost-effective option and the highest end is the 100% emissions reduction. For technologies offsetting natural gas consumption, numbers are indicated for the system sizes described in the report. “N/A” (not applicable) indicates that because the technology did not appear in any of the scenarios evaluated at that site, cost of carbon estimates are not available in this analysis.
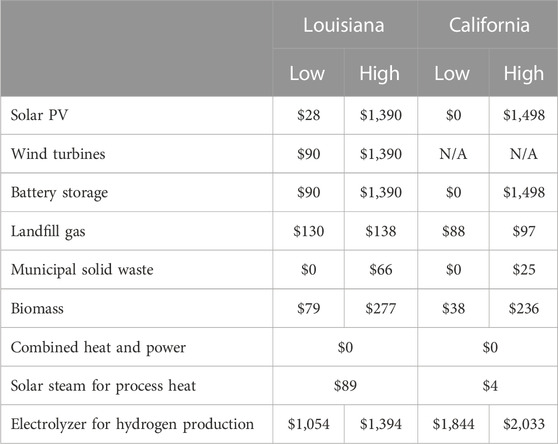
TABLE 10. Estimated cost of carbon required to make a technology cost-effective [$/tCO2e].
These case studies are meant to estimate each technology’s relative techno-economic effectiveness at helping oil and gas organizations achieve emissions reductions goals at refineries. General takeaways, along with challenges and driving factors, are summarized below:
• Solar PV, wind, and battery: Locational factors such as solar and wind resource and cost of electricity significantly impact the economics of solar PV and wind energy for these industrial applications. These technologies, and solar PV in particular, appear to have high potential to reduce emissions cost-effectively, but challenges include low cost of electricity on industrial utility rates and the flat load that makes reducing demand charges challenging. Due to the sensitivity of wind energy to topography and that wind resource can vary considerably even within a few miles, offsite wind turbines could be evaluated for cost effectiveness. Siting requirements may pose a challenge for solar PV or wind, for both land availability and potential electrical integration upgrades required for high penetrations of behind-the-meter renewables. However, if there is sufficient land, roof, and/or carport area located onsite, these technologies can also help sites become more resilient to electric grid outages.
• LFG, MSW, and biomass: These thermal technologies’ cost effectiveness will also vary based on proximity and access to a fuel source, such as a landfill, waste facility, or biomass. If a site had equal access to all three, MSW appears to be the most cost effective because the analysis assumes the site is paid to take the waste. Next most cost-effective is biomass followed by LFG.
• CHP: CHP systems are increasingly being implemented in refineries. This analysis suggests high potential for CHP, though the technical details of effective CHP configurations must consider process-specific steam requirements and the timing of these loads.
• Solar steam: Solar steam appears to have potential to reduce emissions in locations with high solar resource but does have high co-located land use requirements.
• Electrolyzer for hydrogen production: Hydrogen production via electrolyzer currently appears to be an expensive route to reducing emissions on a $/tCO2e basis but should be reviewed as costs continue to decline.
4 Discussion
This article describes the potential for onsite solar PV, distributed wind, battery storage, LFG, MSW-to-energy, biomass, CHP, solar steam, and electrolyzers for hydrogen production to reduce costs, support resilience goals, and/or reduce Scope 1 and 2 greenhouse gas emissions at hypothetical refineries. The results indicate cost beneficial opportunities for use of renewable energy for refining, especially for resilience, depending on local conditions such as resources and utility costs. While the case studies focused on refining, the results indicate that industrial processes broadly may benefit from onsite renewable energy, although modeling and cost analysis for these applications is needed.
Although this analysis focuses on distributed clean energy generation and storage alternatives to electricity and natural gas, other opportunities to reduce emissions include direct carbon capture and sequestration, reducing flaring, purchasing carbon offsets, and offsite power purchase agreements. The costs of emissions reductions presented in this report should be considered in the context of the costs of these additional options to help prioritize pathways; a comprehensive clean energy plan likely includes a mix of measures. Future modeling is needed to assess scenarios across multiple sensitivities, including price variation of fuels and power, varying degrees of power disruptions, and applicability across different locations, including international.
The oil and gas industry contributes approximately 42% of all human-made greenhouse gas emissions of which 20% are related to operations (Beck et al., 2020). Increasing economic, social, and governance pressures are focused on reducing these emissions. This report demonstrates that the oil and gas industry has enormous potential to decarbonize and that DERs can play a significant role in the decarbonization of the industry’s operations while improving the economics and resilience of their systems.
Data availability statement
The original contributions presented in the study are included in the article/Supplementary Material, further inquiries can be directed to the corresponding author.
Author contributions
KK: methodology, investigation, data curation, formal analysis, visualization, writing–original draft, writing–review and editing. SE: methodology, investigation, data curation, formal analysis, visualization, writing–original draft. XL: methodology, investigation, data curation, formal analysis, writing–original draft. OO: investigation, data curation. RC: investigation, data curation. EN: conceptualization, methodology, writing–review and editing, supervision, project administration, funding acquisition. JE-C: supervision, writing–review and editing, funding acquisition. All authors contributed to the article and approved the submitted version.
Funding
This work was conducted by the Joint Institute for Strategic Energy Analysis and was authored in part by the National Renewable Energy Laboratory, operated by Alliance for Sustainable Energy, LLC, for the U.S. Department of Energy (DOE) under Contract No. DE-AC36-08GO28308. Funding was provided by U.S. Department of Energy Office of Energy Efficiency and Renewable Energy Strategic Analysis Office.
Acknowledgments
The authors acknowledge Paul Spitsen and Sarah Garman of the U.S. Department of Energy (DOE) for their support of this work through the Joint Institute for Strategic Energy Analysis (JISEA). Additionally, the authors are grateful for the expertise and feedback provided by partner organizations involved in JISEA’s Clean Power in Oil & Gas Consortium—Baker Hughes, ConocoPhillips, Extraction Oil & Gas, INGAA Foundation, and Kinder Morgan. Valuable reviews, in addition to those listed above, were provided by Emma Elgqvist, Dylan Cutler, and Kate Anderson. Additionally, the authors are grateful for the support provided through Colorado School of Mines’ Advanced Energy Systems graduate program.
Conflict of interest
The authors declare that the research was conducted in the absence of any commercial or financial relationships that could be construed as a potential conflict of interest.
Publisher’s note
All claims expressed in this article are solely those of the authors and do not necessarily represent those of their affiliated organizations, or those of the publisher, the editors and the reviewers. Any product that may be evaluated in this article, or claim that may be made by its manufacturer, is not guaranteed or endorsed by the publisher.
Author disclaimer
The views expressed in the article do not necessarily represent the views of the DOE or the U.S. Government or sponsors. The U.S. Government retains and the publisher, by accepting the article for publication, acknowledges that the U.S. Government retains a non-exclusive, paid-up, irrevocable, worldwide license to publish or reproduce the published form of this work, or allow others to do so, for U.S. Government purposes.
Supplementary material
The Supplementary Material for this article can be found online at: https://www.frontiersin.org/articles/10.3389/fenrg.2023.1244010/full#supplementary-material
References
Absi Halabi, M., Al-Qattan, A., and Al-Otaibi, A. (2015). Application of solar energy in the oil industry—current status and future prospects. Renew. Sustain. Energy Rev. 43, 296–314. doi:10.1016/j.rser.2014.11.030
Alnifro, M., Taqvi, S. T., Ahmad, M. S., Bensaida, K., and Elkamel, A. (2017). Optimal renewable energy integration into refinery with CO2 emissions consideration: an economic feasibility study. IOP Conf. Ser. Earth Environ. Sci. 83, 012018. doi:10.1088/1755-1315/83/1/012018
Beck, C., Rashidbeigi, S., Roelofsen, O., and Speelman, E. (2020). The future is now: how oil and gas companies can decarbonize. McKinsey & Company. Available at: https://www.mckinsey.com/industries/oil-and-gas/our-insights/the-future-is-now-how-oil-and-gas-companies-can-decarbonize.
Besta, S. (2019). Five major oil and gas firms that have set greenhouse gas emissions targets. Available at: https://www.nsenergybusiness.com/features/oil-firms-greenhouse-gas-emissions-targets/.
Bhatia, P., and Ranganathan, J. (2004). World business council for sustainable development. World Resour. Inst.
California Air Resources Board (2019). Performance of the low carbon fuel standard. Available at: https://ww3.arb.ca.gov/fuels/lcfs/dashboard/dashboard.htm.
Cutler, D., Olis, D., Elgqvist, E., Li, X., Laws, N., DiOrio, N., et al. (2017). REopt: a platform for energy system integration and optimization. Renew. Energy 75. doi:10.2172/1395453
DOE (2017). Overview of CHP technologies, combined heat and power technology fact sheet series. USA: US DOE.
DOE (2020a). U.S. Department of energy combined heat and power installation database. Available at: https://doe.icfwebservices.com/chpdb/.
DOE (2020b). State of CHP in all 50 states | better buildings initiative. Available at: https://betterbuildingssolutioncenter.energy.gov/chp/state-chp-all-50-states.
DSIRE (2020). DSIRE. Available at: https://programs.dsireusa.org/system/program/detail/658.
EIA (2019a). Annual electric power industry report, form EIA-861 detailed data files. Available at: https://www.eia.gov/electricity/data/eia861/.
Elson, A., Tidball, R., and Hampson, A. (2015). Waste heat to power market assessment (No. ORNL/TM-2014/620). Oak ridge national lab. (ORNL), oak ridge, TN (United States). Building technologies research and integration center (BTRIC). United States: EERE. doi:10.2172/1185773
EPA (2012). Landfill gas energy: a Guide to developing and implementing greenhouse gas reduction programs. Local Gov. Clim. Energy Strategy Guid.
EPA (2015). Greenhouse gases at EPA. Available at: https://www.epa.gov/greeningepa/greenhouse-gases-epa.
EPA (2016a). Benefits of landfill gas energy projects. Available at: https://www.epa.gov/lmop/benefits-landfill-gas-energy-projects.
EPA (2016b). LMOP landfill and project database. Available at: https://www.epa.gov/lmop/lmop-landfill-and-project-database.
EPA (2017). Landfill gas energy project data. Available at: https://www.epa.gov/lmop/landfill-gas-energy-project-data.
EPA (2018). Inventory of U.S. Greenhouse gas emissions and sinks (No. EPA 430-R-18-003). Environ. Prot. Agency.
EPA (2021). Emission factors for greenhouse gas inventories. Available at: https://www.epa.gov/system/files/documents/2023-04/emission-factors_sept2021.pdf.
Ericson, S., Engel-Cox, J., and Arent, D. (2019). Approaches for integrating renewable energy technologies in oil and gas operations. Colorado, USA: The Joint Institute for Strategic Energy Analysis.
Forbes-Cable, M. (2019). Why power oil and gas platforms with renewables? Wood Mackenzie. Available at: https://www.woodmac.com/news/feature/why-power-oil-and-gas-platforms-with-renewables/.
Gargett, P., Hall, S., and Kar, J. (2019). Toward a net-zero future: decarbonizing upstream oil and gas operations.
GE (2020). 7F.04 gas turbine | 7FA turbine | GE power. Available at: https://www.ge.com/power/gas/gas-turbines/7f-04 (Accessed June 1, 2021).
He, W., Uhlen, K., Hadiya, M., Chen, Z., Shi, G., and del Rio, E. (2013). Case study of integrating an offshore wind farm with offshore oil and gas platforms and with an onshore electrical grid [WWW document]. J. Renew. Energy. doi:10.1155/2013/607165
HIFLD (2019). Homeland infrastructure foundation-level data (HIFLD). Available at: https://hifld-geoplatform.opendata.arcgis.com/.
Kialashaki, A., Gupta, Y., and Reddy, A. (2016). Solar jack emerging technologies technical assessment. doi:10.13140/RG.2.2.16142.36166
Korpas, M., Warland, L., He, W., and Tande, J. (2012). A case-study on offshore wind power supply to oil and gas rigs. Energy Procedia 24, 18–26. doi:10.1016/j.egypro.2012.06.082
Krah, K., Ericson, S., Li, X., Olawale, W., Castillo, R., Newes, E., et al. (2020).Opportunities for clean energy in natural gas well operations, 2020 IEEE International Systems Conference (SysCon). Presented at the 2020 IEEE International Systems Conference (SysCon), Sep 26, 2020, USA. IEEE, 1–7. doi:10.1109/SysCon47679.2020.9275853
Kurup, P., and Turchi, C. (2015). Initial investigation into the potential of CSP industrial process heat for the southwest United States.
Norouzi, N., Kalantari, G., and Talebi, S. (2020). Combination of renewable energy in the refinery, with carbon emissions approach. Biointerface Res. Appl. Chem. 10 (4), 5780–5786. doi:10.33263/BRIAC104.780786
NREL (2020a). H2A: hydrogen analysis production case studies. Availble at: https://www.nrel.gov/hydrogen/h2a-production-case-studies.html.
NREL (2020d). System advisor model version 2020.11.29 (SAM 2020.11.29) user documentation. IPH linear direct steam. Natl. Renew. Energy Lab.
NREL (2023). REopt publications. Available at: https://reopt.nrel.gov/publications.html.
OGCI (2020). Oil & gas climate initiative. Available at: https://oilandgasclimateinitiative.com/.
Orrell, A., Preziuso, D., Foster, N., Morris, S., and Homer, J. (2018). Distributed wind market report. Pac. Northwest Natl. Lab. doi:10.2172/1559880
Patsios, C., Wu, B., Chatzinikolaou, E., Rogers, D. J., Wade, N., Brandon, N. P., et al. (2016). An integrated approach for the analysis and control of grid connected energy storage systems. J. Energy Storage 5, 48–61. doi:10.1016/j.est.2015.11.011
Roy, S. (2020). The oil and gas industry’s path to net zero emissions. Infosys. Available at: https://www.infosys.com/insights/industry-stories/oil-gas-industry.html (Accessed June 1, 2021).
Sengupta, M., Xie, Y., Lopez, A., Habte, A., Maclaurin, G., and Shelby, J. (2018). The national solar radiation data base (NSRDB). Renew. Sustain. Energy Rev. 89, 51–60. doi:10.1016/j.rser.2018.03.003
Seo, H., and Bienkowski, B. (2020). Major oil and gas companies join program to track and cut methane emissions. Available at: https://www.greenbiz.com/article/major-oil-and-gas-companies-join-program-track-and-cut-methane-emissions.
Shojaeddini, E., Naimoli, S., Ladislaw, S., and Bazilian, M. (2019). Oil and gas company strategies regarding the energy transition. Prog. Energy 1, 012001. doi:10.1088/2516-1083/ab2503
Taqvi, S., Almansoori, A., and Elkamel, A. (2021). Optimal renewable energy integration into the process industry using multi-energy hub approach with economic and environmental considerations: refinery-wide case study. Comput. Chem. Eng. 151, 107345. doi:10.1016/j.compchemeng.2021.107345
Truepower (2019). AWS truepower, a UL company. Available at: https://aws-dewi.ul.com/.
Wang, J., O’Donnell, J., and Brandt, A. (2017). Potential solar energy use in the global petroleum sector. Energy 118, 884–892. doi:10.1016/j.energy.2016.10.107
Wood (2019). U.S. Energy storage monitor: Q3 2019 full report. Wood Mackenzie Power & Renewables Energy Storage Assoc.
Worrell, E., Corsten, M., and Galitsky, C. (2015). Energy efficiency improvement and cost saving opportunities for petroleum refineries: an ENERGY STAR® Guide for energy and plant Managers (No. 430- R-15– 002). ENERGY STAR. U.S. Environ. Prot. Agency Program.
Xin, S., Liang, H., Hu, B., and Li, K. (2012). “Electrical power generation from low temperature Co-produced geothermal resources at huabei oilfield,” in Proceedings, thirty-seventh workshop on geothermal reservoir engineering. Presented at the workshop on geothermal reservoir engineering (Stanford, California: Stanford University), 6.
Keywords: refineries, techno-economic analysis, optimization, integration, distributed energy resources, clean energy, resilience
Citation: Krah K, Ericson S, Li X, Olawale OW, Castillo R, Newes E and Engel-Cox J (2023) Distributed clean energy opportunities for US oil refinery operations. Front. Energy Res. 11:1244010. doi: 10.3389/fenrg.2023.1244010
Received: 21 June 2023; Accepted: 15 September 2023;
Published: 03 November 2023.
Edited by:
Hugo Morais, University of Lisbon, PortugalReviewed by:
Hadi Farabi-Asl, Chalmers University of Technology, SwedenMobi Mathew, Rajiv Gandhi Institute of Petroleum Technology, India
Copyright © 2023 Krah, Ericson, Li, Olawale, Castillo, Newes and Engel-Cox. This is an open-access article distributed under the terms of the Creative Commons Attribution License (CC BY). The use, distribution or reproduction in other forums is permitted, provided the original author(s) and the copyright owner(s) are credited and that the original publication in this journal is cited, in accordance with accepted academic practice. No use, distribution or reproduction is permitted which does not comply with these terms.
*Correspondence: Emily Newes, emily.newes@nrel.gov