Subsurface structural control of geothermal resources in a magmatic rift: gravity and magnetic study of the Tulu Moye geothermal prospect, Main Ethiopian Rift
 Wubamlak Nigussie1*
  Abera Alemu2
  Kevin Mickus3
  Derek Keir4,5
  Zelalem Demissie6
  Yoseph Muhabaw1,7
  Ameha A. Muluneh2,8
  Giacomo Corti9
  Esubalew Yehualaw10
- 1School of Earth Sciences, Bahir Dar University, Bahir Dar, Ethiopia
- 2School of Earth Sciences, Addis Ababa University, Addis Ababa, Ethiopia
- 3Department of Geosciences, Missouri State University, Springfield, MA, United States
- 4School of Ocean and Earth Science, University of Southampton, Southampton, United Kingdom
- 5Dipartimento di Scienze Della Terra, Università Degli Studi di Firenze, Florence, Italy
- 6Department of Geology, Wichita State University, Wichita, KS, United States
- 7Department of Earth and Environmental Sciences, University of Rochester, Rochester, NY, United States
- 8Helmholtz Centre Potsdam, GFZ German Research Centre for Geosciences, Potsdam, Germany
- 9Consiglio Nazionale Delle Ricerche, Istituto di Geoscienze e Georisorse, Firenze, Italy
- 10Department of Geothermal Energy, Ministry of Mine and Energy, Addis Ababa, Ethiopia
Since the Quaternary, extension and magmatism in the Main Ethiopian Rift (MER) have been mainly focused into narrow magmatic segments that have numerous volcanic centers and caldera collapses that offer favorable conditions for the occurrence of geothermal resources. However, the subsurface structure of the volcanic systems (0–10 km) and their link to the distribution of shallow geothermal resources remain unclear. To investigate the role of subsurface structures on the occurrence of these resources, we conducted gravity and magnetic studies combined with geological constraints within the Tulu Moye Geothermal Prospect (TMGP), one of the current geothermal prospects in the central MER associated with caldera collapses. Gravity data from the Global Gravity Model plus (GGMplus 2013) and ground magnetic data transformed into residual and derivative maps reveal that shallow magmatic intrusions occur under the volcanic centers (Tulu Moye, Bora, and Bericha). Our interpretation along with recent magnetotelluric model suggests that only the intrusion beneath Tulu Moye is currently magmatically active and includes partial melt, consistent with it being a primary heat source for the geothermal system. A new caldera formation model is proposed where the TMGP hosts an older large caldera (about 25 km diameter) within which there are several smaller nested caldera systems associated with the Bora, Bericha, and Tulu Moye volcanoes. Along with existing geologic, seismic, and magnetotelluric studies, our gravity and magnetic analysis indicate the interaction between NNE-SSW (rift-parallel) and NW-SE (cross-rift) trending faults, along with shallow magmatic intrusions and caldera systems, suggesting that such a large geothermal system is possible under these conditions.
1 Introduction
Geothermal energy is a carbon-neutral source of energy and continental rifts are among the best candidates for hosting these resources (King and Metcalf, 2013; Samrock et al., 2015). The occurrences of geothermal resources within volcanically and tectonically active rift zones are commonly controlled by subsurface geological structures (Omenda, 1998; Teklemariam, 2011; Hutchison et al., 2015). However, the nature of these features is often not clearly understood using surface geology alone, and commonly requires modeling and interpretation from geophysical data (Hutchison et al., 2015; Reinsch et al., 2017; Wilks et al., 2017; Mulugeta et al., 2021).
The East Africa Rift System (EARS) is the largest continental rift on Earth and is a region of major geothermal potential (Varet et al., 2020), with the rift segments of Ethiopia being especially rich (Teklemariam, 2011; Samrock et al., 2015; Varet et al., 2020; Burnside et al., 2021). Varet et al. (2020) showed that the largest geothermal sites in the EARS are Olkaria in Kenya, Tulu Moye (TM) Geothermal Prospect (TMGP) in the Main Ethiopian Rift (MER), and Era Boru in Afar, with all of these geothermal sites being located within the most volcanically and tectonically active regions. Ethiopia has an estimated geothermal energy potential of over 1,000 MW which is more than double of its current power generating capacity from all other sources including hydropower (Burnside et al., 2021).
More than 31 volcanoes hosting hydrothermal systems with the potential to generate geothermal power have been reported along the MER (Greenfield et al., 2019). Geological and geophysical studies in the MER suggest that the greatest melt supply (Kendall et al., 2006; Abebe et al., 2007; Bastow et al., 2010) and geothermal potential (Varet et al., 2020) lies in the central and northern MER between the Aluto and Dofan volcanoes. This sector of the rift includes the TMGP, the largest geothermal site within the MER (Varet et al., 2020). The TMGP consists of several Quaternary-Recent caldera-forming volcanic centers (Gedemsa, Geregendi, Tulu Moye, Boku, and Bora) (Figure 1) with various surface manifestations (fumaroles, steaming, and thermally-altered ground) (Varet and Birba, 2018). Ground deformation detected by an InSAR analysis at Tulu Moye (Biggs et al., 2011; Albino and Biggs, 2021; Kebede et al., 2023) indicated that magmatic processes (e.g., continuous pressurization of large magmatic reservoirs) are ongoing.
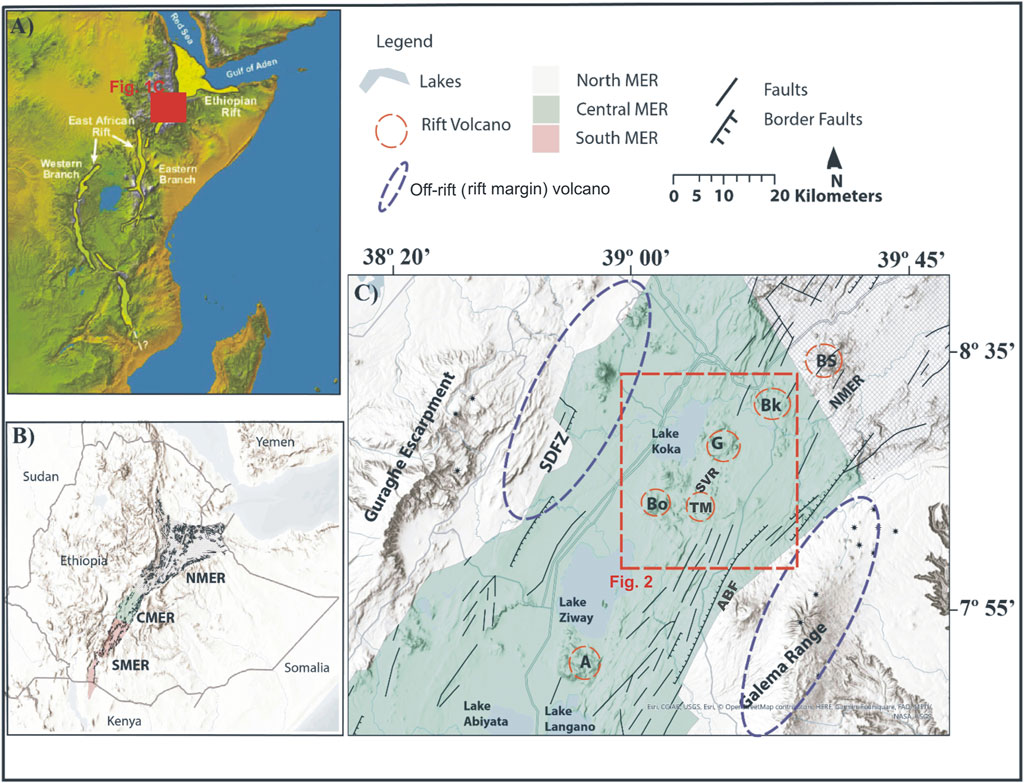
FIGURE 1. (A) Location of the study area (red square) in the frame of the East African Rift (EARS), marked in light yellow. (B) Map of the Main Ethiopian Rift (MER) showing its three different segments: southern MER-SMER, central MER-CMER and northern MER-NMER represented by red, blue and grey colors, respectively. (C) Structural map of the northern CMER-southern NMER which indicated the study area (red broken rectangle). A, Aluto volcano; Bo, Bora volcano; Bk, Boku Volcano; TM, Tulu Moye volcano; G, Gedemsa caldera; Bs, Boseti volcano; SVR, Salen Volcanic Ridge; CMER, central Main Ethiopian rift; NMER, northern Main Ethiopian rift; ABF, Asela border fault.
From a geothermal resource exploration point of view, geophysical methods can provide constraints on subsurface magma plumbing and fault systems, with both being important for the understanding of a geothermal system (Hersir and Björnsson, 1991). Previous geophysical studies in the TMGP have used magnetotellurics (MT) and micro-seismicity (e.g., Samrock et al., 2018; Greenfield et al., 2019) which provide good constraints on locating fluid phases (partial melt and hydrothermal fluids) within the crust. However, these studies do not provide a full picture of the subsurface distribution of caldera and rift-related fault and fracture systems, and their relationship to loci of magmatism, fluid flow and related geothermal resources. Therefore, this study is intended to outline the overall upper crustal scale subsurface structure, with an emphasis on better understanding the interaction between caldera and rift fault systems in controlling the occurrence of geothermal resources, beneath the TMGP.
In this study, magnetic and gravity data are used via map analysis and forward modeling to constrain the subsurface structural control on the occurrence of geothermal resources within the TMGP. The map analysis includes the construction of residual anomaly maps to understand the gravity and magnetic source within the upper crust and derivative methods (horizontal derivatives and analytic signals) to determine linear features that might be related to subsurface structures (e.g., faults, lineaments and fractures). The forward models were constrained by the existing MT and seismic studies to determine the location of potential geothermal resources. Although we used the TMGP as an example, our study helps to fully understand the occurrence of geothermal resources in the MER as a whole.
2 Geology, tectonic and geothermal setting of the Tulu Moye-Gedemsa magmatic segment
Since the Quaternary period, extension in the MER has been localized into
The TMGP lies within the TM-Gedemsa magmatic segment which includes the Gedemsa caldera at the northern end and the TM volcanic complex in the south (Figures 1C, 2). The TM volcanic complex includes the TM caldera, Bora, and Boku volcanic centers; in the TMGP, which are cut by WFB faults (Figures 1C, 2). In addition, NW-SE trending cross-rift structures control the magma transfer and emplacement and distribution of the volcanic activity in the area (Benvenuti et al., 2023).
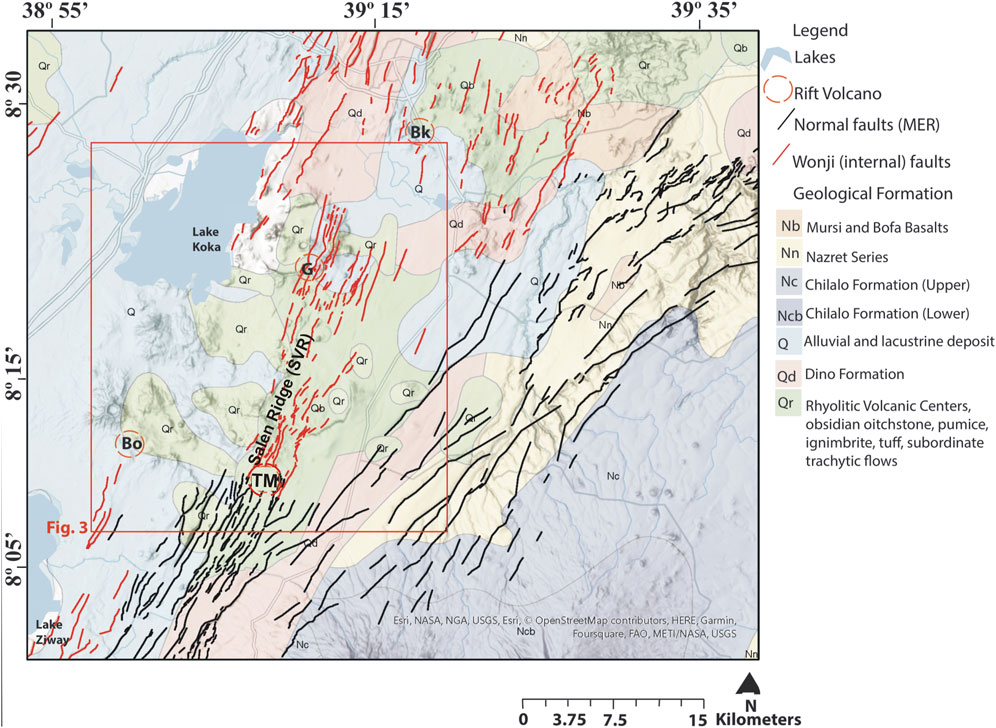
FIGURE 2. Geological map of the Tulu Moye-Gedemsa geothermal prospect. Abbreviations: Bo, Bora volcano; Bk, Boku Volcano; TM, Tulu Moye volcano; G, Gedemsa caldera (after Abebe et al., 2005).
The geology of the TMGP consists mainly of volcanic rocks, related to the MER volcanic activity, and thin sequences of Quaternary-Recent alluvial and lacustrine sediments (Abebe et al., 2005; Abebe et al., 2010; Figure 2). The volcanic rocks are characterized by bimodal volcanism of mafic and felsic types (Woldegabriel et al., 1990; Boccaletti et al., 1999; Mazzarini et al., 1999) related to three major volcanic episodes. The oldest episode (11–8 Ma) is related to the eruption of basaltic to trachytic lavas, and pyroclastic flows (Peccerillo et al., 2003; Abebe et al., 2005; Corti, 2009). These units occur southeast of the TM volcano, along the rift margins, and can be up to 700 m thick along the eastern margin (Abebe et al., 2010). The second episode (5–3 Ma) is associated with several rhyolitic domes and erupted rhyolitic and trachytic lava, and several layers of pyroclastic flows (Peccerillo et al., 2003; Corti, 2009; Figure 2). The last episode (<3 Ma) is characterized by the formation of central and caldera-forming volcanoes (Gedemsa, Bora, TM, Bericha, Boku, and Boseti; Figures 1, 2), scoria cones and fissure eruptions (Peccerillo et al., 2003; Abebe et al., 2010). A thermometry and barometry modeling study at TMGP suggests that the basaltic magmas are stored at high temperatures (1,070°C–1,190°C) at mid-to-deep-crustal levels (∼7–29 km), whereas the peralkaline rhyolite melts are stored at a lower temperature (700°C–900°C) at shallow crustal levels (∼4 km) (Tadesse et al., 2023).
The TM volcanic complex is one of the most important volcanic systems in the region and consists of an undated caldera that is thought to have been active between 320–265 ka forming an elliptically-shaped caldera system (Acocella et al., 2002). After the major explosive caldera/crater-forming activity occurred, volcanism continues to the present day mainly on the eastern side of the volcanic complex. The volcanic features include scoria cones and basaltic flows of various-sized, and rhyolitic (obsidian) domes mainly along the WFB, with the youngest eruptions being historical (∼1,900) (Wadge et al., 2016).
The TMGP and its geothermal features are mostly related to the faults within the WFB (Admasu and Worku, 2015; Guծbrandsson et al., 2020), where the faults cut the central to eastern portions of the volcanic complex and where hydrothermal alteration and surface manifestations (hot ground, steam vents, and fumaroles) are common (Varet and Birba, 2018) (Figure 2). A Curie point depth, geothermal gradient and heat flow analysis by Kassa et al. (2022) in the central MER revealed that the TMGP is characterized by a shallow Curie point depth (7.68–13.1 km), high heat flow (141 mW/m2) and high geothermal gradient (65
A MT study by Samrock et al. (2018) and Samrock et al. (2021) revealed a shallow (<3 km) high conductivity structure consistent with a clay cap above a resistive hydrothermal recharge zone, and a localized high conductivity anomaly at 5–7 km depth beneath the TM volcano which is interpreted to be a magma reservoir. Microseismic observations within the TMGP during 2016 and 2017 revealed swarms of seismicity mainly in the upper ∼5 km and were interpreted to have been caused by hydrothermal circulation along both rift parallel and rift perpendicular fault systems (Greenfield et al., 2019). Low-frequency earthquakes occur at a depth and location coincident with the low resistivity anomaly beneath TM volcano and are therefore interpreted to be caused by melt motion (Greenfield et al., 2019). Despite several surface (Fontijn et al., 2018; Guծbrandsson et al., 2020; Kebede et al., 2023; Tadesse et al., 2023) and subsurface (e.g., Keranen et al., 2004; Maguire et al., 2006; Mickus et al., 2007; Cornwell et al., 2010; Samrock et al., 2018; Darge et al., 2019; Greenfield et al., 2019; Nigussie et al., 2022a; Nigussie et al., 2022b; Nigussie et al., 2023) studies on the structural setting and hydrothermal fluids of the area, the role of shallow subsurface structures on the occurrence of geothermal resources is not fully understood within the study area.
3 Data and methods
3.1 Data
3.1.1 Gravity data
The gravity data used in this study is part of the Global Gravity model plus (GGMplus 2013), downloaded freely from the International Gravimetric Bureau website (https://ddfe.curtin.edu.au/gravitymodels/GGMplus/GGMplus-readme.dat/). GGMplus2013 is an augmentation of satellite gravity (GOCE/GRACE), EGM2008 gravity model, and the topographic gravity effect determined from a high-pass filtered terrain model (Hirt et al., 2013). The EGM2008 gravity model includes GRACE satellite gravity and all publicly available land and airborne gravity data (Hirt et al., 2013). The resolution of GGMplus2013 is approximately 200 m and it is applicable, especially in regions where ground gravity is available (Hirt et al., 2013) including the MER. A total of 2,602 gravity data points were extracted from 38.950 to 39.250E and 80 to 8.300N by re-sampling the data with a 1 km resolution which is attributed to be sufficient to investigate the role of subsurface structures on the occurrence of geothermal resources in the study area.
The theoretical gravity value at each station was calculated using the Geodetic Reference System 1967 (GRS67). Free air and Bouguer gravity corrections were applied using mean sea level as a datum and a Bouguer density of 2.67 g/cm3. Terrain corrections were calculated using a 1 km horizontal-resolution digital elevation model (DEM), with an accuracy of ∼0.3 m, and 2.67 g/cm3 for the terrain density to obtain complete Bouguer gravity anomalies (CBA). These data were gridded at a 1 km interval using the minimum curvature technique to produce a CBA map (Figure 4).
3.1.2 Magnetic data
Ground magnetic data were collected using a GSM-T19 proton precession magnetometer, with a resolution and accuracy of 0.01 and 0.02 nT respectively over its full range temperature. A total of 1,440 stations were collected by the Geological Survey of Ethiopia (940 stations) and the researchers of this study (500 stations) in March 2020 (Figure 3). The data were collected with an average station spacing of 0.3–0.6 km with base stations being established to determine the diurnal variation of the Earth’s magnetic field, in addition to avoiding data collection in stormy conditions and nearby power lines. Our magnetic data contains about 30 magnetic survey profile lines with varying lengths, separation distances and station distribution. Since most of the faults and magmatic alignments in the region are NNE and NE, most of the survey lines were chosen to be aligned E-W across the rift floor (Figure 3).
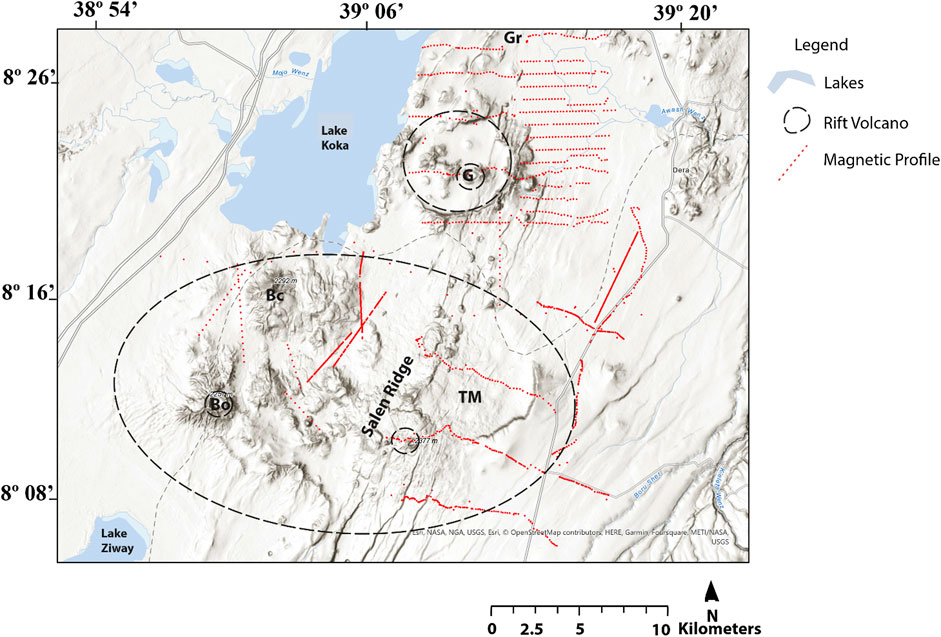
FIGURE 3. Shaded relief map of the study area showing the location of the magnetic stations (red dots) within the Tulu Moye-Gedemsa geothermal prospect. The circular broken line outlines the Gedemsa caldera and the dashed elliptical broken line outlines a proposed collapsed caldera system (Fontijn et al., 2018). Bo, Bora volcano; Bc, Bericha volcano; TM, Tulu Moye volcano; G, Gedemsa caldera; Gr, Geregendi hot spring.
The magnetic data were processed by averaging the readings at each station, removing the diurnal magnetic field determined by the base stations. To remove the regional magnetic field, the 2020 International Geomagnetic Reference Field was removed from the field data to produce a total magnetic anomaly dataset. The total magnetic anomaly dataset was then reduced to the north magnetic pole (RTP) using an inclination of 1.94°, declination of 0.3°, and amplitude correction of 1.9° to remove the dipolar effect of the magnetic field at inclinations that are not at the north magnetic pole (Beard, 2000). The RTP dataset was then gridded at a 1.5 km interval using the minimum curvature technique to produce a RTP magnetic anomaly map (Figure 9A).
3.2 Data enhancement
Despite having physical property differences, the methods used in interpreting gravity and magnetic methods are similar (Alemu, 2020). Gravity and magnetic data can be transformed so that information (anomaly shape and size, physical property edges and depth of causative sources) can be extracted using various filtering techniques (Mammo, 2010; Alemu, 2020) including wavelength filtering, polynomial trend surfaces, derivative methods (Blakley and Simpson, 1986; Ansari and Alamdar, 2009) and upward continuation (Jacobsen, 1987). In this regard, we used a variety of data enhancement or filtering techniques (Table 1) to get an insight into subsurface structures beneath the TMGP.
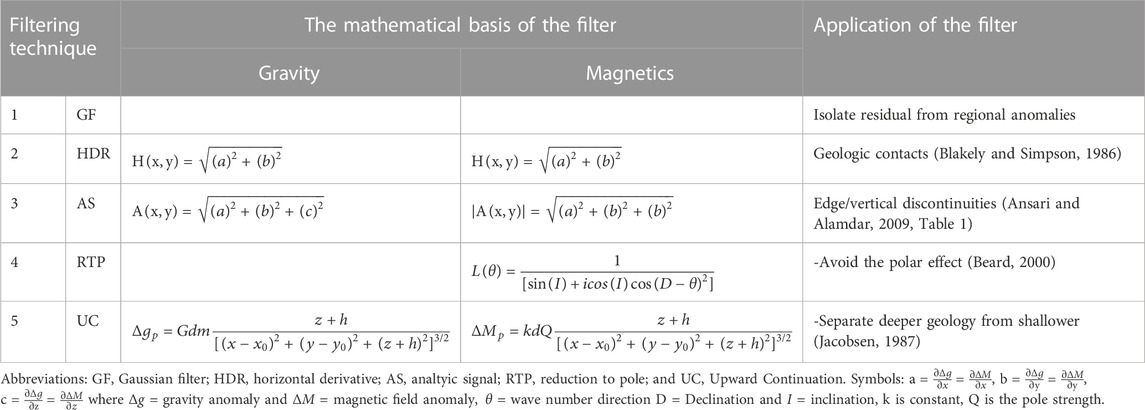
TABLE 1. Data enhancement techniques for this study.
3.2.1 Residual gravity and magnetic anomalies
The gravity or magnetic effect of all subsurface density or magnetic susceptibility variations is represented by the CBA or RTP data, respectively (Hinze et al., 2013). As a result, the physical property response of shallow seated bodies or distributions of interest (residual gravity or magnetic anomalies) can be estimated by removing the gravity or magnetic effect of deeper-seated bodies in which one is not interested (regional gravity or magnetic anomalies) from either the CBA or RTP data. The separation of the residual anomaly field from the regional field usually involves mathematical methods that are not commonly related to the actual geological conditions (Mickus et al., 1992). The most commonly used methods include upward continuation (Jacobsen, 1987), wavelength filtering (Blakely, 1995), polynomial trend surfaces (Lewi et al., 2016), and phase-match filtering (Phillips, 2001).
All of the above methods were attempted in creating residual gravity and magnetic anomaly maps. All the methods created similar anomaly amplitudes and shapes, so, we used a Gaussian-based wavelength filter where anomalies greater than 30 km were removed from the CBA data and anomalies greater than 28 km were removed from the RTP data. These wavelengths were chosen as they present density and magnetic susceptibility sources from the surface to between 7.5 and 10 km (Alemu, 2020) which are the depths of interest for subsurface structures related to the occurrence of geothermal resources within the TMGP. The subsequent residual gravity and magnetic anomaly maps are shown in Figures 5, 9B, respectively.
4 Results
4.1 Gravity anomaly maps
4.1.1 The complete Bouguer and residual gravity anomaly maps
The CBA map (Figure 4) indicates three different regions of gravity anomalies: high (>−188 mGal) over volcanic centers (TM-Bora-Bericha, Gedemsa, and Boku), intermediate (−188 to −202 mGal) over the rift floor in general, and low (<−202 mGal) towards the rift margins, regions outside the Gedemsa-magmatic segment. On the CBA map (Figure 4), the shorter wavelength anomalies are masked by a longer wavelength anomaly caused by density variations resulting from changes in crustal thickness (Mackenzie et al., 2005; Mickus et al., 2007) which masks the anomalies due to upper crustal density sources. To emphasize the shorter wavelength anomalies, a residual gravity anomaly map was created for the TMGP (Figure 5).
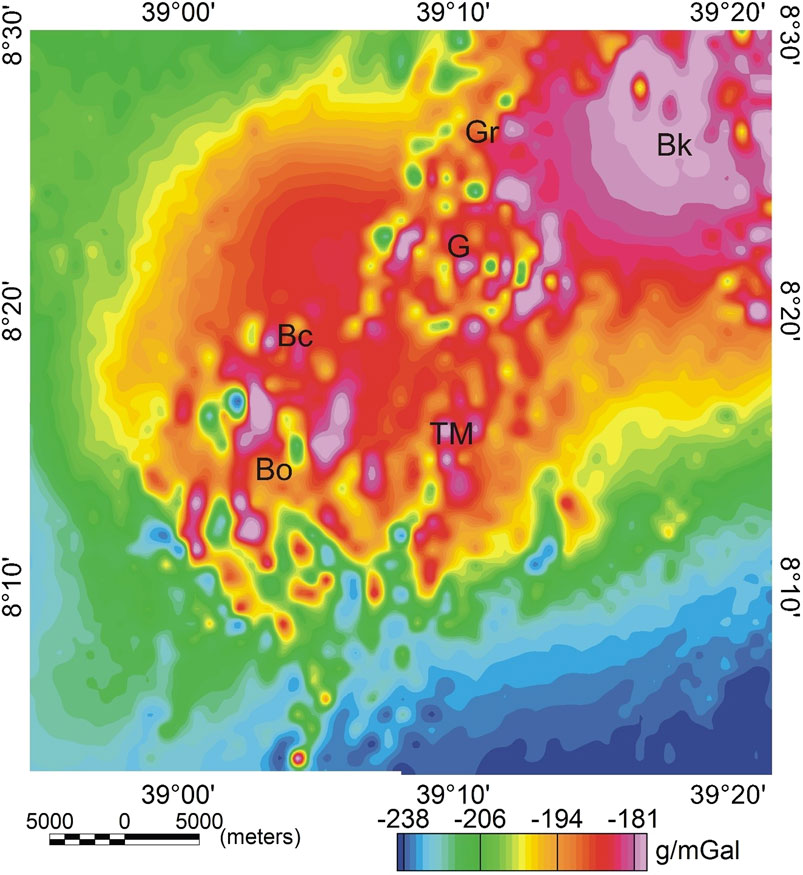
FIGURE 4. Complete Bouguer gravity anomaly map of the Tulu Moye-Gedemsa geothermal prospect. Abbreviations as in Figure 3.
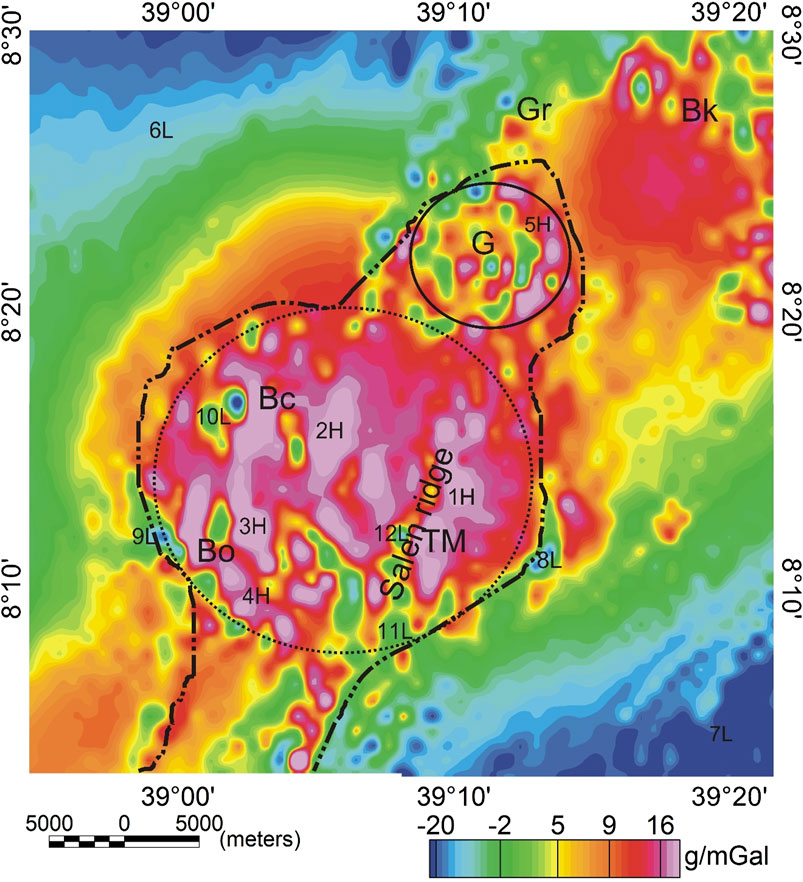
FIGURE 5. Residual gravity anomaly map. Abbreviations as in Figure 3 and solid circular black line outline the Gedemsa caldera. The dashed circular black line outlines a proposed collapsed caldera system (Fontijn et al., 2018). The dashed thick line polygon outline represents the Tulu Moye-Gedemsa magmatic segment. Numbers and associated letters are references for high (H) and Low (L) anomalies discussed in the text.
The residual gravity anomaly map (Figure 5) emphasizes density variations at depths less than 7.5–10 km. In general, the rift floor is characterized by gravity maxima (anomalies 1–5, Figure 5), while the region away from the margin of the magmatic segment is characterized by gravity minima (anomalies 6–7, Figure 5). Circular gravity maxima occur over some of the volcanic centers (Gedemsa and Boku) with adjacent gravity minima (Figure 5) while the TM volcanic center is associated with gravity maxima. The adjacent sides of the rift floor close to its margins are generally characterized by gravity minima (anomalies 8–11, Figure 5). The Salen Volcanic Range (SVR) is also characterized by elongated NNE-SSW gravity minimum (anomaly 12, Figure 5).
4.1.2 Horizontal derivative and analytic signal gravity anomalies
The horizontal derivative (HDR) method (Blakley and Simpson, 1986) is a technique to determine the edges of either density or magnetic susceptibility sources, where the maximum horizontal gradient occurs over the edge of planar bodies. The method was applied to the residual gravity anomaly data to aid in determining linear features that might be related to subsurface structures (e.g., faults, lineaments, and fractures) (Figure 6A). Figure 6A has several linear anomalies which are marked by black lines and could represent subsurface density discontinuities. For comparison of the subsurface mapping with the surface mapping, the surface volcano-structural mapping of the region (Figure 6B) is shown together with the HDR map. The linear features in the HDR map mainly trend either NW-SE or NE-SW with some NE-SW trending linear features being within the WFB (anomalies 1–3, Figure 6A) which agrees well with the surface data (Figure 6B). The later linear features are probably associated with the rift parallel dike intrusions. The volcanic centers (Boku, Gedemsa, TM) are bounded by linear anomalies implying some sort of structural control of the location of these volcanoes.
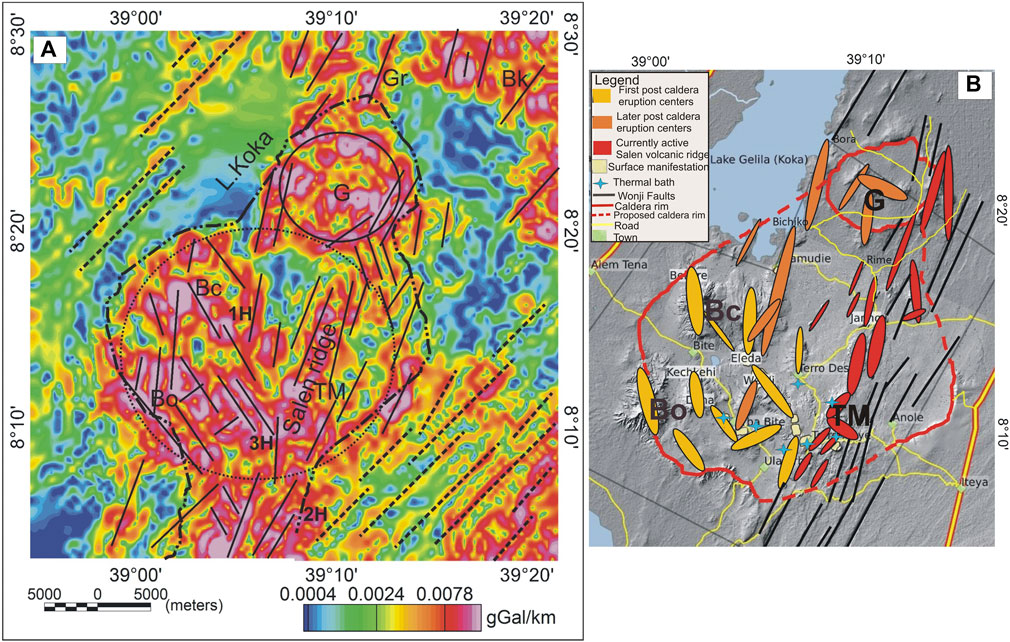
FIGURE 6. (A) Horizontal derivatives of the residual gravity anomaly map. Abbreviations as in Figure 3 and solid circular black line outline the Gedemsa caldera. The dashed circular black line outlines a proposed collapsed caldera system (Fontijn et al., 2018). The dashed thick line polygon outline represents the Tulu Moye-Gedemsa magmatic segment. Straight black lines are lineaments determined from the derivative analysis. Numbers and associated letters are references for high (H) and Low (L) anomalies discussed in the text. (B) Schematic volcano-structural interpretation of the TMGP (After Varet and Birba, 2018).
The analytic signal (AS) method is a total derivative method that may generate maximum anomalies over the peak of the density or magnetic susceptibility body (Dentith and Mudges, 2014). The method works well on shallow source bodies (Li, 2006) and should be combined with the HDR map to indicate which maxima are related to vertical contacts. The HDR method produces linear anomalies that are commonly continuous (Figure 6A), while the AS method produces more circular anomalies (Figure 7) that are less continuous (Phillips, 2000). However, the AS solution is more accurate and if the HDR and AS solutions overlie each other, then the contact is vertical (Phillips, 2000). If the HDR contacts are offset from the AS contacts, then the contacts are dipping (Phillips, 2000). The AS method was applied to the residual gravity anomaly map (Figure 5) to generate the AS map (Figure 7) which is characterized by a series of roughly circular anomalies that are in general in the same region as the HDR maxima (Figure 6A). The majority of anomalies are at the same location (Figure 7) as the HDR maxima (Figure 6A). This implies that the density source edges are vertical. However, anomalies 1-3, are not coincident with their corresponding HDR maxima, implying dipping density source edges. The location of the edges for our study should be estimated from the AS map (Figure 7).
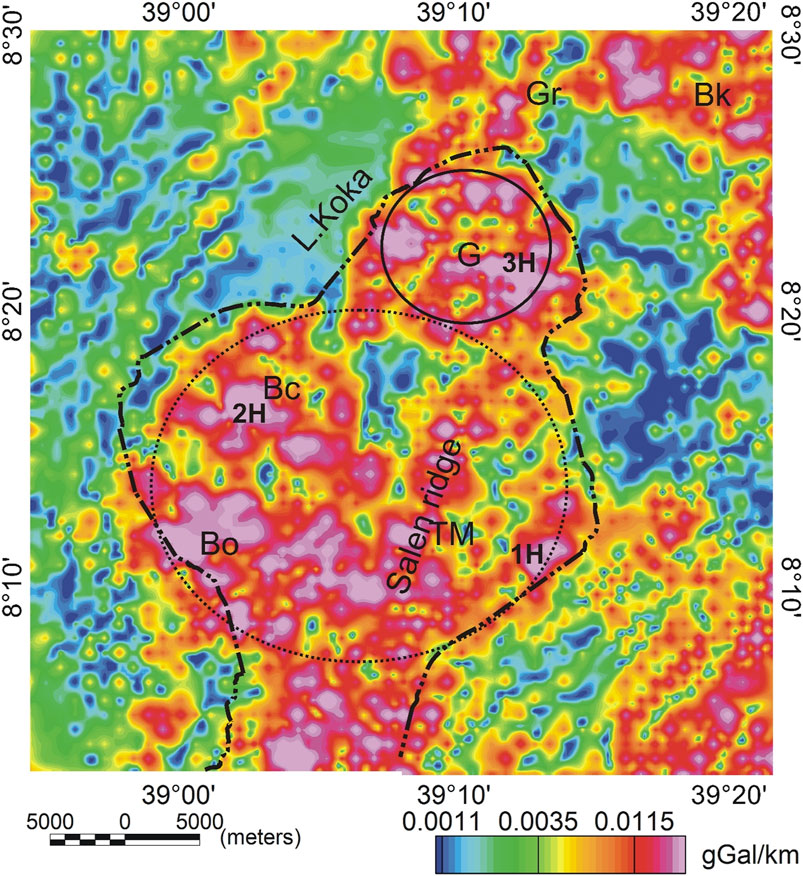
FIGURE 7. Analytic signal anomalies of the residual gravity anomalies of the Tulu Moye-Gedemsa geothermal prospect. Abbreviations as in Figure 3. Solid black circular line outlines the Gedemsa caldera. Dashed circular black line outlines a proposed collapsed caldera system (Fontijn et al., 2018). Dashed thick line polygon outline represent the Tulu Moye-Gedemsa magmatic segment. Numbers and associated letters are reference for high (H) and Low (L) anomalies discussed in the text.
4.1.3 Upward continuation of the residual gravity anomalies
The residual gravity anomaly map (Figure 5) highlights anomalies due to lateral variations in density but does not provide information on the depths of the source bodies. To determine a general depth to both shallow and deeper density bodies, upward continuation (Jacobsen, 1987; Kebede et al., 2020) was applied to the residual gravity anomaly data (Figure 5). Upward continuation is a low pass filter (Alemu, 2020; Kebede et al., 2020) that attenuates noise and emphasizes the anomalies from the deeper sources (Hinze et al., 2013) without changing the physical significance of the data. Jacobsen. (1987) showed that upward continuing a gravity field to a specific height implies that anomaly sources are at and below a depth of one-half of the continuation height. Figures 8A–D show the upward continuation of the residual gravity anomaly map (Figure 5) for different heights (1, 2, 4, and 8 km) to indicate the depth of the sources are at or below 0.5 km, 1 km, 2 km, and 4 km, respectively.
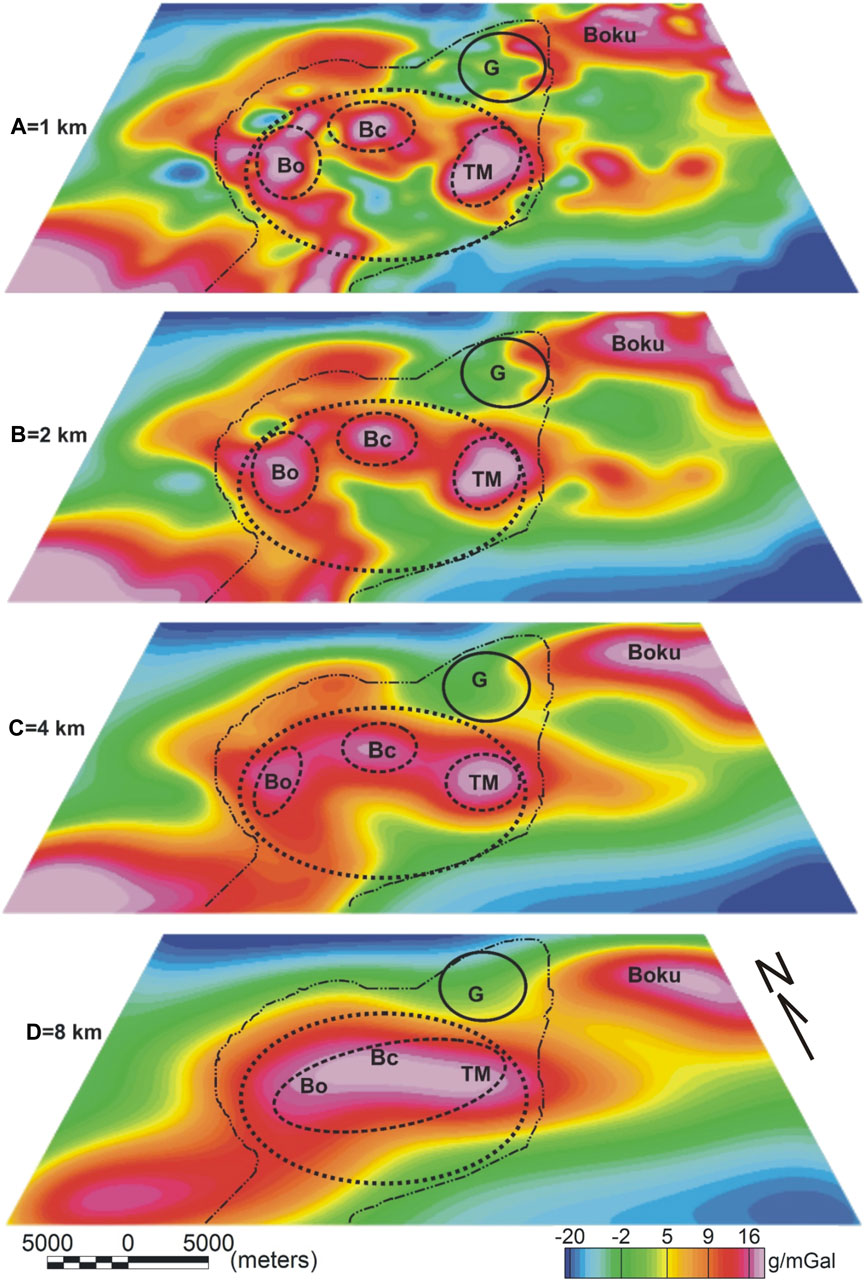
FIGURE 8. Upward continuation of the residual gravity data (Figure 5) to a height of (A) 1 km, (B) 2 km, (C) 4 km, and (D) 8 km. Abbreviations as in Figure 3. Solid black lines outline the Gedemsa caldera and the dashed black line outlines a proposed collapsed caldera system (Fontijn et al., 2018). The white line outlines the Tulu Moye-Gedemsa magmatic segment.
The upward continued gravity anomaly maps (Figures 8A–D) show that the gravity field becomes smoother as the continuation height increases. The 1 km upward continuation gravity anomaly map (Figure 8A) basically looks like the residual gravity anomaly map (Figure 5) but enhances the gravity maxima (outlined) especially those associated with the volcanic centers. As the continuation height increases, the number of maxima decreases as there are four sets of circular-shaped gravity maxima over the volcanic centers within the WFB: Bora, Bericha, TM, and Boku (Figures 8B, C).
4.2 Magnetic anomaly maps
4.2.1 Total and residual magnetic anomaly maps
The magnetic survey was conducted to identify magnetically anomalous regions within the upper crust to assist and support the interpretation of the gravity data. Figure 9A reveals the presence of magnetic minima (anomalies 1, 2, and 3, Figure 9A) (as low as −450 nT) in the western and central part of the study area and magnetic maxima (anomalies 4–6, Figure 9A) (up to 300 nT) in the eastern portion of the study area. The residual magnetic anomaly map removes anomalies greater than 28 km in wavelength (Figure 9B). The resultant map basically mimics the RTP map (Figure 9A) but enhances the anomalies seen on the RTP map. This indicates that, unlike the regional gravity field which varies smoothly due to crustal thickness variations, the regional magnetic field is basically linear within the study area except under the major volcanic centers. Linear magnetic maxima (anomalies 1 and 2, Figure 9B) are seen surrounding the TM volcano (Figure 9B) although the floor of the volcano is reflected by magnetic minima (anomaly 3). The Gedemsa caldera and the surrounding area are characterized by magnetic minima (Figure 9B) and magnetic maxima. While the SVR is characterized by a SW-NE trending minima (Figure 9B).
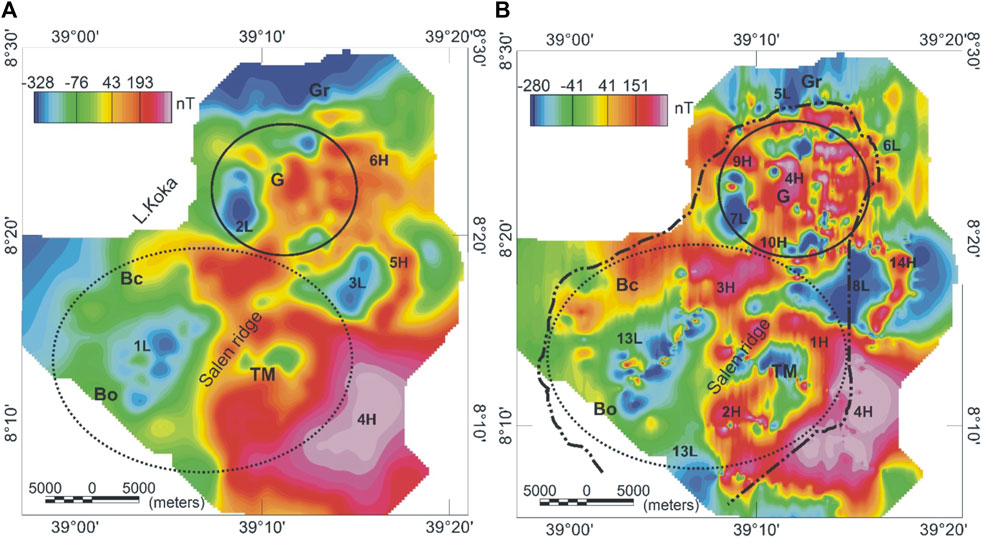
FIGURE 9. (A) RTP magnetic anomaly map and (B) residual magnetic anomaly map of the Tulu Moye geothermal prospect and surrounding area. Abbreviations as in Figure 3. Solid black lines outline the Gedemsa caldera and the dashed white line outlines a proposed collapsed caldera system (Fontijn et al., 2018). The white line outlines the Tulu Moye-Gedemsa magmatic segment. Numbers and associated letters are references for high (H) and Low (L) anomalies discussed in the text.
4.2.2 Analytic signal magnetic anomaly map
The AS filter can be applied to magnetic data and it has the advantage of being independent of magnetization direction but the strength of magnetization (Ansari and Alamdar, 2009). The AS filter was applied to the residual magnetic anomaly data (Figure 9B) to aid in identifying lineaments within the magnetic data. The AS magnetic map (Figure 10) shows maxima at the peak of the magnetic susceptibility bodies. The AS method enhances short-wavelength anomalies and the AS magnetic map (Figure 10) shows maxima over the volcanics within the TM and Gedemsa caldera. Anomalies 1 and 2 roughly outline the edges of the magnetic minimum (Figure 9B) associated with TM. Anomalies 4 and 5 trends NE-SW, are associated with the WFB (Kebede et al., 2022). The AS magnetic maxima in the Gedemsa caldera outline the magnetic susceptibility sources imaged on the residual magnetic anomaly map (Figure 9B). Most of the anomaly features in Figure 10 trend NW-SE and are in the same location as similar lineaments imaged in the gravity data (Figure 6A) and surface volcano-structural features (Figure 6B). These NW-SE trending lineaments may connect to faults that were imaged to the south in the Aluto volcano region (Kebede et al., 2022).
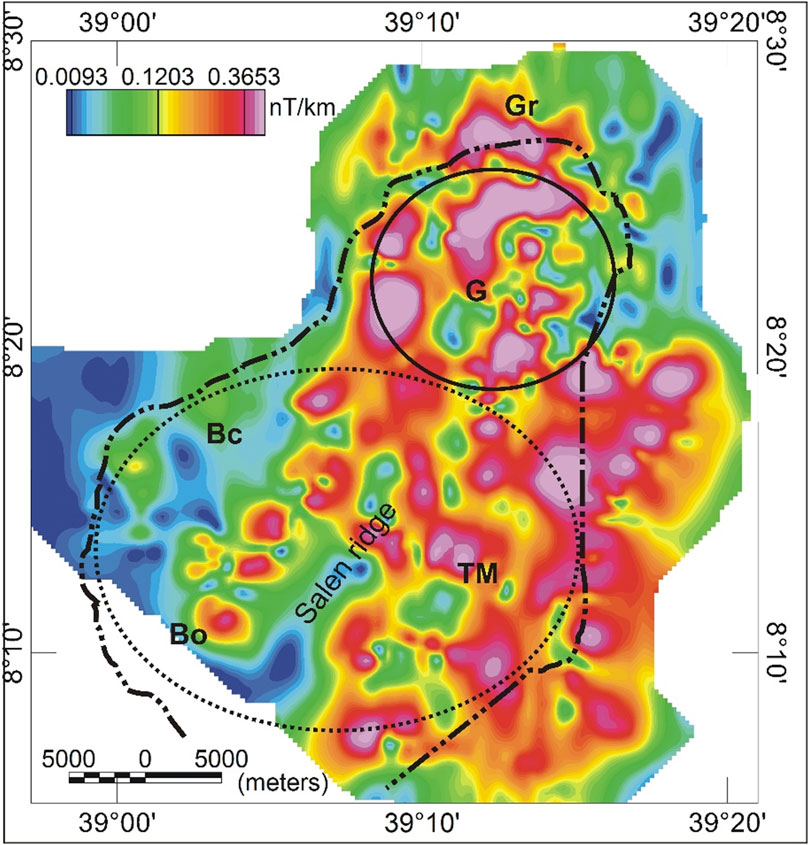
FIGURE 10. Analytic signal anomalies of the residual magnetic data. Abbreviations as in Figure 3. Solid black circular line outline the Gedemsa caldera and the dashed black circular line outlines a proposed collapsed caldera system (Fontijn et al., 2018). The black polygon outlines the Tulu Moye-Gedemsa magmatic segment.
4.3 Interpretation of gravity and magnetic anomalies
4.3.1 Qualitative interpretation
The large-scale gravity maxima over the TMGP (Figure 5) are attributed to the response of the varying thickness of the volcanic rocks and mafic intrusions added into the upper crust as imaged in previous geophysical studies (Keranen et al., 2004; Mickus et al., 2007). In addition, the separate circular gravity maxima associated with the Gedemsa caldera and the Boku volcano are attributed to either intruded material (Kebede et al., 2022) or the result of higher density volcanic material which has built each volcanic center (Scandone, 1990). On the other hand, the surrounding gravity minima associated with the Gedemsa caldera and the Boku volcano, and possibly TM (Figure 5) may be caused by the thick, low-density volcanic ash within the caldera after collapsing or may reflect the reworked material of caldera collapse infill (Scandone, 1990). The SVR, west of TM, is also characterized by elongated NNE-SSW gravity minima (Figure 5) that may be related to the presence of partial melt at shallow depth.
Closely examining the upward continuation map (Figures 8A–D) reveals that as the continuation height increases, the individual gravity maxima under Bora, TM, and Bericha are merged into one gravity maximum, best explained as a zone of dense mafic intrusions. This could imply that there is a deep source for the three volcanic centers with smaller high-density bodies at a shallower depth under each individual volcanic center. This phenomenon has been observed at other magmatic centers in the northern MER using three-dimensional gravity and magnetic modeling (Mickus et al., 2009; Kebede et al., 2022). The larger body may represent a deeper zone of magma accumulation, from where the magma migrated upward and accumulated at shallower depths under each individual volcanic center. Combining the maxima anomalies from the residual gravity anomaly, upward continuation maps and the analytic signal maps (Figures 5, 7, 8A–D) over the TM-Gedemsa magmatic segment indicates that there was a large amount of mafic material added to the crust under this magmatic segment.
Additionally, the HDR map (Figure 6A) in conjunction with the surface mapping (Figure 6B) indicates several NNE-SSW and NW-SE linear features which may be related to the WFB (NNE trending) and previously unknown faults (NW trending). These linear features, if they are fractures or faults and especially where they intersect, could be favorable sites for the migration of partial melt and geothermal fluids. The alteration zones and thermal baths surrounding and to the west of the TM volcanic center (Figure 6B) could be controlled by such conditions. Such a scenario was shown to be important to the south of the study area in the Aluto-Langano geothermal field, where MT studies indicated that the geothermal fluids originated to the northwest of the Aluto volcano (Samrock et al., 2015) and a magnetic analysis suggested linear magnetic anomalies interpreted as faults were the conduits of the geothermal fluids to the Aluto area (Kebede et al., 2022).
The residual magnetic anomaly map (Figure 9B) shows a series of relatively short wavelength maxima and minima that can only roughly be correlated with the surface geology (Figure 2). There are no magnetic susceptibility measurements in the study area but measurements to the south of the study area in the Aluto volcano region indicate that the near-surface pyroclastic material has low values, while the Bofa basalts and ignimbrites have high values (Kebede et al., 2022). The other lithologies in the study area, including the scoria deposits, rhyolite flows, and rhyolite domes, commonly have low magnetic susceptibilities (Mackie and Cunningham, 1982) and thus probably are not the sources of the magnetic maxima. Thicker occurrences of any of these lithologies may be the source of the magnetic minima. Accordingly, anomaly 13 (Figure 9B) possibility reflects rhyolite domes and flows (Figure 2). Based on magnetic forward modeling in the Aluto volcano region (Kebede et al., 2022), the majority of the larger amplitude magnetic maxima are caused by magmatic intrusions in the upper crust (<6 km in depth). A number of the magnetic maxima in the TMGP are linear in nature and occur along the WFB or along suspected fault systems that trend NW-SE determined from the gravity and magnetic derivative analysis (Figures 5, 6A, 7, 10). These anomalies may be mafic intrusions at a depth that were intruded sub-parallel to the faults. The Bora and Bericha volcanoes are associated with magnetic maxima and have pyroclastic flows at the surface (Figure 9B). However, the pyroclastic materials may not have sufficient magnetic susceptibility (Kebede et al., 2022) and the amplitude of these maxima suggests that they may be related to deeper mafic intrusions. (Figure 9B). The SW-NE trending aligned magnetic minima (Figure 9B) that occur over the SVR possibly reflect either thick non-magnetic lithologies or demagnetized lithologies due to hydrothermal fluid alteration as shown near the TM volcanic center in surface mapping (Figure 6B). The magnetic minima could be the response of partial melt at shallow depth associated to the active volcano-tectonic feature in support of surface-based geologic studies (Varet and Birba, 2018; Fontijn et al., 2018; Guծbran dsson et al., 2020; Figure 2) and our interpretation for the gravity data (Figure 5).
4.3.2 Quantitative interpretation
To obtain better quantitative subsurface information, we re-interpreted the 2D gravity (Figure 11) and 3D geologic (Figure 12) models from Nigussie et al. (2022a) in terms of subsurface volcanic networks and their link to the geothermal resource occurrences. The 2D model was constructed by forward modeling of the gravity data (Figure 11). This process suffers from non-uniqueness, but when combined with constraints from seismic models, borehole data, and geological mapping, it can be a powerful tool in providing additional constraints on the crustal structure. In our models (Figure 11), the available geophysical and geological constraints were used to obtain quantitative models of the upper crustal structure (Figure 11) along a profile that crossed the TMGP (Nigussie et al., 2022a). The constraints on the geometry, depths and densities of the crustal bodies were derived from seismic models (Keranen et al., 2004; Mackenzie et al., 2005; Maguire et al., 2006). Since there are few constraints on the detailed stratigraphy of the area, the majority of the rock types and thicknesses of the upper-most layers were estimated based on geological mapping in the MER (Woldegabriel et al., 1990; Abebe et al., 2005; 2010), and their densities were estimated from the measurement of common rock types (Telford et al., 1990). A residual gravity anomaly data was modeled with the density, geometry, and depth values being varied by 10% from the available constraints during the modeling process, until the difference between the observed and calculated gravity anomalies was <2%.
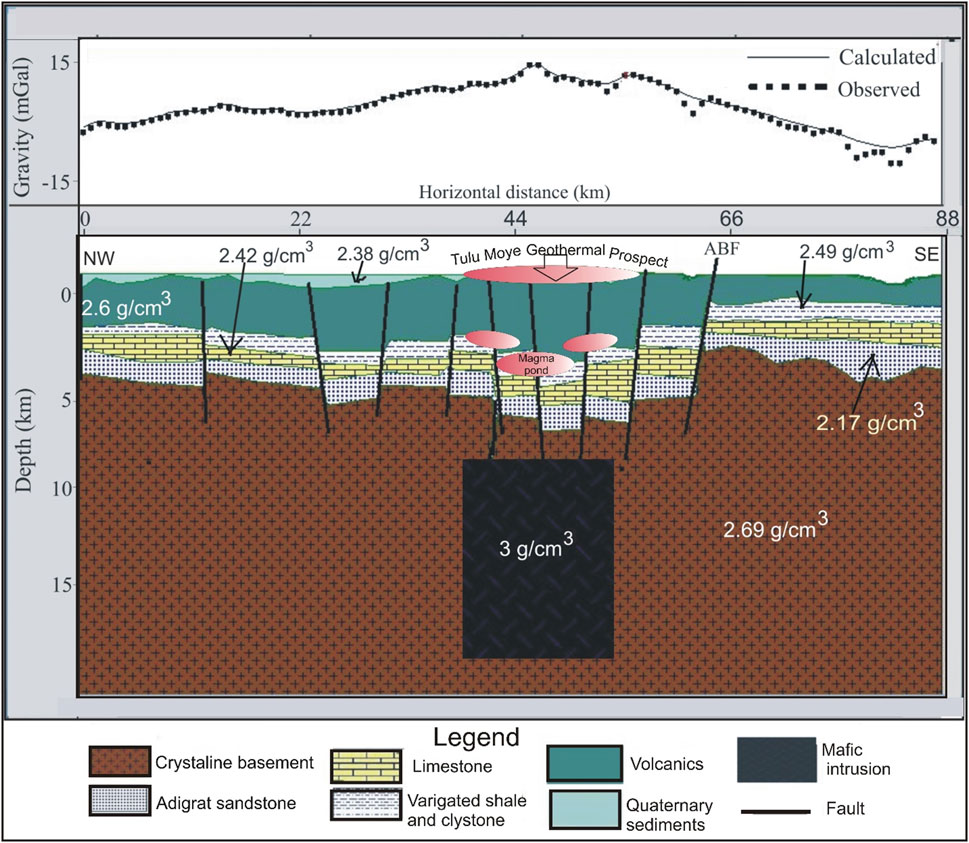
FIGURE 11. Two-dimensional gravity model across the Gedemsa TMS including the Tullu Moye volcano center along profile P1 (Figure 6 of Nigussie et al., 2022a). ABF-Asela border fault.
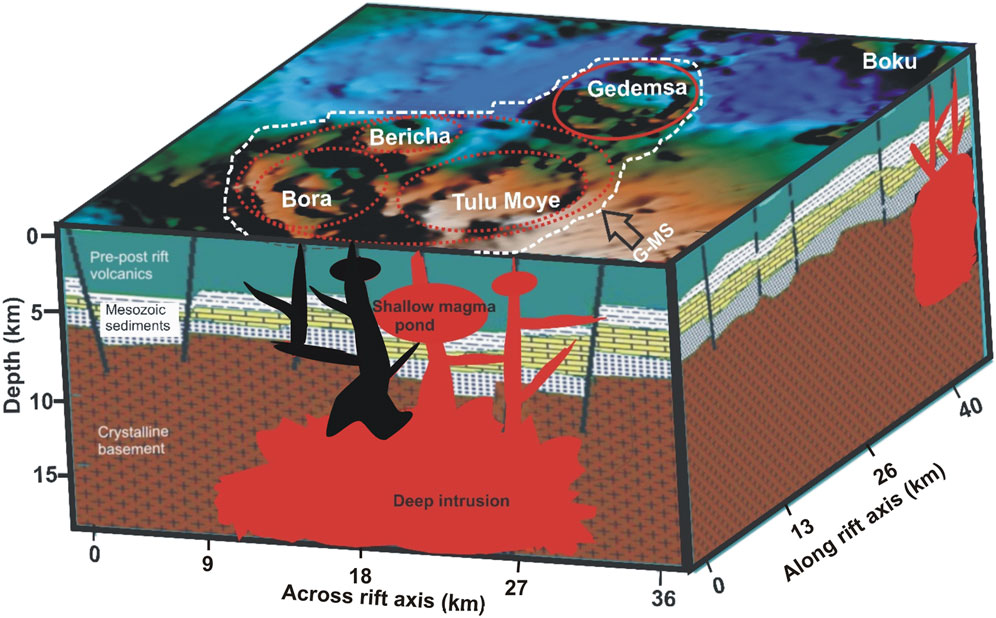
FIGURE 12. 3D geology of the Tulu Moye-Gedemsa volcanic complex, showing the interaction of shallow magma chambers with deep mafic intrusions through quaternary faults (modified from Nigussie et al., 2022a), the magma plumbing system in black color beneath Bericha and Bora volcano represents extinct (volcanically inactive) zones.
The final density model (Figure 11) included a top layer of Quaternary rift sediments (
5 Discussion
Our discussion sections focused on explaining our results in conjunction with the existing data on constraining caldera formation mechanisms (Section 5.1), as well as the geothermal heat sources and the role of subsurface structures (Section 5.2) within the TMGP. In this regard, we re-interpreted the 2D gravity model (Figure 11) and 3D subsurface geologic model (Figure 12) of Nigussie et al. (2022a), which are constructed to understand the structure of the upper crust, in terms of geothermal resources occurrence point of view within the TMGP in conjunction with our gravity and magnetic anomaly maps (Figures 4–10).
5.1 Caldera formation scenarios in the Tulu Moye geothermal prospect
Caldera collapse is a common geological process in active volcanic regimes, especially in continental rifts (Holohan et al., 2005; Maestrelli et al., 2021b), and many mechanisms have been proposed to explain this process (Acocella et al., 2001; Troll et al., 2002; Ruch et al., 2012; Coumans and Stix, 2016). Determining which mechanism is correct for a given caldera is hindered by the rapid formation of the caldera and post-caldera volcano-tectonic processes and sediments that cover the caldera features (Holohan et al., 2005; Maestrelli et al., 2021a). Thus, geophysical methods are important in delineating caldera structures, which are common potential sites of geothermal activity (Cole et al., 2005), and determining a correct mechanism to explain their development.
Despite there being several known calderas within the MER (e.g., Gedemsa, Gariboldi; Fentale, and Dofan) (Hunt et al., 2020; Acocella et al., 2002; Maestrelli et al., 2021a; b; Casey et al., 2006), there are several volcanic complexes with calderas that have been not well studied (e.g., TM volcanic complex). The TM volcanic complex consists of several volcanic centers (TM, Bora, and Bericha, Figure 2) with visible caldera rims, although there is not a common consensus on the number and nature of the calderas in the area. Geothermal exploration studies (Fontijn et al., 2018; Varet and Birba, 2018; Guծbrandsson et al., 2020) have proposed the presence of one large caldera system for the TMGP (e.g., Figures 3, 5). If this hypothesis is correct, the TMGP is a single large caldera (∼25 km in diameter and covering ∼500 km2) bounded by the younger (340 ky) Gedemsa caldera on its northern edge (Figures 5–7). However, Kebede (2021) used aerial images and field mapping data to suggest that the TMGP consists of nested or overlapping of three individual calderas, each with a different age.
The residual gravity anomaly map (Figure 6) and derivative maps (Figures 5, 6) revealed a spatially large circular maximum with overlapping smaller elliptical to circular-shaped maxima. The large circular region (Figures 3, 5, 6) could be evidence for the single large caldera model (Fontijn et al., 2018; Varet and Birba, 2018; Guծbrandsson et al., 2020) whereas, overlapping smaller elliptical-circular positive gravity anomalies could reveal a nested caldera system (Kebede, 2021). This observation can be interpreted as that the TMGP consists of an older large caldera, about 25 km in diameter followed by several smaller, younger calderas (Bora, Bericha, and TM) (Figure 12). Caldera rims are not visible in many locations due to modification by erosion and post-caldera volcano-tectonic activities associated with the Quaternary-Recent NNE-SSW trending structures related to the WFB and the cross-rift (NW-SE) structures (Figures 5–7) (Kebede, 2021).
Our interpretations are similar to the formation of other nested calderas (Aluto, Dofan, Fantale, Kone, Shala, and Corbetti) within the MER (Maestrelli et al., 2021b). However, unlike the elongated characteristics of these calderas, our subsurface interpretations revealed an almost circular shaped caldera for the TMGP (Figures 5, 6, 12), and specifically the Gedemsa caldera has a circular shape based on the gravity analysis (Figures 5–7). The larger TMGP caldera rim can also be considered fault-controlled as its southwestern margin is affected by NW-SE trending structures (Figure 6) and its eastern margin is affected by the NNE-SSW trending structures of the WFB (Figure 6).
5.2 Geothermal heat sources and roles of subsurface structures in the Tulu Moye geothermal prospect
The TM-Gedemsa volcanic complex consists of prospective geothermal sites including TM, Geregendi, and Boku (Samrock et al., 2018; Greenfield et al., 2019; Varet et al., 2020). The interpretation of gravity data alone is not indicative of geothermal resource occurrences, but when interpreted in conjunction with magnetic data, one can obtain a better model of the structural controls on the geothermal resource occurrences. Our combined interpretations of gravity and magnetic data provided insight into the role of subsurface geological structures on the occurrence of geothermal resources in the area. The gravity maxima on the CBA map (Figure 4) and upward continued (Figures 8A–D) maps can be explained by dense mafic intrusion beneath the TMGP to at least mid-crustal depths, as the anomaly signal response increases with upward continuation height. The depth of the top of this mafic intrusion zone is as shallow as 7.5 km, as imaged by 2D gravity (Figure 11) and 3D geologic (Figure 12) models (Nigussie et al., 2022a). The geological record suggests that these mafic intrusions represent the magmatic addition to the mid-crustal level beneath the MER since the Quaternary (Ebinger and Casey, 2001; Wolfenden et al., 2004; Abebe et al., 2007). Our evidence from gravity data along with the surface thermal manifestation (Figure 6B), recent geological units (Varet and Birba, 2018; Guծbrandsson et al., 2020), low magnetic anomaly (Figures 9A, B) and high heat flow as well as a shallow Curie point depth (Kassa et al., 2022) of the TM volcanic center and SVR supports the presence of an active melt supply.
The short wavelength circular-shaped anomalies (Figures 5, 8A–C) occurring over the Bora, Bericha, and TM volcanoes are probably caused by shallow mafic intrusions as suggested by previous gravity modeling (Mickus et al., 2009). The 2D gravity model (Figure 10) and 3D geologic interpretation (Figure 12) suggest the presence of mafic intrusion at a depth of ∼5 km beneath the TM, Bora, and Bericha volcanoes. Of these, only the anomaly beneath TM is imaged with high conductivity in MT surveys (Samrock et al., 2018), and we therefore interpret this specific body to be currently magmatically active and include partial melt, consistent with it being a primary heat source for the geothermal system (Figures 11, 12). In addition, the residual magnetic anomaly map (Figure 9B) reflects a SW-NE aligned minimum following the SVR, which is also reflected by thermal bath and surface alteration zones especially close to the TM volcanic center (Figure 6B). These magnetic minima parallel to this active volcano-tectonic range may indicate the existence of a zone that has been hydrothermally altered as observed on the surface structural mapping (Figure 6B) or could reflect the presence of partial melt between 2–3 km depth, as interpreted from the gravity minima (Section 4.3; Figure 5). If the anomaly is from the current partial melt, then it could be an additional heat source. This interpretation is consistent with microseismic observations where low-frequency earthquakes occur at similar depths caused by melt motion (Greenfield et al., 2019). Our interpretation of discrete and shallow loci of intrusion beneath the volcanic centers is also consistent with petrological modeling which suggests the rhyolite lavas were derived from ∼4 km deep reservoirs (Tadesse et al., 2023). The magmas evolved from a basaltic primary melt (Tadesse et al., 2023) of high temperature (1,070°C–1,190°C), which likely dominates the intruded and solidified reservoir.
The interlinking of structural zones (caldera features as well as NNE and NNW faults) (Figures 6A, B) and geothermal prospect regions implies that the geothermal resources within the area are linked to and controlled by rift structures (Admasu and Worku, 2015; Hutchison et al., 2015; 2016). The distribution of linear features along and across rift anomalies in the horizontal derivative map (Figure 6A), is similar to the surface fault pattern and alignment of volcanic systems (Figure 6B) (Boccaletti et al., 1998; Boccaletti et al., 1999; Corti, 2009; Admasu and Worku, 2015). This suggests that the Quaternary-Recent NE to NNE- and NW-trending faults and fractures are persistent and intersect below a depth of 0.5 km within the rift floor (Figures 11, 12). The region between the Salen ridge, and the TM and Bora volcanoes in particular shows dense intersections between faults striking across and along the rift, and with the caldera rims, and is also a region of most surface thermal baths (Figure 6B) and hydrothermal alteration (Kebede et al., 2023). Our horizontal derivative map suggests the surface fault system persists to significant depth and likely to contribute significantly to the movement of geothermal fluids in these areas. Therefore, we interpret that the interactions between rift and caldera related faults creates the high permeability that controls lateral and vertical hydrothermal fluid flow and results in a large geothermal system in the region (Figure 12).
At greater depths, our upward continuation analysis and 2D gravity model suggest a deeper zone of mafic intrusion beneath ∼7.5 km depth. The depth of this intrusion zone is consistent with the thermometry and barometry modeling of the basaltic lavas from the TMGP, which suggest a zone of basaltic storage with higher temperature (1,070°C–1,190°C) at 7–29 km deep (Tadesse et al., 2023). These results are also consistent with a Curie point depth (7.68–13.1 km) (Kassa et al., 2022). Our gravity data and model together with the position of surface manifestation zones suggest a deep geothermal reservoir directly beneath the TMGP (Figures 6B, 11, 12), and slightly offset to the east of the west-dipping high conductivity anomaly at similar depths observed in MT data (Samrock et al., 2018). Since the high conductivities in MT show zones of partial melt currently in the crust, while the gravity data are sensitive to time-averaged locus of intrusion, we suggest that the locus of magma migration from depth beneath the TMGP has changed through time.
Haile and Tamiru. (2012) showed that the Gedemsa caldera hosts a geothermal system and is the heat source for the Geregendi thermal spring. However, geochemical evidence (Thrall, 1973) and the absence of thermal manifestations in the area suggested that Gedemsa caldera may be an extinct/or dormant volcano. This is supported by the results of a magnetic maxima (Figure 9B) which implies the presence of shallow crystalline intrusions. The absence of large-scale magnetic minima, reflecting hydrothermal alteration of magnetic minerals, implies the absence of hydrothermal fluids. The gravity data also support this argument as the gravity minima over the Gedemsa caldera (Figures 5, 8A, B) suggest that the deep intrusion beneath Gedemsa volcanic system (Figures 11, 12) does not supply enough or any heat to support shallow magma chambers near Gedemsa. This hypothesis supports the idea that this region is an extinct/or dormant volcano (Thrall, 1973).
6 Conclusion
Interpretation of gravity and magnetic data in conjunction with previous geological, seismicity, and magnetotelluric analysis have provided insights into the subsurface volcanic network and the role of subsurface structures on the occurrence of geothermal resources in the Tulu Moye geothermal prospect (TMGP), central MER. The main findings are:
1. Interpretation of gravity and magnetic anomaly maps combined with geological, seismicity, and magnetotelluric studies indicate the occurrence of potential geothermal heat sources beneath the Tulu Moye volcano.
2. Gravity and magnetic anomaly maps in conjunction with 2D gravity model and 3D geologic interpretation suggest that there are upper crustal dense mafic intrusions under each caldera (Tulu Moye, Bora and Bericha). However, our interpretation along with recent magnetotelluric surveys suggests that only the intrusion beneath Tulu Moye is currently magmatically active and includes partial melt, consistent with it being a primary heat source for the geothermal system.
3. Magnetic minima following the SVR are probably related to hydrothermal alteration of magnetic minerals and circular gravity maxima over the SVR combined with surface thermal manifestations are indicators of the presence of deeper geothermal resources.
4. Intersection of caldera features with NNE-SSW and NW-SE trending lineaments determined by the magnetic and gravity derivative maps correlated well with the pattern of surface faulting and hydrothermal manifestations. This suggests that the surface fault pattern continues to depth with the intersection between caldera and rift-related faults providing high permeability that controls vertical and lateral hydrothermal fluid flow and results in a large geothermal system in the region.
Data availability statement
Publicly available datasets were analyzed in this study. This data can be found here: https://bgi.obs-mip.fr/data-products/grids-and-models/modele-global-ggmplus2013/.
Author contributions
WN and AA framed the conceptualization and methodology, and participated in data processing and curation followed by writing-original draft preparation. KM, DK, and ZD have participated in visualization, investigation and supervision as well as software processing and validation. With all coauthors, YM, AM, GC, and EY edit, re-write and review the final manuscript. All authors contributed to the article and approved the submitted version.
Funding
Natural Environment Research Council under NERC Grant NE/L013932/1 Ministero dell’Università e della Ricerca (MiUR) through PRIN grant 2017P9AT72.
Acknowledgments
We thank the International Gravimetric Bureau and the Geological Survey of Ethiopia for providing gravity and magnetic data respectively to use in this study. Moreover, we are thankful to Reykjavik Geothermal for supplying the magnetometer, transport, and camp services for our fieldwork.
Conflict of interest
The authors declare that the research was conducted in the absence of any commercial or financial relationships that could be construed as a potential conflict of interest.
Publisher’s note
All claims expressed in this article are solely those of the authors and do not necessarily represent those of their affiliated organizations, or those of the publisher, the editors and the reviewers. Any product that may be evaluated in this article, or claim that may be made by its manufacturer, is not guaranteed or endorsed by the publisher.
References
Abebe, B., Acocella, V., Korme, T., and Ayalew, D. (2007). Quaternary faulting and volcanism in the main Ethiopian rift. J. Afr. Earth Sci. 48, 115–124. doi:10.1016/j.jafrearsci.2006.10.005
Abebe, T., Balestrieri, M. L., and Bigazzi, G. (2010). The central main Ethiopian rift is younger than 8 Ma: Confirmation through apatite fission-track thermochronology. Terra nova. 22, 470–476. doi:10.1111/j.1365-3121.2010.00968.x
Abebe, T., Manetti, P., Bonini, M., Corti, G., Innocenti, F., Mazzarini, F., et al. (2005). Geological map of the northern Main Ethiopian Rift and its implication for the volcano-tectonic evolution of the rift. Colorado: Geological Society of America. doi:10.1130/2005042
Acocella, V., Cifelli, F., and Funiciello, R. (2001). The control of overburden thickness on resurgent domes: Insights from analogue models. J. Volc. Geoth. Res. 111, 137–153. doi:10.1016/s0377-0273(01)00224-4
Acocella, V., and Korme, T. (2002). Holocene extension direction along the main Ethiopian rift, east Africa. Terra nova. 14, 191–197. doi:10.1046/j.1365-3121.2002.00403.x
Acocella, V., Korme, T., Salvini, F., and Funiciello, R. (2002). Elliptic calderas in the Ethiopian rift: Control of pre-existing structures. J. Volc. Geoth, Res. 119, 189–203. doi:10.1016/s0377-0273(02)00342-6
Admasu, E., and Worku, S. (2015). Characterization of Quaternary extensional structures: Tulu Moye geothermal prospect, Ethiopia. GRC Trans. 39, 25–32.
Albino, F., and Biggs, J. (2021). Magmatic processes in the East African Rift System: Insights from a 2015– 2020 sentinel-1 InSAR survey. Geochem. Geophys. Geosystems 22 (3), e2020GC009488. doi:10.1029/2020gc009488
Alemu, A. (2020). Geophysics: Principles, practices, and applications of geophysical methods to resource exploration and geohazard studies. Addis Ababa: Aster Nega Publishing Enterprise, 500.
Ansari, A., and Alamdar, K. (2009). Reduction to the pole of magnetic anomalies using analytic signal. World Appl. Sci. J. 7, 405–409.
Bastow, I. D., Pilidou, S., Kendall, J. M., and Stuart, G. W. (2010). Melt induced seismic anisotropy and magma assisted rifting in Ethiopia: Evidence from surface waves. Geochem. Geophys., Geosys. 11, 05–11. doi:10.1029/2010gc003036
Beard, L. (2000). Detection and identification of north-south trending magnetic structures near the magnetic equator: Low latitude magnetic anomalies. Geophys. Pros. 48, 745–761. doi:10.1046/j.1365-2478.2000.00214.x
Benvenuti, M., Corti, G., Keir, D., and Sani, F. (2023). Transverse tectonics control on the late quaternary development of the central main Ethiopian rift. Ital. J. Geosci. 142, 42–56. doi:10.3301/IJG.2023.05
Biggs, J., Bastow, I. D., Keir, D., and Lewi, E. (2011). Pulses of deformation reveal frequently recurring shallow magmatic activity beneath the Main Ethiopian Rift. Geochem. Geophys. Geosystems 12 (9). doi:10.1029/2011gc003662
Blakely, R. J. (1995). Potential theory in gravity and magnetic applications. Cambridge: Cambridge University Press, 321.
Blakely, R. J., and Simpson, R. W. (1986). Approximating edges of source bodies from magnetic or gravity anomalies. Geophysics 51, 1494–1498. doi:10.1190/1.1442197
Boccaletti, M., Assefa, G., and Tortorici, L. (1992). The main Ethiopian rift: An example of oblique rifting. Ann. Tect. 6, 20–25.
Boccaletti, M., Bonini, M., Mazzuoli, R., Abebe, B., Piccardi, L., and Tortorici, L. (1998). Quaternary oblique extensional tectonics in the Ethiopian rift (horn of Africa). Tectonophysics 287, 97–116. doi:10.1016/s0040-1951(98)80063-2
Boccaletti, M., Mazzuoli, R., Bonini, M., Trua, T., and Abebe, B. (1999). Plio-quaternary volcanotectonic activity in the northern sector of the main Ethiopian rift: Relationships with oblique rifting. J. Afr. Earth Sci. 29, 679–698. doi:10.1016/s0899-5362(99)00124-4
Burnside, N., Montcoudiol, N., Becker, K., and Lewi, E. (2021). Geothermal energy resources in Ethiopia: Status review and insights from hydrochemistry of surface and groundwaters. Wiley Interdiscip. Rev. Water 8 (6), e1554. doi:10.1002/wat2.1554
Casey, M., Ebinger, C. J., Keir, D., Gloaguen, R., and Mohamad, F. (2006). Strain accommodation in transitional rifts: Extension by magma intrusion and faulting in Ethiopian rift magmatic segments. Geol. Soc. Lond. Spec. Publ. 259, 143–163. doi:10.1144/gsl.sp.2006.259.01.13
Cole, J. W., Milner, D. M., and Spinks, K. D. (2005). Calderas and caldera structures: A review. Earth Sci. Rev. 69, 1–26. doi:10.1016/j.earscirev.2004.06.004
Cornwell, D. G., Maguire, P. K. H., England, R. W., and Stuart, G. W. (2010). Imaging detailed crustal structure and magmatic intrusion across the Ethiopian Rift using a dense linear broadband array. Geochem. Geophys. Geosystems 11 (1), 2637. doi:10.1029/2009gc002637
Corti, G. (2009). Continental rift evolution: From rift initiation to incipient break-up in the Main Ethiopian Rift, East Africa. Earth Sci. Rev. 96, 1–53. doi:10.1016/j.earscirev.2009.06.005
Corti, G., Sani, F., Florio, A., Greenfield, T., Keir, D., Erbello, A., et al. (2020). Tectonics of the asela-langano margin, main Ethiopian rift (east Africa). Tectonics 39, e2020TC006075. doi:10.1029/2020tc006075
Coumans, J., and Stix, J. (2016). Caldera collapse at near-ridge seamounts: An experimental investigation. Bull. Volcanol. 78, 70. doi:10.1007/s00445-016-1065-9
Darge, Y. M., Hailu, B. T., Muluneh, A. A., and Kidane, T. (2019). Detection of geothermal anomalies using Landsat 8 TIRS data in Tulu Moye geothermal prospect, Main Ethiopian Rift. Int. J. Appl. Earth Observation Geoinformation 74, 16–26. doi:10.1016/j.jag.2018.08.027
Dentith, M., and Mudge, S. (2014). Geophysics for the mineral exploration geoscientist. New York: Cambridge University Press, 426.
Ebinger, C. J., and Casey, M. (2001). Continental breakup in magmatic provinces: An Ethiopian example. Geol 29, 527–530. doi:10.1130/0091-7613(2001)029<0527:cbimpa>2.0.co;2
Fontijn, K., McNamara, K., Zafu, A., Pyle, D., Dessalegn, F., Hutchison, W., et al. (2018). Contrasting styles of post-caldera volcanism along the Main Ethiopian Rift: Implications for contemporary volcanic hazards. J. Volcanol. Geotherm. Res. 356, 90–113. doi:10.1016/j.jvolgeores.2018.02.001
Greenfield, T., Keir, D., Kendall, J. M., and Ayele, A. (2019). Seismicity of the bora-tullu Moye volcanic field, 2016–2017. Geochem. Geophys. Geosyst. 20, 548–570. doi:10.1029/2018gc007648
Guծbrandsson, S., Eysteinsson, H., Mamo, T., Cervantes, C., and Gíslason, G. (2020). “Geology and conceptual model of the Tulu Moye geothermal project, Oromia, Ethiopia,” in Proceedings world geothermal congress 2020 (Iceland: Reykjavik), 8.
Haile, T., and Tamiru, A. (2012). The interference of a deep thermal system with a shallow aquifer: The case of sodere and gergedi thermal springs, main Ethiopian rift, Ethiopia. Hydrogel 20, 561–574. doi:10.1007/s10040-012-0832-8
Hersir, G. P., and Björnsson, A. (1991). Geophysical exploration for geothermal resources: Principles and application. Reykjavik: The united nations university.
Hinze, W. J., von Frese, R. R., and Saad, A. H. (2013). Gravity and magnetic exploration: Principles, practices, and applications. New York: Cambridge University Press, 550.
Hirt, C., Claessens, S. J., Fecher, T., Kuhun, M., Pail, R., and Rxer, M. (2013). New ultra high resolution picture of Earth’s gravity field. Geophys. Res. Let. 140, 4279–4283. doi:10.1002/grl.50838
Holohan, E. P., Troll, V. R., Walter, T. R., Münn, S., McDonnell, S., and Shipton, Z. K. (2005). Elliptical calderas in active tectonic settings: An experimental approach. J. Volcanol. Geotherm. Res. 144 (1-4), 119–136. doi:10.1016/j.jvolgeores.2004.11.020
Hunt, J., Mather, T., and Pyle, D. (2020). Morphological comparison of distributed volcanic fields in the Main Ethiopian Rift using high-resolution digital elevation models. J. Volc. Geoth. Res. 393, 106732. doi:10.1016/j.jvolgeores.2019.106732
Hutchison, Pyle, W.,D., Mather, T. A., Yirgu, G., Biggs, J., Cohen, B. E., Barfod, N. B., et al. (2016). The eruptive history and magmatic evolution of Aluto volcano: New insights into silicic peralkaline volcanism in the Ethiopian rift. J. Volcanol. Geotherm. Res. 328, 9–33. doi:10.1016/j.jvolgeores.2016.09.010
Hutchison, W., Mather, T., Pyle, D., Biggs, J., and Yirgu, G. (2015). Structural controls on fluid pathways in an active rift System: A case study of the Aluto volcanic complex. Geol. Soc. Am. Bull. 8, 542–562. doi:10.1130/ges01119.1
Jacobsen, B. H. (1987). A case for upward continuation as a standard separation filter for potential-field maps. Geophysics 52, 1138–1148. doi:10.1190/1.1442378
Kahsay, L., and Yehualaw, Es. (2023). Tulu Moye geothermal operation project phase 1 GD1 and GD2 report. Ethiop. Ministry Mines 2023 Technical Report, 19.
Kassa, M., Alemu, A., and Muluneh, A. (2022). Determination of Conrad and Curie point depth relationship with the variations in lithospheric structure, geothermal gradient and heat flow beneath the central main Ethiopian rift. Heliyon 8 (11), e11735. doi:10.1016/j.heliyon.2022.e11735
Kebede, B., Pagli, C., Sigmundsson, F., Keir, D., LaRosa, A., and Gudbrandsson, S. (2023). Constraints on ground deformation processes at the Tulu Moye volcanic complex, Main Ethiopian Rift. J. Volcanol. Geotherm. Res. 438, 107810. doi:10.1016/j.jvolgeores.2023.107810
Kebede, B. (2021). The relationship between the Tulu Moye geothermal system, the ziway–asela area and the tectonic structure of the Ethiopian rift. MS Thesis. Iceland: Univ. of Iceland.
Kebede, H., Alemu, A., and Fisseha, S. (2020). Upward continuation and polynomial trend analysis as a gravity data decomposition, case study at Ziway-Shala basin, central Main Ethiopian rift. Heliyon 6 (1), e03292. doi:10.1016/j.heliyon.2020.e03292
Kebede, H., Alemu, A., and Mickus, K. (2022). Magnetic anomaly patterns and volcano-tectonic features associated with geothermal prospect areas in the Ziway-Shala Lakes Basin, Central Main Ethiopian Rift. Geothermics 105, 102484. doi:10.1016/j.geothermics.2022.102484
Keir, D., Ebinger, C. J., Stuart, G. W., Daly, E., and Ayele, A. (2006). Strain accommodation by magmatism and faulting as rifting proceeds to breakup: Seismicity of the northern Ethiopian rift. J. Geophys. Res. Solid Earth 111 (B5), 3748. doi:10.1029/2005jb003748
Kendall, J. M., Pilidou, S., Keir, D., Bastow, I. D., Stuart, G. W., and Ayele, A. (2006). Mantle upwellings, melt migration and the rifting of Africa: Insights from seismic anisotropy. Geol. Soc. Lond. Spec. Publ. 259, 55–72. doi:10.1144/gsl.sp.2006.259.01.06
Keranen, K., Klemperer, S. L., and Gloaguen, R.the EAGLE working group (2004). Three dimensional seismic imaging of a protoridge axis in the Main Ethiopian rift. Geol 32, 949–952. doi:10.1130/g20737.1
King, D., and Metcalfe, E. (2013). “Rift zones as a case study for advancing geothermal occurrence models,” in Proceedings thirty-eighth workshop on geothermal reservoir engineering (Stanford, California: SGP-TR), 11–13.
Kurtz, T., Gloaguen, R., Ebinger, C., Casey, M., and Abebe, B. (2007). Deformation distribution and type in the main Ethiopian rift (MER): A remote sensing study. J. Afr. Earth Sci. 48, 100–114. doi:10.1016/j.jafrearsci.2006.10.008
Lewi, E., Keir, D., Birhanu, Y., Blundy, J., Stuart, G., Wright, T., et al. (2016). Use of a high-precision gravity survey to understand the formation of oceanic crust and the role of melt at the southern Red Sea rift in Afar, Ethiopia. Geol. Soc. Lond. Spec. Publ. 420, 165–180. doi:10.1144/sp420.13
Li, X. (2006). Understanding 3D analytic signal amplitude. Geophysics 71, L13–L16. doi:10.1190/1.2184367
Mackenzie, G. D., Thybo, H., and Maguire, P. K. H. (2005). Crustal velocity structure across the main Ethiopian rift: Results from two-dimensional wide-angle seismic modelling. Geophys. J. Int. 162 (3), 994–1006. doi:10.1111/j.1365-246x.2005.02710.x
Mackie, R., and Cunningham, C. (1982). Density and magnetic susceptibility measurements of igneous rocks from the Marysville volcanic field, west-central Utah. USGS open-file report 82-892.
Maestrelli, D., Bonini, M., Corti, G., Del Ventisette, C., Moratti, G., and Montanari, D. (2021b). A database of laboratory analogue models of caldera collapse testing the role of inherited structures. Front. Earth Sci. 9. doi:10.3389/feart.2021.618258
Maestrelli, D., Corti, G., Bonini, M., Montanari, D., and Sani, F. (2021a). Caldera collapse and tectonics along the main Ethiopian rift: Reviewing possible relationships. Sci. Planète 353, 91–109. doi:10.5802/crgeos.63
Maguire, P. K. H., Keller, G. R., Klemperer, S. L., Mackenzie, G. D., Keranen, K., Harder, S., et al. (2006). Crustal structure of the northern Main Ethiopian Rift from the EAGLE controlled-source survey; a snapshot of incipient lithospheric break-up. Geol. Soc. Lond. Spec. Publ. 259 (1), 269–292. doi:10.1144/gsl.sp.2006.259.01.21
Mammo, T. (2010). Delineation of sub-basalt sedimentary basins in hydrocarbon exploration in north Ethiopia. Mar. Pet. Geol. 27, 895–908. doi:10.1016/j.marpetgeo.2009.12.009
Mazzarini, F., Abebe, T., Innocent, F., Manetti, P., and Pareschi, M. T. (1999). Geology of the Debre Zeyit area (Ethiopia) (with a geological map at scale 1:100.000). Acta Vulcanol. 11, 131–141.
Mickus, K., Kennedy, W., and Aiken, C. (1992). Regional-residual gravity anomaly separation using the minimum-curvature technique. Geophysics 56, 279–283. doi:10.1190/1.1443041
Mickus, K., Ketsela, K., Keller, G., and Oluma, B. (2009). Three-dimensional gravity modeling of the magmatic segments within the Main Ethiopian Rift. Tanzanian J. Earth Sci. 1, 96–106. doi:10.13140/RG.2.1.3879.9524
Mickus, K., Tadesse, K., Keller, G. R., and Oluma, B. (2007). Gravity analysis of the main Ethiopian rift. J. Afr. Earth Sci. 48, 59–69. doi:10.1016/j.jafrearsci.2007.02.008
Muhabaw, Y., Muluneh, A. A., Nugsse, K., Gebru, E. F., and Kidane, T. (2022). Paleomagnetism of Gedemsa magmatic segment, main Ethiopian rift: Implication for clockwise rotation of the segment in the early pleistocene. Tectonophysics 838, 229475. doi:10.1016/j.tecto.2022.229475
Mulugeta, B., Fujimitsu, Y., Nishijima, J., and Saibi, H. (2021). Interpretation of gravity data to delineate the subsurface structures and reservoir geometry of the Aluto–Langano geothermal field, Ethiopia. Geothermics 94, 102093. doi:10.1016/j.geothermics.2021.102093
Nigussie, W., Alemu, A., Mickus, K., and Muluneh, A. (2022a). Structure of the upper crust at the axis segmentation of rift evolution, Case study of the Gedemsa magmatic segment, Main Ethiopian Rift. J. Afri. Earth Sci. 190, 1–11. doi:10.1016/j.jafrearsci.2022.104523
Nigussie, W., Alemu, A., Muluneh, A. A., Mickus, K., Muhabaw, Y., and Ballay, M. (2022b). Formation of magmatic segments within the aluto-gedemsa area, main Ethiopian rift. Ital. J. Geosci. 142 (1), 28–41. doi:10.3301/IJG.2023.02
Nigussie, W., Mickus, K., Keir, D., Alemu, A., Muhabaw, Y., Muluneh, A. A., et al. (2023). Subsurface structure of magmatic segments during continental breakup: Perspectives from a gravity data analysis along the Main Ethiopian Rift. Front. earth Sci. 10, 92759. doi:10.3389/feart.2022.1092759
Omenda, P. (1998). “The geothermal activity of the East African Rift,” in Short course IV on exploration for geothermal resources (Lake Naivasha, Kenya: UNU-GTP), 1–12.
Peccerillo, A., Barberio, M. R., Yirgu, G., Ayalew, D., Barbieri, M. W. U. T. W., and Wu, T. W. (2003). Relationships between mafic and peralkaline silicic magmatism in continental rift settings: A petrological, geochemical and isotopic study of the Gedemsa volcano, central Ethiopian rift. J. Petrology 44 (11), 2003–2032. doi:10.1093/petrology/egg068
Phillips, J. (2001). Designing matched bandpass and azimuthal filters for the separation of potential-field anomalies by source region and source type. Aust. Soc. Explor. Geophys. 4, 1–4. doi:10.1071/aseg2001ab110
Phillips, J. (2000). “Locating magnetic contacts: A comparison of horizontal gradient, analytic signal and local wavenumber methods,” in Soc. of Explor. Geophys. extended abstracts with programs (Oklahoma: SEG). doi:10.1190/1.1816078
Reinsch, T., Dobson, P., Asanuma, H., Huenges, E., Poletto, F., and Sanjuan, B. (2017). Utilizing geothermal systems: A review of past ventures and ongoing research activities. Geotherm. Energy 5, 1–5. doi:10.1186/s40517-017-0075-y
Ruch, J., Acocella, V., Geshi, N., Nobile, A., and Corbi, F. (2012). Kinematic analysis of vertical collapse on volcanoes using experimental models time series. J. Geophys. Res. 117, B07301. doi:10.1029/2012jb009229
Samrock, F., Grayver, A. V., Bachmann, O., Karakas, O., and Saar, M. O. (2021). Integrated magnetotelluric and petrological analysis of felsic magma reservoirs: Insights from Ethiopian rift volcanoes. Earth Planet Sci. Lett. 559, 116765. doi:10.1016/j.epsl.2021.116765
Samrock, F., Grayver, A. V., Eysteinsson, H., and Saar, M. O. (2018). Magnetotelluric image of transcrustal magmatic system beneath the Tullu Moye geothermal prospect in the Ethiopian Rift. Geophys. Res. Lett. 45, 12–847. doi:10.1029/2018GL080333
Samrock, F., Kuvshinov, A., Bakker, J., Jackson, A., and Fisseha, S. (2015). 3-D analysis and interpretation of magnetotelluric data from the Aluto-Langano geothermal field, Ethiopia. Geophys. J. Int. 202, 1923–1948. doi:10.1093/gji/ggv270
Scandone, R. (1990). Chaotic collapse of calderas. J. Volc. Geoth. Res. 42, 285–302. doi:10.1016/0377-0273(90)90005-z
Tadesse, A. Z., Fontijn, K., Caricchi, L., Bégué, F., Gudbrandsson, S., Smith, V. C., et al. (2023). Pre-eruptive storage conditions and magmatic evolution of the Bora-Baricha-Tullu Moye volcanic system, Main Ethiopian Rift. Lithos 442-443, 107088. doi:10.1016/j.lithos.2023.107088
Teklemariam, M. (2011). “Overview of geothermal resource exploration and development in the East African rift system,” in Short course VI on exploration for geothermal resources (Kenya: UNU-GTP, GDC).
Telford, W. S., Geldart, L. P., and Sheriff, R. E. (1990). Applied Geophysics. second ed. Cambridge: Cambridge University Press.
Troll, V., Walter, T., and Schmincke, H. (2002). Cyclic caldera collapse: Piston or piecemeal subsidence? Field and experimental evidence. Geology 30, 135–138. doi:10.1130/0091-7613(2002)030<0135:cccpop>2.0.co;2
Varet, J., and Birba, E. (2018). “Tulu Moye geothermal project (oromia, Ethiopia),” in Proceedings of the 7th African rift geothermal conf (Kigali, Rwanda: African Rift Geothermal), 231–235.
Varet, J., Omenda, P., and Birba, E. (2020). “Giant geothermal sites along the East Africa Rift System (EARS): The determinant volcano-structural setting,” in Proceedings, 8th African Rift geothermal conference (Nairobi, Kenya: African Rift Geothermal), pp16.
Wadge, G., Biggs, J., Lloyd, R., and Kendall, J. (2016). Historical volcanism and the state of stress in the East African Rift System. Front. Earth Sci. 4, 1–24. doi:10.3389/feart.2016.00086
Wilks, M., Kendall, J. M., Nowacki, A., Biggs, J., Wookey, J., Birhanu, Y., et al. (2017). Seismicity associated with magmatism, faulting, and hydrothermal circulation at Aluto Volcano, Main Ethiopian Rift. J. Volcanol. Geotherm. Res. 340, 52–67. doi:10.1016/j.jvolgeores.2017.04.003
Woldegebrel, G., Aronson, J. L., and Walter, R. C. (1990). Geology, geochronology, and rift basin development in the central sector of the Main Ethiopia Rift. Geol. Soc. Am. Bull. 102, 439–458. doi:10.1130/0016-7606(1990)102<0439:ggarbd>2.3.co;2
Keywords: East African Rift, gravity/magnetic anomalies, geothermal resources, subsurface structure, Tulu Moye geothermal prospect
Citation: Nigussie W, Alemu A, Mickus K, Keir D, Demissie Z, Muhabaw Y, Muluneh AA, Corti G and Yehualaw E (2023) Subsurface structural control of geothermal resources in a magmatic rift: gravity and magnetic study of the Tulu Moye geothermal prospect, Main Ethiopian Rift. Front. Earth Sci. 11:1181533. doi: 10.3389/feart.2023.1181533
Received: 07 March 2023; Accepted: 13 July 2023;
Published: 26 July 2023.
Edited by:
Victor Sacek, University of São Paulo, BrazilReviewed by:
Catherine A. Meriaux, University of Rwanda, RwandaTim Greenfield, University of Cambridge, United Kingdom
Mohammad Youssof, University of Copenhagen, Denmark
Copyright © 2023 Nigussie, Alemu, Mickus, Keir, Demissie, Muhabaw, Muluneh, Corti and Yehualaw. This is an open-access article distributed under the terms of the Creative Commons Attribution License (CC BY). The use, distribution or reproduction in other forums is permitted, provided the original author(s) and the copyright owner(s) are credited and that the original publication in this journal is cited, in accordance with accepted academic practice. No use, distribution or reproduction is permitted which does not comply with these terms.
*Correspondence: Wubamlak Nigussie, wubmulnig12@gmail.com