


Monitoring Amazon EKS logs and metrics with the Elastic Stack
To achieve unified observability, we need to gather all of the logs, metrics, and application traces from an environment. Storing them in a single datastore drastically increases our visibility, allowing us to monitor other distributed environments as well.
In this blog, we will walk through one way to set up observability of your Kubernetes environment using the Elastic Stack — giving your team insight into the metrics and performance of your deployment. Using Amazon EKS as an example, the step-by-step instructions below help you to deploy, enumerate, and understand your deployment with a greater level of depth.
What we are monitoring:
- The AWS account
- Kubernetes hosts
- Docker containers
- Kubernetes cluster
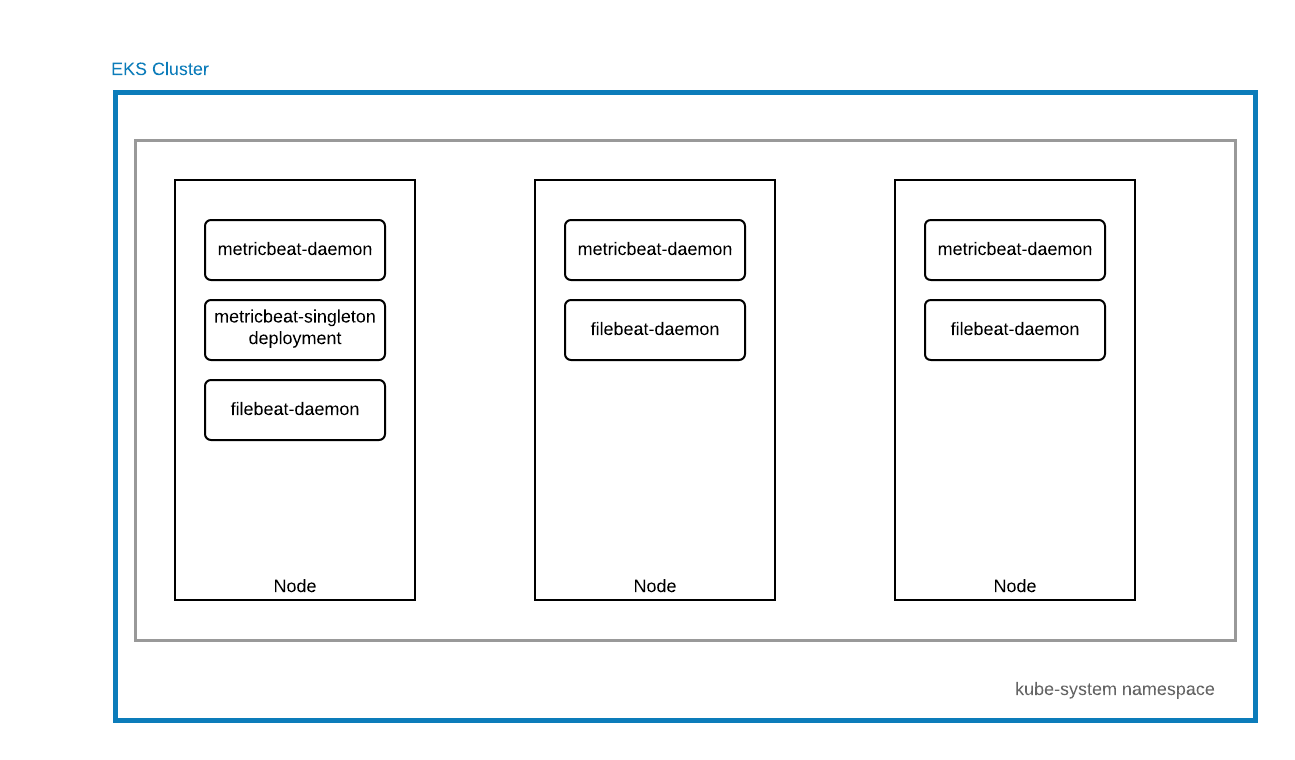
We’ll use Metricbeat to collect system, host, and platform metrics, and Filebeat to collect application and system logs. You can easily extend this setup by enabling modules specific to your needs. Metricbeat and Filebeat support a whole range of out-of-the-box modules to parse and transform your data into the Elastic Common Schema (ECS) for easy analysis.
For this example, we will use out-of-the-box modules and dashboards that ship with the Elastic Stack:
Prerequisites
- An Elastic Cloud account or cluster
- AWS account (able to provision and use EKS, able to create IAM users, IAM policies)
- AWS command line tool to create and manage AWS resources
- eksctl to create your EKS cluster on AWS
- About 30 minutes of your time
Let's get started
Step 1. Clone artifacts for Kubernetes
Clone the artifacts you’re going to be using to create your k8s deployments
git clone https://github.com/elastic/examples
cd examples/MonitoringEKS
Step 2. Create EKS cluster
Create an EKS cluster with eksctl. This will take about 10-15 minutes to provision.
eksctl create cluster --name my-cluster --version 1.14
An IAM user is required for Metricbeat to be able to scrape AWS specific metrics. A full list of available metricsets and exported fields from this module is the AWS module documentation.
Step 3. Create AWS IAM policy for Metricbeat
Create an AWS IAM policy for the Metricbeat user (permissions are described in the policy-document)
aws iam create-policy --policy-name MetricbeatAllMetricsets --policy-document file://config/metricbeat-iam-policy.json
Step 4. Create AWS IAM user for Metricbeat
Create an AWS IAM user with the MetricbeatAllMetricsets policy attached
aws iam create-user --user-name metricbeat-aws
aws iam create-access-key --user-name metricbeat-aws
aws iam attach-user-policy --user-name metricbeat-aws --policy-arn arn:aws:iam::ACCOUNT_ID:policy/MetricbeatAllMetricsets
Note down the access_key_id and access_key_secret from the previous step.
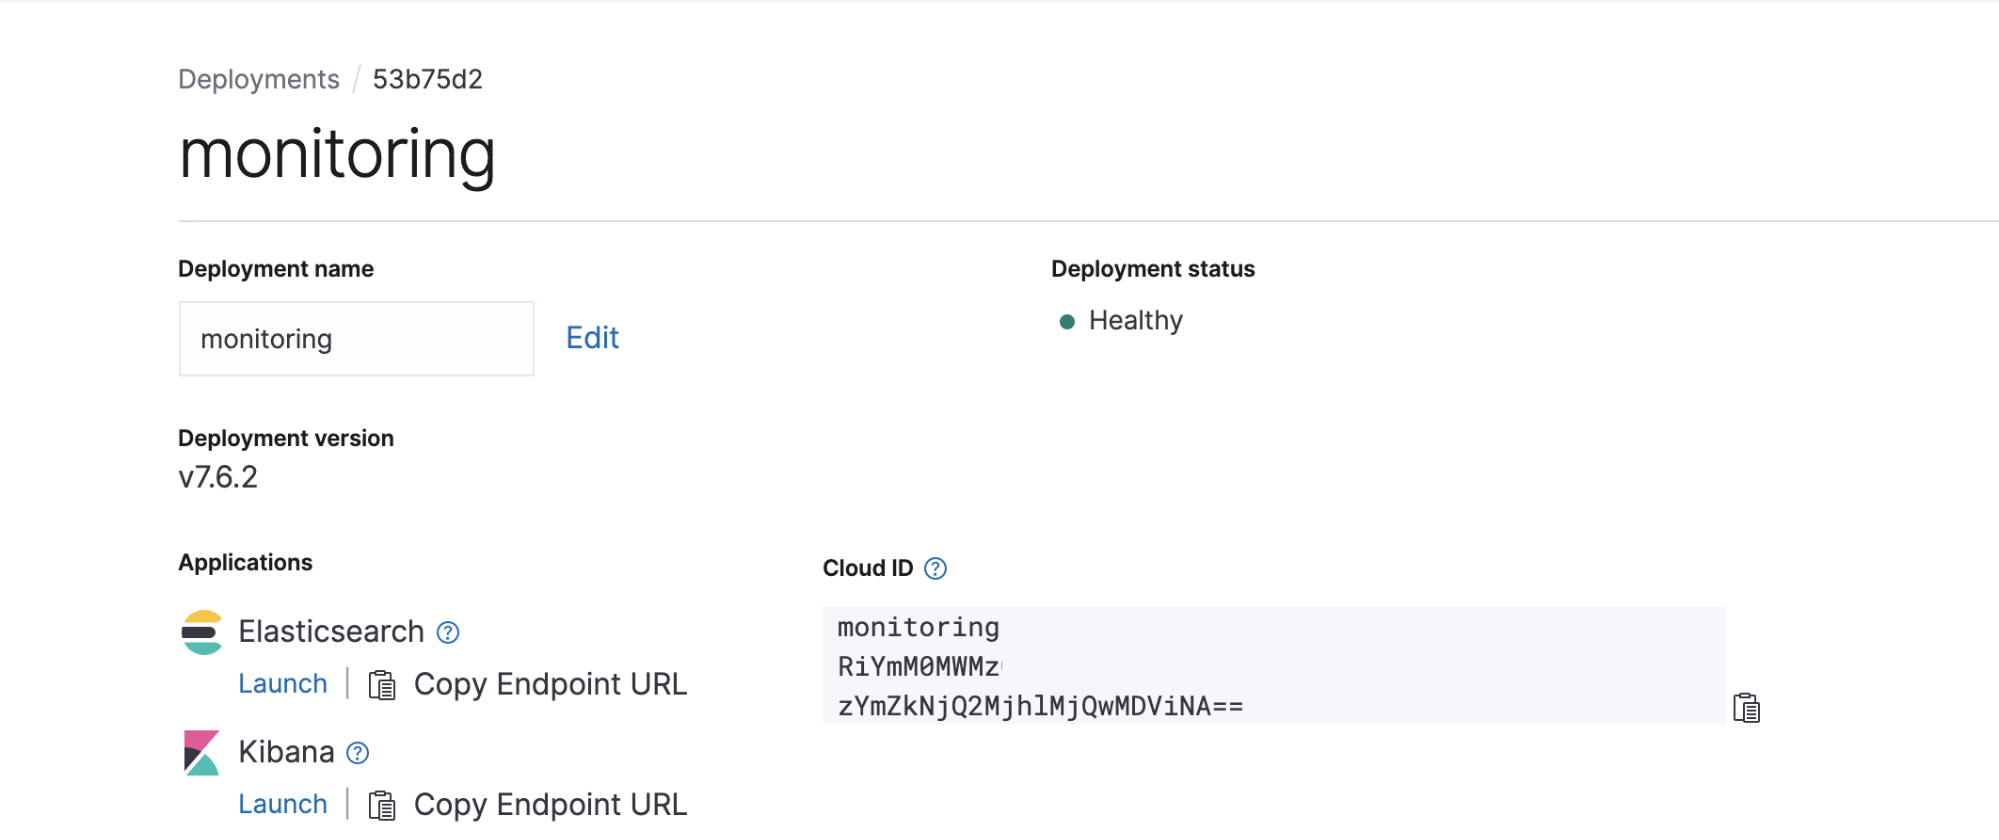
5. Spin up Elasticsearch cluster
Start a free trial of Elasticsearch Service on Elastic Cloud, and create a new deployment.
6. Update secrets.yaml
Fill in your credentials into secrets/secrets.yaml. The values need to be base64 encoded within this file.
ELASTIC_CLOUD_IDcan be found on the deployment page on Elastic Cloud
ELASTIC_CLOUD_AUTHis yourusername:passwordfor your Elastic Cloud deploymentAWS_ACCESS_KEY_IDandAWS_ACCESS_KEY_SECRETcan be downloaded when you create your AWS IAM user account
echo "your credential" | base64
Alternatively, use the script provided to generate this file for you. To do this, fill in your credentials in the following 4 files. (single line, no extra characters):
- secrets/CREDS/ELASTIC_CLOUD_ID
- secrets/CREDS/ELASTIC_CLOUD_AUTH
- secrets/CREDS/AWS_ACCESS_KEY_ID
- secrets/CREDS/AWS_ACCESS_KEY_SECRET
And then run:
(cd secrets && ./generate-secrets-manifest.sh)
7. Create Kubernetes resources
Clone the kube-state-metrics repository from https://github.com/kubernetes/kube-state-metrics
git clone https://github.com/kubernetes/kube-state-metrics
# Deploy kube-state-metrics
kubectl apply -f kube-state-metrics/examples/standard
# Deploy your secrets
kubectl apply -f secrets/secrets.yaml
# Deploy metricbeat for kubernetes
kubectl apply -f beats/metricbeat-kubernetes.yaml
# Deploy filebeat for kubernetes
kubectl apply -f beats/filebeat-kubernetes.yaml
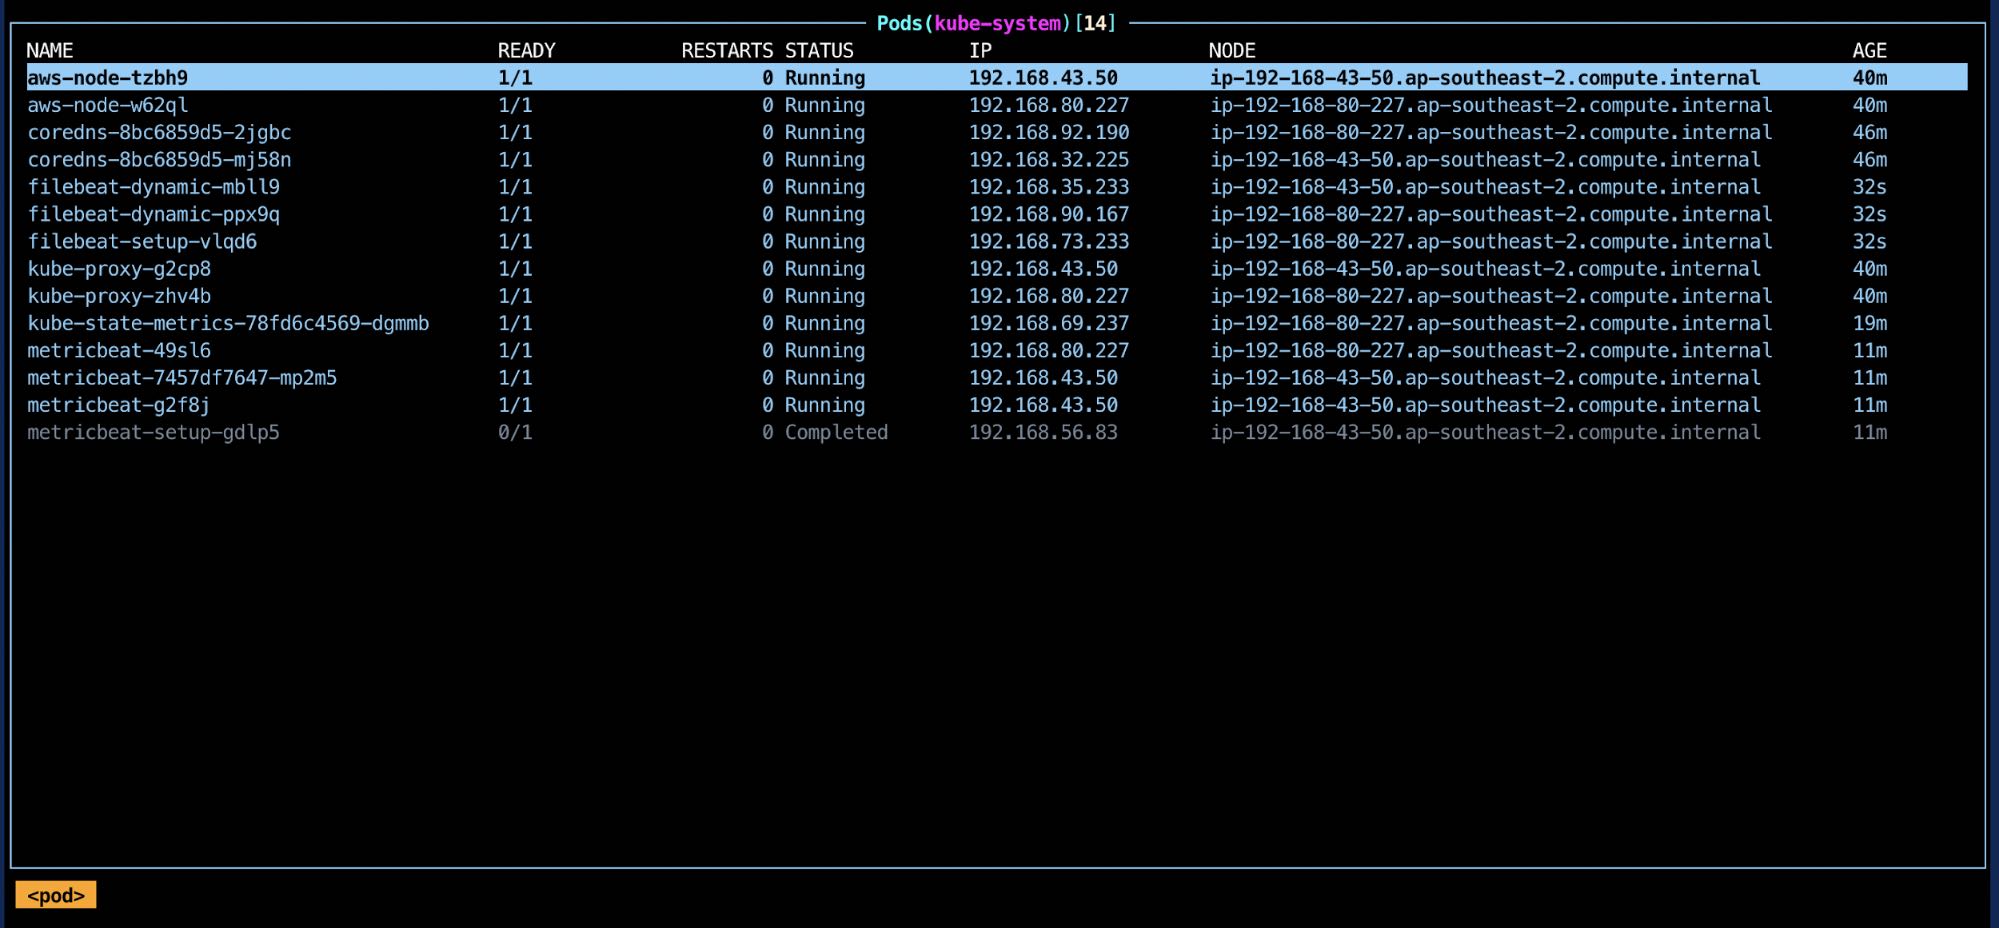
Visualizing observability within Kibana
If everything has gone well, you will now have metric and log data coming into your Elastic Cloud instance. It’s time to open up Kibana and start exploring.
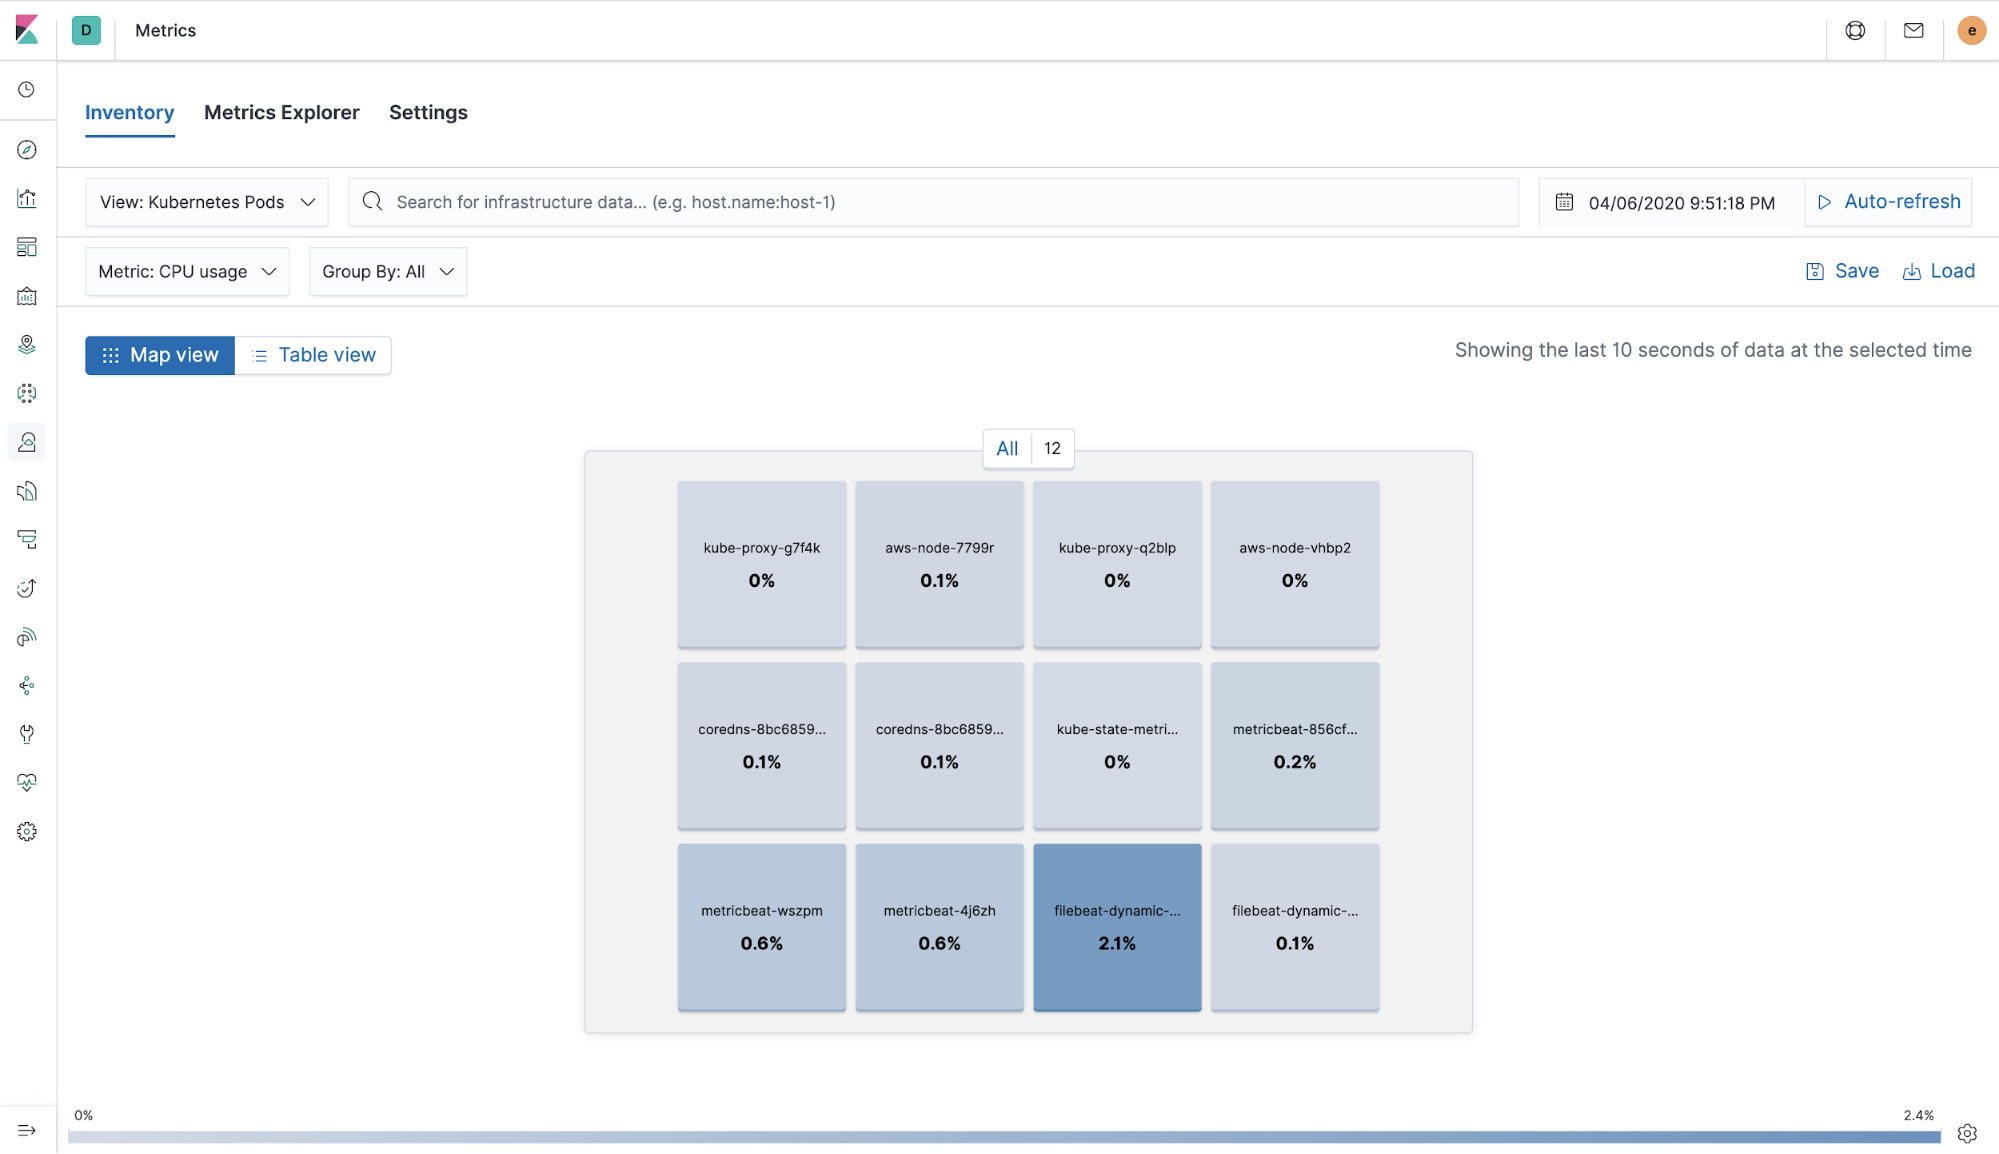
Metrics app
Continuously and quickly explore high-cardinality metrics at scale in the visualization of your choice. Get a bird’s eye view of your infrastructure and dig into current and historical performance.
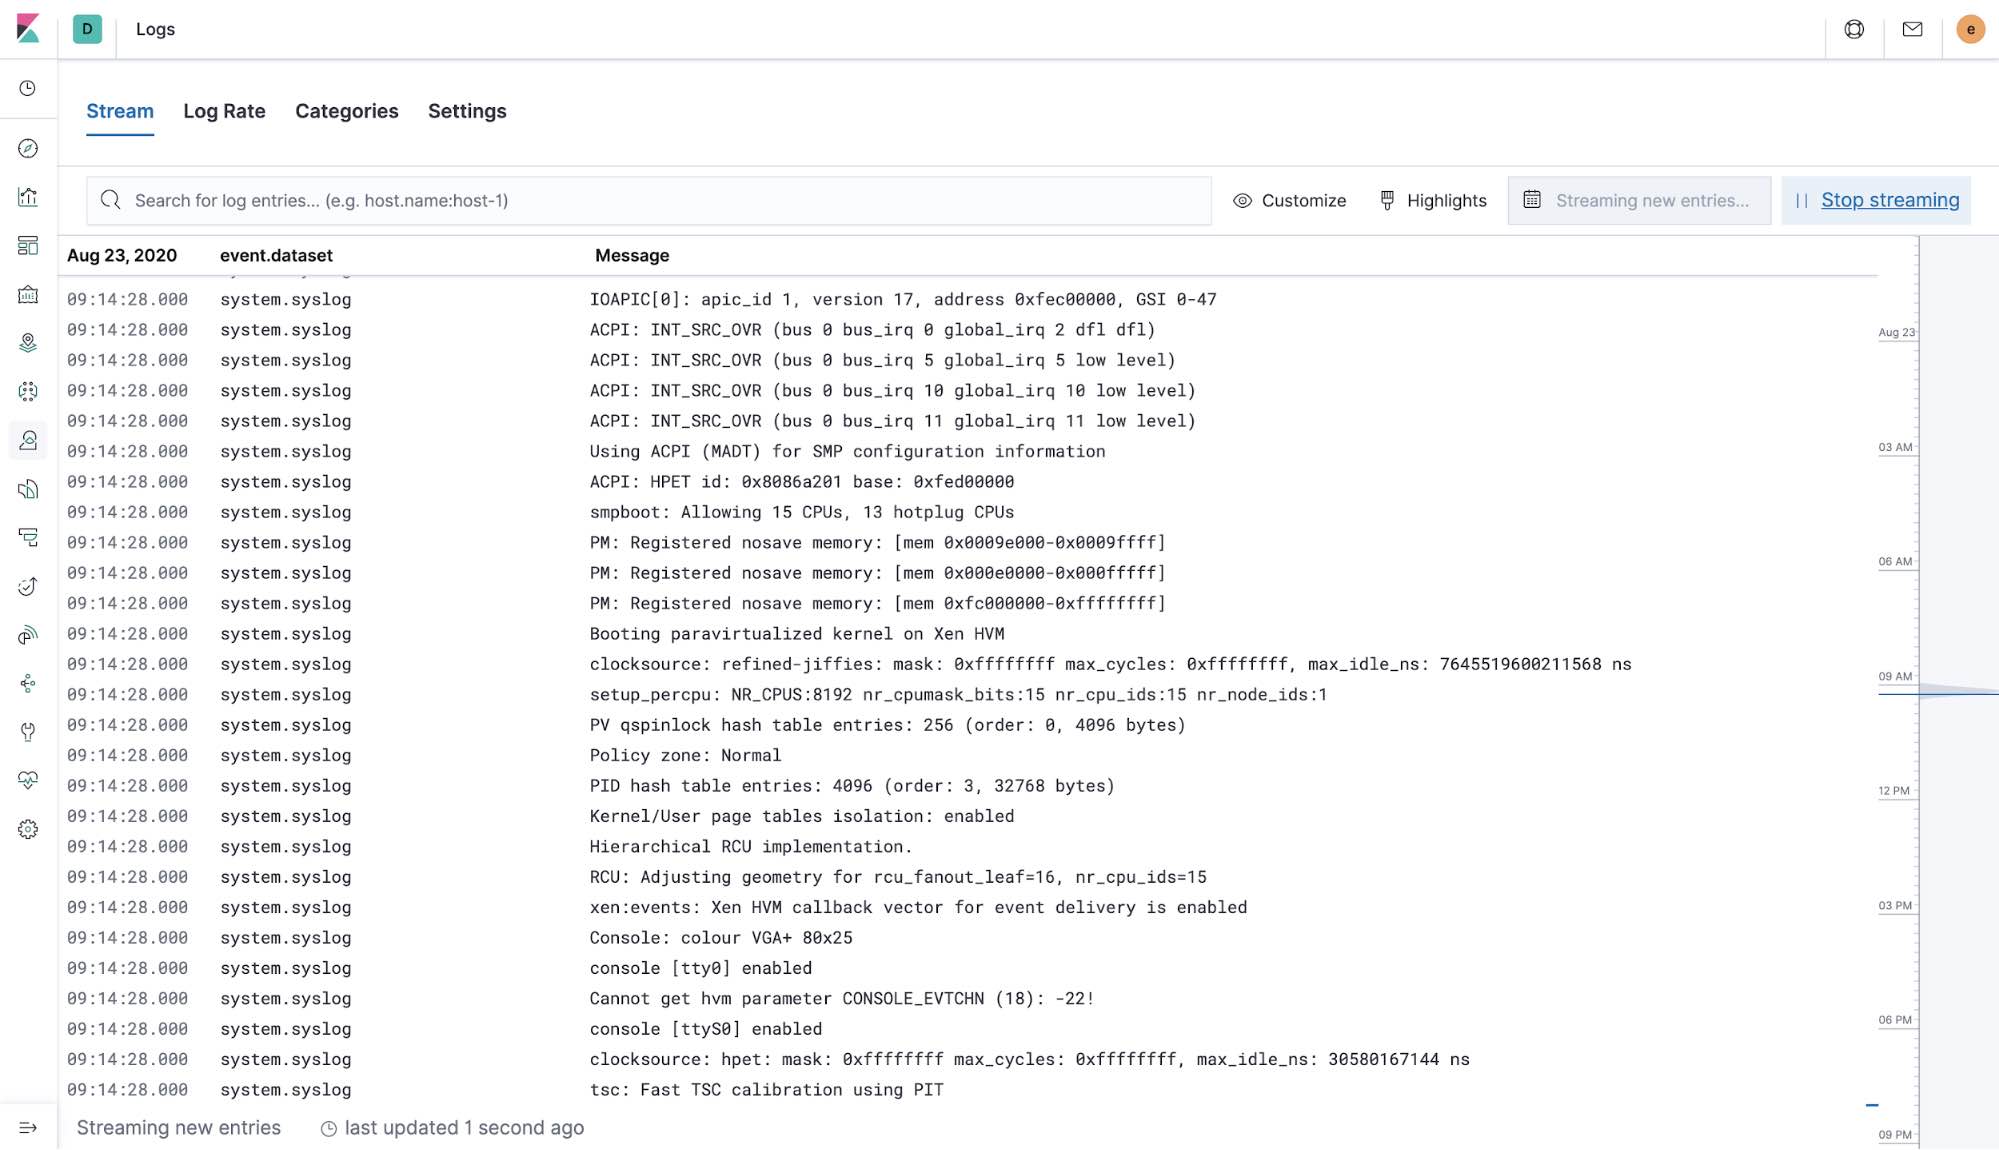
Logs app
Visualize a holistic view of your systems and view activity by host in just a click. Tail a file directly in the app and analyze trends with categorized logs.
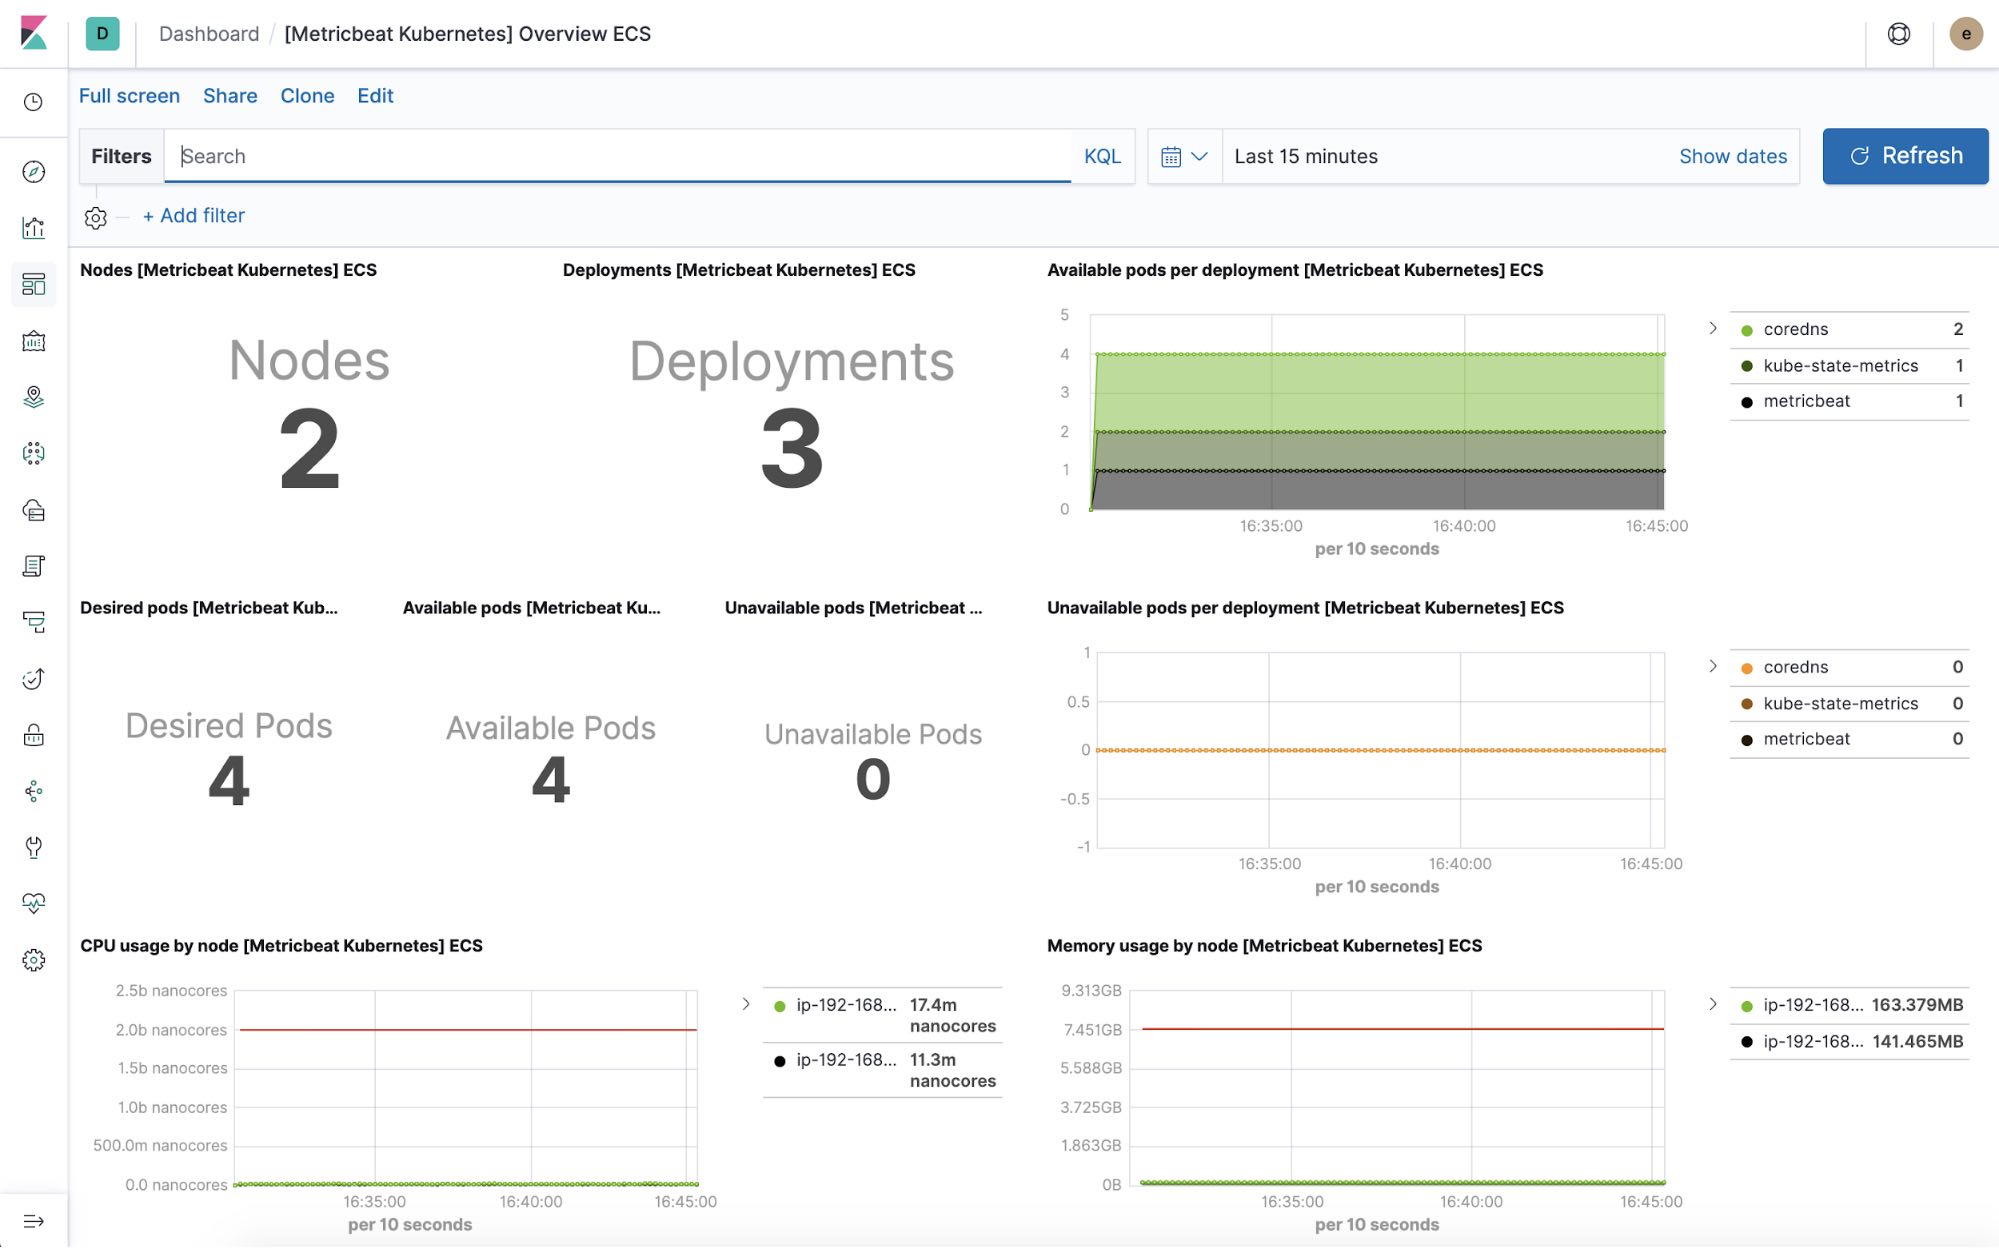
Kubernetes overview dashboard
Get visibility into your orchestration environment and filter your Kubernetes logs by host, pod, or custom metadata.
Cleaning up (optional)
Clean up any resources you’ve created once you're done.
eksctl delete cluster my-cluster
aws iam detach-user-policy --user-name metricbeat-aws --policy-arn xxx
arn:aws:iam::ACCOUNT_ID:policy/MetricbeatAllMetricsets
aws iam delete-policy --policy-arn arn:aws:iam::ACCOUNT_ID:policy/MetricbeatAllMetricsets
aws iam delete-access-key --access-key-id xxxxxx --user-name metricbeat-aws
aws iam delete-user --user-name metricbeat-aws
That was easy!
As demonstrated above, with added visibility into your Kubernetes deployment, one can easily observe the availability of the infrastructure (uptime), tail the logs of the containers or errors with greater visibility and more importantly, the performance of the entire cluster combined in a single platform. And if you want to level up to Depth+1, consider application performance monitoring with Elastic APM. Try it out free in Elastic Cloud.