
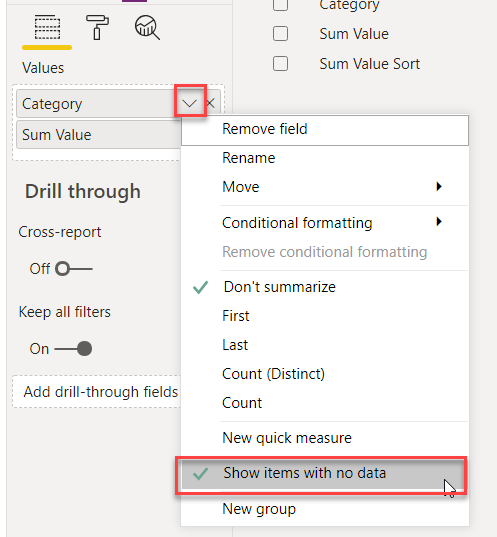
In this blog post, I want to share with you all a trick that I recently used to meet one of my client’s requirements. Basically, they wanted to see a very simple table that showed Sales by Category, and they also wanted to see all the categories in the visual even if some of those categories don’t have any sales. As we know, if you put a measure in a visual and it returns BLANK, that data point will not be shown. For example, let’s say that we have ten categories and there are sales for only eight of those categories. If you show sales by category in a table or bar chart visual, the visual won’t display the categories that don’t have any sales. In order to show all the categories, we can use Show items with no data (image below) or we can make changes to the measure in order to return a Zero value by adding Zero to the measure value.
Learn more about Show Items with No Data here.
Return a Zero value by adding Zero to the measure value:
Sum Sales = SUM ( 'Table'[Sales] ) + 0
Problem Statement
Another request that they had was to sort Sales in ascending order, with all of the blank values at the bottom. You would think that this would be pretty straightforward – but sorting by Sales actually shows blank values in between the positive and negative values.
Let’s look at my sample data. It has two columns: Categories and Sum Sales. If we put in the Categories column (with the Show items with no data option selected) and sort it by value in the table visual, we get the following result. As you can see, the blank values are the between positive and negative values.

Solution
I created a Calculated Table using the following DAX expression, and then used the sort by column feature to correctly sort the Sum Sales column.
Table Sort =
VAR __minNegativeValue = MINX ( VALUES ( 'Table'[Category] ), IF ( [Sum Sales] < 0, [Sum Sales] ) ) - 1
RETURN
SUMMARIZE(
    'Table',
    'Table'[Category],
    "Sum Sales", [Sum Sales],
    "Sum Sales Sort", IF ( [Sum Sales] = BLANK(), __minNegativeValue, [Sum Sales] )
)
Learn more about Calculated Tables here.
In the above DAX expression, the most important thing is to sort the BLANK() values so that they are sorted to be the last “number.” We want the BLANK() values to be after the negative values and this is achieved by creating __minNegativeValue VAR in DAX.
In our example dataset, the minimum negative value is -62 and __minNegativeValue VAR in our DAX will return -63 and by sorting Sum Sales values by Sum Sort Column, BLANK() values will show at the bottom of the table.
Follow these steps in the new calculated table to sort the Sum Sales column:
- First, select the Sum Sales column.
- Then, go to the “Column Tools” tab.
- From the sort by column option, choose the Sum Sales Sort column.

Learn more about Sort by Column here.
Once the column has been sorted, I can now use the Sum Sales column in my visuals with the data sorted correctly.

And that’s it – you’re done! I hope you found this blog post helpful.


No comment yet, add your voice below!