
Anyone who has studied “A” and “IB” level Economics would know imperfect market competition to be a scourge in social welfare.
Studying the problem naturally requires students to also be equipped with the means of identifying the said problem for a more holistic understanding the topic.
The n-firm concentration ratio.
The n-firm concentration ratio is commonly taught as part of both syllabi.
Formally, the n-firm concentration ratio is represented as:
CRn = m1 +m2 + … + mn = nΣi=1 mi
Where mi refers to the market share of the ith firm as ranked in market share.
The most common n value used in the n-firm concentration ratio is 4, and is accordingly referred to as the 4-firm concentration ratio in schools.
We could use some examples to illustrate how this works, and also glean some weakness from this approach using the following market scenarios comprising:
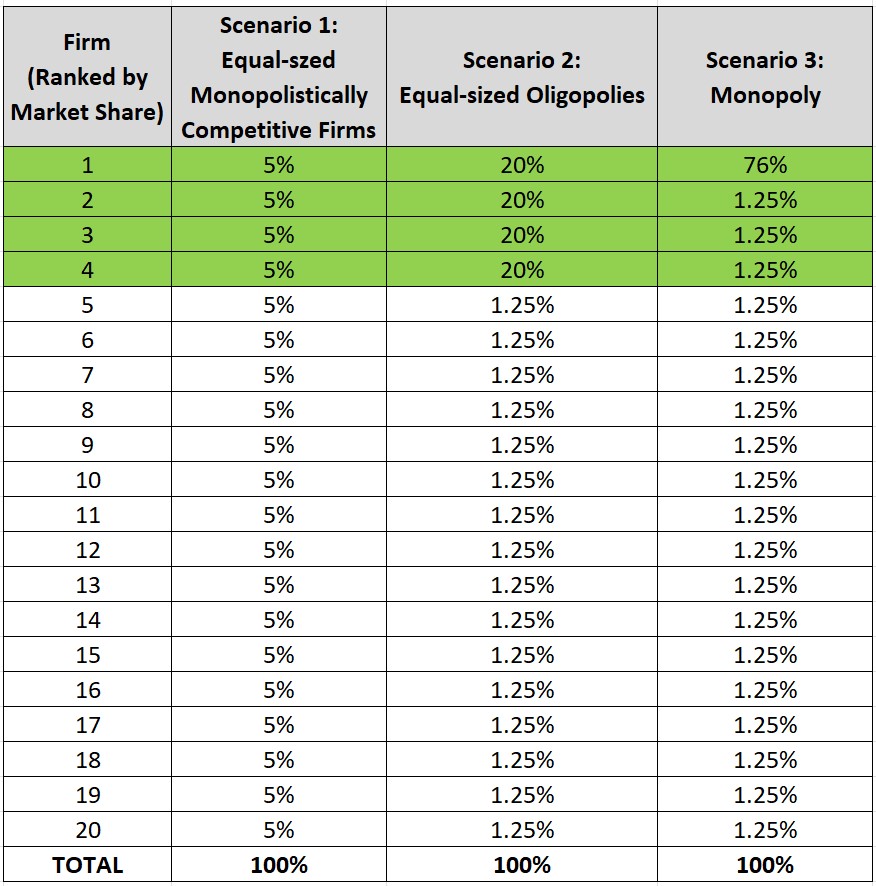
Accordingly, we will be able to calculate the 4-firm concentration ratios based on the sum of market shares of the 4 largest firms (highlighted in green above):
- Scenario 1: 5% + 5% + 5% + 5% = 20%
- Scenario 2: 20% + 20% + 20% + 20% = 80%
- Scenario 3: 76% + 1.25% + 1.25% + 1.25% = 84%
We can easily see that the 4-firm concentration ratio indeed scales with the market concentration between the largest firms, and at 20%, the ratio calculated for Scenario 1 (Monopolistically Competitive) correctly yields the lowest figure.
On the other hand, with the benefit of knowing the actual market conditions in our example, we can observe the following weaknesses of using the n-firm concentration ratio in determining the level of market concentration.
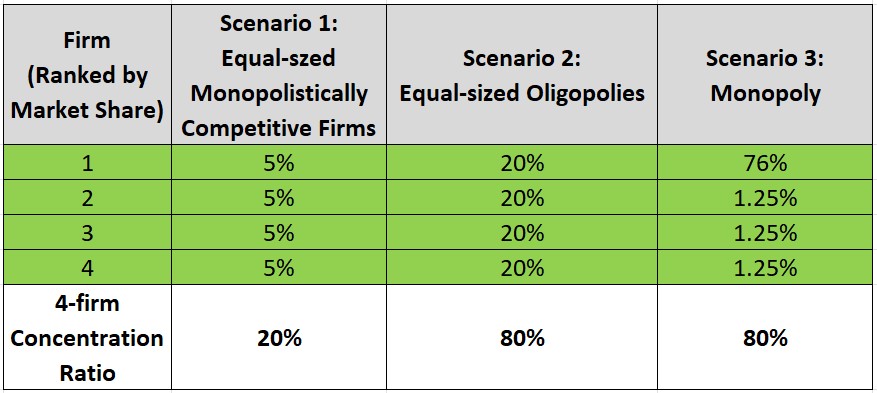
Weakness 1: The n-firm concentration ratio cannot reveal the market concentration distribution within the top n firms in isolation.
Between the 4-firm concentration ratios calculated for Scenario 2 (4 equally large firms) and Scenario 3 (1 very large, 3 very small firms) respectively, the n-firm concentration ratios are exactly the same, even if the true state of market concentration is in fact very different:
We can mitigate this issue by reporting additional figures associated with differing values of n, but this defeats the purpose of “standardising” to n=4, and is also little different from merely viewing Table 1 as is.
Clearly that isn’t a palatable option for data story-telling. Also, exercising flexibility to n in such fashion, raises questions on its very arbitrary nature…
Weakness 2: The arbitrary value of n.
If the lack of visibility into the distribution of market concentration beyond that directly observed for the given n number of firms was an issue, then perhaps a backward or forward extension on n might mitigate the problem.
So in the case of a 4-firm concentration ratio, where data permits, calculating for a 3-firm, or even a 5-firm version as well, may offer further insights into the “true” market concentration.
Extending that logic even further, there is nothing to stop us from calculating for just about all feasible values of n, except that it defeats the purpose of having the simplistic 4-firm concentration ratio for the following reasons:
- To provide a “one-glance” informational aid to the observer; and
- To have a consistent single metric to compare across multiple markets.
The Herfindahl–Hirschman Index.
In most cases, conceptual shortcomings to a metric can be mitigated by:
- Complementing it with other metrics; and/or
- Adding more complexity to the metric’s formulation.
In the case of the latter, 2 brilliant chaps, Orris Clemens Herfindahl and Albert Otto Hirschman, independently proposed utilising power functions as a straightforward way to improve on the formulation of the concentration ratio.
Although, their proposals involved the use of the square-root function on each firm’s market share originally, the current accepted form of the index, the Herfindahl–Hirschman Index (HHI), utilises the square function rather.
Formally, the HHI can be represented as:
HHI = m12 + m22 + … + mN2 = NΣi=1 mi2
Where mi refers to the market share of that ith firm; and N refers to the number of the firms in that market.
Aside from the addition of the square function, the other difference from the n-firm concentration ratio lies in the summation of all firms in the market, rather than with the top n firms only.
We will get into the detailed implications of these changes, in a bit, but we can tap on our example again, to illustrate the differences between both metrics:
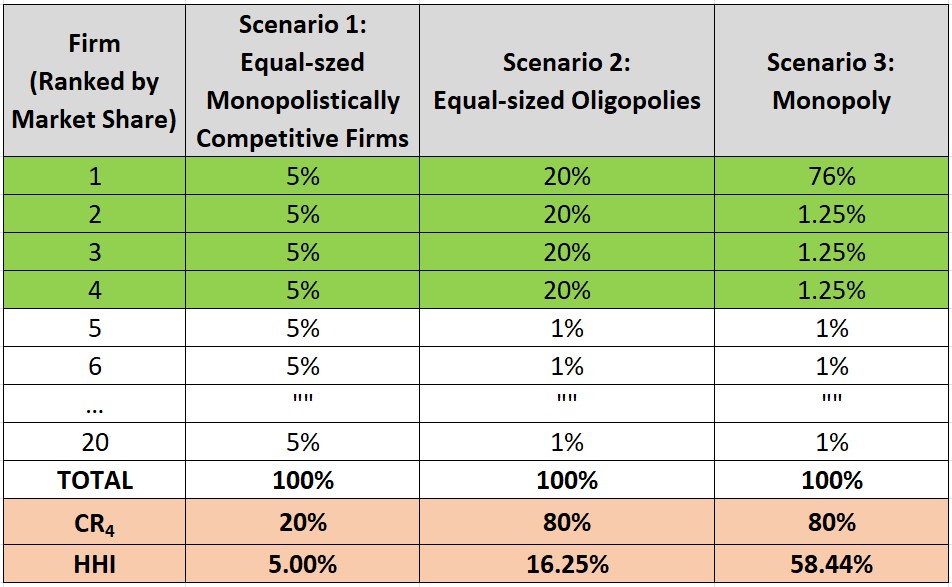
Weakness Advantage 1: The HHI can allow inferences to the true state of market concentration.
Between Scenario 2 and 3, the 4-firm concentration ratio is unable to show in itself, the fact that Firm 1 is extremely large in the latter scenario, because both ratios were calculated to the same figure.
With the HHI however, we can see that the concentration index is now a higher figure, which correctly implies that the market concentration in Scenario 3 is strongly skewed towards very few firms, as compared with Scenario 2.
A market with N firms and minimal market concentration cannot have a HHI that is lower than 1/N.
We can easily prove this by recognising that the intent of the HHI must mean that for a given market, the lowest HHI must be assigned to a case where all firms have equal market shares (minimal market concentration), which in this case:
HHI = N * (1/N)2 = 1/N
Taking the simplest case of having only 2 equally sized firms (with market share of 50% each therefore), the original HHI would be 50% as we noted earlier (black arrow in the graph below):
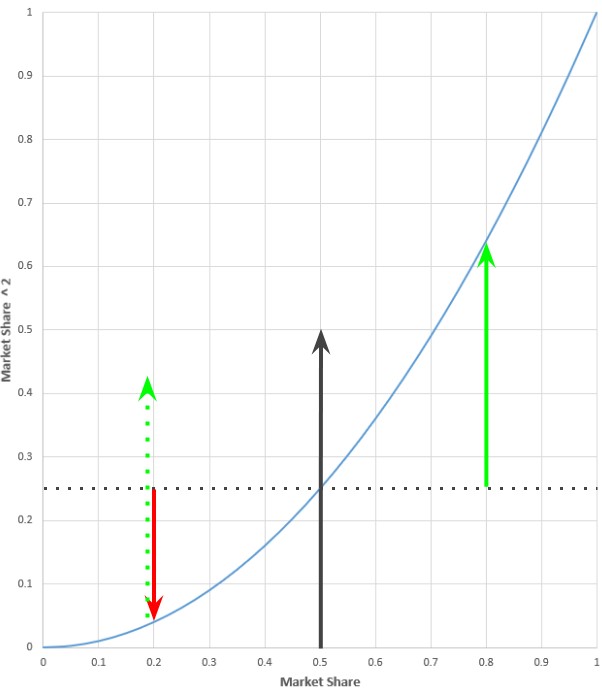
If the market share diverges for both firms, since the total market shares must sum to 100%, the divergence must be equal and opposite in polarity. In the graph above, the divergence is 30% for each firm, with the firms holding 20% and 80% in market shares respectively.
Squaring each market shares to calculate the HHI gives the observation that the squared market share of the larger firm (green arrow) yields a greater increase than the corresponding fall for the same of the smaller firm (red arrow). Placing the green arrow (dotted) next to the red arrow makes this difference even clearer.
This is the result of the property of a squared function, where for y = x2 , as x increases, the rate of increase in y gets higher. Therefore, for a given value of x, if 2 points diverge from it at equal distance, the increase in y for the case of positive divergence will always outweigh the fall in y for that of negative divergence.
Because no matter the number of firms in the market, the sum of decreased market shares must always be matched by a corresponding increased market shares, the following must then always be true for the same market:
HHI unequal market > HHI equal market
Happily, the same property of increasing rate of increase in y as x grows in the y = x2 also ensures that as the inequality of market shares grow, the sum of squared market shares of the larger firms will grow faster than the fall of squared market shares of the smaller firms. Which will mean that the HHI increases further with higher market share inequality.
Weakness Advantage 2: The HHI is not calculated on an arbitrary number of firms.
Instead, the HHI is calculated on the basis of the individual market shares of all firms in the market, or at last for an appropriately large enough number of firms, the commonly accepted upper limit being N = 50.
This approach ensures consistency to the measures of market concentration, as compared to the use of the n-firm concentration ratio, where even a “standardised” selection of n = 4 is not always able to capture important differences in market concentration distributions between markets.
This consistency allows the HHI to appropriately identify cases where even when the market has fewer firms, it may be more desirable nonetheless than in cases where the market has more firms, but with market shares highly concentrated with a few.
An example would be a case of comparing between a market with 4 equally sized firms, and with one having 20 firms, but with most of the market share concentrated with just 2 firms.
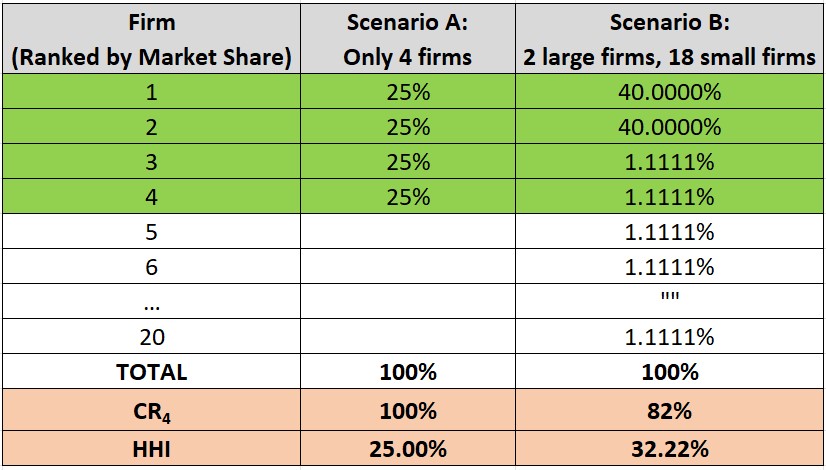
The latter case is arguably less desirable since it is practically a duopoly, and the HHI correctly assigns an appropriately higher value, as compared with the 4-firm concentration ratio.
Final Thoughts
Intriguingly, though the HHI is only slightly more complicated in computation, it isn’t commonly taught in the “IB” or “A level” syllabi.
I am not too hopeful that it will happen anytime soon, but nonetheless it is a good and concrete counter-proposal to consider using, when answering questions relating to the evaluation of the use of n-firm concentration ratio, in determining market concentration issues.
Learning more about the HHI is therefore recommended to Economics students.

