Compressibility factor of water
377 views
Skip to first unread message

Mostafa Abedi
Dec 2, 2021, 10:21:39 AM12/2/21
to Cantera Users' Group
Hi everybody,
I
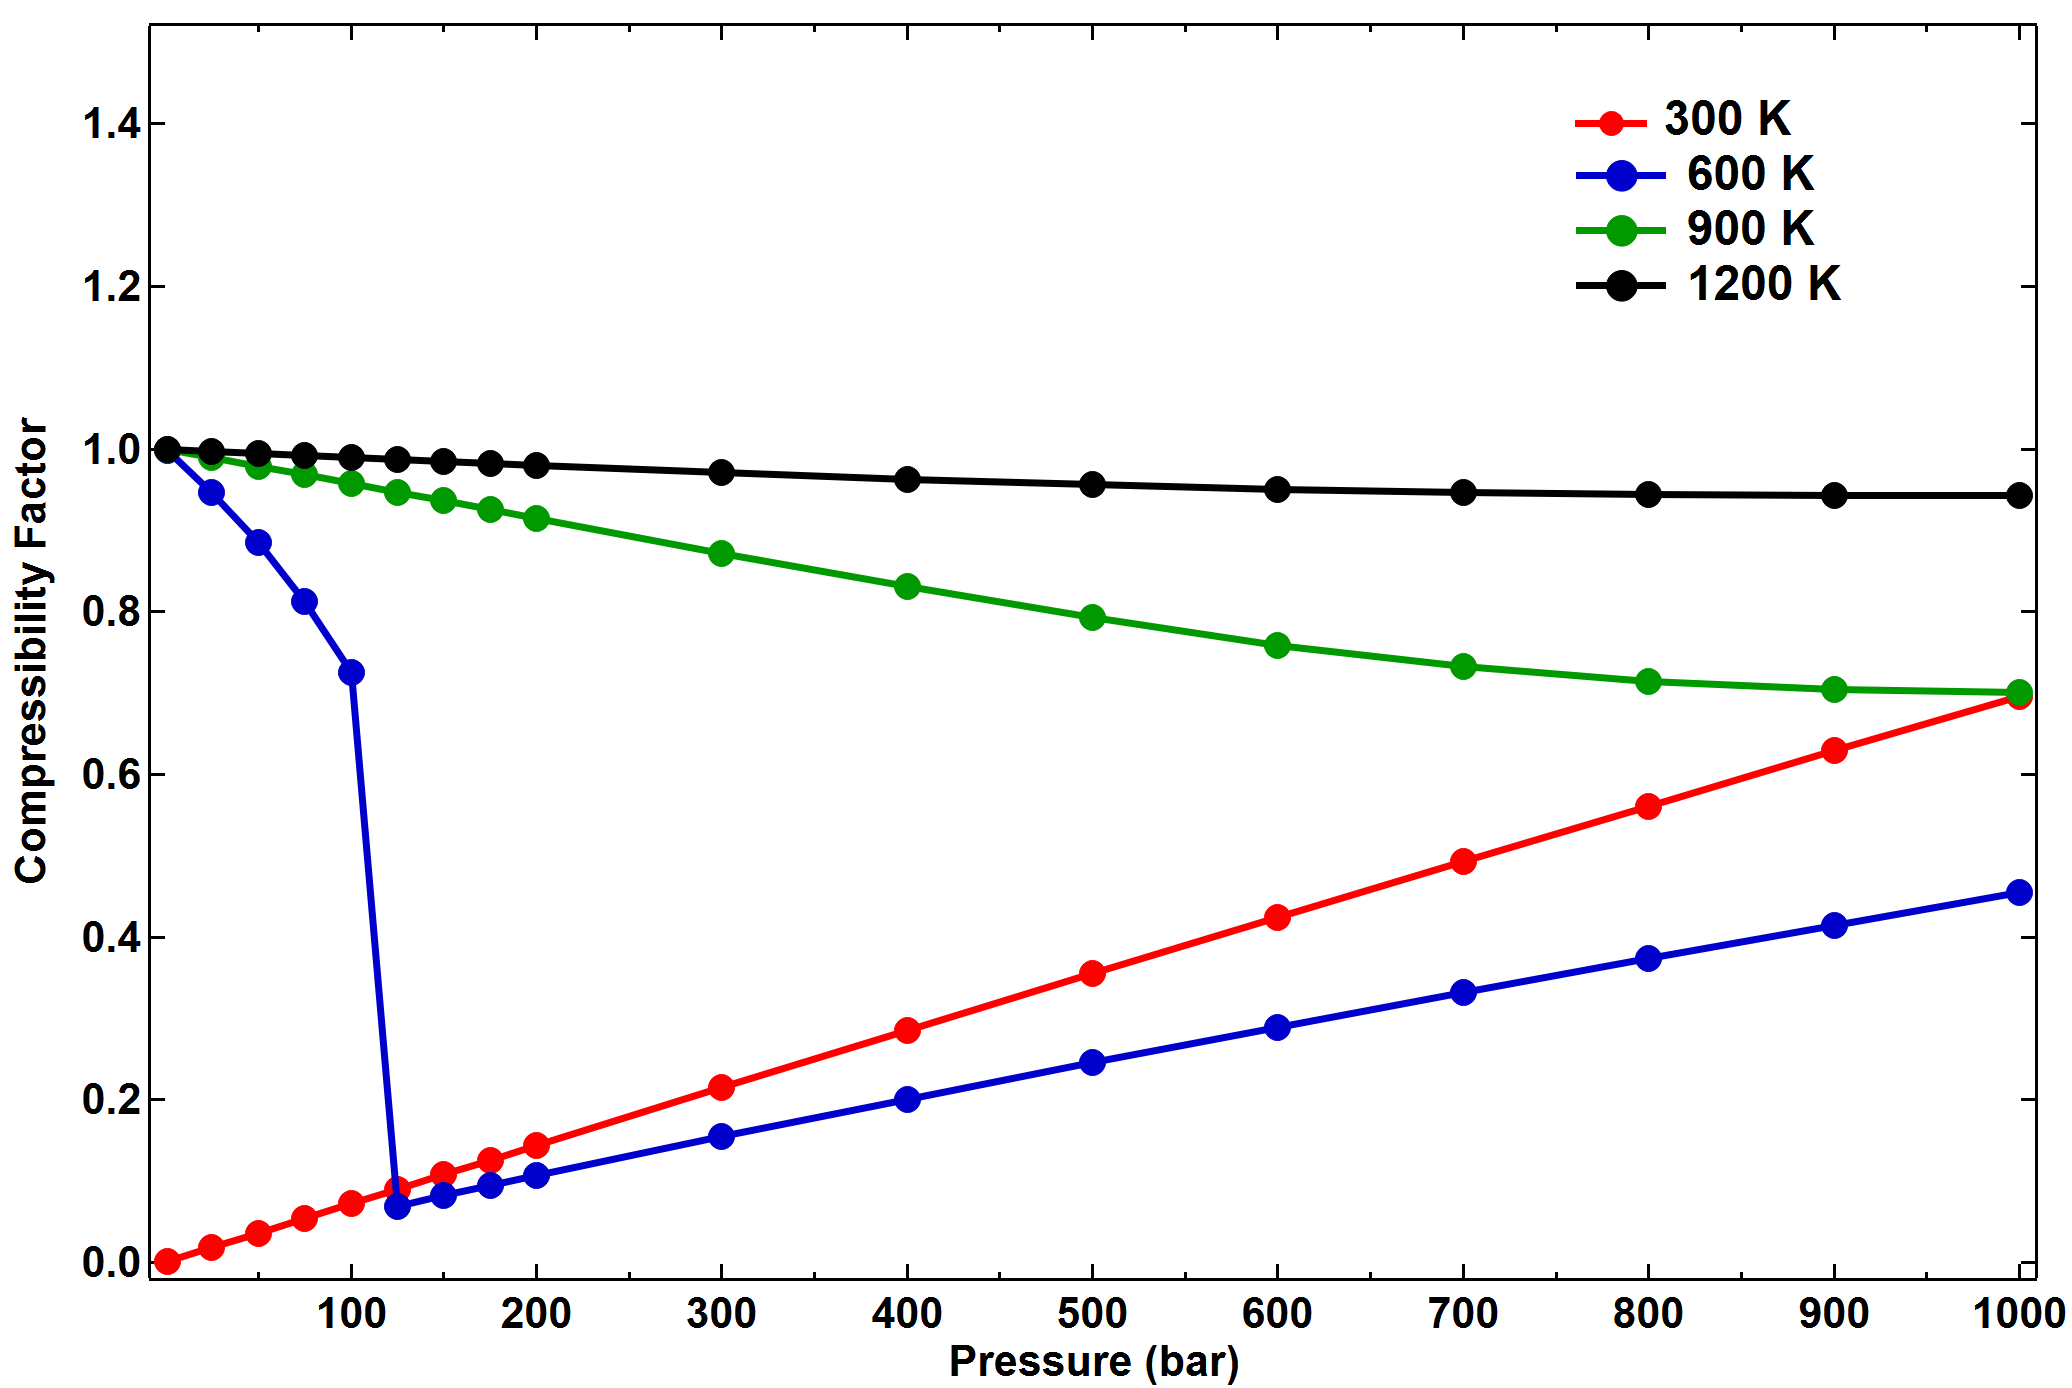
am trying to get some information about the compressibility factor of
water at different temperatures and pressures. The following is the plot
at temperatures of 300 K, 600 K, 900 K, and 1200 K, and pressures
ranging from 1 bar to 1000 bar. I am using Cantera 2.4.0 and Reynolds
backend. It seems, something is wrong with the 300 K (the red curve).
Should it be below the 600 K (blue curve)? I wonder if there are any
limits on the low temperature-high pressure conditions in the implementation. Any
suggestions or comments on this issue are greatly appreciated. Many
thanks.
Plot of Compressibility Factor of Water
Best,
Mostafa

Steven DeCaluwe
Dec 2, 2021, 10:34:03 AM12/2/21
to Cantera Users' Group
Dear Mostafa,
I will confess that I do not know the expected result, here - Is there a reason you would expect the compressibility of water at 300 K to be less than that at 600 K?
If one thinks rather loosely about the 2nd derivative of compressibility in 2D space (T & P), I can see how these trends are consistent.
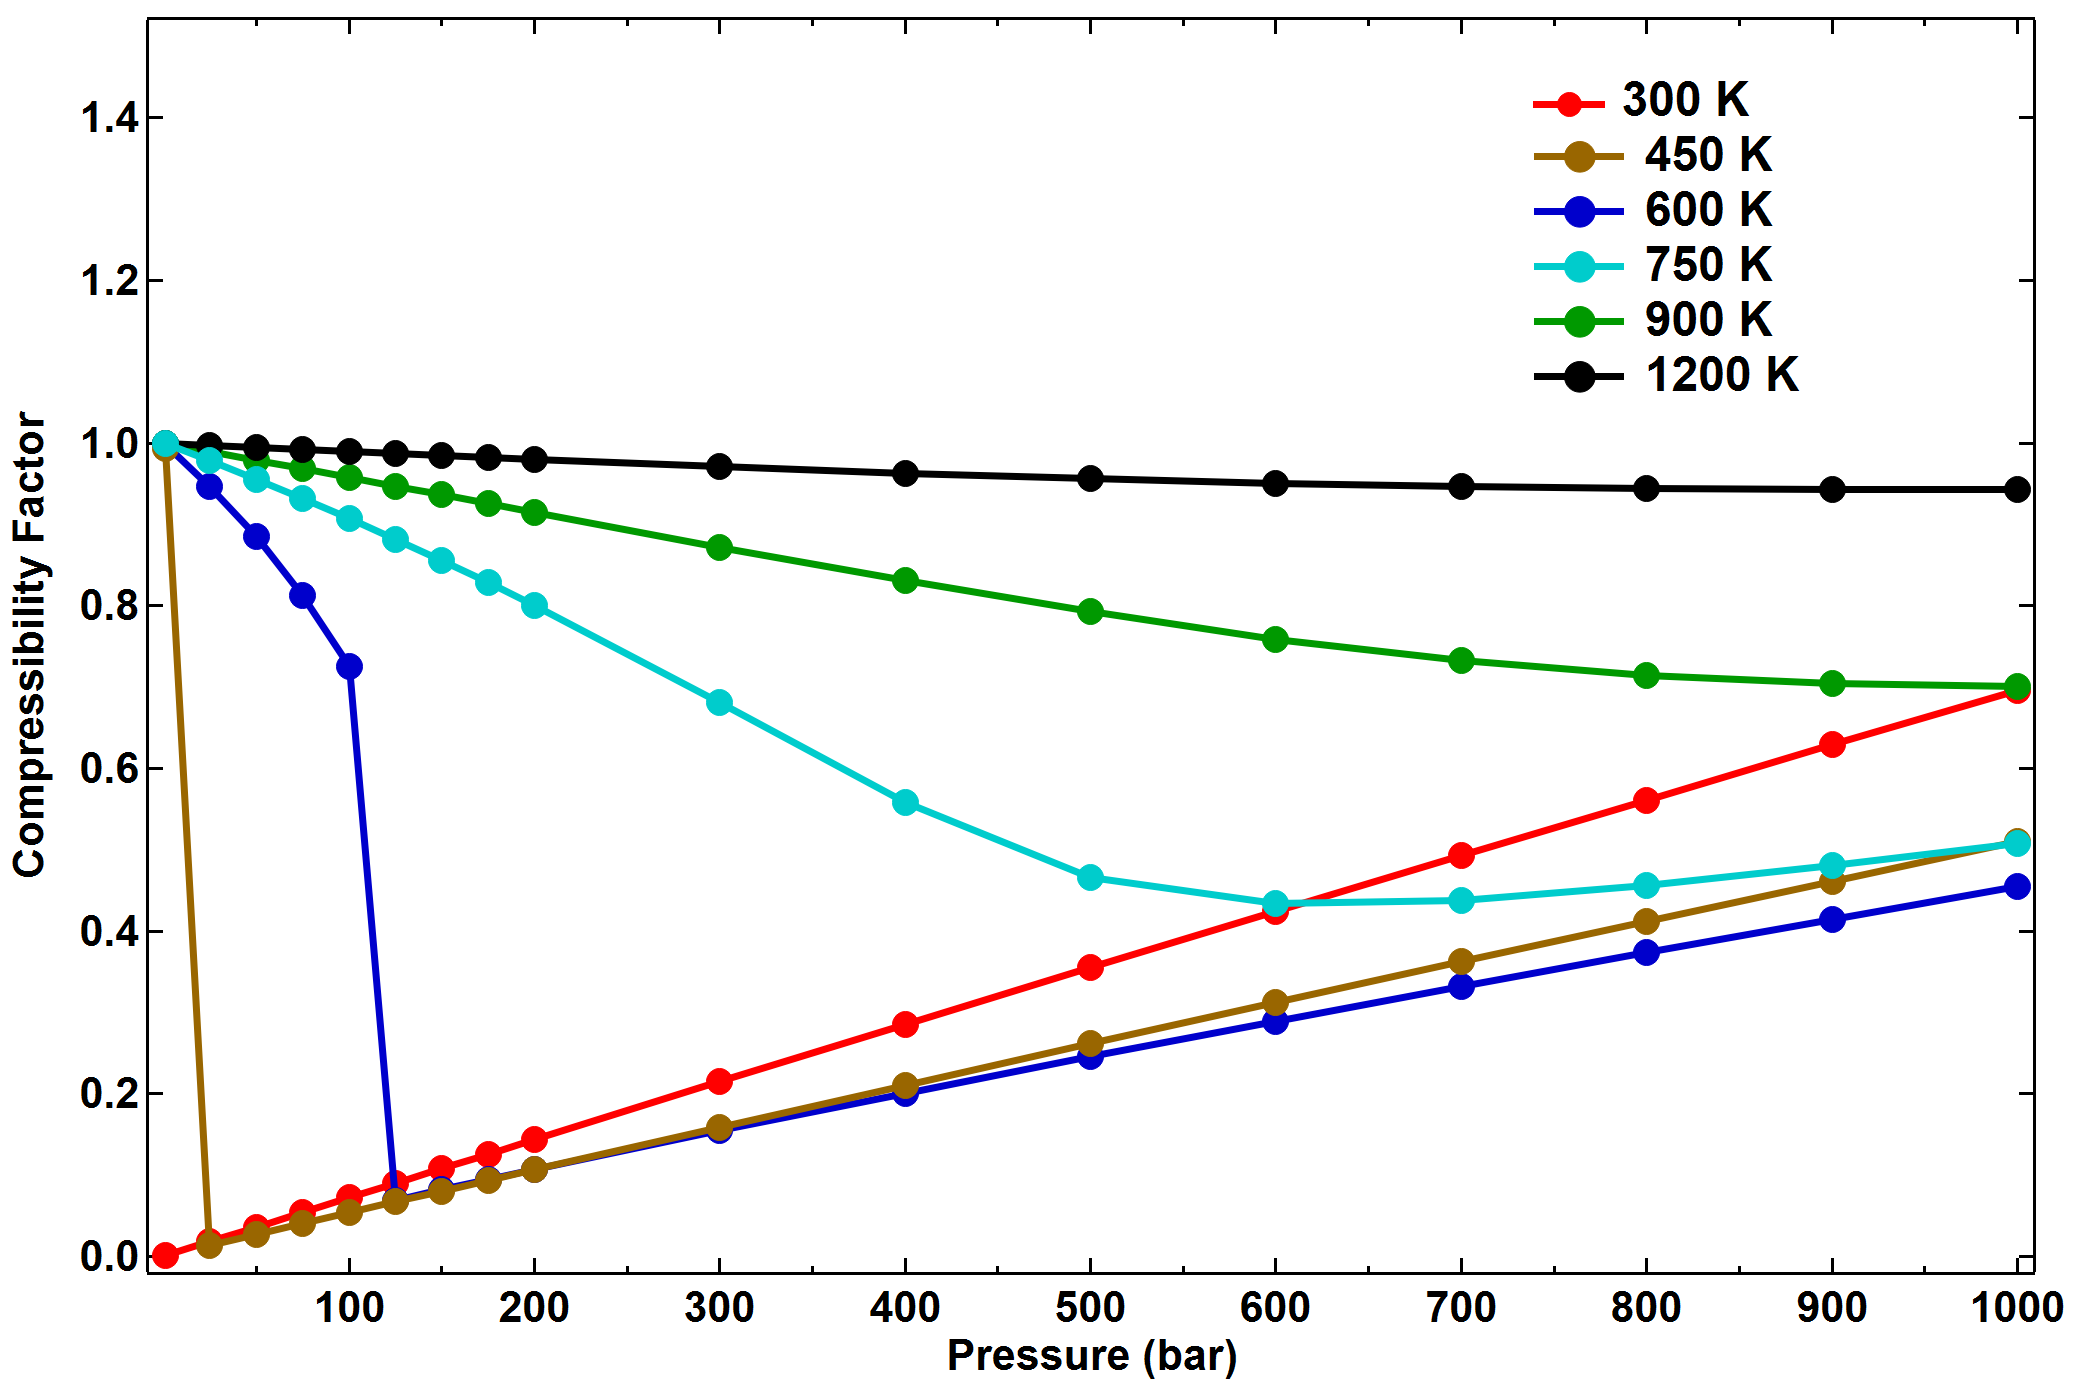
Can you add a couple more conditions above and below 600 K - maybe one at 750 and one at 450 K? That might shed more insight, here.
Best,
Steven
——————————————————
Steven C. DeCaluwe, Ph.D | Associate Professor of Mechanical Engineering
COLORADOSCHOOLOFMINES
Brown Building W410B
Golden, CO 80401
Phone: (303) 273-3666
Twitter: @CORESresearch
He / Him / His
<water_z.PNG>
Best,Mostafa
--
You received this message because you are subscribed to the Google Groups "Cantera Users' Group" group.
To unsubscribe from this group and stop receiving emails from it, send an email to cantera-user...@googlegroups.com.
To view this discussion on the web visit https://groups.google.com/d/msgid/cantera-users/77ce0a7c-b42f-4083-8332-8cc29474a1c1n%40googlegroups.com.
<water_z.PNG>
Mostafa Abedi
Dec 2, 2021, 11:07:46 AM12/2/21
to Cantera Users' Group
Dear
Steven,
Thank you
for your reply. The reason that I am saying that the 300 K should be
below the 600 K is just based on the observed trend: by decreasing the
temperature, a larger deviation
from ideal
should be seen particularly at high pressures. We observed such a behavior for methane.
As
you suggested, I added two more conditions to the plot. I think the
trend from 1200 K to 750 K perfectly makes sense, but for the lower temperatures,
especially 300 K, it does not.
Mostafa
S. DeCaluwe
Dec 2, 2021, 11:10:56 AM12/2/21
to Cantera Users' Group
Mostafa,
Thanks for reminding me to consider generalized compressibility. :)
If you look at a compressibilty chart that includes liquid phases (I'm not going to post one here b/c everything I'm finding is copyrighted, but google "generalized compressibilty of liquids"), you will see that this is indeed the expected behavior.
The idea that you depart further and further from Z = 1 with decreasing T is true for gases, but not liquids.
Best,
Steven

Shepherd, Joseph E.
Dec 2, 2021, 11:34:38 AM12/2/21
to canter...@googlegroups.com
Folks, This is a consequence of the implementation of the pure fluid equation of state routines, which return equilibrium properties of what are, in some cases, liquid-vapor mixture states. Here is a bit of Matlab code that explains the issue and how to get the correct vapor compressibility factors. The moral is: check your fluid state and know the phase diagram for your fluid. JES
%% Using Cantera pure fluid equation of state.
% The EOS is designed to return equilibrium mixture properties
%%
% Example: computing the compressibility of water
% Firstcreate fluid object - use Reynolds' EOS for water
fluid = Water;
%% set the initial state
P1 = oneatm;
T1 = 300;
set(fluid,'P',P1,'T',T1);
W = meanMolecularWeight(fluid);
R = gasconstant/W;
v1 = 1./density(fluid);
% check state of fluid
fluid
%% This is subcooled liquid! Why?
% The equation of state routine in Cantera for pure fluids is designed to
% return thermodynamic equilibrium properties. This means that the values
% are for the liquid state when T < Tc and P > P_sat(T). Tc = 647.3 K and
P_sat = satPressure(fluid,T1)
% P_sat = 3.5 kPa so Cantera returns the subcooled liquid volume for T = 300.
% The compressibility factor
Z = P1*v1/R/T1
% is 7.3E-4 which what you would anticipate for a liquid.
%% To get the compressibility of the vapor at this (T,P), you need to
% explicitly set the vapor phase to be 1.
set(fluid,'T',T1,'Vapor',1)
v = 1./density(fluid);
P = pressure(fluid);
% check the fluid state
fluid
% this is saturated vapor, which is what Cantera returns for this
% temperature and the compressibility factor is what you expect
v = 1./density(fluid);
fluid
Z = P*v/R/T1
%If we set the pressure to be less than the saturation value
P = 3E3;
set(fluid,'P',P,'T',T1)
v = 1./density(fluid);
% we get a pure gas state and a sensible value of Z.
fluid
Z = P*v/R/T1
-----Original Message-----
From: canter...@googlegroups.com <canter...@googlegroups.com> On Behalf Of Mostafa Abedi
Sent: Thursday, December 2, 2021 8:02 AM
To: Cantera Users' Group <canter...@googlegroups.com>
Subject: Re: [External] [cantera-users] Compressibility factor of water
Dear Steven,
Thank you for your reply. The reason that I am saying that the 300 K should be below the 600 K is just based on the observed trend: by decreasing the temperature, a larger deviation from ideal should be seen particularly at high pressures. We observed such a behavior for methane.
As you suggested, I added two more conditions to the plot. I think the trend from 1200 K to 750 K perfectly makes sense, but for the lower temperatures, especially 300 K, it does not.
<water_z.PNG>
--
You received this message because you are subscribed to the Google Groups "Cantera Users' Group" group.
To unsubscribe from this group and stop receiving emails from it, send an email to cantera-user...@googlegroups.com <mailto:cantera-user...@googlegroups.com> .
To view this discussion on the web visit https://groups.google.com/d/msgid/cantera-users/b5ea0dfb-fd50-4704-ba51-9f8bc66bf515n%40googlegroups.com <https://groups.google.com/d/msgid/cantera-users/b5ea0dfb-fd50-4704-ba51-9f8bc66bf515n%40googlegroups.com?utm_medium=email&utm_source=footer> .
%% Using Cantera pure fluid equation of state.
% The EOS is designed to return equilibrium mixture properties
%%
% Example: computing the compressibility of water
% Firstcreate fluid object - use Reynolds' EOS for water
fluid = Water;
%% set the initial state
P1 = oneatm;
T1 = 300;
set(fluid,'P',P1,'T',T1);
W = meanMolecularWeight(fluid);
R = gasconstant/W;
v1 = 1./density(fluid);
% check state of fluid
fluid
%% This is subcooled liquid! Why?
% The equation of state routine in Cantera for pure fluids is designed to
% return thermodynamic equilibrium properties. This means that the values
% are for the liquid state when T < Tc and P > P_sat(T). Tc = 647.3 K and
P_sat = satPressure(fluid,T1)
% P_sat = 3.5 kPa so Cantera returns the subcooled liquid volume for T = 300.
% The compressibility factor
Z = P1*v1/R/T1
% is 7.3E-4 which what you would anticipate for a liquid.
%% To get the compressibility of the vapor at this (T,P), you need to
% explicitly set the vapor phase to be 1.
set(fluid,'T',T1,'Vapor',1)
v = 1./density(fluid);
P = pressure(fluid);
% check the fluid state
fluid
% this is saturated vapor, which is what Cantera returns for this
% temperature and the compressibility factor is what you expect
v = 1./density(fluid);
fluid
Z = P*v/R/T1
%If we set the pressure to be less than the saturation value
P = 3E3;
set(fluid,'P',P,'T',T1)
v = 1./density(fluid);
% we get a pure gas state and a sensible value of Z.
fluid
Z = P*v/R/T1
-----Original Message-----
From: canter...@googlegroups.com <canter...@googlegroups.com> On Behalf Of Mostafa Abedi
Sent: Thursday, December 2, 2021 8:02 AM
To: Cantera Users' Group <canter...@googlegroups.com>
Subject: Re: [External] [cantera-users] Compressibility factor of water
Dear Steven,
Thank you for your reply. The reason that I am saying that the 300 K should be below the 600 K is just based on the observed trend: by decreasing the temperature, a larger deviation from ideal should be seen particularly at high pressures. We observed such a behavior for methane.
As you suggested, I added two more conditions to the plot. I think the trend from 1200 K to 750 K perfectly makes sense, but for the lower temperatures, especially 300 K, it does not.
Mostafa
On Thursday, December 2, 2021 at 10:34:03 AM UTC-5 S. DeCaluwe wrote:
Dear Mostafa,
I will confess that I do not know the expected result, here - Is there a reason you would expect the compressibility of water at 300 K to be less than that at 600 K?
If one thinks rather loosely about the 2nd derivative of compressibility in 2D space (T & P), I can see how these trends are consistent.
Can you add a couple more conditions above and below 600 K - maybe one at 750 and one at 450 K? That might shed more insight, here.
Best,
Steven
——————————————————
Steven C. DeCaluwe, Ph.D | Associate Professor of Mechanical Engineering
COLORADOSCHOOLOFMINES
Brown Building W410B
Golden, CO 80401
Email: deca...@mines.edu
Phone: (303) 273-3666 <tel:(303)%20273-3666>
On Thursday, December 2, 2021 at 10:34:03 AM UTC-5 S. DeCaluwe wrote:
Dear Mostafa,
I will confess that I do not know the expected result, here - Is there a reason you would expect the compressibility of water at 300 K to be less than that at 600 K?
If one thinks rather loosely about the 2nd derivative of compressibility in 2D space (T & P), I can see how these trends are consistent.
Can you add a couple more conditions above and below 600 K - maybe one at 750 and one at 450 K? That might shed more insight, here.
Best,
Steven
——————————————————
Steven C. DeCaluwe, Ph.D | Associate Professor of Mechanical Engineering
COLORADOSCHOOLOFMINES
Brown Building W410B
Golden, CO 80401
Email: deca...@mines.edu
Twitter: @CORESresearch
https://people.mines.edu/decaluwe/
https://cores-research.mines.edu
He / Him / His
On Dec 2, 2021, at 7:18 AM, Mostafa Abedi <mostaf...@brown.edu> wrote:
Hi everybody,
I am trying to get some information about the compressibility factor of water at different temperatures and pressures. The following is the plot at temperatures of 300 K, 600 K, 900 K, and 1200 K, and pressures ranging from 1 bar to 1000 bar. I am using Cantera 2.4.0 and Reynolds backend. It seems, something is wrong with the 300 K (the red curve). Should it be below the 600 K (blue curve)? I wonder if there are any limits on the low temperature-high pressure conditions in the implementation. Any suggestions or comments on this issue are greatly appreciated. Many thanks.
Plot of Compressibility Factor of Water
<water_z.PNG>
Best,
Mostafa
--
You received this message because you are subscribed to the Google Groups "Cantera Users' Group" group.
To unsubscribe from this group and stop receiving emails from it, send an email to cantera-user...@googlegroups.com.
To view this discussion on the web visit https://groups.google.com/d/msgid/cantera-users/77ce0a7c-b42f-4083-8332-8cc29474a1c1n%40googlegroups.com <https://nam04.safelinks.protection.outlook.com/?url=https%3A%2F%2Fgroups.google.com%2Fd%2Fmsgid%2Fcantera-users%2F77ce0a7c-b42f-4083-8332-8cc29474a1c1n%2540googlegroups.com%3Futm_medium%3Demail%26utm_source%3Dfooter&data=04%7C01%7Cdecaluwe%40mines.edu%7Cfddb752d8ed041ed6f3008d9b5a7708b%7C997209e009b346239a4d76afa44a675c%7C0%7C0%7C637740554202396020%7CUnknown%7CTWFpbGZsb3d8eyJWIjoiMC4wLjAwMDAiLCJQIjoiV2luMzIiLCJBTiI6Ik1haWwiLCJXVCI6Mn0%3D%7C3000&sdata=nmwpkT0WsSzXCsCgnj8NQhBGaCB5zxUeq5eRic%2B2h14%3D&reserved=0> .
https://people.mines.edu/decaluwe/
https://cores-research.mines.edu
He / Him / His
On Dec 2, 2021, at 7:18 AM, Mostafa Abedi <mostaf...@brown.edu> wrote:
Hi everybody,
I am trying to get some information about the compressibility factor of water at different temperatures and pressures. The following is the plot at temperatures of 300 K, 600 K, 900 K, and 1200 K, and pressures ranging from 1 bar to 1000 bar. I am using Cantera 2.4.0 and Reynolds backend. It seems, something is wrong with the 300 K (the red curve). Should it be below the 600 K (blue curve)? I wonder if there are any limits on the low temperature-high pressure conditions in the implementation. Any suggestions or comments on this issue are greatly appreciated. Many thanks.
Plot of Compressibility Factor of Water
<water_z.PNG>
Best,
Mostafa
--
You received this message because you are subscribed to the Google Groups "Cantera Users' Group" group.
To unsubscribe from this group and stop receiving emails from it, send an email to cantera-user...@googlegroups.com.
<water_z.PNG>
--
You received this message because you are subscribed to the Google Groups "Cantera Users' Group" group.
To view this discussion on the web visit https://groups.google.com/d/msgid/cantera-users/b5ea0dfb-fd50-4704-ba51-9f8bc66bf515n%40googlegroups.com <https://groups.google.com/d/msgid/cantera-users/b5ea0dfb-fd50-4704-ba51-9f8bc66bf515n%40googlegroups.com?utm_medium=email&utm_source=footer> .
Mostafa Abedi
Dec 2, 2021, 11:47:25 AM12/2/21
to Cantera Users' Group
Thank you
Steven
and Joseph for clarification of this. I now understand what's going on.
Mostafa
Reply all
Reply to author
Forward
0 new messages