

Misc
The Largest Copper Mines in the World by Capacity
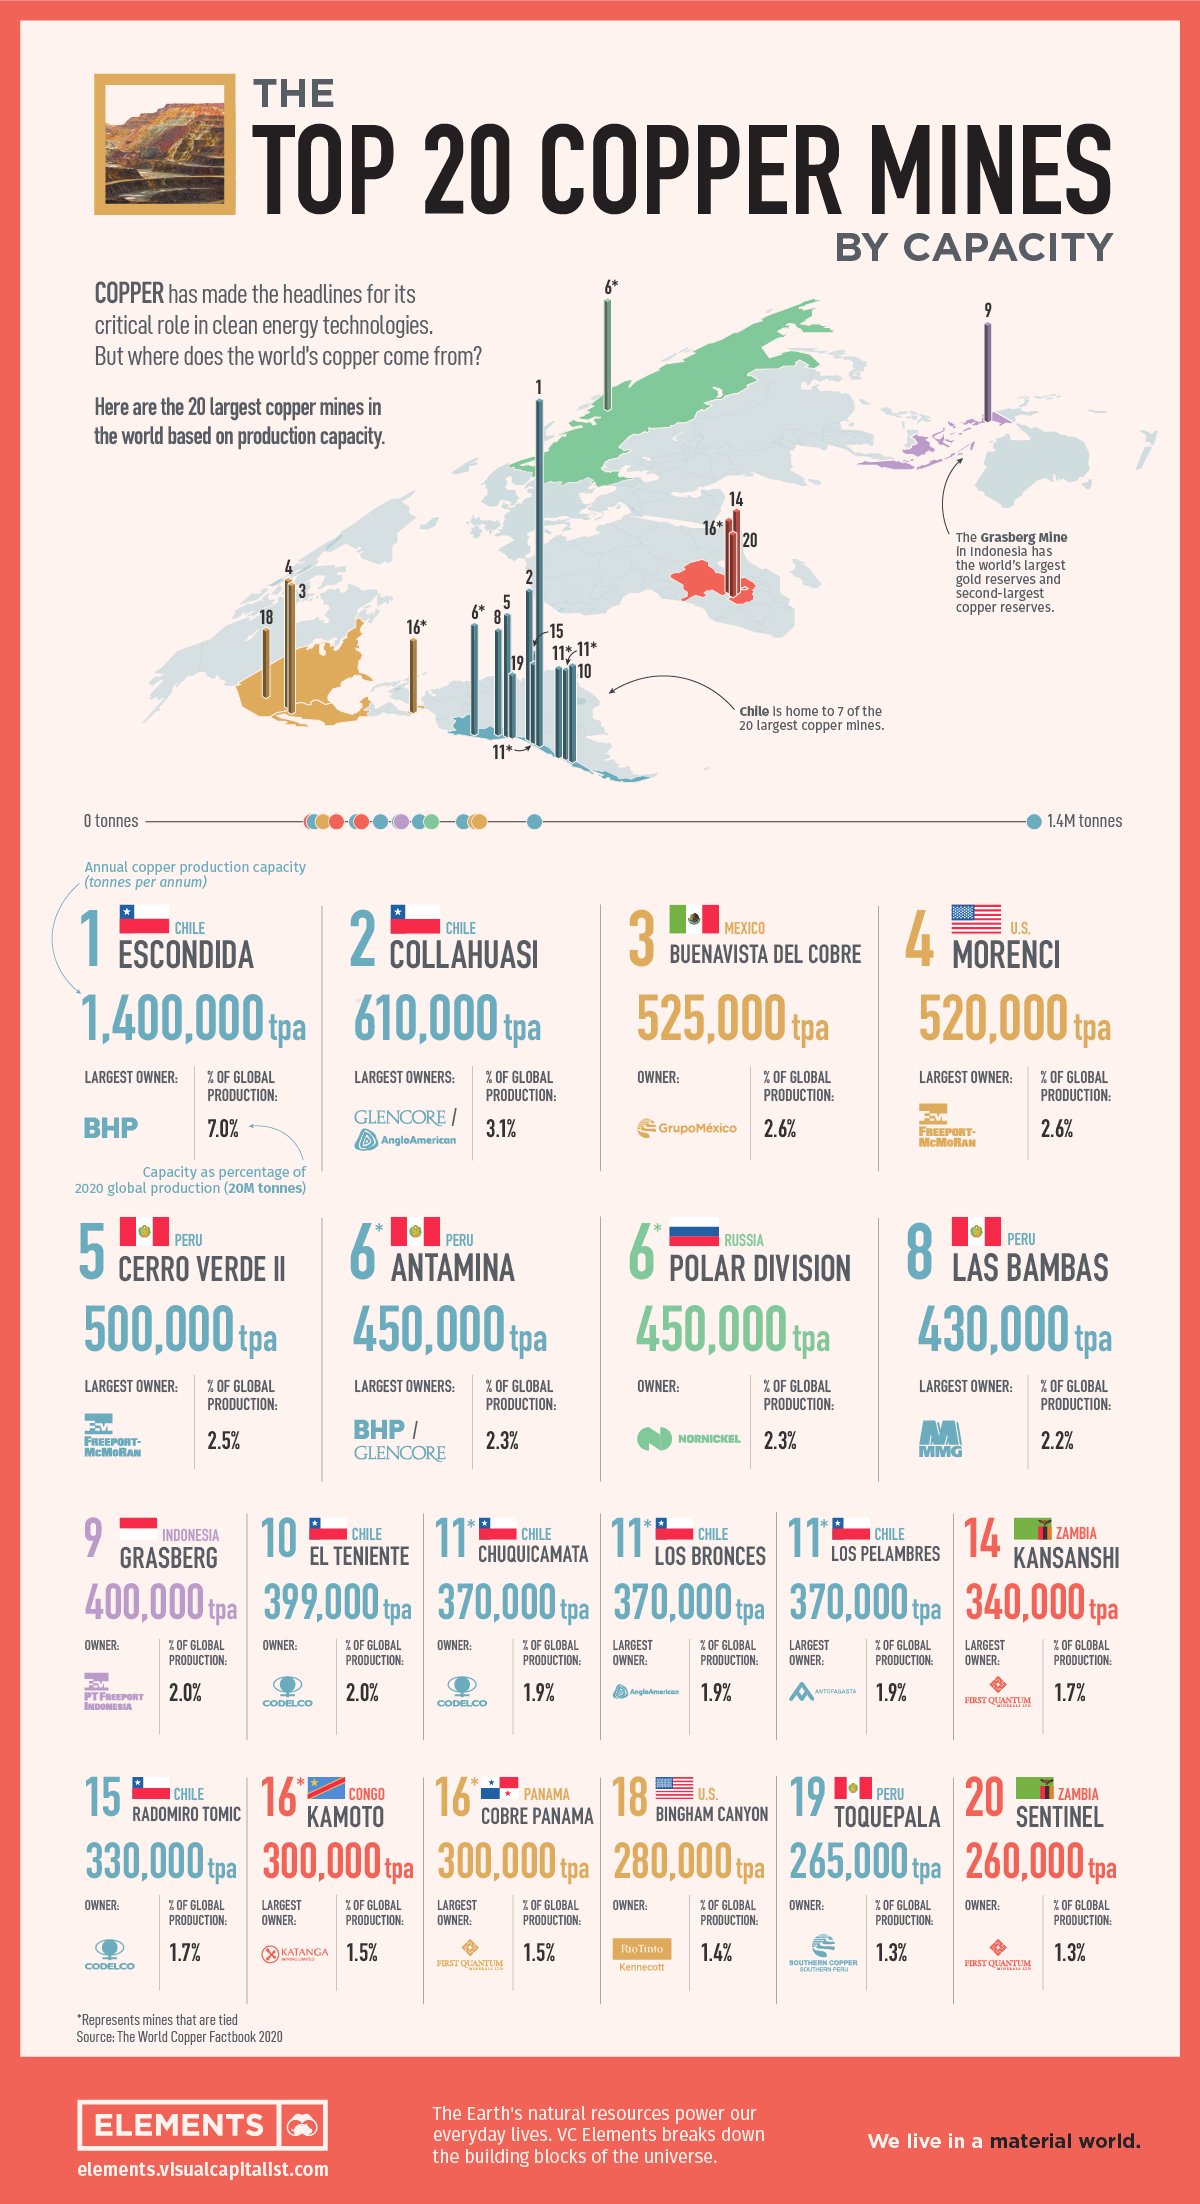
The Largest Copper Mines in the World
Copper is one of the most-used metals in the world, for good reason.
Global copper production has expanded with populations and economies, especially in China, which consumed 54% of the world’s refined copper in 2020. Copper’s demand comes from various industries, ranging from construction to renewable energy.
But before copper reaches its array of end-uses, miners have to extract and refine from deposits within the ground. So where are the world’s largest copper mines, and just how large are they?
Types of Copper Deposits
The location of mines ultimately depends on the occurrence and discovery of copper deposits. There are two main types of copper deposits:
- Porphyry deposits:
These are copper ore bodies formed from hydrothermal fluids from magma chambers that lie deep below the deposit. - Sediment-hosted deposits:
These deposits are formed when copper-bearing fluids mix with permeable sedimentary and volcanic rocks.
Copper is primarily sourced from porphyry deposits, which are concentrated in the Americas. Therefore, many of the world’s largest copper mines operate in this region.
Top 20 Copper Mines by Capacity
North, South, and Central America collectively host 15 of the 20 largest copper mines. These three regions combine the capacity for nearly 36% of global copper production in 2020.
| Rank | Mine | Country | Annual Production Capacity (tonnes) | Capacity as a % Global Production† |
|---|---|---|---|---|
| 1 | Escondida | Chile 🇨🇱 | 1,400,000 | 7.0% |
| 2 | Collahuasi | Chile 🇨🇱 | 610,000 | 3.1% |
| 3 | Buenavista del Cobre | Mexico 🇲🇽 | 525,000 | 2.6% |
| 4 | Morenci | U.S. 🇺🇸 | 520,000 | 2.6% |
| 5 | Cerro Verde II | Peru 🇵🇪 | 500,000 | 2.5% |
| 6* | Antamina | Peru 🇵🇪 | 450,000 | 2.3% |
| 6* | Polar Division | Russia 🇷🇺 | 450,000 | 2.3% |
| 8 | Las Bambas | Peru 🇵🇪 | 430,000 | 2.2% |
| 9 | Grasberg | Indonesia 🇮🇩 | 400,000 | 2.0% |
| 10 | El Teniente | Chile 🇨🇱 | 399,000 | 2.0% |
| 11* | Chuquicamata | Chile 🇨🇱 | 370,000 | 1.9% |
| 11* | Los Bronces | Chile 🇨🇱 | 370,000 | 1.9% |
| 11* | Los Pelambres | Chile 🇨🇱 | 370,000 | 1.9% |
| 14 | Kansanshi | Zambia 🇿🇲 | 340,000 | 1.7% |
| 15 | Radomiro Tomic | Chile 🇨🇱 | 330,000 | 1.7% |
| 16* | Kamoto | Congo 🇨🇩 | 300,000 | 1.5% |
| 16* | Cobre Panama | Panama 🇵🇦 | 300,000 | 1.5% |
| 18 | Bingham Canyon | U.S. 🇺🇸 | 280,000 | 1.4% |
| 19 | Toquepala | Peru 🇵🇪 | 265,000 | 1.3% |
| 20 | Sentinel | Zambia 🇿🇲 | 260,000 | 1.3% |
*Mines with equal capacities have the same rankings. †2020
The Escondida Mine in Chile is by far the world’s largest copper mine. Its annual capacity of 1.4 million tonnes means that it can produce more copper than the second and third-largest mines combined.
Porphyry copper deposits are often characterized by lower grade ores and are mined in open pits. As a result, some of the top copper mines are also among the world’s largest open pits. The Bingham Canyon Mine (seen below) in Utah, United States, is the deepest open pit with a depth of 1.2 km. It’s also the largest man-made excavation on Earth, spanning 4 km wide.
Chuquicamata and Escondida are the second and third-deepest open pits, respectively.
Indonesia’s Grasberg Mine is another notable name on this list. It produces both gold and copper on a massive scale and has the world’s largest known reserve of gold and the second-largest reserve of copper.
Overall, the top 20 mines have the capacity to produce nearly nine million tonnes of copper annually—representing 44% of global production in 2020. However, with demand for refined copper expected to rise 31% between 2020 and 2030, these existing sources of supply might not be enough.
Falling Grades, Rising Demand: New Mines on the Block?
According to the International Energy Agency, average copper ore grades in Chile have declined by 30% in the last 15 years. Since Chile’s mines produce more than one-fourth of the world’s copper, these falling ore grades could be a cause for concern—especially with a deficit looming over the market for refined copper.
New copper mining projects are becoming more valuable and it wouldn’t be surprising to see fresh names on the list of the largest copper mines. For example, the Kamoa-Kakula Mine, which started production in May 2021, is expected to churn out 800,000 tonnes of copper annually after expansion. That would make it the second-largest copper mine by capacity.


Misc
Brass Rods: The Sustainable Choice
Brass rods can help cut emissions in machine shops, be recycled without losing properties, and contribute to a cleaner environment.

Brass Rods: The Sustainable Choice
Brass rods have a powerful lineup of green attributes, making them the sustainable choice for manufacturers and end-users of precision machined and forged parts.
This infographic, from the Copper Development Association, shows how brass rods can reduce emissions in machine shops, be recycled without losing properties, and contribute to a cleaner environment.
The Brass Rod Circular Economy
The metallurgical properties of brass allow pre- and post-consumer sources of brass scrap to be recycled with no loss in properties.
Brass scrap can retain over 90% of the original material value. In addition, brass doesn’t need energy-intensive processing, unlike steel and aluminum, which must be smelted and refined before being recycled into new products.
As a result, there is a greater chance that steel and aluminum scrap will end up in landfills.
Most brass-rod alloys produced in North America contain 95% or higher recycled content.
Closed-loop recycling of brass keeps this valuable engineering material out of landfills, reducing the need for new mines and all the environmental impacts that entails.
Higher Machinability Leads to Lower Operational Carbon Emissions
Machinability is how easily a material can be worked using cutting processes. It directly impacts the amount of energy required to produce finished parts.
With typical machine shops producing millions of parts each year, the carbon impact can be significant.
Here’s how brass and steel compare when manufacturing complex parts using computer numerical control (CNC) machining.
| Material | Brass | Steel |
|---|---|---|
| Type | Free-cutting brass (C36000) | Free-cutting steel (12L14) |
| Maximum machinability rating (0-100) | 100 | 21 |
| Metal Removal Rate (cubic inches per minute) | 0.238 | 0.114 |
| Time to remove material (hours) | 161,111 | 336,111 |
| Energy required to produce parts (kilowatt-hour) | 9,475 | 18,931 |
In this example, using brass represented a savings of 3,510 kg in carbon dioxide (CO2).
The significantly longer tool life enabled by brass also reduces the need for new cutting tools, further decreasing emissions.
High recycled content and exceptional machinability make brass rods the sustainable choice for manufacturers and end-users seeking to reduce their environmental footprint and support the transition to a low-carbon future.
Explore the advantages of brass rod solutions.
Misc
Brass Rods: The Secure Choice
This graphic shows why brass rods are the secure choice for precision-machined and forged parts.

Brass Rods: The Secure Choice
The unique combination of machinability and recyclability makes brass rods the secure choice for manufacturers seeking future-proof raw material solutions.
This infographic, from the Copper Development Association, shows three ways brass rods give manufacturers greater control and a license to grow in the competitive market for precision-machined and forged products.
Future-Proof Investments in New Machine Tools
A material’s machinability directly impacts machine throughput, which typically has the largest impact on machine shop profitability.
The high-speed machining capabilities of brass rods maximize machine tool performance, allowing manufacturers to run the material faster and longer without sacrificing tool life, chip formation, or surface quality.
The high machining efficiency of brass leads to reduced per-part costs, quicker return on investment (ROI) for new machine tools, and expanded production capacity for new projects.
Supply Security Through Closed Loop Recycling
Brass, like its parent element copper, can be infinitely recycled.
In 2022, brass- and wire-rod mills accounted for the majority of the 830,000 tonnes of copper recycled from scrap in the U.S.
Given that scrap ratios for machined parts typically range from 60-70% by weight, producing mills benefit from a secure and steady supply of clean scrap returned directly from customers, which is recycled to create new brass rods.
The high residual value of brass scrap creates a strong recycling incentive. Scrap buy back programs give manufacturers greater control over raw material net costs as scrap value is often factored into supplier purchase agreements.
Next Generation Alloys for a Lead-Free Future
Increasingly stringent global regulations continue to pressure manufacturers to minimize the use of materials containing trace amounts of lead and other harmful impurities.
The latest generation of brass-rod alloys is engineered to meet the most demanding criteria for lead leaching in drinking water and other sensitive applications.
Seven brass-rod alloys passed rigorous testing to become the only ‘Acceptable Materials’ against lower lead leaching criteria recently adopted in the national U.S. drinking water quality standard, NSF 61.
Learn more about the advantages of brass rods solutions.

-

 Electrification3 years ago
Ranked: The Top 10 EV Battery Manufacturers
-

 Electrification2 years ago
The Key Minerals in an EV Battery
-

 Real Assets3 years ago
The World’s Top 10 Gold Mining Companies
-

 Misc3 years ago
All the Metals We Mined in One Visualization
-

 Energy Shift2 years ago
What Are the Five Major Types of Renewable Energy?
-

 Electrification2 years ago
Mapped: Solar Power by Country in 2021
-

 Electrification2 years ago
The World’s Largest Nickel Mining Companies
-

 Electrification3 years ago
How Much Land is Needed to Power the U.S. with Solar?