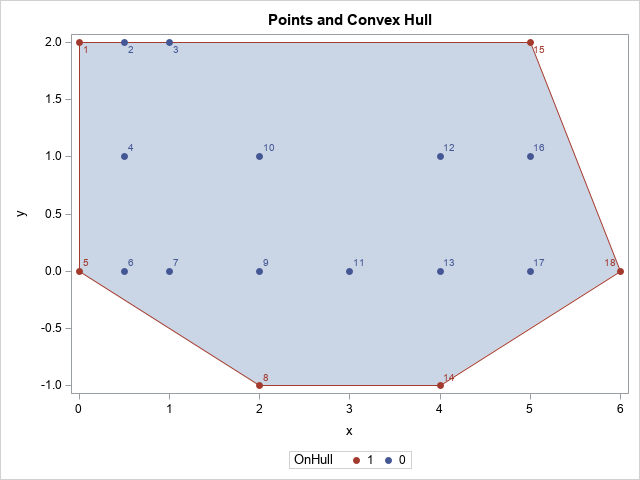
Given a cloud of points in the plane, it can be useful to identify the convex hull of the points. The convex hull is the smallest convex set that contains the observations. For a finite set of points, it is a convex polygon that has some of the points as its vertices. An example of a convex hull is shown to the right. The convex hull is the polygon that encloses the points.
This article describes the CVEXHULL function in the SAS/IML language, which computes the convex hull for a set of planar points.
How to compute a 2-D convex hull in SAS
The CVEXHULL function takes a N x 2 data matrix. Each row of the matrix is the (x,y) coordinates for a point. The CVEXHULL function returns a column vector of length N.
- The first few elements are positive integers. They represent the rows of the data matrix that form the convex hull.
- The positive integers are sorted so that you can visualize the convex hull by connecting the points in order.
- The remaining elements are negative integers. The absolute values of these integers represent the rows of the data matrix that are contained in the convex hull or are on the boundary of the convex hull but are not vertices.
The following example comes from the SAS/IML documentation. The data matrix contains 18 points. Of those, six are the vertices of the convex hull. The output of the CVEXHULL function is shown below:
proc iml; points = {0 2, 0.5 2, 1 2, 0.5 1, 0 0, 0.5 0, 1 0, 2 -1, 2 0, 2 1, 3 0, 4 1, 4 0, 4 -1, 5 2, 5 1, 5 0, 6 0 }; /* Find the convex hull: - indices on the convex hull are positive - the indices for the convex hull are listed first, in sequential order - interior indices are negative */ Indices = cvexhull( points ); reset wide; print (Indices`)[L="Indices"]; |

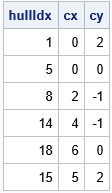
I have highlighted the first six elements. The indices tell you that the convex hull is formed by using the 1st, 5th, 8th, 14th, 18th, and 15th points of the data matrix. You can use the LOC statement to find the positive values in the Indices vector. You can use those values to extract the points on the convex hull, as follows:
hullIdx = indices[loc(indices>0)]; /* the positive indices */ convexHull = points[hullIdx, ]; /* extract rows */ print hullIdx convexHull[c={'cx' 'cy'} L=""]; |

The output shows that the convex hull is formed by the six points (0,2), (0,0), ..., (5,2).
Visualize the convex hull
The graph at the beginning of this article shows the convex hull as a shaded polygon. The original points are overlaid on the polygon and labeled by the observation number. The six points that form the convex hull are colored red. This section shows how to create the graph.
The graph uses the POLYGON statement to visualize the convex hull. This enables you to shade the interior of the convex hull. If you do not need the shading, you could use a SERIES statement, but to get a closed polygon you would need to add the first point to the end of the list of vertices.
To create the graph, you must write the relevant information to a SAS data set so that you can use PROC SGPLOT to create the graph. The following statements write the (x,y) coordinates of the point, the observation numbers (for the data labels), the coordinates of the convex hull vertices (cx, cy), and an ID variable, which is required to use the POLYGON statement. It also creates a binary indicator variable that is used to color-code the markers in the scatter plot:
x = points[,1]; y = points[,2]; obsNum = t(1:nrow(points)); /* optional: use observation numbers for labels */ /* The points on the convex hull are sorted in counterclockwise order. If you use a series plot, you must repeat the first point so that the polygon is closed. For example, use convexHull = convexHull // convexHull[1,]; */ cx = convexHull[,1]; cy = convexHull[,2]; ID = j(nrow(cx),1,1); /* create ID variable for POLYGON statement */ /* create a binary (0/1) indicator variable */ OnHull = j(nrow(x), 1, 0); /* most points NOT vertices of the convex hull */ OnHull[hullIdx] = 1; /* these points are the vertices */ create CHull var {'x' 'y' 'cx' 'cy' 'ID' 'obsNum' 'OnHull'}; append; close; QUIT; |
In the graph at the top of this article, vertices of the convex hull are colored red and the other points are blue. When you use the GROUP= option in PROC SGPLOT statements, the group colors might depend on the order of the observations in the data. To ensure that the colors are consistent regardless of the order of the data set, you can use a discrete attribute map to associate colors and values of the grouping variable. For details about using a discrete attribute maps, see Kuhfeld's 2016 article.
To use a discrete attribute map, you need to define it in a SAS data set, read it by using the DATTRMAP= option on the PROC SGPLOT statement, and specify it by using the ATTRID= statement on the SCATTER statement, as follows:
data DAttrs; /* use DATTRMAP=<data set name> */ length MarkerStyleElement $11.; ID = "HullAttr"; /* use ATTRID=<ID value> */ Value = 0; MarkerStyleElement = "GraphData1"; output; /* 0 ==> 1st color */ Value = 1; MarkerStyleElement = "GraphData2"; output; /* 1 ==> 2nd color */ run; title "Points and Convex Hull"; proc sgplot data=CHull DATTRMAP=DAttrs; polygon x=cx y=cy ID=ID / fill outline lineattrs=GraphData2; scatter x=x y=y / datalabel=obsNum group=OnHull markerattrs=(symbol=CircleFilled) ATTRID=HullAttr; run; |
The graph is shown at the top of this article. Notice that the points (0.5, 2) and (1, 2) are on the boundary of the convex hull, but they are drawn in blue because they are not vertices of the polygon.
Summary
In summary, you can compute a 2-D convex hull by using the CVEXHULL function in SAS/IML software. The output is a set of indices, which you can use to extract the vertices of the convex hull and to color-code markers in a scatter plot.
By the way, there is a hidden message in the graph of the convex hull. Can you see it? It has been hiding in the SAS/IML documentation for more than 20 years.
In closing, I'll mention that a 2-D convex hull is one computation in the general field of computational geometry. The SAS/IML group is working to add additional functionality to the language, including convex hulls in higher dimensions. In your work, do you have specific needs for results in computational geometry? If so, let me know the details in the comments.

10 Comments
Hi Rick, I have found the secret message! Regarding additional functionality, how about a function that returns a vector of convex hull peeling depths for a set of points? It can have applications in robust statistics as Wikipedia explains with a nice graphic here:
https://en.wikipedia.org/wiki/Convex_layers
Yes, thanks for the suggestion. Researchers have used convex hulls for robust and nonparametric methods to detect multivariate outliers.
Dear Rick,
Congratulations for this beautiful post.
May I ask you if you have some references on how to find the largest convex polygon given a set of points?
Your question does not make sense. The convex hull is the SMALLEST (=least volume) convex polygon that contains the points. It is unique. There is no "largest" convex polygon that contains the point.
Pingback: The order of vertices on a convex polygon - The DO Loop
Pingback: The expected number of points on a convex hull - The DO Loop
Hi,
Is it possible to draw more than one Convex hull in the same plot,
if the hulls should mark or highlight different groups ?
Yes. In the example, I set ID=1 for the vertices of the convex hull. You can create additional observations in the CHULL data set with ID=2, ID=3, etc. The POLYGON statement will plot one polygon for each unique value of the ID variable. If you need more help, post a question to the SAS Support Communities.
Given points of datra set A are used to construct a convex hull H(A).
Is it possible to determine , whether points of another data set B,
lie inside or outside H(A) ?
Sure. That's called the point-in-polygon problem. There are several ways to solve the problem in SAS. PROC GINSIDE is part of SAS/GRAPH. In SAS/IML, the Polygon package contains the PolyPtInside function, which enables you to determine which points are inside a polygon. See the example on p. 3 of the documentation for the Polygon package.